offshore wind - cmanc · 12 boem graphical representation of a floating wind project not...
TRANSCRIPT

Offshore Wind: Consideration for CMANC Stakeholders January 10, 2019 Todd Mitchell

www.fugro.com 2 Source: www.equinor.com

www.fugro.com 3
Typical Offshore Wind Farm Life Cycle
Planning and Analysis Site Assessment Operations and
Maintenance
5? Years 1 Year 2 Years 2 Years 25 Years
Leasing Construction Operations and Maintenance Decommissioning Planning and
Analysis
Metocean (resource) observations Environmental
Assessments Protected
Species Site
Assessment Plan
Geophysical/ geotechnical Investigation Archaeologic
Clearance Foundation
Design Cable Risk
Study Construction
Operations Plan
Offshore Wind Master Plans Desktop
Studies Permitting
Importation Manufacture Transportation Cable
Installation Shoreside
infrastructure
Maintenance Monitoring Environmental
Monitoring

www.fugro.com 4
US East Coast OWF Developments
Lease developments underway from Massachusetts to North Carolina:
MA = >4,800 MW
NY = 2,400 MW
NJ = 3,500 MW
RI = 400 MW
CT = 200 MW
MD = 390 MW
VA = 12 MW
NC = 1,500 MW

www.fugro.com 5
Projects Moving Forward (East Coast) Location/State Project Name Developer
Maryland Skipjack Ørsted
Maryland Maryland Offshore Wind US Wind
Massachusetts Bay State Wind Ørsted & Eversource
Massachusetts Block Island Ørsted
Massachusetts Vineyard Wind Vineyard Wind (Copenhagen Infrastructure Partners & Avangrid)
New Jersey Ocean Wind Ørsted
New Jersey Atlantic Shores Offshore Wind Atlantic Shores Offshore Wind (EDF Renewables & Shell New Energies)
New York South Fork Wind Farm Deepwater Wind
New York Empire Wind Equinor
Rhode Island & Connecticut Revolution Wind Ørsted
Virginia Coastal Virginia Offshore Wind Ørsted & Dominion Energy

www.fugro.com 6
Projects Leased but Not Started (East Coast)
Location/State Project Name Developer
North Carolina Kitty Hawk Copenhagen Infrastructure Partners & Avangrid
Massachusetts TBD Equinor
Massachusetts TBD Mayflower (Shell)
Massachusetts TBD Vineyard Wind

www.fugro.com 7
2020-2023+ US East Coast (Expected Operational Year)
2020 1. Vineyard Wind (MA)
2021 2. Ørsted BSW (MA) 3. Ørsted (DWW) SFWF (NY) 4. EDF/US Wind MD (MD)
2022 5. Ørsted (DWW) Skipjack (MD)
2023 6. Ørsted (DWW) Revolution
Wind (RI & CT) 7. Equinor Empire Wind (NY) 8. Ørsted Ocean Wind (NJ)
2023+ 1. Avangrid Kitty Hawk (NC) 2. US Wind New Jersey
(NJ) 3. Ørsted DWW Garden
State Offshore Energy (NJ)
4. Dominion Energy Coastal Virginia (VA)
5. Equinor 520(MA) 6. Mayflower Wind 521
(Shell) (MA) 7. Vineyard Wind 522 (MA) 8. NY Bight Area (NY) 9. NY Bight Area (NY)
10. NY Bight Area (NY) 11. NY Bight Area (NY) 12. Wilmington West(NC) 13. Wilmington East (NC) 14. Grand Strand (SC) 15. Winyah (SC) 16. Cape Romain (SC) 17. Charleston (SC)
18. CALIFORNIA!!!
3 potential areas

www.fugro.com 8
East Coast Lessons Learned
Local infrastructure: Need to develop port facilities for
import & assembly Need to train workforce Need to import vessels (or construct
them) If domestic manufacture,
logistics/infrastructure for transportation
Construction Conditions Weather Boulder fields & scour Marine protected species Wrenches left in the turbine (whoops)

www.fugro.com 9
2020-2023 US West Coast
CA = Renewables: 50%(2026), 60%(2030), 100%(2045) Currently 32% from renewables
Onshore Wind Hydro Solar
BOEM soliciting call for lease area nominations & information now
HI = 100% Renewable Energy by 2045
OR = Failed Coos Bay OWF by Principle Power
WA = Lower Wind Speeds / No Interest Currently

www.fugro.com 10
Fixed Floating In less then 180’ water depth Full survey Stakeholders Cost competitive 30 MW USA, US Department of
Energy predicts 22 GW by 2030 15 GW EU, 25 GW by 2020
Greater than 180’ water depth Geotechnical component smaller Differences view 15/20 miles & fisheries Costly (pre-commercial stage) 30 MW demonstration complete (Hywind
Scotland)

www.fugro.com 11
Floating future
USA capacity 58% > 60 meters Europe & Global capacity 80% > 60 meters Potential floating EU estimated at 4000 GW Hywind Demonstration project: Scotland 30 MW / 5 turbines at 300’ to 400’ water depth Powering 20,000 households
Cost reduced by 60-70% since first pilot Further cost reduction of 40 – 50% expected 9 floating projects planned for 2021-2023 (338 MW)

www.fugro.com 12
BOEM Graphical Representation of a Floating Wind Project
Not represented here is the considerations for import/fabrication, construction/assembly, transportation, maintenance facilities.
Not to scale – typical expectation is for project to be >25 NM from shore. Cable catenaries between turbines, sub-station and to shore will be significant considerations.

www.fugro.com 13
Potential Anchoring Methods

www.fugro.com 14
California Drivers
August, California passed bill SB100 for 100% carbon-free electricity
No existing renewable energy source in California can meet “duck curve” demand
Federal, state, municipal, and private sectors involved
Federal agencies already investigating & de-risking sites
Large-scale projects possible using existing shore-side grid connections available (Morro Bay, SONGS, Diablo, & Redwood City)

www.fugro.com 15
California Challenges
Stakeholder engagement
Navy & NOAA restricted areas
Potential for impacts on commercial fishing
Extraordinary water depth (~1500’ to ~3000’)
Shipping traffic (near Channel Islands/SONGS)
Port facilities need upgrading to support wind turbines
Hywind: Turbine size 803’ total height!)
Dry dock size, water depth, quayside, cranes, etc.
Supply chain scaling up / installation vessel
www.fugro.com 16
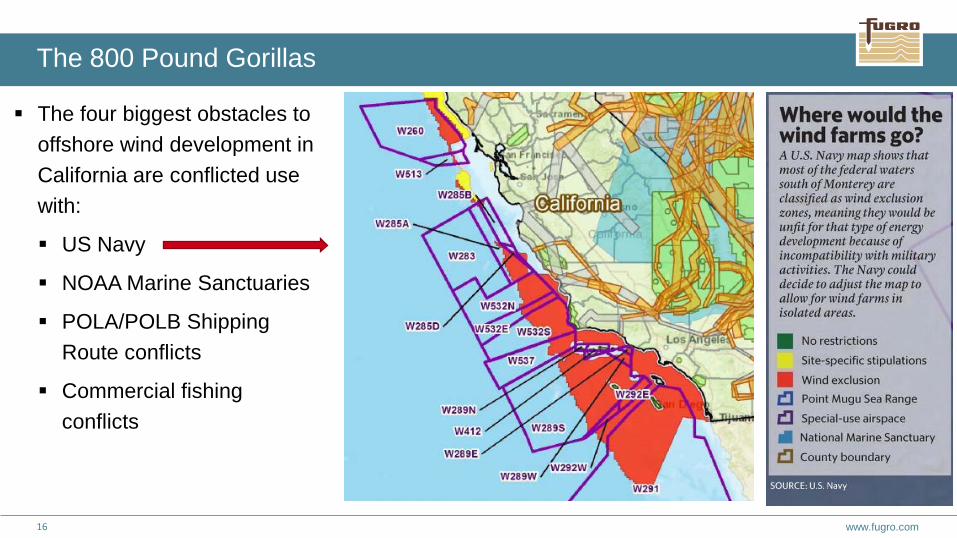
The 800 Pound Gorillas
The four biggest obstacles to offshore wind development in California are conflicted use with:
US Navy
NOAA Marine Sanctuaries
POLA/POLB Shipping Route conflicts
Commercial fishing conflicts

www.fugro.com 17
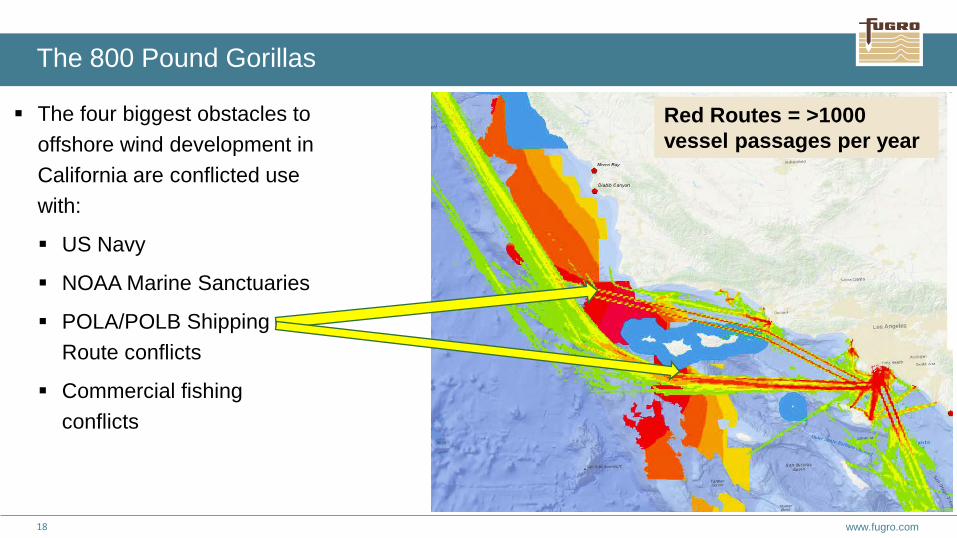
The 800 Pound Gorillas
The four biggest obstacles to offshore wind development in California are conflicted use with:
US Navy
NOAA Marine Sanctuaries
POLA/POLB Shipping Route conflicts
Commercial fishing conflicts
www.fugro.com 18
The 800 Pound Gorillas
The four biggest obstacles to offshore wind development in California are conflicted use with:
US Navy
NOAA Marine Sanctuaries
POLA/POLB Shipping Route conflicts
Commercial fishing conflicts
Red Routes = >1000 vessel passages per year

www.fugro.com 19
The 800 Pound Gorillas
The four biggest obstacles to offshore wind development in California are conflicted use with:
US Navy
NOAA Marine Sanctuaries
POLA/POLB Shipping Route conflicts
Commercial fishing conflicts
Dark Green Boxes Represent $15k to $70k value per square km
www.fugro.com 20
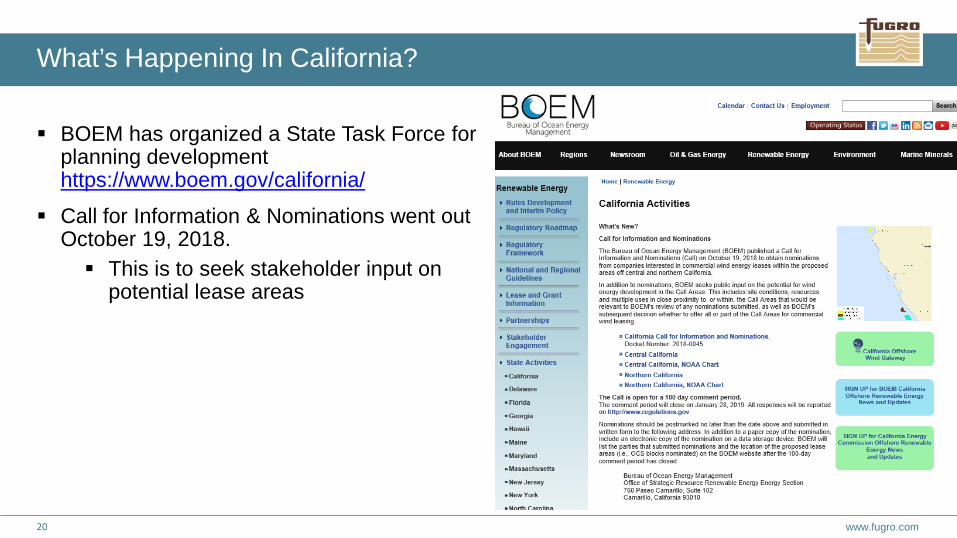
What’s Happening In California?
BOEM has organized a State Task Force for planning development https://www.boem.gov/california/
Call for Information & Nominations went out October 19, 2018. This is to seek stakeholder input on
potential lease areas

www.fugro.com 21
What’s Happening In California?
BOEM has organized a State Task Force for planning development https://www.boem.gov/california/
Call for Information & Nominations went out October 19, 2018. This is to seek stakeholder input on
potential lease areas
OPEN COMMENT PERIOD NOW! Until January 28 https://www.regulations.gov/ Search: BOEM-2018-0045
www.fugro.com 22
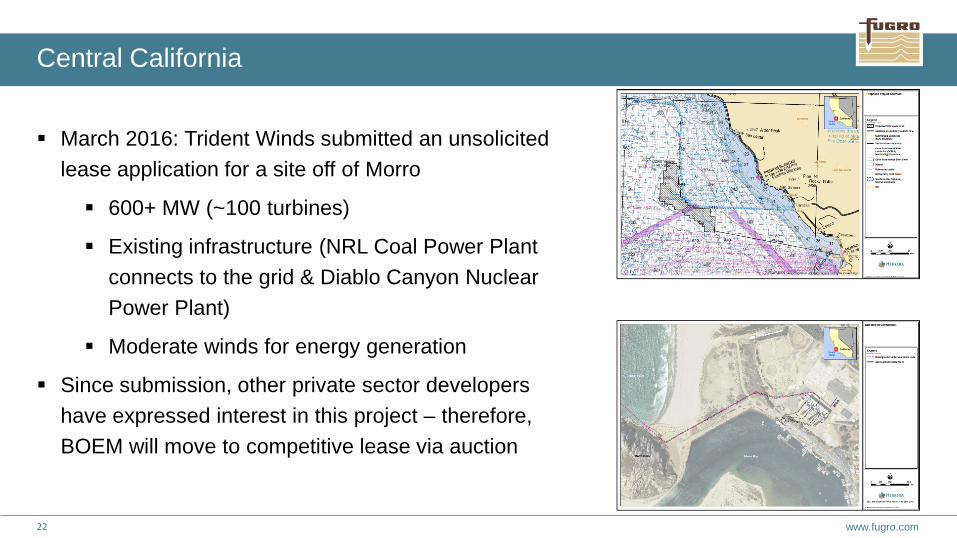
Central California
March 2016: Trident Winds submitted an unsolicited lease application for a site off of Morro
600+ MW (~100 turbines)
Existing infrastructure (NRL Coal Power Plant connects to the grid & Diablo Canyon Nuclear Power Plant)
Moderate winds for energy generation
Since submission, other private sector developers have expressed interest in this project – therefore, BOEM will move to competitive lease via auction

www.fugro.com 23
Northern California
2018: Redwood Coast Energy Authority submitted an unsolicited lease application for a site off of Humboldt Bay
120-150 MW (5-15 turbines)
Strong winds for energy generation
Humboldt Bay has a deep water port
Since submission, other private sector developers have expressed interest in this project – therefore, BOEM will move to competitive lease via auction

www.fugro.com 24
Southern California
To date, no organization has submitted an unsolicited lease bid.
Two European developers (Ørsted and Equinor) have verbally expressed interest to BOEM about developing these areas.
San Onofre Nuclear Power Plant’s grid connection could receive power from over 200 offshore wind turbines
Likely Southern California will be the last location to develop due to Navy, shipping and Sanctuary constraints
Distance to Onshore Grid Connection

www.fugro.com 25
What’s Happening In California?
California Energy Commission is fostering communication between stakeholders and coordination. Workshops Task Force meetings https://www.energy.ca.gov/renewable
s/offshore_energy/documents/
California Offshore Wind data Gateway Stakeholder database hosted on
https://caoffshorewind.databasin.org/

www.fugro.com 26
Are California Ports Ready?
The short answer is: No
Study commissioned by BOEM identified that current port infrastructure is not adequate to support the importation, fabrication, assembly, transit, and installation of offshore wind structures for California
There looks to be considerable opportunity available, although San Francisco Bay ports likely will be challenged by the Golden Gate Bridge
50% of offshore wind project capital costs are operations and maintenance – therefore there are huge workforce opportunities available
To change footer text go to Insert > Header & Footer

www.fugro.com 27
What else should we know?
BOEM’s selection process is based on highest bidder. Last round of lease sales in December generated $405M for federal government (average $200/acre)
Unlike the east coast (with numerous large areas that can be developed), California will likely only have 3-5 lease areas in the foreseeable future
Although BOEM will set regulations and require investigations/studies, an Environmental Impact Report, etc. – they will not set regulations for stakeholder engagement/participation, local content, foreign/domestic ownership, etc.
The fundamental driver for the developer is establishing a Power Purchase Agreement with a power utility. This is a long-term agreement to buy power from the developer and generally is required as surety for the capital loan.

www.fugro.com 28
Sources
Bureau of Ocean Energy Management
California Energy Commission
Offshore Business Network
Trident Wind
Redwood City Energy Commission
Ørsted
Equinor
National Renewable Energy Laboratory, Walt Newal, presentation July 11, 2018, Houston.
U.S. Department of Energy report on offshore wind energy https://www.energy.gov/sites/prod/files/WindVision_Report_final.pdf
Fugro knowledge base, Global offshore and onshore geotechnical and survey services
Thank-you for your time. Now go submit a comment!! Todd Mitchell Fugro [email protected]