offshore exploration geologyrocks_final_small
TRANSCRIPT

OilSim
Geology Rocks!Geology for Non-
GeologistsStavanger
31st Jan – 2nd Feb 2012

www.oilsim.com
Login

Learning Cycle

Three Challenges
Environmental issues Team work and negotiation Critical decision making, analytical skills,
multi-tasking Learn through experience Economically viable volumes-
reducing uncertainty Return on Investment Function appreciation
Additional Knowledge/Skills

You start with $200 millionYou can apply for more money later.
Create valueMeasured by the net value of the oil and gas fields discovered MINUS all costs involved.
Correct answers and sensible decisions are awarded with CPs
Money and Credibility

Complete Value Chain
U p s t r ea m
Oil and Gas Value Chain

Upstream Process

Decision Gates
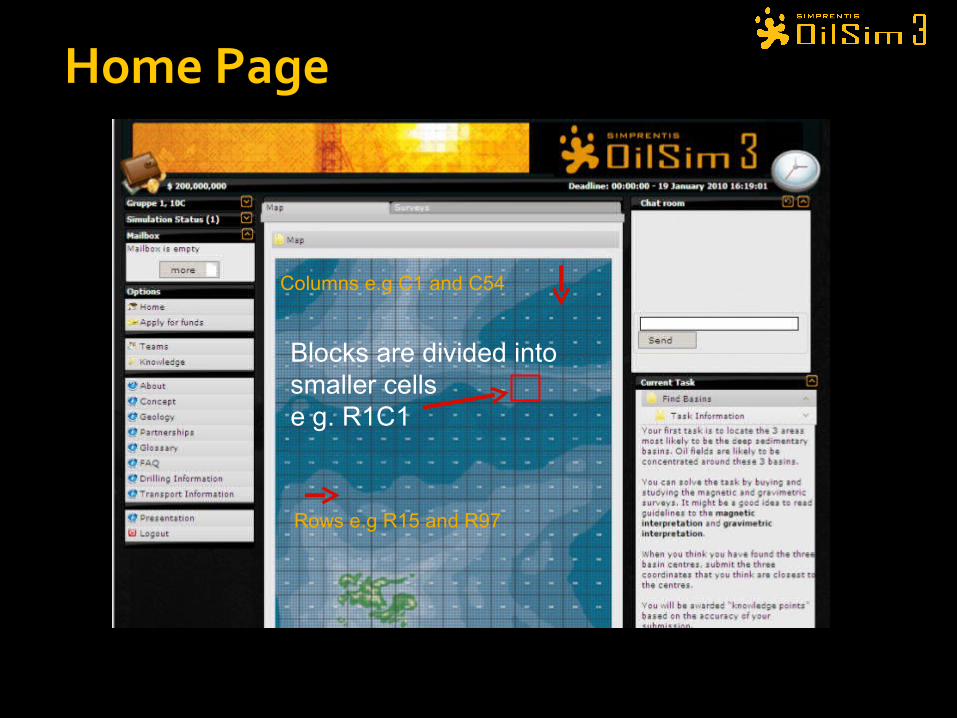
Blocks are divided into smaller cellse g. R1C1
Columns e.g C1 and C54
Rows e.g R15 and R97
Home Page

Where and How to Find Hydrocarbons

Challenge: Find three sedimentary basins in the area. Basins are sedimentary rocks in the deep subsurface where oil and gas has been generated.
Procedure: Buy and study magnetic and gravimetric surveys; and to submit the coordinates, column and row number for each basin geographic midpoint.
Challenge 1- Find basins
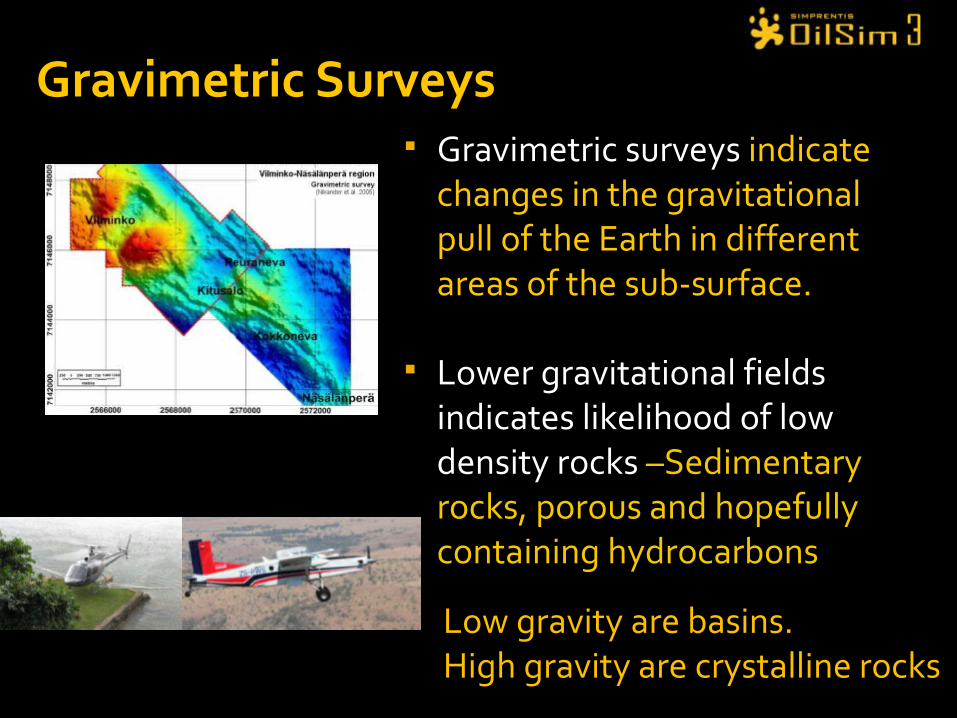
Gravimetric Surveys Gravimetric surveys indicate
changes in the gravitational pull of the Earth in different areas of the sub-surface.
Lower gravitational fields indicates likelihood of low density rocks –Sedimentary rocks, porous and hopefully containing hydrocarbons
Low gravity are basins. High gravity are crystalline rocks

Gravimetric survey:South-east quadrant
Gravimetric Surveys in OilSim

Magnetic surveys show similar information as gravimetric surveys. The sedimentary rocks in the basins have a lower concentration of magnetic materials than the surrounding crystalline rocks.
Sedimentary basins are the areas with the lowest magnetic field.
Sedimentary basins have low magnetic field Non-basins have high magnetic fields.
Magnetic Surveys

Magnetic survey:North-west quadrant
Magnetic Surveys

Finding the Midpoint

Example:Top basin on both
maps Calculate the
midpoint between the gravimetric and magnetic centres found
= C55 and R105
C50
R100
C60
R110
Midpoint May Not be the Same

Enter Decision

3 basins – one midpoint for each basin
Example: C55, R105 Solve before deadline. All
submissions are evaluated after the deadline (and not before).
You may get 0-100 CPs. All three midpoints must be located to get full CPs.
Basin Midpoint Calculation

All teams have submitted their answers. Basin midpoints are located.
Message in mailbox. All teams have answers and CPs awarded.
Challenge 1- Solved

Get The Best Block
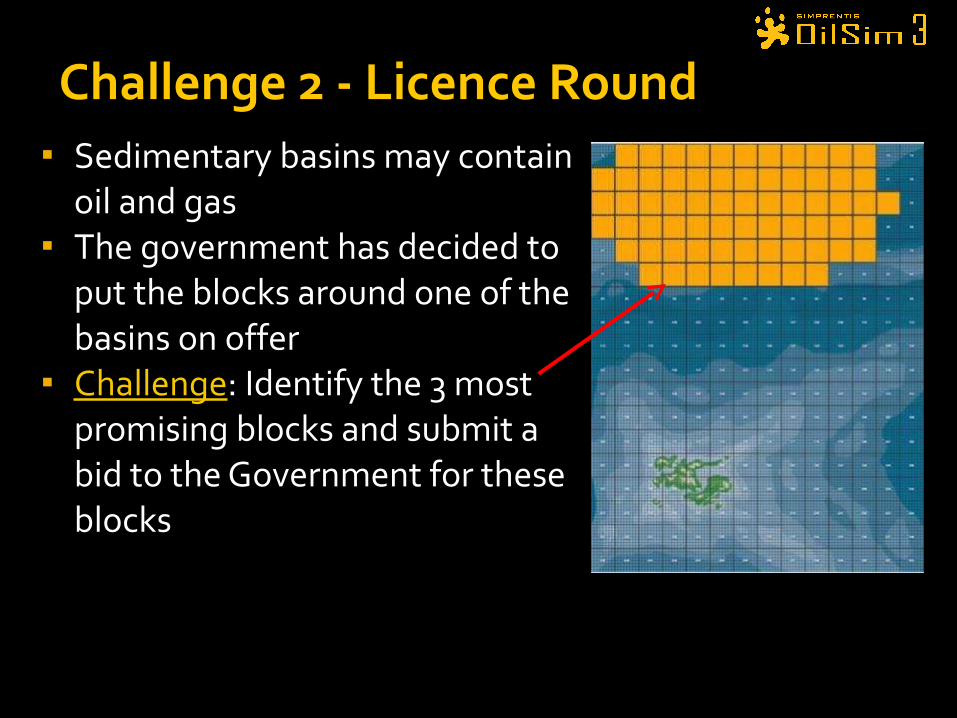
Sedimentary basins may contain oil and gas
The government has decided to put the blocks around one of the basins on offer
Challenge: Identify the 3 most promising blocks and submit a bid to the Government for these blocks
Challenge 2 - Licence Round
Process in a Licence Round
•Invitation/announcement •Qualification (Pre-qualification)•Preparation, data acquisition, evaluation •Establishment of partnerships •Priority, recommendation for bidding •Application, documentation, bid •Announcement of bidding results •License negotiation•Award , work programme, start-up
Success or failure-> discovery/ development/ production/ abandonment or relinquishment

Red areasYou will not be awarded blocks that contain any red spots
Blue areasBlocks in area may be awarded
Spawning Grounds

Basic Petroleum Geology
B a s in
P e t r o le u m s y s t e m
P la y
P r o s p e c t
B a s in S c r e e n in g
P r o s p e c t in g
R e s e r v o ir
T r a p a n d s e a l
S o r c e r o c k a n d m ig r a t io n /c h a r g e

1. SOURCE ROCKwhere organic material is put under sufficient pressure and temperature
2. MIGRATION ROCKwhere hydrocarbons are driven through
4. CAP ROCKImpermeable rock that stops migration of hydrocarbons PROSPECT
Source and Migration3. RESERVOIR ROCKRock with porosity and permeability
5.STRUCTURAL OR STRATIGRAPHIC TRAP

Play Elements Mapping
ReservoirReservoir SourceSource SealSeal
Presence
Quality
Presence
Quality
Maturation
Migration
Timing
Presence
Capasity
Play elements are
converted to risk
segment maps Highest probabilityModerate probabilityLowest probability
Risk maps for each element are combined into total Common Risk Segment map - CRS

Layer 3 Eocene1500m below the seabed
Layer 2 Paleocene2500m below the seabed
Layer 1 Cretaceous3500m below the seabed
CRS - Common Risk Segment maps tell you about the probability of a prospect in the block containing oil or gas Surface
Common Risk Segment

(c) OLFAnticline trap
Fault trap
S t r a t ig r a p h ic t r a p
S a l t d o m e t r a p
Geological “pockets”, that might contain hydrocarbons.
Traps

Traps can be found with use of seismic data
A 2D seismic survey consists of cross- sections of the geological layers along either a column or a row
2D seismic surveys are used for locating prospects
2D Seismic Surveys

Unprocessed Processed
Interpreted
Red is top of the sealing rockGreen is top of the reservoir rock
PROSPECT
2D Seismic in OilSim

Which type of data do you want?
Columns or Rows
Unprocessed or processed data
Interpreted or not
You can only buy maximumof 4 blocks of data at a timeto speed up processing
The yellow hatched area on map can be clicked on and dragged to blocks of interest
Order 2D Seismic

Red is top of the sealing rock
Green is top of the reservoir rock
PROSPECT
2D Seismic in OilSim
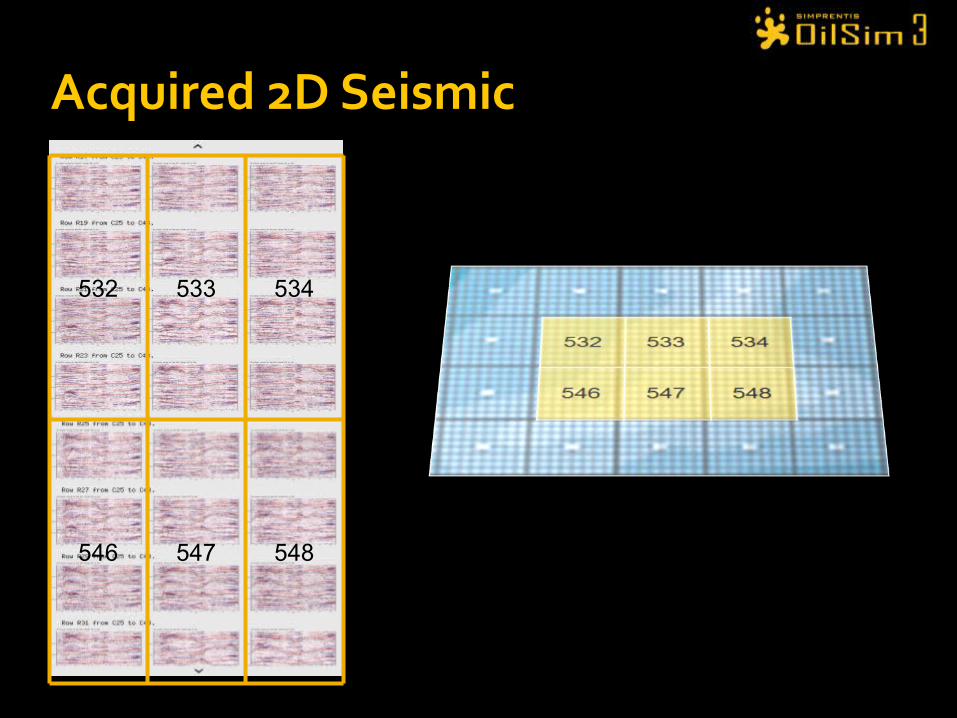
Acquired 2D Seismic
532 533 534
546 547 548

532532
R17
R19
R21
R23
R17
R19
R21
R23
Prospect Counting
How Rows Work

1
1
2
3 4
5 6
2
5 6
Prospect Counting
How manyprospects canyou see ineach block?

Text
Anticline and Fault Traps
Leakage

Black arrows in red circles – navigate through the 2D seismic
Line data in yellow square – Row 1 from Column 1-56
View the Seismic

Column
Row
Prospect, ReservoirBasin,Source
Cross-Sections

Activities that oil and gas companies do to serve the communities they operate in
CSR projects usually to develop the local communities in education, social welfare, and business
In OilSim teams are rewarded with CPs when choosing their CSR projects
CPs a company has is considered by the Government when deciding upon licence awards
Corporate Social Responsibility

CSR Tab
Some are greyed out, because the team does not have enough CP, enough CSR budget, or enough cash to do them
Each has a cost, and a number of possible outcomes Each outcome has a probability and either negative
or positive CP In the CSR tab you can see the minimum and
maximum CP you can get, as well as the probability for getting the maximum CP
CSR Projects

This project costs $8M If it goes well, the team gets 40 CP
The likelihood of this is 60% If it goes badly, the team gets zero CP Minimum required CP is zero
Project Example

Confirmation Box
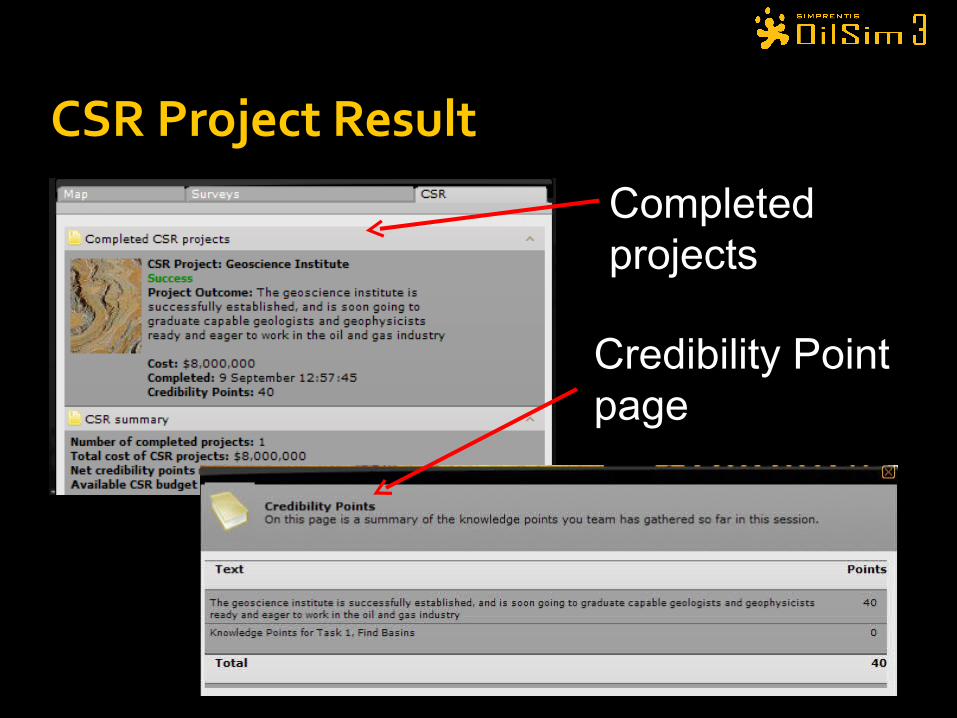
CSR Project Result
Completed projects
Credibility Point page

Review Credibility Points

Lots of different types of Projects to choose from You only have $30M budget for CSR in each
licensing round CSR funds that you don’t spend in one round are
transferred to the next You cannot initiate a project if it has the potential to
make your CP’s go into negative You cannot initiate a project if you don’t have the
cash for it Each project can only be run once per team
Limitations
CSR is about caring for the local society – and making a difference for the people living where you operate
Not all projects are sound Bribery does not pay
Some projects cost a lot, but do not give so much return
Some projects are riskier than others
Learning Points

Environmentally sensitive areas – blocks to avoid
Common Risk Segment surveys – areas of higher probability of prospects
2D seismic – blocks with most structures
Bid for 3 blocks - you will only be awarded 1
Recap on Challenge 2
Final Tip – Check water depth and go for shallow water blocks if possible

• Choose which blocks you want to bid for• For each block, say how
many exploration wells you are committing to drill• Do NOT promise to drill
more wells than there are prospects• An estimated cost is shown• You will initially only be
awarded one block
Bidding Form

Message sent to all teams with the results- see mailbox
Credibility Points are given for prosperity of the blocks you bid for
Every team has got one exploration license
Challenge 2 Solved

Reduce Risk and Start Drilling
HQ is happy with the license awarded. Challenge: Farm-out minimum 20% from
your license – and farm-in as much as you can, in other good licenses.
Acquire 3D Seismic interpretations for the block you operate, and study the results from the licensing round
Get others to invest 20% or more in your license – you can show/send 3D seismic
Challenge 3 - Exploration Drilling

Shows the subsurface structure in a cube.
Real 3D Seismic

3D Seismic in OilSim
Layer 1 Cretaceous
Layer 2 Paleocene
Layer 3 Eocene
Prospects are no guarantee of oil or gas
Spread the risk: e.g Investing in other blocks divides the risks amongst all partners, much more preferable than keeping 100% of one field and all the risk.
Increase probability of profit: investment in only one prospect which could be a dry is possible, whereas the likelihood of investing in 5 prospects which are all dry, is less likely.
Partnerships

Licences

Enter the percentage and total amount for have agreed to offerMinimum $100,000 per %Add a message to the sellerPress “Send offer”
Farm-In

When a team receives a Farm-In offer to appears under Financing. This is where a team can receive finance or money for a % of their own blocks
Farm-In

licence OWNER decides whether to ACCEPT or REJECT the offer
Partnerships established every time a licence owner accepts an offer.
Overview: On the main page, you can see all licences. 1) licences you operate, 2) licences you have invested in, and other licences.
Farm-In
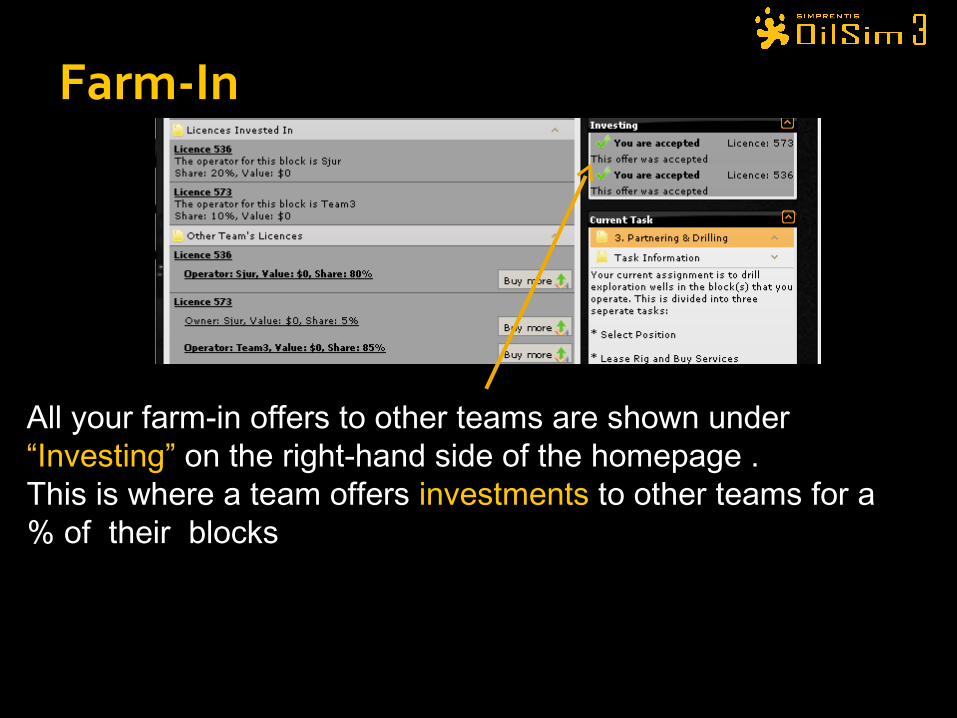
All your farm-in offers to other teams are shown under “Investing” on the right-hand side of the homepage . This is where a team offers investments to other teams for a % of their blocks
Farm-In

Partners pay a proportional share of all future costs
Partners receive a proportional share of the net proceeds from oil and gas
The operator team makes all decisions regarding drilling
Teams can farm-out up to 70% of licence Operators must keep 30% of licence
Parnerships

Before choosing a rig, you need to check your water depth .
Find this at the bottom of the BLOCK page
Water Depth

Choose Rig Choose the right rigs for your water depths
Jack-up rigs for shallow waters Up to 100m
Semi-submersible rigs for middle waters Up to 600m
Drill ships for the deepest waters Over 600m
Rig cost = drilling days * day rate

Drilling Days
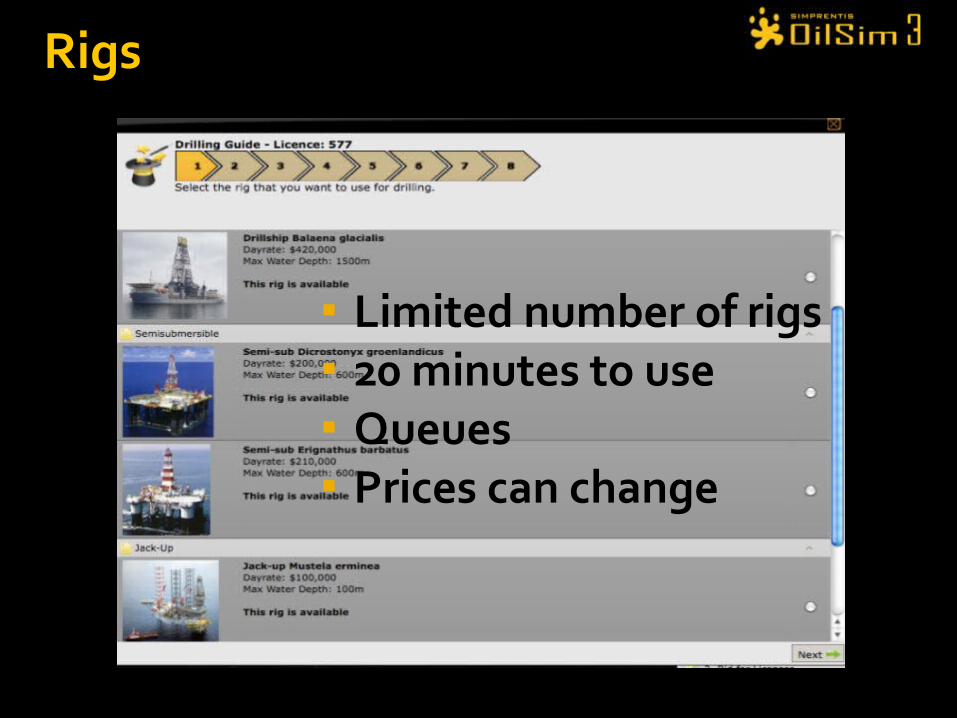
Rigs
Limited number of rigs 20 minutes to use Queues Prices can change

Up to 9 Star quality- Good: normally
costs more Bad: cheaper, but reliability is low,
so you risk extra drilling time and extra costs
Service Providers

Drill Position
EIA: Enviromental Impact Assessmentshows where not to drill.
Place your mouse where to drill

Penalties & Fines
Certain problems can occur if Service Provider Selection is poor quality
Other penalties can occur if you drill in areas indicated as problematic in the Environmental Impact Assessment
As in real life, problems can occur randomly and these are also applied with fines levied accordingly.

Layer 1 Cretaceous
Layer 2 Paleocene
Layer 3 Eocene
Drilling Position
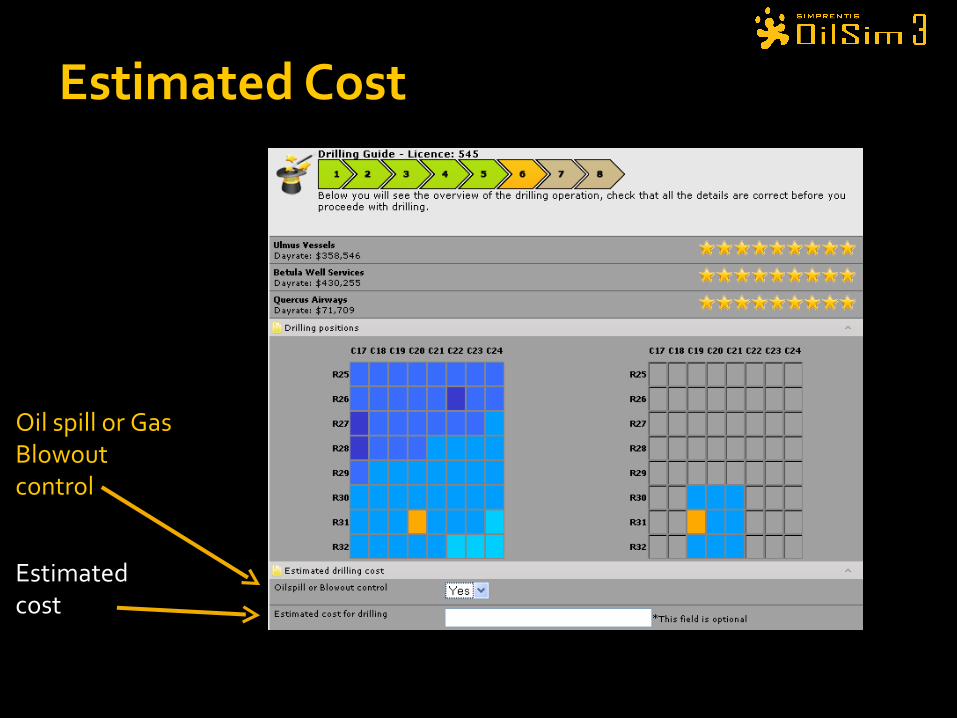
Oil spill or Gas Blowout control
Estimated cost
Estimated Cost

Drilling Results
Proven volume (MBOE) counts Test may increase proven volume Remember to tick the boxes!

After Testing
Proven Upside potential

Reinterpretation of Seismic

Value

Discovered Prospects

A s s u m p t io n s
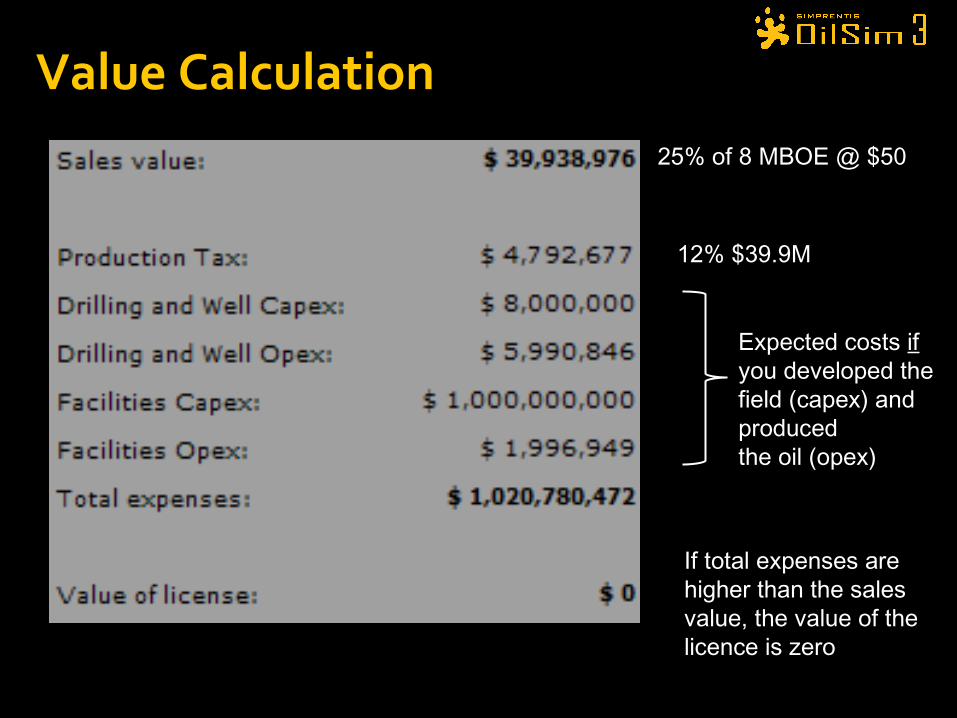
Value Calculation25% of 8 MBOE @ $50
12% $39.9M
Expected costs ifyou developed thefield (capex) andproducedthe oil (opex)
If total expenses arehigher than the salesvalue, the value of thelicence is zero

Appraisal
From Probable volume to proven reserves

Narrowing Ranges-Example
Exploration well: 0 to 1572 MBOE (after drilling) 11 to 1266 MBOE (after testing)
First appraisal well: 25 to 1033 MBOE (after drilling) 34 to 910 MBOE (after testing)
Second appraisal well: 65 to 850 MBOE (after drilling) 101 to 752 MBOE (after testing)
Only proven MBOE counts

Increasing Proven Volumes
Appraisal wells - proven reserves increase Range between proven and possible is decreased
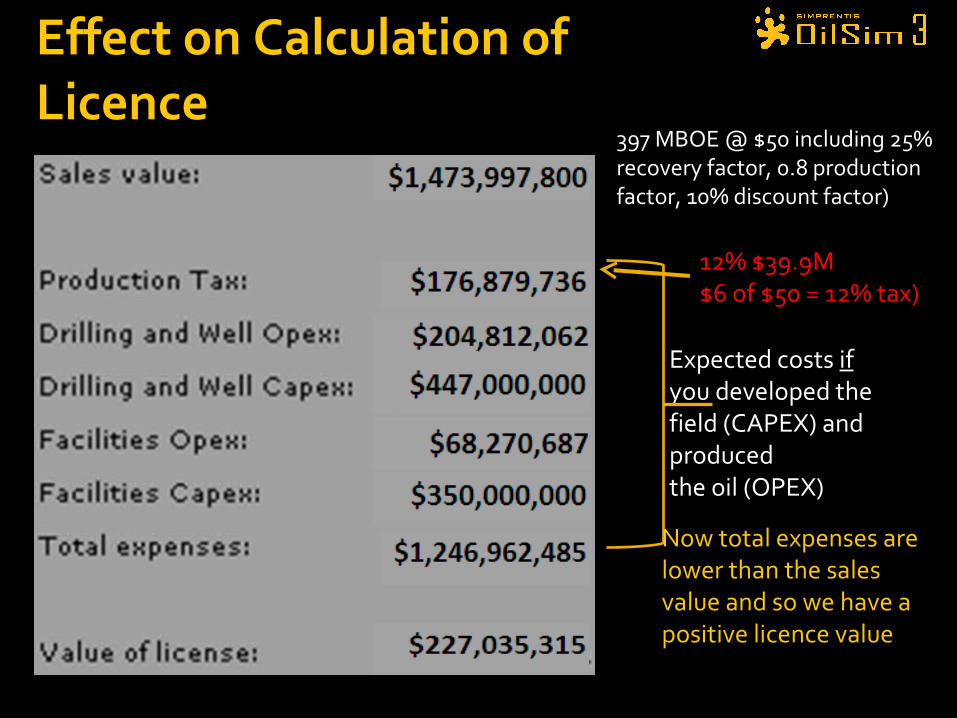
Effect on Calculation of Licence
397 MBOE @ $50 including 25% recovery factor, 0.8 production factor, 10% discount factor)
12% $39.9M$6 of $50 = 12% tax)
Expected costs ifyou developed thefield (CAPEX) andproducedthe oil (OPEX)
Now total expenses are lower than the sales value and so we have a positive licence value

After your first drill in each well, test and reinterpret seismic
Decide which discoveries to drill, how many appraisal wells into
Ultimately, you should either: Get a positive net present value, Or a conclusion that additional appraisal
wells will not result in a net present value
Drilling Summary

Click on Apply for More Funds Tab. 1 CP for each $100,000 applied for. Answer three questions:
Expensive money if less than 10 credibility points: Apply for cash and be fined $5million for each $20million requested.
Apply for More Funds