offline and online search in used durables markets and... · 2 offline and online search in used...
TRANSCRIPT

1
Offline and Online Search in Used Durables Markets
Sonika Singh
Lecturer of Marketing
University of Technology, Sydney
PO Box 123 Broadway
NSW 2007, Australia
+61-2 9514-3259
Brian T. Ratchford
Charles & Nancy Davidson Professor of Marketing
Jindal School of Management
The University of Texas at Dallas
Richardson, TX 75080, USA
+1-972-883-5975
Ashutosh Prasad1
Associate Professor of Marketing
Jindal School of Management
The University of Texas at Dallas
Richardson, TX 75080, USA
+1-972-883-2027
1 Corresponding author. The authors thank Yuanping Ying, the Editor Shankar Ganesan, and two anonymous
referees, and seminar participants at Cambridge University, Governors State University, Ozyegin University,
University of Technology Sydney, and the 2011 Marketing Science Conference in Houston for their helpful
comments. Authors contributed equally.

2
Offline and Online Search in Used Durables Markets
Abstract
This study examines how different information sources are used by consumers prior to their
purchase of used durable goods, specifically used cars. We examine how online and offline
search are related. Categories of online sources are dealer websites and resale websites, and of
offline sources are print media and dealer visits. Prior research on new car purchases finds that
online sources substitute for traditional, offline sources such as dealer visits. We examine
whether this theory extends to used-car purchases and distinguish between dealer websites and
resale websites (a distinction relevant to used-goods markets) by collecting data from a sample of
used-car buyers. Because search in different sources can be interrelated, and due to data
censoring, we build and estimate a simultaneous equations Tobit model. In contrast to existing
research, we find that online search on dealer websites is complementary to and not a substitute
for dealer visits. This complementary effect highlights the importance of dealers’ web presence
in used markets.
Keywords: Used goods; Automobiles; Search; Internet; Simultaneous equations Tobit.

3
Introduction
The automobile category has great economic significance, a large portion of which comes
from used car sales. According to the US Bureau of Transportation Statistics (www.bts.gov), the
average transaction price was $8,786 for used vehicles and $26,850 for new vehicles in 2011, but
used vehicles had over three times the sales volume of new vehicles. Thus, transaction values for
new and used vehicles each exceeded $300 billion. However, there has been less investigation of
consumer search for used cars, compared to a well-established literature examining consumer
search in the new automobile category which finds for example that individuals differ in their
use of the Internet (e.g., Klein and Ford 2003; Ratchford et al. 2003, 2007). Furthermore, while
existing studies examine substitution between information sources during search, a drawback is
that they employ separable functional forms for the function that relates time with each source to
information gained and, thus do not accommodate complementarity between sources.
From the consumer’s perspective, search in used car purchases can have additional
benefits compared to search in new car purchases by reducing the greater uncertainty in used car
purchases, which occurs due to several factors: First, used car transactions involve asymmetric
information due to unobserved maintenance, history and mechanical defects which makes the
quality uncertain to the buyer even for the same make and model (Akerlof 1970). Second, the
availability of a desired make and model of a used car is more random. While new car dealers
provide a dedicated location and inventory for purchasing, used cars are advertised as they
become available through different sources and by multiple sellers, including dealers and
individual sellers. As a result, consumers search across various offline and online sources to find
acceptable used cars (or used goods in general). Greater or less overlap of information in
different sources can explain their substitutability or complementarity. Prior search literature has
focused on substitutability, but as we will argue, greater uncertainty about product quality and
availability in the used car market likely encourages complementary use of information sources.
Traditional offline information sources such as dealer visits and print (newspapers and
magazines) continue to be widely used. Online sources are dealer and manufacturer websites and
unaffiliated, third party websites. Some dealers operate websites and list their inventory online,
while others do not. Unaffiliated websites are called resale websites (such as Auto Trader, eBay,
etc.) While dealer websites list the inventory of used goods from the specific dealer, resale
websites list used goods from franchised and non-franchised dealers as well as individual sellers.

4
These also include sources such as Craigslist, auction websites, newspaper websites etc. Given
the wide breadth of information that they provide, resale websites are arguably the most relevant
websites for the search for used cars. Thus, this study treats dealer and resale websites as distinct
rather than as a combined online source as commonly treated in the new car search literature.
This enables us to obtain insights about the interrelationships between the usages of different
online sources.
The existence of different types of online sources presents managers with the problem of
coordinating a presence in some or all of them. Theory from new car purchase studies suggests
that Internet search substitutes for traditional information sources such as dealer visits (e.g.,
Ratchford et al. 2003; 2007). If sources are substitutes, dealers should maintain a presence on
many sources, or target consumers on selected sources, whereas complementarity between
sources suggests the converse. We examine whether existing theory extends to used-car
purchases and distinguish between dealer websites and resale websites (a distinction relevant to
used-goods markets). Objectives of this study are to investigate:
How does search on different online sources, namely Dealer websites and Resale
websites, affect search on offline sources?
Within the Internet medium, how does search on Dealer websites and Resale websites
affect each other?
How does the use of different information sources affect the type of seller chosen for
the final purchase?
We conducted a survey of used car buyers to answer these questions. Surveys of search
behavior may face the problem of recall by consumers; however, since cars are a major purchase,
it is likely that consumers accurately recall their behavior. Hence survey methodology has been
used extensively. The results of our study are as follows:
First, search on dealer websites complements offline search (dealer visits and print).
This is in contrast to prior findings by Ratchford et al. (2003) that online search is a
substitute for dealer visits. Conforming to existing results, however, we find that
search on resale websites is a substitute for offline search.
Second, search on dealer websites is positively associated with search on resale
websites, but search on resale websites is negatively associated with search on dealer
websites.
5
Third, several consumer characteristics affect search in the used car market. Higher
wage individuals are more likely to search on dealer websites and less likely to search
offline. Older consumers are less likely to search online and more likely to visit
dealers or search print. Word of mouth negatively affects search on dealer websites.
Finally, those who purchase from individual sellers tend to be younger, buy in a lower
price range, consider more models, and use resale websites; those who purchase from
a dealer tend to be older, make more dealer visits, make less use of resale web sites,
consider fewer models, and buy in a higher price range.
We next discuss the literature on search across multiple sources of information.
Subsequent sections deal with the conceptual framework, data description and results. Finally,
we provide discussions and directions for future research. Appendix A contains the survey
instruments used for this study. Appendix B presents a detailed derivation of the model used in
estimation as an extension of the model employed in Ratchford, et al. (2003).
Background
Consumers’ pre-purchase search for product information from different information
sources has received significant attention in the marketing literature. A literature review is
provided by Ratchford (2008) who notes that empirical work on search for durable goods
emerged over fifty years ago. From the marketer’s perspective, obvious benefits in messaging,
budgeting and competitiveness arise from understanding the search process and shaping it
towards one’s own products.
The durable goods search literature has focused on consumers’ search for new cars in
offline media. Table 1 presents a summary of the findings. Consumers search for information
about functional attributes, expressive attributes and prices of competing models (Ratchford et al.
2001). In searching, consumers invest time and resources to determine which brands of cars
deserve a serious effort to purchase. The size of this feasible set, i.e., the number of acceptable
makes and models of new cars, is influenced by prior experience and knowledge (Srinivasan and
Ratchford 1991). Consumers with little knowledge or a great deal of knowledge may have less
incentive to search, leading to an inverted U-shaped relationship between knowledge and search
(Moorthy et al. 1997). After the search for acceptable makes and models, the consumer invests

6
effort in trying to get a favorable deal on one such car (Ratchford and Srinivasan 1993). Once a
satisfactory deal has been closed, the search process concludes.
<Insert Table 1 here>
More recent literature looks at search in the online medium. Klein and Ford (2003) use
online survey data of automobile shoppers and purchasers to examine how individuals differ in
their use of the Internet and the patterns of substitution they exhibit across sources and media.
They find that basic economics continues to drive information search as measured in terms of
amount (time) and breadth (number of sources) of search. Their analysis of search behavior
reveals an offline-online dimension of search apart from the traditional dimensions of
impersonal/personal and independent/seller-dominated search.
Ratchford et al. (2003) and Ratchford et al. (2007) study the impact of online search for
new cars on the use of traditional information sources. They find that Internet search substitutes
for traditional search with the greatest impact on dealer visits. Both studies employ a search
model where consumers allocate time among Internet and non-Internet sources to maximize the
value of information, subject to time constraints. Employing a more flexible time allocation
model, Kim and Ratchford (2012) find that Internet search increases much more rapidly with
total search than the use of other sources, especially the dealer. In all of these models,
consumers’ usage of information sources to search for new automobiles is based on the
assumption that the sources are substitutes, i.e., acquiring information from one source lowers
the need to use another.
Sarvary and Parker (1997) study competition in the information sector, and explicitly
model cases in which information sources can be complements as well as substitutes. Their game
theoretic model consists of two firms selling information to a population of consumers who are
heterogeneous in their willingness to pay for quality of information. The quality of information is
linked to the accuracy of consumers’ estimate of the mean, and consumers facing important
decisions may find it beneficial to purchase from several information sellers. Depending on the
reliability of information in the same product-attribute space, they find that competitive
structures may accommodate complementarity or substitution patterns. This setup is applicable
to the used car market where consumers face classical asymmetry problems due to differences in
quality of the product and reputation of the seller. We will incorporate their results into the
conceptual model discussed in the next section.

7
Conceptual Framework
To analyze search for cars or other used durables, we define search of a source type as the
total number of different sources used within the type, e.g., the number of dealer websites visited
is a measure of search on dealer websites. This is consistent with depth of search as defined by
Klein and Ford (2003). New and used durables markets differ on dimensions such as quality
uncertainty, number of sellers and seller types, etc. See Table 2 for a comparison of information
requirements in new and used car markets. This table is discussed in the paragraphs below.
<Insert Table 2 here>
Search for new durables (e.g. cars, computers, laptops etc.) involves search for
information on makes and models (Erdem et al. 2005; Ratchford and Srinivasan 1993; Ratchford
et al. 2001). New cars of a given make and model should have similar quality across franchised
dealers which reduces the need to evaluate individual items. Thus, the role of information
sources is to disseminate product and price information, and information about the location and
other characteristics of dealers (Pauwels et al. 2011; Punj and Staelin 1983; Ratchford et al.
2003; Srinivasan and Ratchford 1991). The information can be obtained from print, word of
mouth, third party information websites, dealer websites, and dealer stores (Klein and Ford
2003).
Used car quality depends on the unobserved driving and maintenance habits of its
previous owners, and on the ability of dealers to screen out unsatisfactory units. As a result, used
goods of the same specification (make, model, year of manufacturer etc.) differ in their
evaluation. In addition to locating product, price and dealer information, buyers in used car
markets have to locate available models that are for sale, and have the option to buy from a
variety of dealer types beyond the franchised dealer that sells a particular type of new car.
Thus, in addition to search tasks that buyers of new cars undertake, buyers of used cars
have to determine which cars are currently available, whether to buy from a new or used car
dealer or individual seller, and assess the quality of the cars they locate.2 To accomplish these
tasks, consumers may use a variety of online and offline sources that provide a listing of used
cars for sale. Buyers can browse through listings of used items on online sources (dealer websites
and resale websites) or view them in traditional sources (print or visit dealer stores). They can
2 The latter is difficult, and may require the use of risk-reduction activities (Dowling and Staelin 1994), such as
buying from a reputable dealer and obtaining information on the history of cars that are candidates for purchase.

8
also view factual information about each item, e.g., the selling price, VIN number, carfax
history, seller type (individual reseller or dealer), and pictures of the used car. This detailed
information is not required for the purchase of a new car.
As noted in the previous section, Sarvary and Parker (1997) provide an argument for
which information sources should be complements or substitutes, contingent on circumstances.
We define a source as complementary to another if its use increases with increased use of the
other source, and a source as a substitute for another if its use declines with increased use of
another source. Sarvary and Parker (1997) show that different information sources are more
likely to be treated as complements by consumers when the reliability of their information is low
and the sources of information are independent. Intuitively, noisy information requires checking
a lot of sources to obtain a good basis for action, and independent information requires a lot of
sources to locate a range of good alternatives. In contrast, when information sources are more
reliable and their information correlated, then consumers do not need multiple sources and are
more likely to see them as substitutes. Intuitively, reliable and correlated information implies that
one can get essentially the same information in a number of different places, and using one
source is enough. 3
The used car market is one where the former case is more likely to apply. Reliability of
sources is lower in the used car market than in the market for new cars because the inventory
comes and goes. Whereas, the availability of a current model Honda Accord at the market price
is almost guaranteed at a new car dealership, the availability of a ten year old Accord is
uncertain. It might suddenly appear on eBay and be delisted within a few days. Thus a customer
may search through several sources to find the listing they want in a timely manner. Also
because of the variety of sources that can be employed by an advertiser, the information in the
different sources is likely to be more independent for used cars than for new cars.
Based on the above characteristics of the used car market, one can hypothesize about the
relationship between the variety of sources used by consumers to locate a used car. As
summarized in Table 2, due to the large number of sellers, information asymmetry about product
quality, lack of reliability of sources, lack of seller reputation etc., and independence of
3 In the present study, Sarvary and Parker’s result implies that the same two information sources could be treated by
consumers as substitutes for one situation (e.g., when buying a new car) or as complements in another situation (e.g.,
when buying a used car). This is distinct from how consumers might always treat, for example, products like a
Camry and an Accord as substitutes.

9
information provided by different sources, it is likely that multiple online and offline sources will
be consulted by many buyers. Given the above discussion, this implies that there is greater
likelihood of source complementarity in the used car market. Accordingly, we hypothesize:
H1. Offline search is positively associated with online search in the used car market,
i.e., the more consumers do offline search, the more they will do online search.
Finding purchase candidates on different dealer or resale web sites may lead to follow up
inspection of the candidates at multiple dealers, or dealers and individual sellers in the case of
resale websites. Hence we hypothesize that:
H2a. Search on dealer websites is positively associated with offline search in the
used car market.
H3a. Search on resale websites is positively associated with offline search in the used
car market.
However, theory from new car search suggests plausible arguments for why the use of
dealer and resale websites might substitute for offline search. Online sources can substitute for
offline search because online search is more efficient and the online dealer and non-dealer
channel less costly (Bakos 1998, Chen et al. 2008; Grewal et al. 2003; Ratchford et al. 2007;
Zettelmeyer et al. 2006). Thus online search may allow buyers to screen a large number of
alternatives efficiently, and lower the need to physically inspect a large number of cars. Thus two
competing hypotheses are:
H2b. Search on dealer website is negatively associated with offline search in the used
car market.
H3b. Search on resale website is negatively associated with offline search in the used
car market.
If buyers consult a variety of online sources to find what they want, one might expect dealer and
resale websites to be complements. Thus we hypothesize that:
H4a. Search on dealer websites is positively associated with search on resale
websites in the used car market.
On the other hand, more strategic buyers might direct their online search toward the type of
outlet they plan to buy from: intending to buy from an individual seller or used car dealer, those
who use resale web sites might avoid dealer web sites. This suggests the following hypothesis:

10
H4b. Search on resale website is negatively associated with search on dealer website
in the used car market.
Both tendencies might be present in different consumers in our data. That is, consumers who
make extensive use of dealer web sites may also tend to consult the resale sites, but consumers
intending not to buy from a dealer may avoid the dealer sites. In regressions with different sets of
covariates that describe the choice of dealer and resale web sites, this could result in a positive
coefficient for dealer web sites in a regression with resale sites as dependent (H4a), and a
negative coefficient for resale web sites in a regression with dealer sites as dependent (H4b).
Fig. 1: Framework for Search in New and Used Durables
Thus we have two sets of hypotheses about whether online and offline search are
complements or substitutes. Figure 1 summarizes the discussion in this section by illustrating the

11
different hypotheses as presented here and in the new car literature. The main sources of offline
information in new car market are dealer visit, WOM and print. The online sources are dealer
websites and non-dealer websites. In the used car market, the main sources of offline information
and product evaluation are dealer visit and print. Since WOM is limited to obtaining information
only, it is not represented as a source of product evaluation in the Figure 1. The online sources of
information and product evaluation in the used car market are dealer websites and resale
websites.
Data
The dataset for this study was collected via a questionnaire-based survey of used car
buyers over a period of 3 months beginning June, 2010. A total of 250 surveys were collected.
Eleven were excluded, following prior studies (e.g., Ratchford et al. 2003), as their reported
search time exceeded 60 hours.
To examine the used car search process we began by conducting depth interviews of four
used car buyers, three franchised car dealers and one non-franchised car dealer. The dealers were
based in a southern US city, whereas the consumers were from that city and another in the Great
Lakes region. Consumers elaborated their search process, and use of Internet and non-Internet
sources to locate used cars. The interviews revealed that consumers inspected the accident
history, type of seller, sale price and maintenance records at auto repair outlets. Dealer
interviews revealed that some dealers listed their inventory of used cars on dealer websites and
advertised used cars on other sources as well. Next, a pilot survey was taken on a convenience
sample of twelve used-car buyers. The final questionnaire was shortened based on feedback from
the pilot survey.
Auto-repair outlets were chosen as the location to recruit participants and administer the
survey rather than dealerships or used car lots, because the latter could bias the sample towards
consumers who prefer dealerships or used car lots over, say, individual sellers, or prefer offline
over online search. Of seven randomly selected auto repair outlets, five supported the survey. A
receptionist requested used car owners to fill the survey and place them in a drop box in the
waiting area.
The questionnaire is based on questionnaires of the new car search process (Ratchford et
al. 2003). It is designed to capture the respondent’s motivation to purchase a used car, use of
various information sources, and their purchase. The various measures are based on those

12
employed in prior studies (Klein and Ford 2003; Punj and Staelin 1983; Ratchford et al. 2003;
Srinivasan and Ratchford 1991). The questionnaire has 6 parts (see Appendix A for a copy).
Section A is about search for the used car. It records respondents’ prior information about the
manufacturer and the seller, the makes and models considered, the sources consulted to search
for information on makes and models, and the sources used to search for and evaluate used cars.
Prior information is measured by whether the respondent knew which make and seller to buy
from (Ratchford et al. 2003). We classify the sources using Klein and Ford (2003) framework.
The sources are traditional print, traditional retail (dealer store), online neutral/resale website
(e.g. cars.com, craigslist.com) and online retail (dealer websites).
Section B focuses on the decision process to select used cars from those available in the
used car market. The respondents indicate the number of visits to a specific seller and number of
cars located from that seller. Respondents indicate the total number of sources consulted within a
source type i.e. depth of search (Klein and Ford 2003). Respondents assessed the sellers on
measures of trust and risk. These are 5-point Likert scales based on standard scales from the
marketing handbook of scales. Trustworthiness is measured as competency of the seller, ability
to deliver its promise, quality of cars, dependability and concern about customers. Risk has been
measured as performance risk, maintenance risk, time risk and risk of buying from a given seller
(Stone and Gronhaug 1993). This section includes some validation questions related to the use of
information sources.
Section C deals with the respondent’s used car shopping experience and captures
information about make, model, price, and satisfaction with the recently purchased used car. The
next three sections in the survey record the respondents’ shopping enjoyment, use of Internet,
prior experience with cars and demographic information. The survey measures several ‘shopping
enjoyment’ variables about shopping in general as well as shopping for cars. These include
measures such as “talking to sales people, enjoying store visit, tendency to gather information
before dealer visit, price comparison and the use of the internet to make purchases.” These are
measured on a 5-point Likert scale, with 1 representing the lowest and 5 representing the highest
agreement on that measure. Internet expertise is captured using two variables: the number of
hours of Internet use per week and the years of Internet experience (Klein and Ford 2003;
Ratchford et al. 2003). Hours of Internet use measures the current ability and opportunity to use
the Internet, while years of Internet use is a proxy for accumulated experience with the Internet.

13
Measures of first car owned and number of used and new cars bought in the past ten
years provide information about the respondent’s amount of experience (Punj and Staelin 1983;
Ratchford et al. 2003). Content of experience is measured by questions about satisfaction with
the previous car and dealer (Ratchford et al 2003). Time costs are measured by the respondent’s
hourly wage (Srinivasan and Ratchford 1991). Education is measured as years of school
completed (Klein and Ford 2003; Ratchford et al. 2003).
Since our approach is based on prior survey designs, it rules out any measurement and
method differences relative to earlier studies. Due to the difficulty of identifying potential
consumers of used cars this survey design is unable to capture “in-process” measures employed
in prior studies (Erdem et al. 2005; Klein and Ford 2003) in addition to post-purchase measures.
Dependent Variable
The information sources in this study are grouped into dealer visit, print, dealer websites,
and resale websites. Search on manufacturer websites is grouped together with search on dealer
websites because manufacturer websites typically route consumers to dealer websites for used
car listings. Resale websites include newspaper websites, auction websites, third party websites
and local community websites. Resale websites are used by consumers to contact different dealer
types directly or indirectly to request price quotes.
Search on an information source is the dependent variable. It is operationalized as depth
of search, which is the total number of different sources consulted within a source type in the
external search process (Klein and Ford 2003). As an example, consider that a consumer visits
Ford, GM and Honda dealers, then the depth of search for dealer visits is 3, i.e. the total number
of different dealers visited. Similarly, if a consumer searches for used cars on five different
auction websites, three different community websites, two different third party websites and one
newspaper website then the depth of search on resale websites is 11.
<Insert Table 3 here>
Table 3 provides a description of consumer characteristics. Consumers considered an
average of 2.4 models while shopping for cars. Consumers’ experience of used cars is more than
their experience of new cars. 67% of the respondents are male, 64% are married and their
average age is 38 years. The average, used-car sticker price is $12477. From Table 3 we also see
that consumers visited an average of 3 dealers, 5 dealer websites and 6 resale websites. This is
higher than search in traditional print medium. Search on these websites is much less for new

14
cars. As shown in Table 3, Ratchford et al. (2003) report that consumers in their sample visited
an average of 1 dealer website and 3 resale websites. Ratchford et al. (2007) find that consumers
visited an average of 2 dealers, 3 dealer websites and 2 resale websites. Consistent with
reasoning in Table 2, consumers in the used car market search more than consumers in the new
car market.
<Insert Table 4 here>
Table 4 displays the correlation matrix. The correlation coefficients between dealer
websites and dealer visits and resale websites and dealer websites are higher than other
correlations (both 0.40). Also there is a high correlation between consumers’ frequency of
Internet use and consumers’ tendency to do price comparison (0.36).
<Insert Table 5 here>
Table 5 describes the number of makes and models considered by consumers in the
sample. About 33% considered 2 makes and models and 26% considered 3 makes and models of
used cars. Furthermore, they are relatively equally split in their preference for three seller types –
34% of the respondents have bought cars from new car dealers and 28% have bought from used
car dealers. 30% of the respondents have bought from individual sellers – whereas fewer (7.5%)
bought from used car superstores. Coverage of the seller types in the sample reflects the national
averages.4
<Insert Table 6 here>
Table 6 shows the several information sources that were used by respondents to search
for used cars and the percentage of users who used them. These sources are later aggregated into
the four types as mentioned above. 70% of the respondents had visited dealers, 62% searched on
dealer websites and 52% searched on local websites such as Craigslist, Ebay etc. While
newspaper advertisements by dealers, and classified ads in newspapers by both dealers and
individual sellers would have been the main source of information on individual cars prior to the
Internet, these sources were among the least used sources for the respondents to this study. This
illustrates the extent to which the Internet has replaced newspapers as an information source.
4 A report by Capegemini on the U.S used car market found that for 2007, nationwide dealer shares in used car
market were 37% for franchised dealers, 32% for non-franchised car dealers and 31% for individual sellers.
According to CNW market research, franchised dealers had 34.3 % market share in 2010. For the data in our study,
franchised dealers have 34.3% market share, non-franchised dealers have 35.6% share, and individual sellers have
30.1 % market share.

15
Independent Variables – Indicators of Customer Needs
The independent variables consist of consumers’ experience of buying used cars (i.e., the
number of previous used-car purchases), the total number of models considered, time costs
(measured as hourly wage rate), the age of the respondent, shopping enjoyment and the number
of children in the household. In our sample, 38% of respondents relied on relatives and friends to
find information on used cars and 23% of respondents actually bought through a family member
or friend. Therefore, we control for word of mouth. We use the measure time spent consulting
WOM as an independent variable in the analysis.
As seen from Table 3, the mean of consumers’ inclination to engage in price comparison
and gather information before visiting dealers is higher than other measures of shopping
enjoyment (4.39 and 3.72 respectively).
Empirical Analysis
We estimated a linear simultaneous equation Tobit model in which the use of each source
was allowed to depend on the use of the others. To accommodate cases in which a given source
was not used, we define the relation between observed search on information source j for
consumer i, yij, and latent search yij* as follows:
* *
*
if 0,
0 if 0.
ij ij
ij
ij
y yy
y
(1)
If the vector of latent elements 𝑦𝑖𝑗∗ is defined as 𝑌𝑖
∗, consumer i’s use of J sources can be
expressed in matrix form as:
* *
i i iY X (2)
or equivalently as,
* * *( )i i i iY Y X , (3)
where 𝑌𝑖∗ is a J element vector of latent depth of search, Γ is a J x J matrix of coefficients with
1's in the diagonal, I is a J x J identity matrix, 𝑋𝑖∗ is a matrix of exogenous variables to be defined
below, 𝛽 is a matrix of coefficients of the exogenous variables, and 𝜀𝑖 is a J element vector of
random errors. As shown in Appendix B, an extension of the framework presented in Ratchford,
et al. (2003) can be used to derive the system of equations in Equations 2 and 3 from the first-
order conditions for optimal allocation of effort to each source.

16
A more detailed version of the relationship described in Equation 3 is shown in Equation
4 (we drop the subscript for consumer i for clarity). In Equation 4 the matrix of γ coefficients
reflects the interrelationship between information sources, and positive values of ij represent
complements, while negative values represent substitutes. As explained earlier, this
interrelationship is an important aspect to consider in the used car market and directly relates to
the hypotheses under study.
* ' *12 13 141 1 11 1 1 1
* ' *21 23 242 2 22 2 2 2
* ' *31 32 343 3 33 3 3 3
* ' *41 42 434 4 44 4 4 4
00 0 0
00 0 0
00 0 0
00 0 0
ERy X y
ERy X y
ERy X y
ERy X y
(4)
Consumers’ depth of search is observed for dealer visit (y1*), print newspapers (y2
*), dealer
websites (y3*), and resale websites (y4
*).
In Equation 4, we divide the exogenous variables *
iX that affect the use of information
sources into two categories: Xi, which are common for all information sources, and ER, which
represent exclusion restriction variables which help to identify each equation. Kukar-Kinney et
al. (2009) demonstrate that the shopping and buying motivations may be a better predictor of
propensity to shop and buy online versus in stores. Therefore, specific variables were identified
that affect the shopping behavior of an individual on each source. These variables are:
consumers’ enjoyment of dealer visits, reading car magazines, price comparison, gathering
information and tendency to use the Internet. They are measured on a 5-point Likert scale. These
variables, along with the helpfulness of each source, are used as exclusion restrictions to identify
the model.
Table 7 shows the combination of variables that is used to identify each equation. For
instance, the equation for dealer visit is identified by eliminating variables marked with a zero in
Table 7 from the equation, and using only consumers’ enjoyment of store visit, talking to
salespeople and helpfulness of dealer visit in the equation. The latter three variables help to
identify the other equations since they are excluded from them. The “helpfulness” variable,
measured on a 5-point Likert scale, captures the usefulness of an information source in locating
used cars. “Helpfulness” of the source acts as a mediator variable to explain how some
demographic characteristics influence search and why some people use a particular source type.
Consider, for example, that older people are less adept at using the Internet to find information

17
and find it more helpful to physically inspect cars. Therefore they visit dealer lots. Here
“helpfulness” of the source explains the relationship between age and dealer visits. Using the
exclusion restriction variables, the system of simultaneous Tobit equations can be estimated.
<Insert Table 7 here>
Given the presence of zero values of ijy we have chosen to work with a Tobit model in
which we define yij* as latent search on information source j for consumer i. The rationale for
this modeling choice is as follows. The dependent variable, depth of search, is count data. A
Poisson regression model would be a natural choice to estimate the data, but the Poisson
distribution has variance equal to the mean, and as observed in the data, the variance is greater
than the mean. Another possibility is using a multivariate ordinal probit model to estimate the
parameters, but a critical assumption of the ordered probit is that of parallel slopes. This implies
that if a variable affects the likelihood of an individual being in a category, the coefficients
linking the variable to different outcomes are the same across outcomes. However, this
assumption is violated because we expect WOM, age, and consumers’ tendency to gather
information, to differ in their association with the use of different information sources.
Therefore, an ordinal model is not appropriate (Long 1997). On the other hand, the Tobit model
can handle zero values, assumes a normal distribution on the error terms which can be
generalized to a multivariate case, and can incorporate simultaneity. Taking into account the
censoring, multivariate use of information sources and simultaneity, the simultaneous equations
Tobit is appropriate.
To estimate the system of simultaneous equations with censored and limited dependent
variables in Equation 4, Cameron and Trivedi (2005) suggest obtaining a reduced form and
estimating it as a Tobit model. Then replace the regressors Yi in the structural model with their
reduced form predictors and estimate the regression model. However, prior literature (Albert and
Chib 1996; Chib 1992; Jang et al. 2010; Li 1998; Yang et al. 2006; Zellner 1996) suggests that
we can employ Gibbs sampling and data augmentation to draw the exact posterior. The linear
simultaneous equation model (SEM) is estimated conditioned on the augmented data which leads
to a Markov chain Monte Carlo (MCMC) solution (Gelfand et al. 1992; Jang et al. 2010; Li
1998; Tanner and Wong 1987). This avoids a direct evaluation of the non-trivial likelihood
function (Li 1998) and avoids the use of two-step estimation approach. Using latent data
augmentation and MCMC estimation facilitates recovery of structural parameters of an over-
18
identified system (Jang et al. 2010) and the variance of the estimates need not be corrected for,
unlike the two step estimation of simultaneous equations model. Therefore, we follow the
Bayesian estimation as suggested in the prior literature.
To resolve the simultaneity issue, the γ coefficients are estimated using a Metropolis
Hastings algorithm random walk chain. Once the γ coefficients are obtained they are rearranged
to form the Г matrix. A noted above, Г is a J x J matrix whose diagonal elements are 1 and off-
diagonal elements are coefficients of other endogenous variables.
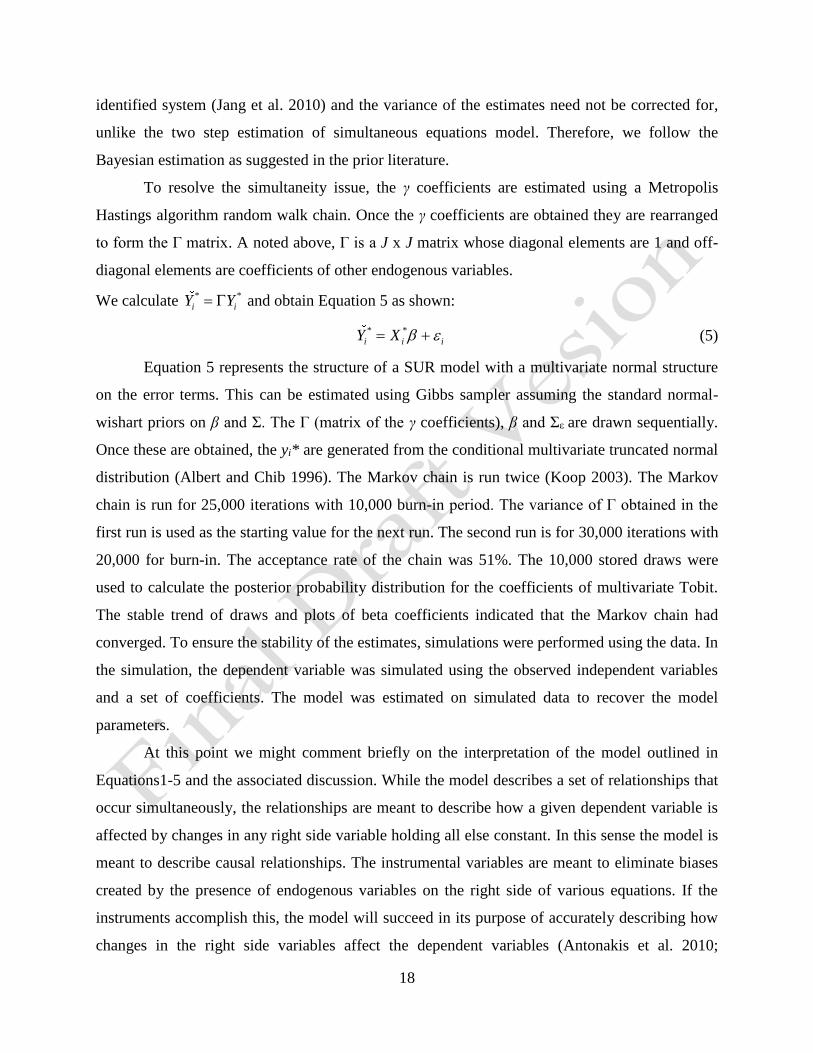
We calculate * *
i iY Y and obtain Equation 5 as shown:
* *
i i iY X (5)
Equation 5 represents the structure of a SUR model with a multivariate normal structure
on the error terms. This can be estimated using Gibbs sampler assuming the standard normal-
wishart priors on β and Σ. The Г (matrix of the γ coefficients), β and Σε are drawn sequentially.
Once these are obtained, the yi* are generated from the conditional multivariate truncated normal
distribution (Albert and Chib 1996). The Markov chain is run twice (Koop 2003). The Markov
chain is run for 25,000 iterations with 10,000 burn-in period. The variance of Г obtained in the
first run is used as the starting value for the next run. The second run is for 30,000 iterations with
20,000 for burn-in. The acceptance rate of the chain was 51%. The 10,000 stored draws were
used to calculate the posterior probability distribution for the coefficients of multivariate Tobit.
The stable trend of draws and plots of beta coefficients indicated that the Markov chain had
converged. To ensure the stability of the estimates, simulations were performed using the data. In
the simulation, the dependent variable was simulated using the observed independent variables
and a set of coefficients. The model was estimated on simulated data to recover the model
parameters.
At this point we might comment briefly on the interpretation of the model outlined in
Equations1-5 and the associated discussion. While the model describes a set of relationships that
occur simultaneously, the relationships are meant to describe how a given dependent variable is
affected by changes in any right side variable holding all else constant. In this sense the model is
meant to describe causal relationships. The instrumental variables are meant to eliminate biases
created by the presence of endogenous variables on the right side of various equations. If the
instruments accomplish this, the model will succeed in its purpose of accurately describing how
changes in the right side variables affect the dependent variables (Antonakis et al. 2010;

19
Heckman and Vytlacil 2007, 2008). However, given that we have cross sectional data, it is
difficult to determine whether the use of instruments has eliminated biases due to endogeneity, or
whether other sources of bias such as omitted variables are present. We return to this topic in our
limitations section.
Results
The analysis reveals some interesting insights about the determinants of search and the
use of online sources in the used car market. Table 8 summarizes the hypotheses and whether
these are supported or rejected.
<Insert Table 8 here>
Online and Offline Search
Results for the relationships between the four information sources are presented in Table
9. Because the usage of each source differs considerably, the regression coefficients in Table 9
are not directly comparable. Thus we also calculated mean-value elasticities (denoted as E
below) for each estimate. Since they are the ratio of percentage changes, they are dimensionless,
and therefore comparable.
Table 9 indicates that, contrary to new-car based findings in the prior literature, offline
search using dealer visits is positively related to search on dealer websites (β = 0.59, E = .37).
Search on offline print source is also positively associated with search on dealer websites (β =
1.89, E = .20) as well as resale websites (β = 0.59, E = .06). Thus we find support for H1. Table
9 also indicates that search on dealer websites is strongly related to dealer visits (β = 0.78, E =
1.27), as well as search in print (β = 0.53, E = 4.99) thus supporting hypothesis H2a.5 Consistent
with buyers who wish to buy from a dealer obtaining information from dealer web sites about
cars available at different dealers, users of many dealer websites also tend to visit multiple
dealers. This is consistent with prior findings that for expensive products, retail websites play an
informational role and online search and offline purchases are complements (Pauwels et al.
2011). The positive relationships between use of print and use of dealer and resale web sites, and
between dealer and resale web sites, suggests that consumers tend to cast their net widely in
efforts to locate suitable cars. Consistent with the existence of uncorrelated information across
these three source types, many appear to find it necessary to consult all three, tending to make
them complements.
5 The relatively high elasticities for print result from its relatively small mean (see Table 9).

20
<Insert Table 9 here>
The negative relationships between resale websites and dealer visits (β = -0.28, E = -.51),
and between resale websites and traditional print (β = -0.05, E = -.52), provide support for H3b.
Similarly, dealer visits are negatively associated with search on resale websites (β = -1.65, E = -
.91). These findings indicate that resale websites substitute or print and dealer visits, possibly
because they are used to locate prospective individual sellers.
Table 9 shows an asymmetric impact of search within the online medium. Search on
dealer websites is positively associated with search on resale websites (β = 0.24, E = .21)
supporting hypothesis H4a. Search on resale websites is negatively associated with search on
dealer websites (β = -0.02, E = -.02) supporting hypothesis H4b. While significant, the elasticity
indicates that the latter effect is small. This asymmetric effect is possible because of different
exogenous influences on the two types of sites, i.e., heavy users of the two sites tend to be
different people. For example, the effects of exogenous factors that are presented in Table 10 (to
be discussed below) indicate that users of dealer websites tend to be higher wage, younger, and
non-users of word of mouth. They also tend to use resale web sites, but are probably not the
heaviest users of such sites. The latter tend to rely extensively on word of mouth, search a lot of
different models, and tend to have lower wage and income than heavy users of dealer web sites
(see Table 10 and discussion below). On balance these results suggest that younger, higher
income buyers who tend to buy from a dealer use all online sources, but not word of mouth.
Other users of resale sources appear to be searching for a car from an individual reseller, and to
also use word of mouth in this endeavor, but to have little interest in dealer sources.6
The results above show that in used markets, consumers evaluate the different online
sources as distinct from one another. Hence, the direction of association of online and offline
search differs based on the source. Furthermore, the dealer sources are complementary, which
suggests that search in used durable goods markets is different from that in new durable goods
markets.
Consumer characteristics
Table 10 shows that consumers’ resource constraints, measured by consumers’ wage rate,
are negatively associated with offline search (β = -0.65, -0.48 for dealer visits and print,
6 As a reviewer suggested, another reason why users of resale web sites may be less likely to search dealer web sites
is that dealers tend to list their offerings on resale web sites. This would limit the need to consult dealer sites.

21
respectively), but positively associated with search on dealer websites (β = 0.91). Table 10
further shows that age has a strong positive relation to dealer visits (β = 0.48, E = 5.57) and
search using traditional print (β = 0.42, E = 28.22). We find that older consumers are less likely
to search online (β = -0.82, E = 5.91; -0.39, -2.50 for dealer and resale websites respectively). As
noted above, we also find that word of mouth is positively associated with visiting dealers, and
search on resale websites (β = 0.47, 0.72 respectively) and negatively associated with search on
dealer websites (β = -0.35). To interpret the relationships for dealer visits, it must be kept in mind
that use of dealer websites is strongly related to dealer visits, and that use of dealer websites is
also positively related to wages and inversely related to age and word of mouth (see Table 9).
Thus dealer visits appear to be generated from two sources: younger, higher wage, consumers
who use dealer websites, and older, lower wage, consumers who may rely on traditional print
and word of mouth. This interpretation is consistent with findings in the literature on new car
search.
<Insert Table 10 here>
As to other results in Table 10, consumers’ experience with used cars does not have a
significant relationship with offline or online information search. The number of models
considered is positively associated with online search and negatively associated with offline
search.7 This finding suggests that Internet offers higher convenience as well as efficiency gains
to consumers considering a greater number of models. Another finding is that consumers’
tendency to gather information is positively associated with search on dealer websites as well as
resale websites (β = 0.27, 0.46 respectively) and negatively associated with search using
traditional print (β = -0.17).8
Choice of Seller Type
As indicated by the model presented in Appendix B, consumers in our study are assumed
to choose the mix of information sources that optimizes their gain from information. Thus their
choice of information sources should be tailored to the seller type and car type that best fits their
7 Number of models considered refers to the number of different makes and models considered for purchase. This
measure does not account for the possibility that a buyer may search among many different cars of a given make and
model. 8 As the term implies, the key assumption is that the various exclusion restriction variables are uncorrelated with the
error terms of the equations that they are excluded from, making them valid instruments in these equations. For
example helpfulness of the dealer should be uncorrelated with the error term in the other three equations. Since the
restriction variables pertain to specific sources, this assumption seems reasonable.

22
needs. Observed choices of seller types should therefore be consistent with the search patterns
found in this study. For example, those who use dealers and dealer web sites in their search
should be more likely to buy at a dealer; those who rely on resale web sites should be more likely
to buy from an independent seller. In this section we examine whether this is the case.
The choice of a specific seller type is called “seller choice” and is used as the dependent
variable for this analysis. Using a logit choice model, the impact of information source use on
seller choice is analyzed. Seller choice is measured as the seller type from which the most recent
used car has been purchased. It is coded as 1 if the used car was purchased from a new car
dealer, 2 if purchased from a used car dealer, 3 if purchased from a used car superstore, and 4 if
purchased from an individual. Purchase from an individual seller is used as the base category.
The explanatory variables are the depth of search on offline and online sources. We
control for seller trustworthiness and for the demographic characteristics of the buyers. The
demographic characteristics are incorporated by interacting them with the choice dummy
variable. Trustworthiness is specific to a seller and measured as competency of the seller, ability
of the seller to deliver its promise, quality of cars, dependability and concern about customers.
These variables have been measured on 5-point Likert scales based on Bruner et al. (1996).
The results are presented in Table 11. The results show that those who buy from
independent sellers are more likely than others to use resale websites, and. less likely to make
dealer visits. Those who buy from individual sellers also tend to be younger, consider more
models, and to buy cheaper cars. These findings are consistent with our conjecture those who use
resale web sites tend to be looking for in inexpensive car from an individual seller, and are not
interested in dealer sources, possibly because dealers sell more expensive cars (see Table 11).
<Insert Table 11>
Conversely, those who buy from dealers tend to visit more dealers, buy more expensive
cars, and to be older than those who buy from individual sellers. Except for superstores, they
tend to consider fewer distinct makes and models than those who buy from individual sellers;
since superstores sell a wide variety of cars, they make it easy to search for a variety of makes
and models. Those who buy from superstores and used car dealers tend to have a lower wage
than those who buy from individual sellers, even though these dealer customers tend to buy more

23
expensive cars. Possibly they do not trust individual sellers. Finally use of dealer (retail) web
sites does not appear to have a significant relation to buying from a given dealer type.9
Conclusions
In this study we investigate online and offline search in used durables markets,
specifically the market for used cars. Prior research, in the context of new automobile purchases,
finds that online search substitutes for offline search, with the greatest impact being on dealer
visits. This literature does not distinguish between search on dealer websites and search on resale
websites. However, the latter are typical for used markets, and are widely used by consumers.
The information sources in this study are grouped into dealer visit, print, dealer websites,
and resale websites. Search on manufacturer websites is grouped together with search on dealer
websites because manufacturer websites typically route consumers to dealer websites for used
car listings. Resale websites include newspaper websites, auction websites, third party websites
and local community websites. Resale websites are used by consumers to contact different dealer
types directly or indirectly to request price quotes.
How does search on dealer and resale websites affect offline search? Based on the
existing studies of search in different sources, we formulate several hypotheses. We develop and
estimate a simultaneous equations Tobit model using survey data. In addition, we explore the
choice of seller type using a conditional logit model.
The results show that for used cars, dealer websites are complementary to dealer visits. In
contrast, many prior studies on new car search have found them to be substitutes. Search on
resale websites, however, is a substitute for dealer visits. In the online medium, dealer websites
and resale websites have an asymmetric association. Conversely dealer visit and print are
substitutes to each other. For consumer characteristics such as age, wage and number of models
considered, the direction of association on search differs in the online and offline medium.
The findings of this study have practical implications for dealers. Prior studies looked at
the impact of the Internet’s entry on search in traditional sources. The present study highlights
the significance of disaggregate Internet sources, specifically the importance of web presence for
dealers. Consumers who gather information, engage in price comparison, consider more makes
and models and consult word of mouth are likely to search online. Dealers can facilitate
9 The relation between dealer web sites and buying from a used car dealer is is significant at the 10% level.

24
information gathering activity by providing information, such as on inspection and maintenance
as well as online reviews and recommendations of used cars. Dealers can emphasize dynamic
updating of online inventory to increase its reliability for consumers. Dealers can offer incentives
or online specials to encourage consumers using resale websites to buy from dealers and not
individual sellers.
Second, our study finds that word of mouth is positively associated with search for used
cars on dealer lots. This suggests that prior customers may be a source of directing consumers to
buy from dealers. On the other hand, word of mouth is negatively associated with search for used
cars on dealer websites. This implies that dealers need to generate website traffic by employing
social media marketing tools and generating positive publicity through blogs of opinion leaders.
Dealers should emphasize high standards of customer service to get positive word of mouth.
Third, dealers can target customers based on consumer demographics and information
source use. Those who purchase from a dealer appear to fall into two groups: younger buyers
who focus their search on the web, who do not use word of mouth extensively, and have a high
wage; older consumers who rely extensively on dealer visits and word of mouth, and have a
lower wage.
Our analysis also suggests that time constrained (higher wage) individuals are more likely
to search on dealer websites, make fewer dealer visits, and buy either from new car dealers or
individual sellers. If they buy in a higher price range, they are more likely to buy from a dealer.
These findings are broadly consistent with earlier results that indicate that time constrained
consumers tend to search less and buy high quality brands (Nowlis 1995; Putrevu and Ratchford
1997). The general conclusion is that new car dealers can target their relatively high quality, high
price offerings at older buyers who may not search extensively online unless they have a high
income. The latter underscores the need to have an effective web site, as does the general
relationship between dealer website use and dealer visits. Older consumers are relatively less
experienced with using the Internet for tasks such as car shopping, compared to being more
experienced with traditional sources. However, an implication is that as each new cohort of
consumers ages, they will be more Internet savvy, which suggests that dealers should continue to
maintain a robust online presence. At the same time, dealer websites can be made friendlier for
older consumers, such as giving the option to get in touch with a consumer specialist if any
questions or confusion should arise.

25
Finally, our results also indicate how individual sellers can target their offerings. Those
who buy from an individual seller tend to be younger, buy in a lower price range, consider more
models, and use resale web sites. In turn, users of resale web sites also tend to use word of
mouth and other sources, with the exception of dealer visits. The latter suggests dealers and
individual sellers do not generally compete directly. Individual sellers are well advised to post
their offerings on resale web sites frequented by younger prospects.
Limitations & Future Research
This study is an initial empirical investigation of information search in the used car
market on cross sectional data. It is subject to the limitations of cross sectional data as a vehicle
for drawing causal inferences. For example, it is possible that the number of models considered
and helpfulness variables are a function of information search rather than a predictor of it,
instruments might not be uncorrelated with the error terms of equations from which they are
excluded, common method bias may be present, or the model may be misspecified in some other
way. Moreover the cross sectional design precludes a detailed examination of heterogeneity, and
we have no information on the order in which the various information sources were consulted.
Our results need to be interpreted with these possible limitations in mind, and further research
that addresses them would be useful. In particular, an attempt to track a panel of potential buyers
as they proceed through their search along the lines of Erdem, et al. (2005) might resolve some
of the problems noted above. For example, such panel data would make it possible to examine
possible lead-lag relationships in the search process (Pierce and Haugh 1977), providing
evidence of temporal precedence as a basis for making causal inferences. The challenge in
setting up such a panel rests with identifying a sample of prospective buyers who are early in
their process of searching for a used car.

26
Appendix A. Survey of Used Car Buyers (2010)
1. Where was the car listed/located?
[ ] Newspaper (print) [ ] Website (Please specify the name_____________________)
[ ] Dealer Visit [ ] Other (Please specify________________________________)
2. Please provide the following information about your recently purchased used car.
Year_______ Make _____ Model _______ Miles on the car _______Trim _____ Buy [ ] Lease [ ]
[e.g. 2007] [e.g. Ford] [ e.g. Focus] [ e.g. 70000 miles] [ e.g. LE, SX]
3. Did you buy/lease car from:
[ ] Individual (unknown) owner [ ] Family member/friends/relatives [ ] Colleague
[ ] Used car superstore [ ] New Car dealer [ ] Used Car Dealer
Please mention Dealer/superstore name (if applicable) _____________________
1. When you first seriously thought about purchasing your recent used car:
i. Did you know which specific make and model you wanted to buy?
[ ] Definitely Yes [ ] Was not sure [ ] Definitely No
ii. Did you know which specific seller you wanted to buy from?
[ ] Definitely Yes [ ] Was not sure [ ] Definitely No
iii. Were you interested in collecting information on what make and model to buy?
[ ] Extremely Interested [ ] Somewhat Interested [ ] Not Interested
iv. Were you interested in information on best price of a particular car?
[ ] Extremely Interested [ ] Somewhat Interested [ ] Not Interested
2. Please number the following options in the order in which you searched for your recent used car.(i.e. 1,2,3)
(i) I searched to narrow down makes and models considered [ ]
(ii) I searched for used cars from the models that I selected [ ]
(iii) I evaluated the selected cars and chose one [ ]
(iv) Please specify if you searched in any other way______________________________
3. Which makes and models did you seriously consider for purchase and in what price range? (Please list them
below).
Make Model Approximate Price Range
EXAMPLE: Honda Accord $2000-$5000
a. ___________________ __________________ __________________
b. ___________________ __________________ __________________
c. ___________________ __________________ ___________________

27
4. Can you tell us how much time you allocated to the following activities and how helpful was each activity in
searching for information? (Please write the approximate time spent in hours and minutes for activities that
apply.)
Rating Scale
Activities to learn about Makes and models Approximate Time
spent
Not
Very
Helpful
Very Helpful
i Reading car articles/ratings in print ______hours ____minutes 1 2 3 4 5
ii Dealer visits ______hours ____minutes 1 2 3 4 5
iii Talking to friends /coworkers /
relatives/individuals
______hours ____minutes 1 2 3 4 5
iv Talking to your spouse (if applicable) ______hours ____minutes 1 2 3 4 5
v Auto magazines’ Websites
(e.g. www.caranddriver.com)
______hours ____minutes 1 2 3 4 5
vi Bulletin Board/Chat Online
(e.g. www.Yahoo!Auto.com)
______hours ____minutes 1 2 3 4 5
vii Information Services Websites
(e.g.www.consumerreports.org,KBB.com)
______hours ____minutes 1 2 3 4 5
viii Blogs (e.g. http://blog.iseecars.com) ______hours ____minutes 1 2 3 4 5
ix Manufacturer Web sites
(e.g.www.ford.com)
______hours ____minutes 1 2 3 4 5
x Dealer Websites (e.g.
www.sewellhonda.com)
______hours ____minutes 1 2 3 4 5
xi Online referral websites
(e.g.autobytel.com, autos.msn.com)
______hours ____minutes 1 2 3 4 5
Rating Scale
Activities to find/locate used cars for purchase
Approximate Time
spent
Not
Very
Helpful
Very Helpful
i Reading newspapers in print ______hours ____minutes 1 2 3 4 5
ii Newspaper websites ______hours ____minutes 1 2 3 4 5
iii Classified advertisements ______hours ____minutes 1 2 3 4 5
iv Through
friends/coworkers/relatives/individuals
______hours ____minutes 1 2 3 4 5
v Dealer Visits ______hours ____minutes 1 2 3 4 5
vi Manufacturer Web sites (e.g.
www.ford.com)
______hours ____minutes 1 2 3 4 5
vii Dealer Websites (e.g.
www.dallasdodge.net)
______hours ____minutes 1 2 3 4 5
viii Used car superstore websites
(e.g.carmax.com)
______hours ____minutes 1 2 3 4 5
ix Online referral websites (e.g.
autobytel.com)
______hours ____minutes 1 2 3 4 5
x Third party websites (e.g.
www.cars.com,KBB )
______hours ____minutes 1 2 3 4 5
xi Auction websites (e.g. www.ebay.com) ______hours ____minutes 1 2 3 4 5
xii Local websites (e.g.
www.craigslistdallas.com)
______hours ____minutes 1 2 3 4 5

28
5. Please tell us the number of different sources that you personally checked to find used cars from each of the following sources? (Please circle one number for the type of source consulted.)
Websites Number of different websites visited
i Newspapers websites
(e.g. www.dallasnews.com)
0 1 2 3 4 5 6 7 8 9 10 More than 10 (Please specify______)
ii Manufacturer websites (e.g. www.Ford.com) 0 1 2 3 4 5 6 7 8 9 10 More than 10 (Please specify______)
iii Dealer websites (e.g. www.dallasdodge.net) 0 1 2 3 4 5 6 7 8 9 10 More than 10 (Please specify______)
iv Used car superstore websites (e.g. carmax.com)
0 1 2 3 4 5 6 7 8 9 10 More than 10 (Please specify______)
v Online referral websites (e.g. www.autos.msn.com)
0 1 2 3 4 5 6 7 8 9 10 More than 10 (Please specify______)
vi Third party websites (e.g. www.cars.com) 0 1 2 3 4 5 6 7 8 9 10 More than 10 (Please specify______)
vii Auction websites (e.g. www.ebay.com) 0 1 2 3 4 5 6 7 8 9 10 More than 10 (Please specify______)
viii Local websites (e.g. www.craigslistdallas.com) 0 1 2 3 4 5 6 7 8 9 10 More than 10 (Please specify______)
Print Number of different Newspapers
i Newspapers in print 0 1 2 3 4 5 6 7 8 9 10 More than 10 (Please specify______)
6. Please tell us how you feel about the following statements related to your shopping experience:
Strongly Strongly Disagree Agree
i. I frequently use internet to obtain information about products I am interested in. 1 2 3 4 5
ii. I enjoy visiting stores before I make a purchase. 1 2 3 4 5
iii. I really enjoy talking to salespeople before I make a purchase. 1 2 3 4 5
iv. I do a lot of price comparison when making larger purchases. 1 2 3 4 5
v. I read car enthusiast magazines regularly. 1 2 3 4 5
vi. I like to gather as much information as possible before I visit car dealers. 1 2 3 4 5
vii. Overall I really enjoy shopping before I make a purchase. 1 2 3 4 5
7. Do you have internet access at (i) WORKPLACE [ ] Yes [ ] No (ii) HOME /PUBLIC PLACE [
] Yes [ ] No
8. What is your age? [ ] 20 years or younger [ ] 31 to 40 years [ ] 51-60 years
[ ] 21 to 30 years [ ] 41-50 year [ ] more than 60 years
12. Number of years of formal education that you have completed.
(Please circle one) 8 9 10 11 12 13 14 15 16 17 18 19 20 21 22+
High School Undergraduate Graduate
13. Number of children presently in your household. (Include only those in your house.) __________
14. Total number of cars in your household at present (including your recent used car). _________
15. Number of years that you have lived in the area of your current residence (e.g. City of Plano). ___
16. What is your approximate hourly wage?
Please check one [ ] None [ ] $5-$10 [ ] $16-$20 [ ] $26-$30 [ ] $51-$70
[ ] Under $5 [ ] $11-$15 [ ] $21-$25 [ ] $31-$50 [ ] Above $70
Note: The complete survey questionnaire is available from the authors upon request.

29
Appendix B. Derivation of Empirical Model
As noted in the literature review, existing models of the choice of information sources do
not readily accommodate complementarity. However, in this appendix we will show that the
model employed in estimation in this study can readily be derived from the framework presented
in Ratchford, Lee and Talukdar (2003) – hereafter RLT. In the model of RLT, a consumer
allocates time t among J sources to maximize the expected gain to search in the face of a cost per
unit of time, w. The expected gain to search is the product of the maximum possible gain, g, and
the fraction of the maximum that is produced by the time allocation, I. Since I varies between 0
and 1, it is represented by a function that is restricted to this range, and exhibits diminishing
returns: ( )1 S FI e , where S represents prior information and F is a function relating time
with each source to I. RLT define ln( )j jjF a t , where tj is time allocated to source j, and aj
is a weight reflecting the productivity of the source. Putting these components together leads to
the following maximization problem:
1 1
[ ln( )]
,..., ,...,max max (1 )
j jj
J J
S a t
j jj jt t t tgI w t g e w t
. (B1)
While this model has a particularly simple solution in which the share of each source is
equal to its relative productivity, j j j jj jt t a a , it has the IIA property, and, because of
the separable form of F, does not accommodate complements.
A model that does accommodate complements can readily be adapted to the above
framework if F is defined with interaction terms. As it eliminates problems of dealing with log of
zero being undefined, we adopt a linear-quadratic form, (1 / 2)j j jk j kj j kF a y b y y .10
Here we use yj instead of tj to reflect the fact that the consumer’s allocation problem is to allocate
numbers of sources of a given type, yj, rather than time. The cost of accessing a source is now wj,
allowing it to vary across sources (accessing a dealer is likely to be much more expensive than
accessing the dealer’s web site). Finally we add Lagrange multipliers to represent the constraint
that yj is nonnegative. Given these modifications the counterpart to Equation 1 becomes:11
10 Subtracting the quadratic term requires that the coefficients 𝑏𝑗𝑗 of the 𝑦𝑗
2 terms be positive. 11 We suppress a subscript to represent consumer to simplify notation. However it should be understood that this is a
model of an individual consumer.

30
( (1/ 2) )
max max (1 ) ( )j j jk j kj j k
S a y b y y
j j j j j j jj j jgI w y y g e w y
. (B2)
Assume for simplicity that the coefficients of the quadratic terms are symmetric, i.e.,
jk kjb b . Differentiating with respect to each yj gives a set of J first-order conditions of the form:
( ) ( ) 0S F
j jk k j jkge a b y w (B3)
Differentiating with respect to each j gives another set of J first-order conditions of the
form yj = 0, which must be the case if j is nonzero.
Denote the gains realized from search as ( )* (1 )S Fg g e , which implies that
( ) *S Fge g g , the difference between the maximum possible gain, g, and the actual gain, g*.
One of the bjk terms in Equation B3 must be set to a constant to identify the model. We scale the
coefficient of the derivative of the quadratic term to one by dividing both sides of Equation B3
by bjj. After doing this, substituting *g g for ( )S Fge and rearranging terms, we get a
modified version of Equation B3:
1
*
jk j j
j j jk jjj jj
b wy y a
b b g g
(B4)
In the absence of the interaction terms in F, the yi terms would disappear and a single
equation would suffice to describe the demand for a given source. Existence of the interaction
terms means that the entire system of J equations has to be solved.12 Define as a J J matrix
of coefficients, with one in the diagonal and /jk jjb b on the off-diagonals, Y as a 1J vector
with elements yj, as a 1J vector with elements ja , as a 1J vector with elements
/j jjb , and W as a 1J vector with elements /j jjw b . Then the J first order conditions in
Equation 4 can be expressed in matrix form as,
( ) / ( *)Y W g g . (B5)
This defines the maximum when second order conditions are fulfilled, which requires the
jjb terms to be positive, and the determinant of be positive definite. An alternative way to
express Equation 5 is as a system of J equations with each yj as a dependent variable:
( ) ( ) / ( *)Y Y W g g (B6)

31
where the matrix has zeros in the diagonal.
The vectors and / ( *)W g g should vary across the sample with consumer
characteristics. should vary with factors associated with increased efficiency of using a
source, such as perceptions of its helpfulness, experience, and enjoyment. The efficiency of
using online sources should increase with Internet use. Since it is related to experience, the
efficiency of using some sources might increase with age. However, to the extent that older
people are less adept at using technology, the efficiency of using online sources might decrease
with age. W should vary with factors related to search costs. While *g g should decrease with
prior information, it might also be related to experience and age. Such decreases should lessen
search. However, we argued earlier that prior information might not be useful for many aspects
of search for used cars, such as locating and inspecting currently available models. In sum,
and / ( *)W g g should vary cross-sectionally with relevant consumer characteristics:
* */ ( )i i i i i iW g g X (B7)
where the subscript i refers to consumer, *
iX denotes consumer characteristics, is a matrix of
regression coefficients, and i is a random error term. Substituting Equation B7 into B5, and
rearranging gives:
Γ𝑌𝑖 = 𝜆𝑖 + 𝑋𝑖∗𝛽 + 𝜀𝑖. (B8)
For elements of 𝑌𝑖 that are > 0, the corresponding element of 𝜆𝑖 = 0. However for
elements of 𝑌𝑖 that are zero, there is a corner solution and the corresponding element of 𝜆𝑖 is a
latent variable that removes the inequality produced by the corner solution. Accordingly, we
define the relationship between consumers’ latent search on source j and the observed depth of
search using source j as:
* *
*
if 0,
0 if 0.
ij ij
ij
ij
y yy
y
(B9)
Define the vector of latent elements 𝑦𝑖𝑗∗ as 𝑌𝑖
∗. Then consumer i’s use of J sources can be
expressed in matrix form as:
* *
i i iY X (B10)
or equivalently as:
* * *( )i i i iY Y X (B11)

32
Equations B9-B11 are Equations 1-3 in the text. To derive Equation 4 in the text from B11, we
define jk jk jjb b . Because of the normalization by jjb generally jk kj .

33
References
Akerlof, George A. (1970), “The Market for ‘Lemons’: Quality Uncertainty and the Market
Mechanism,” Quarterly Journal of Economics, 84 (3), 488–500.
Albert, Jim and Siddhartha Chib (1996), “Computation in Bayesian Econometrics: An
Introduction to Markov Chain Monte Carlo,” Advances in Econometrics, 11(A), 3–24.
Antonakis, John, Samuel Bendahan, Philippe Jacquart, and Rafael Lalive (2010), “On making
Causal Claims: A Review and Recommendations,” Leadership Quarterly, 21(6), 1086-
1120.
Bakos Yannis (1998), “The Emerging Role of Electronic Marketplaces on the Internet,”
Communications of the ACM, 41(8), 35-42.
Bruner, Gordon C., Paul J. Hensel and Karen E. James (1996). Marketing Scales Handbook: A
Compilation of Multi-item Measures, Vol. 2, Chicago: AMA.
Chen, Kay-Yut, Murat Kaya and Özalp Özer (2008), “Dual Sales Channel Management with
Service Competition,” Manufacturing and Service Operations Management, 10(4), 654–
675.
Cameron, Colin A. and Pravin K. Trivedi (2005), Microeconometrics: Methods and
Applications, NY: Cambridge University Press.
Chib, Siddhartha (1992), “Bayesian Inference in the Tobit Censored Regression Model,” Journal
of Econometrics, 51, 79–90.
Dowling G. R. and Richard Staelin (1994), “A Model of Perceived Risk and Intended Risk-
Handling Activity,” Journal of Consumer Research, 21(1), 119-134.
Erdem, Tulin, Michael P. Keane, T. Sabri Öncü and Judi Strebel (2005), “Learning about
computers: An analysis of information search and technology choice,” Quantitative
Marketing and Economics, 3(3), 207-247.
Furse, David H., Girish N. Punj and David W. Stewart (1984), “A Typology of Individual Search
Strategies among Purchasers of New Automobiles,” Journal of Consumer Research,
10(4), 417-431.
Gelfand, Alan E., Adrian F. M. Smith and Tai-Ming Lee (1992), “Bayesian Analysis of
Constrained Parameter and Truncated Data Problems using Gibbs Sampling,” Journal of
the American Statistical Association, 87(418), 523-532.
Grewal, Dhruv, Gopalkrishnan R. Iyer, Radha Krishnan and Arun Sharma (2003), “The Internet
and the Price–Value–Loyalty chain,” Journal of Business Research, 56 (5), 391-398.
Heckman, James J., and Edward J. Vytlacil (2007), "Econometric evaluation of social programs,
part I: Causal models, structural models and econometric policy evaluation," Handbook
of Econometrics 6, 4779-4874.
(2008), “Econometric causality,” International Statistical Review, 76(1),1-27.
Jang, Sungha, Ashutosh Prasad and Brian T. Ratchford (2010), “Consumer Spending Patterns
across Firms and Categories: Application to the Size and Share of Wallet,” UT Dallas
working paper.

34
Kim, Jung Seek and Brian T. Ratchford (2012), “Consumer Choice and Use of Multiple
Information Sources for Automobile Purchases,” International Journal of Electronic
Commerce, 16(3), 7-40.
Klein, Lisa R. and Gary T. Ford (2003), “Consumer search for Information in the Digital Age:
An Empirical Study of Prepurchase Search for Automobiles,” Journal of Interactive
Marketing, 17(3), 29-49.
Koop, Gary (2003). Bayesian Econometrics, Hoboken, NJ: Wiley.
Kukar-Kinney, Monika, Nancy M. Ridgway and Kent B. Monroe (2009), “The relationship
between Consumers’ Tendencies to Buy Compulsively and their Motivations to Shop and
Buy on the Internet,” Journal of Retailing, 85(9), 298-307.
Li, Kai (1998), “Bayesian Inference in a Simultaneous Equation Model with Limited Dependent
Variables,” Journal of Econometrics, 85, 387-400.
Long, J. Scott (1997). Regression Models for Categorical and Limited Dependent Variables,
Vol.7, Thousand Oaks, CA: Sage Publications.
Moorthy, Sridhar, Brian T. Ratchford and Debabrata Talukdar (1997), “Consumer Information
Search Revisited: Theory and Empirical Analysis,” Journal of Consumer Research,
23(4), 263-277.
Nowlis, Stephen M (1995), “The Effect of Time Pressure on the Choice between Brands that
Differ in Quality, Price, and Product Features,” Marketing Letters, 6(4), 287-295.
Pauwels, Koen, Peter S.H. Leeflang, Marije L. Teerling and K.R. Huizing (2011), “Does Online
Information drive Offline Revenues? Only for specific Products and Customer
Segments!” Journal of Retailing, 87(1), 1-17.
Pierce, David A. and Larry D. Haugh (1977), “Causality in Temporal Systems: Characterizations
and a Survey,” Journal of Econometrics, 5, 265-293.
Punj, G. J. and R. Staelin (1983), “A Model of Consumer Information Search Behavior for New
Automobiles,” Journal of Consumer Research, 9(4), 366-80.
Putrevu, Sanjay and Brian T. Ratchford (1997), “A Model of Search Behavior with an
Application to Grocery Shopping,” Journal of Retailing, 73(4), 463-486.
Ratchford, Brian T. and Narasimhan Srinivasan (1993), “An Empirical Investigation of Returns
to Search,” Marketing Science, 12(1), 73-87.
, Debabrata Talukdar and M. Lee (2001), “A Model of Consumer Choice of the
Internet as an Information Source,” International Journal of Electronic Commerce, 5(3),
7-21.
, Myung-Soo Lee and Debabrata Talukdar (2003), “Impact of the Internet on
Information Search for Automobiles,” Journal of Marketing Research, 40(2), 193–209.
, Debabrata Talukdar and Myung-Soo Lee (2007), “The impact of the Internet
on Consumers’ use of Information Sources for Automobiles,” Journal of Consumer
Research, 34(1), 111-119.
(2008), “Consumer Search Behavior and its Effect on Markets,” Foundations
and Trends in Marketing, 3(1), 1-74.

35
Sarvary, Miklos and Philip M. Parker (1997), “Marketing information: A competitive analysis.”
Marketing Science, 16(1), 24-38.
Srinivasan, Narasimhan and Brian T. Ratchford (1991), “An Empirical Test of a Model of
External Search for Automobiles,” Journal of Consumer Research, 18(2), 233-242.
Stone, Robert N. and Kjell Grønhaug (1993) “Perceived Risk: Further Considerations for the
Marketing Discipline,” European Journal of Marketing, 27(3), 39-50.
Tanner, Martin A. and Wing Huang Wong (1987), “The Calculation of Posterior Distributions by
Data Augmentation,” Journal of the American Statistical Association 82(398), 528-500.
Yang, Sha, Vishal Narayan and Henry Assael (2006), “Estimating the interdependence of
television program viewership between spouses: A Bayesian simultaneous equation
model,” Marketing Science, 25(4), 336-349.
Zellner, Arnold (1996), Introduction to Bayesian Inference in Econometrics, New York: Wiley.
Zettelmeyer F., F.M. Morton and Jorge Silva-Risso (2006), “How the Internet Lowers Prices:
Evidence from Matched Survey and Automobile Transaction Data,” Journal of
Marketing Research, 43, 168–181.

36
Table 1
Literature Review
Literature Findings
Search Offline
Furse et al. 1984
Srinivasan &Ratchford 1991
Moorthy et al. 1997
Size of the feasible set impacts search.
Inverted U shaped relation between
knowledge and search.
Hauser et al. 1993 Examine consumers’ allocation of time
and find the value of an information
source.
Search Offline or one Online Medium
Klein & Ford 2003
Ratchford et al. 2003
Ratchford et al. 2007.
Pauwels et al. 2011
Examine the impact of Internet on search:
Internet substitutes for offline search.
Website presence and (non- price)
online communications improve offline
revenue performance more for sensory
products.
Search Offline or Multiple Online Media
Present Study Examines disaggregate impact of online
search:
Search on resale websites substitutes for
offline search.
Search on dealer websites complements
offline search.
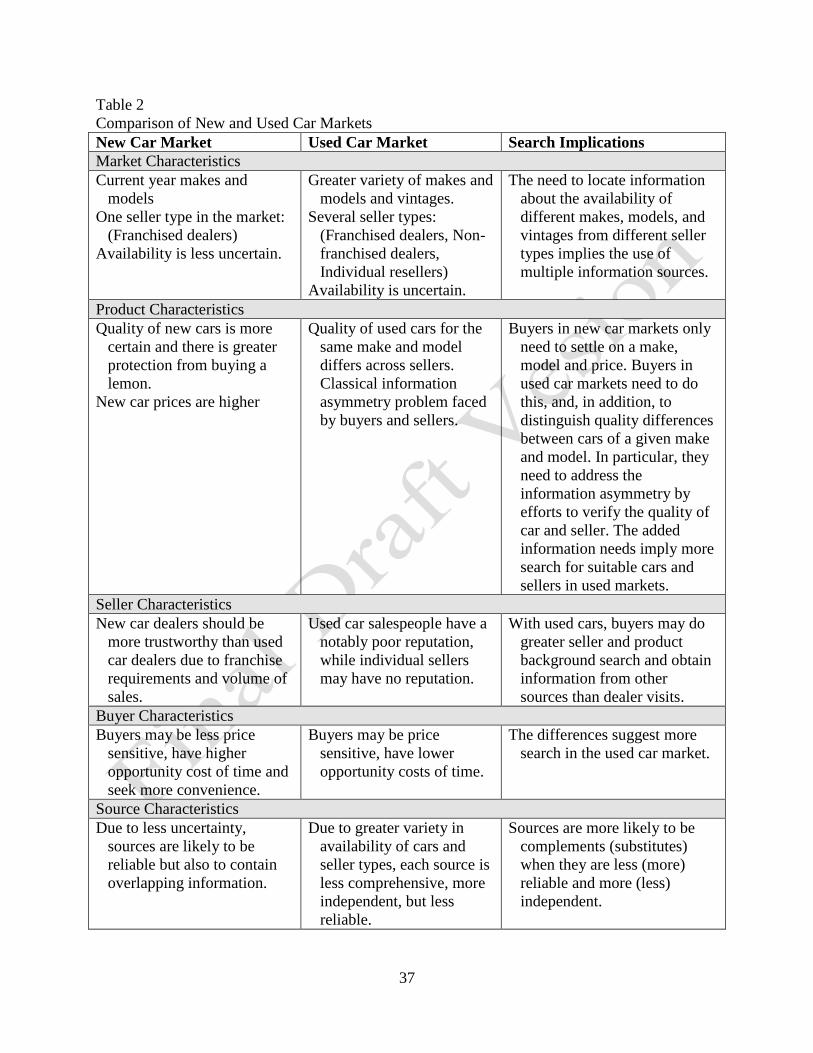
37
Table 2
Comparison of New and Used Car Markets
New Car Market Used Car Market Search Implications
Market Characteristics
Current year makes and
models
One seller type in the market:
(Franchised dealers)
Availability is less uncertain.
Greater variety of makes and
models and vintages.
Several seller types:
(Franchised dealers, Non-
franchised dealers,
Individual resellers)
Availability is uncertain.
The need to locate information
about the availability of
different makes, models, and
vintages from different seller
types implies the use of
multiple information sources.
Product Characteristics
Quality of new cars is more
certain and there is greater
protection from buying a
lemon.
New car prices are higher
Quality of used cars for the
same make and model
differs across sellers.
Classical information
asymmetry problem faced
by buyers and sellers.
Buyers in new car markets only
need to settle on a make,
model and price. Buyers in
used car markets need to do
this, and, in addition, to
distinguish quality differences
between cars of a given make
and model. In particular, they
need to address the
information asymmetry by
efforts to verify the quality of
car and seller. The added
information needs imply more
search for suitable cars and
sellers in used markets.
Seller Characteristics
New car dealers should be
more trustworthy than used
car dealers due to franchise
requirements and volume of
sales.
Used car salespeople have a
notably poor reputation,
while individual sellers
may have no reputation.
With used cars, buyers may do
greater seller and product
background search and obtain
information from other
sources than dealer visits.
Buyer Characteristics
Buyers may be less price
sensitive, have higher
opportunity cost of time and
seek more convenience.
Buyers may be price
sensitive, have lower
opportunity costs of time.
The differences suggest more
search in the used car market.
Source Characteristics
Due to less uncertainty,
sources are likely to be
reliable but also to contain
overlapping information.
Due to greater variety in
availability of cars and
seller types, each source is
less comprehensive, more
independent, but less
reliable.
Sources are more likely to be
complements (substitutes)
when they are less (more)
reliable and more (less)
independent.

38
Table 3
Descriptive statistics (Sample size N=239)
Variables Mean SD Min Max
RLTa
(2003)
RLT
(2007)
Number of models considered 2.39 1.03 1 4 2.72 2.71
Know specific make and model to buy 0.33 0.47 0 1 0.48 0.54
Know specific seller to buy from 0.17 0.38 0 1 0.27 0.36
First car bought 0.27 0.44 0 1 0.04
Satisfaction with previous car 4.25 0.95 1 5 5.84 5.59
Satisfaction with previous seller 4.13 1.10 1 5 5.50 5.39
Experience with used cars 1.85 1.75 0 9
Experience with new cars 0.51 0.93 0 5 1.54 2.34
Sticker price of car $12477 $8500 $0 $55282 $21319 $24110
Male 0.67 0.47 0 1 0.52 0.57
Married 0.64 0.48 0 1 0.66
Years of formal education 17.24 2.79 12 22 15.04 15.17
Number of children 1.19 1.23 0 5 0.84
Number of cars in the household 2.16 0.95 0 8 1.97
Numbers of years of living in the area 10.64 10.17 1 53 25.70
Age 37.62 11.56 20 65 48.28
Income $74667 $41640 $2500 $150000 $59583 $64470
Dollar wage $33 $22 $7.5 $85 $22 $24.87
Time spent consulting word of mouth 1.24 2.73 0 24
Frequency of Internet Use 4.37 1.08 1 5
Enjoy Store Visit 3.29 1.25 1 5
Talking to salespeople 2.50 1.23 1 5
Engage in price comparison 4.39 0.93 1 5
Read car enthusiast magazines 1.60 1.03 1 5
Prefer to gather as much information
before visiting a dealer 3.72 1.20 1 5
Number of dealers visited 3.24b 2.84 0 15 2.19
Number of newspapers in print 0.56 1.34 0 10
Number of dealer websites visited 5.27 5.26 0 30 1.38 3.41
Number of resale websites visited 5.86 8.23 0 50 2.52c 2.151
a refers to Ratchford, Lee and Talukdar study. (2003) study figures are for Year 1999; (2007) study figures are for
Year 2002.
b-RLT(2003) do not report this number. Klein and Ford (2003) report that 39% buyers visit 2 or fewer dealers.
c- RLT(2003) study reports the number of hybrid sources consulted which are comparable to resale websites. The
hybrid sources refer to non-advocate sources such as Consumer reports, Edmonds, Kelly Blue Book, Autobytel etc.
Note: Klein and Ford (2003) report search for early buyer, late buyers and shoppers and they use an aggregate
measure for depth of search. Therefore, their sample statistics is not directly comparable to our sample. In their
sample of 169 buyers, the average total search time is 35.14 hours and the median search time is 14 hours. In RLT
(2003), the average total search time is 15.58 hours and median of total search time is 13.92 hours for a sample of
886 byers. In our sample of 239 buyers, the average total hours searched is 32.6 hours and median search time 23
hours respectively.

39
Table 4
Correlation matrix
1d 2 3 4 5 6 7 8 9 10 11 12 13 14 15 16 17 18 19
1. DV 1.00
2. PRINT 0.07 1.00
3. DW 0.40 0.39 1.00
4. RW 0.14 0.32 0.40 1.00
5. WOM 0.07 0.16 0.02 0.25 1.00
6. EUC -0.02 -0.04 -0.09 -0.05 -0.03 1.00
7. WAGE 0.05 -0.03 0.07 -0.05 -0.13 0.03 1.00
8. AGE 0.08 -0.05 -0.16 -0.15 -0.10 0.19 0.15 1.00
9.MODELS 0.24 -0.02 0.23 0.22 0.07 -0.10 0.03 -0.09 1.00
10. HDV 0.28 -0.03 0.17 -0.21 -0.08 -0.07 0.11 0.12 -0.05 1.00
11.HPRINT 0.02 0.41 0.06 0.10 0.04 -0.08 -0.03 0.02 -0.08 -0.07 1.00
12. HDW 0.21 0.21 0.68 0.17 -0.07 -0.04 0.09 -0.18 0.15 0.25 0.03 1.00
13. HRW 0.03 0.21 0.29 0.63 0.10 -0.08 -0.01 -0.19 0.28 -0.28 0.07 0.20 1.00
14. D11 0.07 -0.03 0.21 0.13 0.03 -0.05 0.08 -0.29 0.22 -0.01 -0.18 0.26 0.24 1.00
15. D12 0.09 0.02 0.12 0.02 0.07 -0.05 -0.05 0.02 0.00 0.23 0.07 0.15 0.02 0.03 1.00
16. D13 0.08 0.02 0.08 -0.02 0.10 -0.02 -0.10 0.00 -0.11 0.28 0.08 0.10 -0.02 0.02 0.70 1.00
17. D14 0.07 -0.03 0.17 0.15 0.07 -0.01 0.05 -0.01 0.17 0.08 -0.06 0.14 0.21 0.36 0.32 0.22 1.00
18. D15 0.13 0.23 0.14 0.14 0.26 0.02 -0.06 -0.08 0.04 0.08 0.22 0.13 0.19 0.04 0.13 0.25 0.07 1.00
19. D16 0.17 0.05 0.18 0.14 0.14 0.08 0.16 0.04 0.10 0.14 0.00 0.19 0.16 0.23 0.35 0.27 0.54 0.23 1.00
d 1=Search using dealer visits (DV); 2=Search on PRINT;3=Search on Dealer Websites (DW); 4=Search on Resale Websites (RW);5=Time spent talking to
friends/ relatives (WOM);6=Experience of used cars(EUC); 7=log of wage rate (WAGE); 8=AGE ;9=number of models considered (MODELS);
10=helpfulness of DV; 11=helpfulness of PRINT; 12=helpfulness of DW;13=helpfulness of RW; 14= consumers’ frequency of Internet use (D11);
15=consumers’ enjoyment of store visit (D12);16= Consumers’ enjoyment of talking to salespeople (D13); 17=Consumers’ tendency to do price comparison
(D14) 18=Consumers’ interest in reading car enthusiast magazines (D15); 19=Consumers’ enjoyment to gather information (D16)

40
Table 5
Makes and models considered and seller type chosen by respondents
Number of makes
and models
considered
Number of respondents % of respondents
1 55 23.01
2 79 33.05
3 62 25.94
4 43 17.99
Type of seller Number of respondents
who bought from this seller type
% of respondents
New car Dealer 82 34.31
Used car Dealer 67 28.03
Used car superstore 18 7.53
Individual seller 72 30.13
Table 6
Information sources used
Information Source
for Car Search
% of Respondents
who used this Source
Reading newspapers 35%
Classified advertisements 34%
Friends/relatives/individuals 38%
Dealer visits 70%
Newspaper websites 31%
Manufacturer websites 47%
Dealer websites 62%
Used car superstore websites 57%
Online referral websites 30%
Third party websites 46%
Auction websites 29%
Local websites 52%

41
Table 7
Exclusion Restriction Variables for different Information Sources
Exclusion Restriction Variable
Dealer
visit
(y1)
(y2)
Dealer
website
(y3)
Resale
website
(y4)
Frequency of Internet use 0 0 1e 1
Enjoy store visit 1 0 0 0
Enjoy talking to sales people 1 0 0 0
Enjoy price comparison 0 0 1 1
Read car enthusiast magazines 0 1 0 0
Enjoy gathering information 0 1 1 1
Helpfulness of dealer visit 1 0 0 0
Helpfulness of print 0 1 0 0
Helpfulness of dealer websites 0 0 1 0
Helpfulness of resale websites 0 0 0 1 e “1” if variable is used as an exclusion restriction variable for the information source.
Table 8
Summary of hypotheses and their empirical support
Hypothesis Support
H1.Offline search is positively associated with online search in the used car
market, i.e., the more consumers do offline search, the more they will do
online search.
√ f
H2a.Search on dealer website is positively associated with offline search in
the used car market.
√
H2b. Search on dealer website is negatively associated with offline search in
the used car market.
X
H3a.Search on resale website is positively associated with offline search in
the used car market.
X
H3b. Search on resale website is negatively associated with offline search in
the used car market.
√
H4a: Search on dealer website is positively associated with search on resale
website in the used car market.
√
H4b: Search on resale website is negatively associated with search on dealer
website in the used car market.
√
f X-represents hypothesis rejected; √ represents hypothesis supported

42
Table 9
Interrelationship of traditional and Internet information sources
DEPENDENT VARIABLE
RHS
ENDOGENOUS
VARIABLE
Dealer Visit Print Dealer Website Resale
Est.g Std.
Mean
Value
Elasticityh Est. Std.
Mean
Value
Elasticity Est. Std.
Mean
Value
Elasticity Est. Std.
Mean
Value
Elasticity
Dealer Visit
-0.43 0.02 -2.49 0.59 0.05 0.37 -1.65 0.15 -0.91
Print -1.15 0.05 -0.20
1.89 0.07 0.20 0.59 0.06 0.06
Dealer Website 0.78 0.02 1.27 0.53 0.01 4.99
0.24 0.05 0.21
Resale Website -0.28 0.03 -0.51 -0.05 0.01 -0.52 -0.02 0.01 -0.02
g Bold are significant at 95% level, *significant at 90% level. We followed the Bayesian approach of considering coefficients in which
the 95% HDPI does not include zero to be significant. Refer to Koop (2003), page 52.
h Calculated as: coefficient*(mean of x/mean of y). Means are: Dealer Visit = 3.24; Print = .56; Dealer Website = 5.27; Resale
Website = 5.86 (see Table 3).

43
Table 10
Factors influencing information source use
EXOGENOUS
VARIABLE
Dealer Visit Print Dealer Website Resale Website
est.i std Elasticityj est. std Elasticity est. std Elasticity est. std Elasticity
Intercept -0.10i 0.40
-0.32 0.28
0.10 0.52
-0.13 0.67
Word of mouth 0.47 0.10 0.18 0.23 0.07 0.51 -0.35 0.13 -0.08 0.72 0.18 0.15
Experience with used cars -0.03 0.15 -0.02 -0.03 0.11 -0.10 0.05 0.20 0.02 0.00 0.27 0.00
Log wage -0.65 0.23 -0.20 -0.48 0.17 -0.86 0.91 0.32 0.17 -0.04 0.45 -0.01
Age 0.48 0.21 5.57 0.42 0.14 28.22 -0.82 0.27 -5.91 -0.39* 0.36 -2.50
Number of models -0.14 0.21 -0.10 -0.45 0.15 -1.92 1.08 0.28 0.49 1.80 0.40 0.73
Exclusion Restriction Variables
Helpfulness of the source 0.03 0.03 0.03 0.05 0.01 0.14 -0.01 0.02 0.00 0.37 * 0.48 0.12
Enjoy dealer visits -0.04 0.11 -0.04
Enjoy Talking to
salespeople 0.01 0.02 0.01
Enjoy Reading car magazines
0.01* 0.01 0.03
Enjoy Gathering Information
-0.17 0.06 -1.13 0.27 0.05 0.19 0.46 0.20 0.29
Frequency of Internet Use
0.01 0.03 0.01 0.07 0.11 0.05 i Bold are significant at 95% level, *significant at 90% level
j Calculated as: coefficient*(mean of x/mean of y), except for log wage. The latter is coefficient*(1/mean of y).

44
Table 11
Seller choice model- conditional logit analysis
Dependent Variable- Seller choice Model Fit Summary
Number of Observations 239
Log Likelihood -199.02475
Log Likelihood Null -331.32435
AIC 472.04949
Schwarz Criterion 600.67865
Discrete Response Profile
Alternative Seller type Frequency Percent
1 New Car Dealer (NCD) 82 34.31
2 Used Car Dealer (UCD) 67 28.03
3 Used Car Superstore (UCS) 18 7.53
4 Individual Seller (IS) k 72 30.13
k Individual seller is the base category for comparison.
Conditional Logit Estimates
Variable est. std t value Pr >|t|
Intercept -NCD 1.16 1.87 0.62 0.54
Intercept -UCD -0.20 1.83 -0.11 0.91
Intercept -UCS 0.93 2.68 0.35 0.73
Trust 1.31 l 0.18 7.14 <.0001
USE OF INFORMATION SOURCES-DEPTH OF SEARCH
Dealer visit-NCD 0.25 0.09 2.66 0.01
Dealer visit-UCD 0.30 0.09 3.27 0.00
Dealer visit-UCS 0.23* 0.15 1.59 0.11
Print -NCD 0.05 0.23 0.22 0.83
Print -UCD 0.07 0.16 0.44 0.66
Print -UCS 0.01 0.40 0.03 0.98
Retail websites-NCD 0.04 0.06 0.66 0.51
Retail websites-UCD 0.08* 0.05 1.62 0.10
Retail websites-UCS 0.11 0.08 1.36 0.17
Resale websites -NCD -0.16 0.05 -3.15 0.00
Resale websites -UCD -0.06 0.03 -1.83 0.07
Resale websites -UCS -0.39 0.15 -2.55 0.01

45
Table 11 (continued)
Variable est. std t value Pr >|t|
DEMOGRAPHIC CHARACTERISTICS
No of models considered-NCD -0.46 0.23 -2.04 0.04
No of models considered-UCD -0.54 0.22 -2.44 0.01
No of models considered-UCS -0.09 0.38 -0.25 0.80
Price range-NCD 0.70 0.30 2.33 0.02
Price range-UCD 0.77 0.30 2.53 0.01
Price range-UCS 1.18 0.40 2.93 0.00
Age-NCD 0.59 0.22 2.69 0.01
Age-UCD 0.39 0.23 1.71 0.09
Age-UCS 0.50 0.32 1.56 0.12
Years of schooling-NCD -0.14 0.09 -1.52 0.13
Years of schooling -UCD 0.04 0.09 0.45 0.65
Years of schooling -UCS 0.06 0.17 0.38 0.70
No of children-NCD 0.20 0.21 0.98 0.33
No of children-UCD 0.26 0.20 1.32 0.19
No of children-UCS 0.17 0.31 0.55 0.59
Logwage-NCD -0.28 0.45 -0.61 0.54
Logwage-UCD -0.94 0.48 -1.97 0.05
Logwage-UCS -2.27 0.84 -2.71 0.01
Experience of used cars-NCD -0.23* 0.14 -1.67 0.10
Experience of used cars-UCD 0.05 0.13 0.38 0.70
Experience of used cars-UCS 0.06 0.20 0.28 0.78 l Bold are significant at 95% level. * significant at 90% level