official development assistance report -...
TRANSCRIPT

1Rwanda’s Official Development Assistance Report
FY 2011- 2012
OFFICIAL DEVELOPMENT ASSISTANCE REPORT
FY 2011- 2012
Aid for Development
REPUBLIC OF RWANDA
MINISTRY OF FINANCE AND ECONOMIC PLANNING
March 2013

2 Rwanda’s Official Development Assistance ReportFY 2011- 2012
This report has been produced by the External Finance Unit in the Ministry of Finance and Economic Planning of the Government of Rwanda, and with the financial resources provided through the United Nations Development Programme.
Contact details:
P.O. Box 158 Kigali - Rwanda
Email: [email protected]
Phone: +250 252 59 60 42
An electronic version of this report is accessible online on the Rwanda Development Partners website
(http://www.devpartners.gov.rw)
iRwanda’s Official Development Assistance Report
FY 2011- 2012
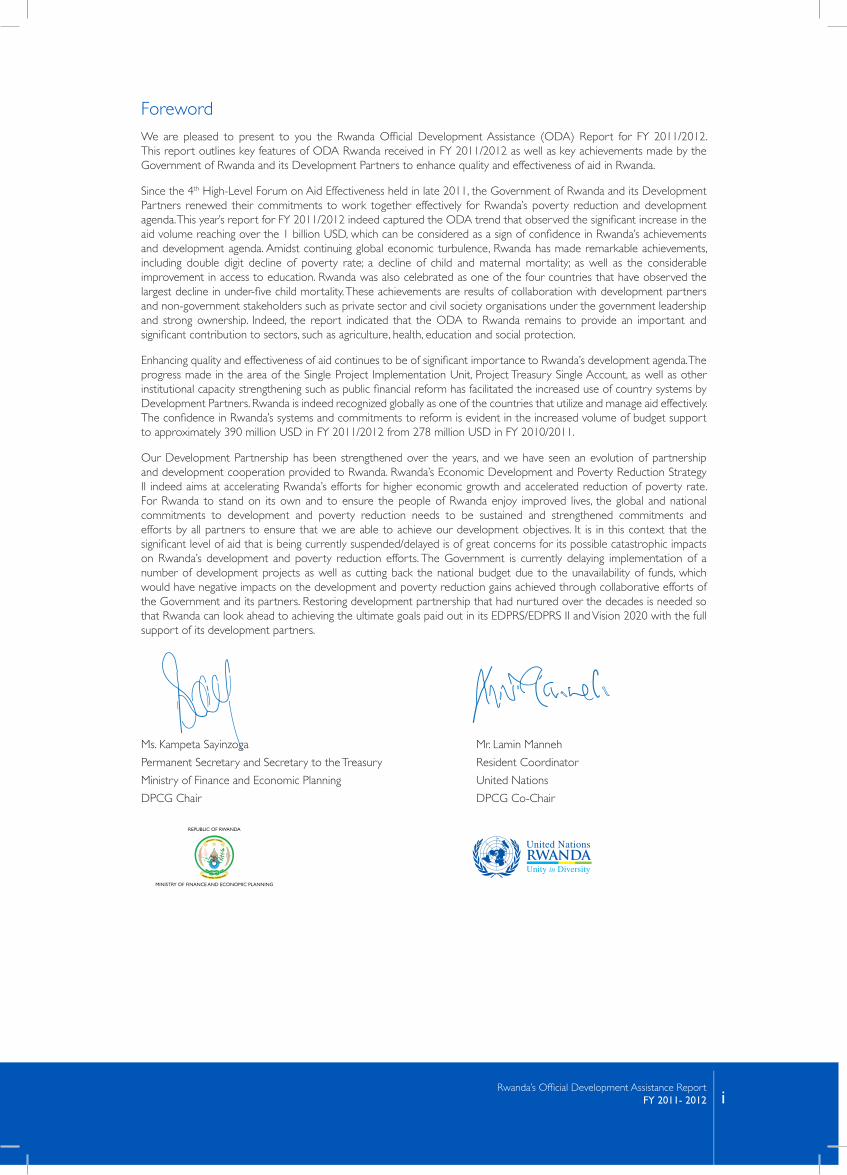
ForewordWe are pleased to present to you the Rwanda Official Development Assistance (ODA) Report for FY 2011/2012. This report outlines key features of ODA Rwanda received in FY 2011/2012 as well as key achievements made by the Government of Rwanda and its Development Partners to enhance quality and effectiveness of aid in Rwanda.
Since the 4th High-Level Forum on Aid Effectiveness held in late 2011, the Government of Rwanda and its Development Partners renewed their commitments to work together effectively for Rwanda’s poverty reduction and development agenda. This year’s report for FY 2011/2012 indeed captured the ODA trend that observed the significant increase in the aid volume reaching over the 1 billion USD, which can be considered as a sign of confidence in Rwanda’s achievements and development agenda. Amidst continuing global economic turbulence, Rwanda has made remarkable achievements, including double digit decline of poverty rate; a decline of child and maternal mortality; as well as the considerable improvement in access to education. Rwanda was also celebrated as one of the four countries that have observed the largest decline in under-five child mortality. These achievements are results of collaboration with development partners and non-government stakeholders such as private sector and civil society organisations under the government leadership and strong ownership. Indeed, the report indicated that the ODA to Rwanda remains to provide an important and significant contribution to sectors, such as agriculture, health, education and social protection.
Enhancing quality and effectiveness of aid continues to be of significant importance to Rwanda’s development agenda. The progress made in the area of the Single Project Implementation Unit, Project Treasury Single Account, as well as other institutional capacity strengthening such as public financial reform has facilitated the increased use of country systems by Development Partners. Rwanda is indeed recognized globally as one of the countries that utilize and manage aid effectively. The confidence in Rwanda’s systems and commitments to reform is evident in the increased volume of budget support to approximately 390 million USD in FY 2011/2012 from 278 million USD in FY 2010/2011.
Our Development Partnership has been strengthened over the years, and we have seen an evolution of partnership and development cooperation provided to Rwanda. Rwanda’s Economic Development and Poverty Reduction Strategy II indeed aims at accelerating Rwanda’s efforts for higher economic growth and accelerated reduction of poverty rate. For Rwanda to stand on its own and to ensure the people of Rwanda enjoy improved lives, the global and national commitments to development and poverty reduction needs to be sustained and strengthened commitments and efforts by all partners to ensure that we are able to achieve our development objectives. It is in this context that the significant level of aid that is being currently suspended/delayed is of great concerns for its possible catastrophic impacts on Rwanda’s development and poverty reduction efforts. The Government is currently delaying implementation of a number of development projects as well as cutting back the national budget due to the unavailability of funds, which would have negative impacts on the development and poverty reduction gains achieved through collaborative efforts of the Government and its partners. Restoring development partnership that had nurtured over the decades is needed so that Rwanda can look ahead to achieving the ultimate goals paid out in its EDPRS/EDPRS II and Vision 2020 with the full support of its development partners.
Ms. Kampeta Sayinzoga Mr. Lamin Manneh
Permanent Secretary and Secretary to the Treasury Resident Coordinator
Ministry of Finance and Economic Planning United Nations
DPCG Chair DPCG Co-Chair
REPUBLIC OF RWANDA
MINISTRY OF FINANCE AND ECONOMIC PLANNING

ii Rwanda’s Official Development Assistance ReportFY 2011- 2012
Table of Contents
Foreword i
List of Tables iii
List of Figures iii
1. Introduction 1
1.1 An Introduction to ODA in Rwanda 1
1.2. Purpose of the ODA Report in Rwanda 1
1.3 Data Included and Excluded in the Report 1
1.4 Quality of Data Used in the Report 1
2. Rwanda’s Development Objectives 2
2.1 Implementation progress of the EDPRS 2
2.2 EDPRS 2: New Priorities and Targets 2
3. Rwanda’s Implementation of the Busan Partnership for Effective Development Cooperation 4
4. The Rwanda Aid Manual of Procedures: Background, Progress & the Way Forward 5
4.1 Single Project Implementation Units (SPIUs) 5
4.2 Progress on the Project Treasury Single Account (PTSA) 5
4.3 Sector-Wide Approaches / Programme-Based Approaches 6
4.4 Strengthening of the Development Assistance Database (DAD) 6
5. Volume, Nature and Distribution of Development Assistance 7
5.1 The Volume of ODA in FY2010/2011 7
5.2 The Nature of ODA in FY2010/2011 8
5.3 The Distribution of ODA in FY2010/2011 11
5.4 Development Assistance from Non-OECD-DAC Development Partners. 14
6. Predictability of ODA Flows 15
6.1 The Predictability of All Support 15
6.2 ODA Predictability According to Aid Modality and Sectors 15
7. Aid on Budget 17
8. Monitoring the Implementation of the DoL 18
9. Conclusion 20

iiiRwanda’s Official Development Assistance Report
FY 2011- 2012
List of Tables
Table 1: ODA to Rwanda in FY 2011/2012 7
Table 2: 2011/2012 ODA by Aid Modality 9-10
Table 3: Aid Modality by Development Partners FY 2011/2012 10
Table 4: FY 2011/2012 ODA to Projects implemented by Government Agencies 11
Table 5: Table FY2011/2012 ODA from none OECD-DAC Development Partnes 14
Table 6: 2011/2012 ODA Predictability by Aid Modality 15
Table 7: 2011/2012 ODA Predictability by Aid Modality and Loan versus Grant 15
Table 8: Predictability of ODA by Sectors 16
Table 9: Aid on Budget (FY 2010/2011 and FY 2011/2012) 17
Table 10. Division of Labour Mapping 19
List of Figures
Figure 1: ODA to Rwanda in FY 2011/2012 8
Figure 2. Share of ODA provided in grants v.s. loans in FY 2011/2012 8
Figure 3: ODA by Aid Modality (% share of total ODA) 9
Figure 4: ODA to Rwanda in FY 2011/2012 by Sectors 12
Figure 5: ODA allocations of Aid Modalities by Sectors. 13
Figure 6: FY 2011/2012 ODA to Productive versus Non-Productive Sectors 13
Figure 7: FY 2011/2012 ODA to MDGs/EDPRS Themes 14

iv Rwanda’s Official Development Assistance ReportFY 2011- 2012
List of Abbreviations / Acronyms% PercentagesADB African Development BankAFR Access to Finance RwandaBTC Belgium Technical CooperationCAS Country Assistance ProgramCDC Center for Disease Control & PreventionCoA Chart of AccountCPAF Common Performance Assessment FrameworkCSP Country Strategy PaperDAD Development Assistance Data BaseDCD-DAC Development Co-operation DirectorateDFID Department for International DevelopmentDHS4 Fourth Demographic and Health SurveyDoL Division of LaborDPAF Development Performance Assessment FrameworkDPCG Development Partners Coordination GroupDPR Development Partners RetreatDPs Development PartnersEC European CommissionEDPRS Economic Development Poverty Reduction StrategyEICV3 Third Integrated Household Living Conditions SurveyEU European UnionFINSCOPE 2012 FinScope Survey Report 2012FY Fiscal YearGBS General Budget SupportGDP Gross Domestic ProductGoR Government of RwandaGoR Government of RwandaHIV/AIDS Human immunodeficiency virus / acquired immunodeficiency syndromeHLF4 The 4th High-Level Forum on Aid Effectiveness Forum held in Busan, South KoreaICT Information and Communication TechnologyIFAD International Fund for Agriculture DevelopmentINGO International Non Governmental OrganizationJICA Japan International Cooperation AgencyMDGs Millennium Development GoalsMINECOFIN Ministry of Finance and Economic PlanningMTEF Medium-Term ExpenditureNGO Non-Government OrganizationODA Official Development AssistanceOECD Organization for Economic Co-operation and Development PBA Program-Based ApproachPIC Programme Indicatif de CooperationPS Permanent SecretaryPTSA Progress on Project Treasury Single AccountSBS Sector Budget SupportSmartFMS Integrated Financial Management System SOAG Strategic Grant Objective AgreementSOs Strategic ObjectivesSPIU Single Project Implementation UnitSWAP Sector Wide ApproachTB Tuberculoses T-Bill Treasury BillTSA Treasury Single AccountUK United KingdomUN United NationsUSA United States of AmericaUSAID United States Agency for International DevelopmentUSD United States DollarsUSG United States GovernmentVUP Vision 2020 Umurenge Program

1Rwanda’s Official Development Assistance Report
FY 2011- 2012
1. Introduction
1.1 An Introduction to ODA in Rwanda
Since 1994, Official Development Assistance (ODA) to Rwanda has played and continues to play an important role in supporting national efforts on national development and poverty reduction. The nature of ODA has evolved considerably since then, shifting from one largely characterized as humanitarian mainly delivered by Non-Governmental Organizations (NGOs) to the one characterized as development focused with majority of ODA now delivered through the Government of Rwanda (GoR). Today, ODA in Rwanda complements domestic resources in supporting national priorities as articulated in Rwanda’s Economic Development and Poverty Reduction Strategy (EDPRS).
1.2 Purpose of the ODA Report in Rwanda
This report aims to highlight the overall picture of ODA received by Rwanda in FY 2011/2012, with views to inform the national efforts to enhance the effective use of ODA and appropriate decisions concerning aid allocation in support of the national priorities articulated in the EDPRS. The report also highlights key areas of progress and further consideration for improvements concerning the national aid effectiveness agenda and the implementation of Rwanda’s Aid Policy.
1.3 Data Included and Excluded in the Report
The ODA Report is based on the data on ODA captured in the Development Assistance Database (DAD), which is an aid management and information system, managed by the Ministry of Finance and Economic Planning (MINECOFIN). ODA data captured in the DAD is reported by Development Partners on a quarterly basis and includes grants and concessional loans (at least 25% grant element). Currently, many non-resident Development Partners (such as Arab Funds) as well as emerging partners (such as China, India, etc.) are not able to report their information on ODA through DAD. As such, this Report does not include ODA provided by these partners (that represents 8% of external resources financing the national budget in FY 2011/2012).
1.4 Quality of Data Used in the Report
Quality of data used in this report largely depends on the accuracy and relevance of information reported by DPs in the DAD. In order to ensure quality of data provided in the DAD, the Government undertakes verification processes at relevant level, mostly through the DPAF process. However, any changes needed to be made to the data will need to be made by DPs themselves. While the Government makes further efforts to strengthen systematic verification process, quality of data in this report remains largely subject to the willingness and ability of DPs to report the accurate and relevant information.

2 Rwanda’s Official Development Assistance ReportFY 2011- 2012
2. Rwanda’s Development ObjectivesRwanda’s development agenda is guided by the Vision 2020 and the Economic Development and Poverty Reduction Strategy (EDPRS) which are also in line with the international Millennium Development Goals (MDGs). The EDPRS promotes three flagship programmes: (1) Sustainable Growth for Jobs and Exports (2) Vision 2020 Umurenge (an integrated rural and human capital development programme that aims to eradicate extreme poverty by increasing productive capacity of the poor) and (3) Good Governance.
2.1 Implementation progress of the EDPRS
The EDPRS is monitored jointly between Government of Rwanda and Development Partners through the Common Performance Assessment Framework (CPAF). Of the 37 targets assessed for 2011/12: 30 (81%) were fully met, 4 (11%) were partially met and 3 (8%) were not met. Of 77 policy actions due for implementation, 53 (69%) were fully achieved and 24 (31) were not fully achieved.
The review of EDPRS-1 was enriched with the results from the both the Third Integrated Household Living Conditions Survey (EICV3), the fourth Demographic and Health Survey (DHS4), the FINSCOPE 2012 and the preliminary results of the census in addition to existing administrative and survey data.
The findings from the different survey consistently highlighted that rapid economic growth over the past five years has been pro-poor. A significant reduction in poverty from 56.9% in 2006 to 44.9% in 2011 and a decline in extreme poverty from 35.8% to 24.1% over the same period. Inequality has also reduced from 0.52 in 2005 to 0.49. An increase in off -farm employment to a remarkable figure of 1,406,000 in 2012 as compared to 200,000 jobs in 2000, Financial inclusion from 47.6 in 2008 to 71.9 in 2012, Credit to private sector (as a % of GDP) from 10 in 2006 to 14.5%.The census provisional results also indicate that the family planning initiatives have been a success as the fertility rate has reduced from 6.1 to 4.6 children per woman between 2006 and 2011 and also population growth rate has reduced from 2.9% to 2.6%. Delivery assisted by skilled provider increased from 39% in 2005 to 69% in 2010, Delivery in health facilities from 30% in 2005 to 69% in 2010 Infant mortality from 86 in 2005 to 50 in 2010, under 5 mortality from 152 in 2005 to 76 in 2010 (DHS4). All this has been achieved over a period in which economic growth has averaged 8.3%.
However, there remain challenges if the Vision 2020 target of transforming Rwanda into a middle income country is to be realised by attaining a per capita income of US$ 1,240 from the current $605 GDP per capita.
2.2 EDPRS 2: New Priorities and Targets
For this to happen, the Rwandan economy will need to grow at a rate of at least 11.5% p.a. over the duration of EDPRS 2, with the sectoral targets set to Agriculture from 5.9% to above 8.5% p.a., Industry from 9.3% to above 14% p.a., and Services from 10.5% to above 13.5% p.a. This will create a structural shift of the economy where Agriculture share will reduce from 34% to 25% of GDP, Industry increase from 16% to 20% of GDP, and Services also increase from 50% to 55% of GDP. For the above targets also to be achieved there will be a need to close external trade balance where Exports will Increase on average Growth of 28% p.a. and Imports Maintained at 17% p.a. average.
Building on achievements and lessons learned during EDPRS1, EDPRS 2 is being developed around four thematic areas reflecting Rwanda’s emerging development priorities. The thematic areas identified as emerging priorities are: (1) Economic Transformation, (2) Rural Development (3) Productivity and Youth Employment and (4) Accountable Governance. The Thematic Working Groups will bring together high level government officials from line Ministries and Agencies as well as other institutions representing relevant sectors:
1. Economic Transformation: This will be centred on diversification of economic base, attract large farms-more productive, Rapid growth of exports, Infrastructure for business, urbanization, and green economy.
2. Rural Development: This thematic area will be made-up by Sustainable rural settlements, increased productivity of Agriculture, Social protection linked to development, Connecting to markets, and Sustainable energy for rural communities.
3. Productivity and Youth Employment: This thematic area will be made-up by Job creating SMEs in key clusters, Demand-driven reform to education for transferable skills, Remove barriers to off-farm employment for unskilled, and large firms in labour intensive industries.
4. Accountable Governance: This thematic area will be composed of Participation and Mobilization, Quality service delivery, and Public accountability and democratic governance.

3Rwanda’s Official Development Assistance Report
FY 2011- 2012
Besides the four thematic areas, there will also be Foundational / underpinning issues e.g. malnutrition, early childhood development, macroeconomic stability, etc. The EDPRS II cross cutting issues will be Gender, HIV/AIDS and Non Communicable diseases, Environment, climate change, meteorology and disaster management, Disability and social inclusion, Capacity Building, and Regional integration.

4 Rwanda’s Official Development Assistance ReportFY 2011- 2012
3. Rwanda’s Implementation of the Busan Partnership for Effective Development CooperationThe 4th High-Level Forum (HLF) on Aid Effectiveness in Busan in South Korea, marked a major turning point for aid agenda, which places the centrality of achieving development results at the heart of global aid/development cooperation dialogue. Through the Busan Partnership for Effective Development document adopted at the high-political level, a new global aid partnership was forged, which is inclusive of various players in development, including emerging economies as providers of cooperation, civil society organisations and private sector.
The new Global Partnership for Effective Development Cooperation is built on the shared principles, which underscore the following: (1) the national ownership as the cornerstone of development effectiveness, (2) focusing on achieving development results including capacity development outcome, and (3) transparency and accountability as key principles that support the new global aid partnership. The Busan HLF also recognises that progress since Paris and Accra while considerable is still limited and that more progresses require political will. Acknowledging the critical importance of effective institutions for development effectiveness, the Busan Outcome Document recognises use of country systems as the default approach for delivering development cooperation.
The post-Busan framework looks at “global-light, country-heavy”. Thus, much more efforts and focuses will be needed at country-level under stronger developing countries’ lead to define how post-Busan agenda should be implemented and monitored at country level. To this end, the Government of Rwanda and its Development Partners have discussed the implementation of the post-Busan agenda at the Government of Rwanda and Development Partners Retreat (DPR) in March 2012. The following efforts will form the critical components of Rwanda’s implementation of the Busan agenda:
• Deepening ownership of development priorities: The Government of Rwanda has embarked on the review of the implementation of the Economic Development and Poverty Reduction Strategy (EDPRS) and the elaboration of the next generation of EDPRS. This process provides an opportunity to deepen ownership of development priorities.
• Inclusive joint planning: Building on the commitment made in the Busan on the need to effectively manage the diversity of development cooperation at the country level and reduce aid fragmentation, the Government of Rwanda and its Development Partners have agreed to undertake an inclusive joint planning exercise. This process aims to better synchronize programming/planning cycles of development cooperation framework with the national development programming/planning cycle and to further improve coherence and allocation of development cooperation to support national priorities as articulated in the forthcoming EDPRS II. The process is led by European Union delegation for development cooperation planning of bilateral partners; by World Bank for multilateral financing institutions; and by the UN Resident Coordinator for UN agencies in the context of Delivering as One. The process involves (1) effective contribution of Development Partners to the elaboration of the EDPRS II; (2) joint analytical work in support of the elaboration of the EDPRS II as well as planning Development Partners’ development cooperation frameworks; and (3) coordinated joint DP response strategy to the EDPRS II, which will form the basis for individual country assistance programmes/strategies. The joint planning process will also look at updating of the Division of Labour agreement within the context of new and emerging priorities as articulated in the forthcoming EDPRS II.
• Strengthening national mutual accountability framework: Building on the Common Performance Assessment Framework (CPAF) and Donor Performance Assessment Framework (DPAF), the Government of Rwanda is strengthening the national mutual accountability framework. The DPAF indicators and targets had been revised in accordance to the global monitoring framework for the Busan agreement, while the revision of the CPAF is taken forward within the context of developing M&E Framework for the EDPRS II. While the revised DPAF includes a more streamlined set of key quantitative indicators, such as aid on budget, use of country systems, predictability, and Division of Labour, more qualitative assessment on the effectiveness of programme-based approach, demand-driven technical assistance and capacity development support is expected at sector level as a complementary to the quantitative assessment.
• Inclusive development partnership: In light of the inclusive partnership forged under the Global Partnership for Effective Development Cooperation, the Government of Rwanda has been making conscious efforts to bring more partners into the national aid coordination and policy dialogue fora, including the Development Partners Coordination Group (DPCG) and the Government of Rwanda and Development Partners Retreat (DPR). For example, the DPR held in March 2012 saw the participation of China and South Korea. South Korea has also agreed to be assessed through the DPAF for the first time for FY 2011/2012. Furthermore, partners such Arab Funds have also showed their interest to be part of the DPAF exercise. France, while showed their interest to be part of the DPAF assessment, has not been able to report their aid information in the Development Assistance Database.

5Rwanda’s Official Development Assistance Report
FY 2011- 2012
4. The Rwanda Aid Manual of Procedures: Background, Progress & the Way ForwardIn 2011, the Ministry of Finance and Economic Planning issued the Rwanda Aid Policy Manual of Procedures through a Ministerial Instruction, with view to guide and improve the implementation of Rwanda’s Aid Policy. The Aid Policy endorsed by the Cabinet in 2006, sets out the Government of Rwanda’s vision for improved aid management and enhanced effectiveness of aid to Rwanda. The Aid Policy Manual of Procedures, in this context, sets clear guidance on the roles and responsibilities of the Government actors in aid management process, and documents the process of aid mobilisation and management, including identification, negotiation, and agreement. It also highlights the necessary documentations that facilitate aid provision and delivery through detailed procedures and checklists. The Aid Policy Manual of Procedure, thus, aims to (1) improve transparency and accountability through ensuring better communication and information flow between the Government institutions dealing with external finance through ensuring improvement in aid on budget process as well as effective and efficient allocation of aid; and (2) increase ownership by ensuring appropriate Government institutions are involved at the right stages of the aid management cycle.
In order to ensure that the roles and responsibilities as well as guidelines/procedures are well understood and adhered to, the Ministry of Finance and Economic Planning undertook extensive sensitisation process in 2012. This sensitisation started with the Permanent Secretaries of the Ministries and Heads of Development Cooperation through the sensitisation session during the Government of Rwanda and Development Partners Retreat (DPR) in March 2012. This was followed by the technical level sensitisation process, with Directors of Planning and Budget of sector Ministries, Single Project Implementation Units of sector Ministries, Executive Secretaries from Districts, and a number of relevant departments/units within the Ministry of Finance and Economic Planning. Furthermore, the Ministry of Finance and Economic Planning also reviewed its resource mobilisation process and has embarked on a process to strengthen analysis, coordination, and monitoring of resource mobilisation efforts. In this context, a Manual of Procedure for Debt management also complements the Aid Manual of Procedures for effective for the management of external resources holistically.
In addition to the efforts to improve the aid management framework and procedures, the Ministry of Finance and Economic Planning has also accelerated the efforts to streamline the way aid is managed by the Government agencies through a set of initiatives that it has successfully introduced.
4.1 Single Project Implementation Units (SPIUs)
A number of Sector Ministries have completed setting up the Single Project Implementation Units (SPIUs). These sectors include: health, agriculture, water and sanitation, energy, environment and natural resources management, justice, industry and commerce, and disaster management. The transport sector is currently in a large scale recruitment process, given that this sector implements a large number of development projects. In the sectors where the SPIUs have been established, these are the sectors that receive considerable volume of project aid and implement a number of externally financed development projects. Many of the SPIUs are fairly recent, but the SPIUs have indeed facilitated greatly the effective management of project aid. For example, the Ministry of Health SPIU manages the Global Fund, GAVI, World Bank, BTC, DFID/Girl Hub, CDC and Rock-feller Foundation’s projects, which facilitated the way in which these projects are delivered in a way that enhances the ownership, accountability, and transparency and reduces over-laps and ultimately reduces transaction costs in the implementation of these programmes. The Global Fund’s projects are now fully on budget and are considered using country systems fully. The health sector’s SPIU is indeed the more established unit since 2011, and has made the following achievements:
- SPIUs have enhanced aid effectiveness by eliminating duplication of efforts.
- It has ensured cost effectives by combining shared functions.
- There has been an increased sense of ownership by the line Ministries and this has deepened alignment of projects to line Ministries.
4.2 Progress on the Project Treasury Single Account (PTSA)
Building on the agreement reached to implement the Project Treasury Single Account (PTSA), which enables real-time consolidation of external resources information to the main Government Treasury Single Account (TSA), the pilot phase has seen a number of project accounts now linked with the Project Treasury Single Account (PTSA). The implementation of pilot has proven that the Project Treasury Single Account improves the Government’s cash management and project implementation processes. In FY 2012/2013, the Ministry of Finance and Economic Planning aims to expand the number of project accounts that will be linked to the Project Treasury Single Account since all newly opened projects are automatically linked to the TSA.

6 Rwanda’s Official Development Assistance ReportFY 2011- 2012
4.3 Sector-Wide Approaches / Programme-Based Approaches
The Government of Rwanda and its Development Partners have made efforts to improve the way they work together to implement a single sector strategy, reflected in a single expenditure programme for a given sector. The Sector-Wide Approaches (SWAps) / Programme-Based Approach has facilitated the Government of Rwanda’s leadership and ownership over its sector strategies through ensuring that aid/development cooperation provided to a sector is fully aligned to a single sector strategy and plan. It also facilitates the effective allocation of resources through bringing aid/development cooperation in a sector under a one single expenditure framework/programme. The Government considers the SWAPs as an approach to enhance sector planning and budgeting processes, sector coordination for implementation of a sector strategy/programme, monitoring and evaluation framework, and partnership and dialogue structures for policy dialogue and coordination.
With view to further enhance the effectiveness of SWAps in a number of sectors, the Ministry of Finance and Economic Planning commissioned a study to measure the effectiveness and functionality of SWAp in Rwanda and to generate a more comprehensive understanding of the requirements of SWAp. The report concluded in April 2012 generated a useful analysis of the progress made so far, and is expected to contribute to enhancing the effectiveness of SWAp and Programme-Based Approach, particularly as sectors develop and implement their Sector Strategic Plans in the context of the EDPRS II.
4.4 Strengthening of the Development Assistance Database (DAD)
Embarked on in 2010, the Ministry of Finance and Economic Planning has made further progress in strengthening the Development Assistance Database (DAD) in its usefulness and linkages to the national processes for planning, budgeting, execution and monitoring of public resources. In particular, the DAD will have the following new features/modules:
• Medium-TermExpenditureFramework(MTEF)module. This module will collect information on forward-spending plans, reported by Development Partners. The MTEF module enables to provide the firm commitments of both budget support and project support on a new Fiscal Year as well as indicative projections in the three-year rolling basis.
• EnhancedProjectRecordingmodule linkedtotheSmartFMS:The enhanced project recording module will have data fields that are aligned to the Government’s new Chart of Account (COA) with view to enhance the usefulness of information recorded in the DAD. To this end, the DAD and the SmartFMS will use the same project Number to enable the effective transmission/exchange of data between the two systems. The information provided in the DAD, such as disbursement, direct payment expenditure, direct execution expenditure will be directly linked to the SmartFMS’s revenue module as well as expenditure module (in the case of direct payment expenditure). The expenditure information of externally financed project will be directly linked from the SmartFMS’s expenditure module to the DAD’s project module. This will allow effective management of externally financed projects, enhanced information on external finance inflow for better management of macroeconomic framework, etc.
• INGOModule: The registration and recording of International NGO will be processed/facilitated by the INGO system being developed by the same company which has developed the DAD. The INGO system will be managed by the Office of Immigration and Emigration, and will be linked to the DAD in terms of planned contributions and actual contribution, sector of engagement as well as geographical areas.

7Rwanda’s Official Development Assistance Report
FY 2011- 2012
5. Volume, Nature and Distribution of Development Assistance
5.1 The Volume of ODA in FY2010/2011
The total level of ODA provided to Rwanda in FY 2011/2012 was USD 1.190 billion, a significant increase of USD 215 million (representing 22%) million compared to the USD 974.9 million received in FY 2010/2011. This resource flow was equivalent to 17.5% of nominal GDP in FY 2011/2012 compared to 16.7% in the previous FY. The substantive nominal increase was attributed in part to significant increases in ODA from the Global Fund, the World Bank, UK, and African Development Bank, who increased assistance by roughly USD 78 million, USD 62 million, USD 38 million, and USD 47 million respectively, from the previous fiscal year. While the increased ODA volume by the Global Fund and the World Bank is due to impressive performance record of GoR on the resources provided by the financiers, the increase by the African Development Bank is due to the fact that the African Development Bank disbursed significantly lower level of ODA in the previous year (FY 2010/2011) given that it was the last year of their Country Assistant Programme. The increase made by UK is attributed by the Fast Track Initiative for Education, which is now administered by the UK. Substantial decrease is observed by Belgium and United Nations. For the Belgium cooperation, reasons for this reduction are two-fold: the previous cooperation programme (2007-2010) has experienced slow project implementation, thus the projects under the previous cooperation programme have not yet been closed. In the meantime, a new cooperation programme 2011-2012 (with its total resource envelop increased), which was signed in May 2011, experienced a slow start in the identification and formulation of projects/programmes. With regard to the UN Agencies, this is due to the humanitarian cooperation which the UN supports has not been reported in the DAD in FY 2011/2012. In general, the UN provides humanitarian assistance and response support, which totalled in around 20-30 million USD annually. With regard to the USG, while the US reported to have disbursed 223.7 million USD in the DAD, it has been found out that the disbursement information reported by US in the DAD was the amount submitted for the Congress approval. The actual level of aid approved by the Congress was 168.3 million USD, which was 37.5 million USD lower. The top-five Development Partners providing around 74% of the FY 2011/2012 ODA included the World Bank, US, the Global Fund, the UK, and the African Development Bank (see Table 5.1).
Table 1: ODA to Rwanda in FY 2011/2012
DEVELOPMENT PARTNERFY 2010/2011
ODA (USD)
FY 2011/2012
ODA (USD)
World Bank 189,902,671 252,024,554
United States of America 223,052,382 223,710,9261
Global Fund 115,979,053 193,708,992
United Kingdom 89,806,487 127,479,142
African Development Bank 36,793,381 83,886,966
European Commission 76,461,144 78,955,799
United Nations 72,594,922 58,467,619
Belgium 60,376,613 43,518,187
Netherlands 34,916,625 39,926,606
Germany 33,194,548 35,895,227
Japan 11,929,504 20,199,427
Sweden 16,719,072 18,592,493
Canada 6,797,012 4,645,065
Luxemburg 3,896,260 3,905,155
South Korea ---- 3,516,228
Switzerland 2,442,354 1,702,843
Total 974,862,028 1,190,135,230
1The total amount of ODA to Rwanda which includes approved/signed SOs allocation by the Congress was 136,255,140.
8 Rwanda’s Official Development Assistance ReportFY 2011- 2012
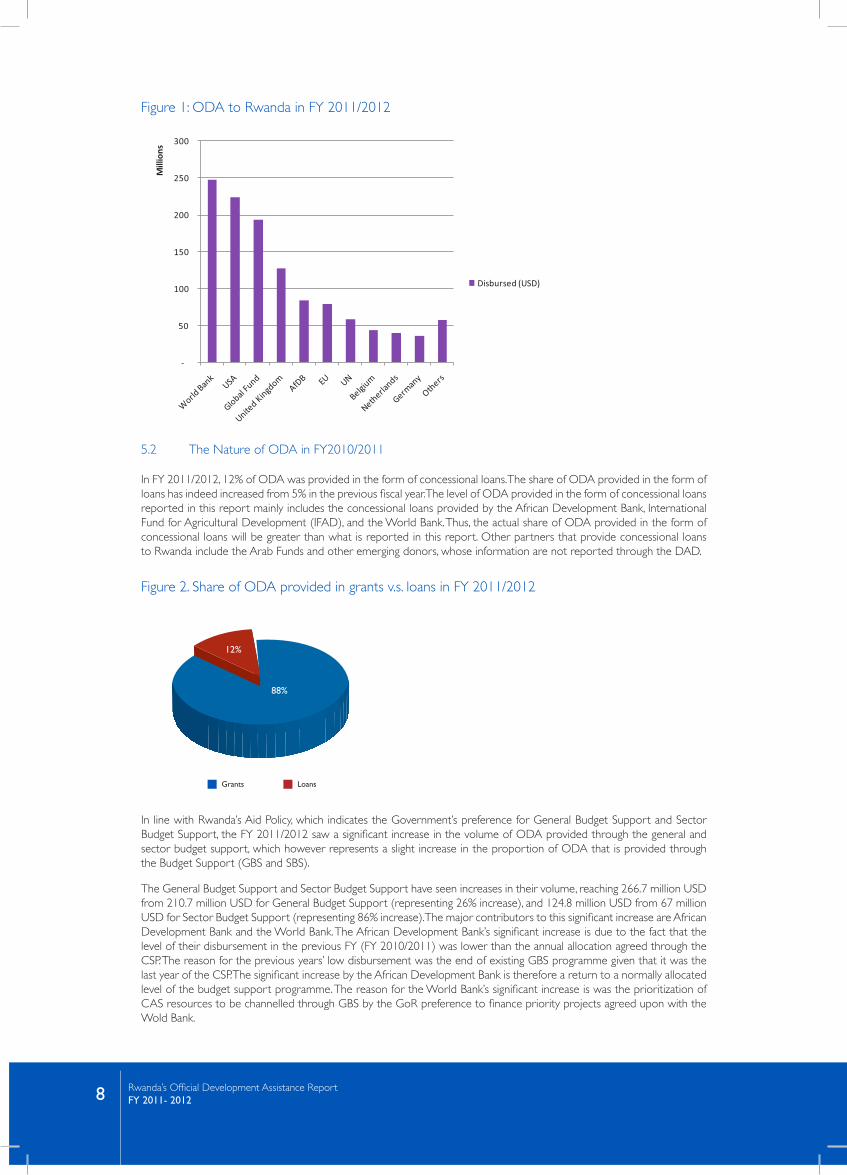
Figure 1: ODA to Rwanda in FY 2011/2012
5.2 The Nature of ODA in FY2010/2011
In FY 2011/2012, 12% of ODA was provided in the form of concessional loans. The share of ODA provided in the form of loans has indeed increased from 5% in the previous fiscal year. The level of ODA provided in the form of concessional loans reported in this report mainly includes the concessional loans provided by the African Development Bank, International Fund for Agricultural Development (IFAD), and the World Bank. Thus, the actual share of ODA provided in the form of concessional loans will be greater than what is reported in this report. Other partners that provide concessional loans to Rwanda include the Arab Funds and other emerging donors, whose information are not reported through the DAD.
Figure 2. Share of ODA provided in grants v.s. loans in FY 2011/2012
In line with Rwanda’s Aid Policy, which indicates the Government’s preference for General Budget Support and Sector Budget Support, the FY 2011/2012 saw a significant increase in the volume of ODA provided through the general and sector budget support, which however represents a slight increase in the proportion of ODA that is provided through the Budget Support (GBS and SBS).
The General Budget Support and Sector Budget Support have seen increases in their volume, reaching 266.7 million USD from 210.7 million USD for General Budget Support (representing 26% increase), and 124.8 million USD from 67 million USD for Sector Budget Support (representing 86% increase). The major contributors to this significant increase are African Development Bank and the World Bank. The African Development Bank’s significant increase is due to the fact that the level of their disbursement in the previous FY (FY 2010/2011) was lower than the annual allocation agreed through the CSP. The reason for the previous years’ low disbursement was the end of existing GBS programme given that it was the last year of the CSP. The significant increase by the African Development Bank is therefore a return to a normally allocated level of the budget support programme. The reason for the World Bank’s significant increase is was the prioritization of CAS resources to be channelled through GBS by the GoR preference to finance priority projects agreed upon with the Wold Bank.
Grants Loans
12%
88%

9Rwanda’s Official Development Assistance Report
FY 2011- 2012
Figure 3: ODA by Aid Modality (% share of total ODA)
Despite the significant level increase of the general and sector budget support, roughly 795 million USD, or 67% of ODA to Rwanda was provided through projects or basket funds (See Table 2). This includes support provided to GoR Ministries/budget implementing entities as well as non-GoR implemented development projects. The largest providers of project support were the USA and the Global Fund, with their combined support represent slightly more than half of total ODA provided through the project support.
Table 2: 2011/2012 ODA by Aid Modality
Grant / Loan - General Budget Support
Funding Source Disbursed (USD) Support (%)
African Development Bank 37,318,971
22.7%
European Union Delegation 36,160,714
Germany 9,665,838
United Kingdom 63,793,104
World Bank 119,738,808
Sub Total – General Budget Support 266,677,435
Grant - Sector Budget Support
Funding Source Disbursed (USD) Support (%)
African Development Bank 19,500,000
10.5%
Belgium 6,250,000
European Union Delegation 18,160,714
Germany 4,625,958
Netherlands 13,095,238
United Kingdom 13,431,035
World Bank 49,752,457
Sub Total – Sector Budget Support 124,815,402
Project Support General Budget Support Sector Budget Support
22%
7%
71%
ODA by Aid Modality FY 2010/2011
Project Support General Budget Support Sector Budget Support
67%
22%
11%
ODA by Aid Modality FY 2011/2012

10 Rwanda’s Official Development Assistance ReportFY 2011- 2012
Grant /Loan - Project Support / Financial & In-Kind
Funding Source Disbursed (USD) Support (%)
African Development Bank 27,067,995
66.9%
Belgium 37,268,187
Canada 4,645,065
European Union Delegation 24,634,371
Germany 21,603,431
Global Fund 193,708,992
Italy 194,569
Japan 20,199,427
Luxemburg 3,905,155
Netherlands 26,831,369
South Korea 3,516,228
Sweden 18,592,493
Switzerland 1,702,843
United Kingdom 50,255,003
United Nations 58,467,619
United States of America 223,710,926
World Bank 82,533,289
Sub-Total: Project Support 798,642,393
TOTAL 1,190,135,230 100%
The significant level increase of general and sector budget support is attributed to the several Development Partners who have increased the portion of their ODA provided through the budget support. The EU Delegation, the African Development Bank, the World Bank, as well as the United Kingdom all have disbursed more than 60% of their ODA through the budget support modality - see Table 3. However, the ODA provided through the project support was also increased at similar volume, which resulted in the portion of total ODA provided through the General and Sector Budget Support remains at around the same level with the previous fiscal year.
Table 3: Aid Modality by Development Partners FY 2011/2012
Development Partners GBS SBS Project Support GBS and SBS
Combined
African Development Bank 44% 23% 32% 68%
Belgium 0% 14% 86% 14%
Canada 0% 0% 100% 0%
European Union Delegation 46% 23% 31% 69%
Germany 27% 13% 60% 40%
Global Fund 0% 0% 100% 0%
Japan 0% 0% 100% 0%
Luxemburg 0% 0% 100% 0%
Netherlands 0% 33% 67% 33%
South Korea 0% 0% 100% 0%
Sweden 0% 0% 100% 0%
Switzerland 0% 0% 100% 0%
United Kingdom 50% 11% 39% 61%
United Nations 0% 0% 100% 0%
United States of America 0% 0% 100% 0%
World Bank 48% 20% 33% 67%
All Development Partners 22% 10% 67% 100%

11Rwanda’s Official Development Assistance Report
FY 2011- 2012
The Kigali Statement of Actions adopted in November 2010 calls for the increased proportion of ODA for the Government sector to be executed/implemented by the Government Agencies. This enhances the ownership and accountability of Government towards project implementation, thus, delivery of expected outcomes and results. Table 4 below shows the number of programmes/projects implemented in Rwanda and the total resources provided by each DP that are implemented by a GoR agency. The UN has the highest number of projects, with 90 active projects in the FY 2011/2012, which is an aggregated figure of the entire UN Agencies who reported on their projects in the DAD. Sixty nine (69) of all the UN projects and 67% of all UN ODA is implemented by the Government Agencies. The second largest contributor through projects is Belgium who had 25 active projects during FY 2011/2012. The largest contributor to project modality in terms of amounts disbursed is the USA, which is indicated to have the small number of projects. However, this is due to the way the US reports in the DAD, which is at Strategic Objective level, while the number of interventions (projects) is much higher. The second largest contributor to project modality in terms of amounts disbursed is the Global Fund. This is provided through 2 sizable projects in the health sector. With regard to the projects that are implemented by the Government Agencies, it is also worth noting that there continue to see differences in understanding of “GoR Implemented”. For example, the way projects supported by Japan and South Korea are managed/implemented is different from the way projects supported by the World Bank are managed/implemented, even though all these partners are recorded to have all their projects implemented by the GoR Agencies. The World Bank’s projects are implemented fully by the Government Agencies, while the projects supported by Japan and South Korea may not use the national execution procedures, such as the use of national procurement procedures. Nonetheless, the proportion of the disbursement made through the project modality that is implemented by the GoR Agencies has been increased from 52% in FY 2010/2011 to 60% in FY 2011/2012.
Table 4: FY 2011/2012 ODA to Projects implemented by Government Agencies
Development Partner
# of Projects
ODA Disbursed (USD) to Projects
# of Projects Gor Implemented
ODA GoR Implemented
(USD)
(%) ODA GoR
Implemented
AfDB 11 27,067,995 7 22,196,658 82%
Belgium 25 36,464,150 6 0%
Canada 6 4,645,065 3 4,242,347 91%
EU 19 24,634,371 17 19,650,069 80%
Germany 14 21,603,431 4 9,918,236 46%
Global Fund 2 193,708,992 2 193,708,992 100%
Japan 24 20,199,427 24 20,199,427 100%
Luxemburg 2 3,905,155 1 1,928,435 49%
By Netherlands 12 26,831,368 6 17,273,567 64%
South Korea 3 3,516,228 3 3,516,228 100%
Sweden 11 18,592,493 8 16,003,407 86%
Switzerland 9 1,702,843 3 266,616 16%
United Kingdom 12 50,255,003 11 47,668,796 95%
United Nations 90 55,532,889 69 37,009,394 67%
USA 6 223,710,926 1 0%
World Bank 25 82,533,289 23 82,301,066 100%
Total 271 794,903,625 166 475,883,238 60%
5.3 The Distribution of ODA in FY2010/2011
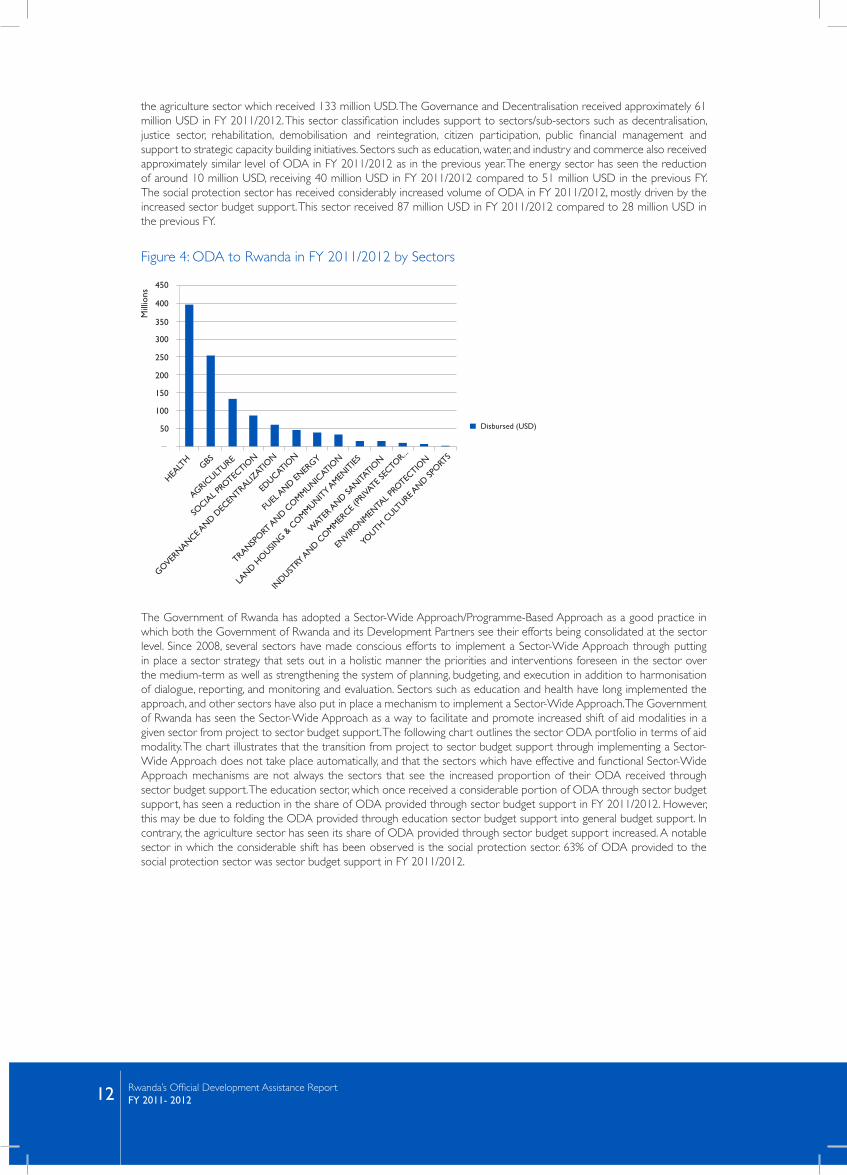
Figure 4 shows the distribution of ODA received in FY 2011/2012 by sectors. The sector bar titled “GBS” corresponds to support that is channelled through un-earmarked budget support. The sector classification used in the DAD does not correspond to the EDPRS sectors. Given this, the analysis of the distribution of ODA by EDPRS sectors is not possible at this time. However, the DAD is currently strengthened in terms of its functionality, and in this regard, the sector classification in the DAD will also be revised to fully align it to the EDPRS II sector classification. It is therefore expected that ODA reports from FY 2013/2014 will use the EDPRS II sector classification in its analysis of the ODA distribution by sectors.
As it was the case in the previous years, the Health Sector received the most ODA from Development Partners in FY 2011/2012. In FY 2011/2012, approximately USD 400 million of ODA was disbursed to health sector, with most of the funds coming from the Global Fund that specifically earmarks their support to Health interventions towards HIV/AIDS, TB and Malaria, followed by USA. The GBS also tops the second largest “sector” which received the ODA, followed by
12 Rwanda’s Official Development Assistance ReportFY 2011- 2012
the agriculture sector which received 133 million USD. The Governance and Decentralisation received approximately 61 million USD in FY 2011/2012. This sector classification includes support to sectors/sub-sectors such as decentralisation, justice sector, rehabilitation, demobilisation and reintegration, citizen participation, public financial management and support to strategic capacity building initiatives. Sectors such as education, water, and industry and commerce also received approximately similar level of ODA in FY 2011/2012 as in the previous year. The energy sector has seen the reduction of around 10 million USD, receiving 40 million USD in FY 2011/2012 compared to 51 million USD in the previous FY. The social protection sector has received considerably increased volume of ODA in FY 2011/2012, mostly driven by the increased sector budget support. This sector received 87 million USD in FY 2011/2012 compared to 28 million USD in the previous FY.
Figure 4: ODA to Rwanda in FY 2011/2012 by Sectors
The Government of Rwanda has adopted a Sector-Wide Approach/Programme-Based Approach as a good practice in which both the Government of Rwanda and its Development Partners see their efforts being consolidated at the sector level. Since 2008, several sectors have made conscious efforts to implement a Sector-Wide Approach through putting in place a sector strategy that sets out in a holistic manner the priorities and interventions foreseen in the sector over the medium-term as well as strengthening the system of planning, budgeting, and execution in addition to harmonisation of dialogue, reporting, and monitoring and evaluation. Sectors such as education and health have long implemented the approach, and other sectors have also put in place a mechanism to implement a Sector-Wide Approach. The Government of Rwanda has seen the Sector-Wide Approach as a way to facilitate and promote increased shift of aid modalities in a given sector from project to sector budget support. The following chart outlines the sector ODA portfolio in terms of aid modality. The chart illustrates that the transition from project to sector budget support through implementing a Sector-Wide Approach does not take place automatically, and that the sectors which have effective and functional Sector-Wide Approach mechanisms are not always the sectors that see the increased proportion of their ODA received through sector budget support. The education sector, which once received a considerable portion of ODA through sector budget support, has seen a reduction in the share of ODA provided through sector budget support in FY 2011/2012. However, this may be due to folding the ODA provided through education sector budget support into general budget support. In contrary, the agriculture sector has seen its share of ODA provided through sector budget support increased. A notable sector in which the considerable shift has been observed is the social protection sector. 63% of ODA provided to the social protection sector was sector budget support in FY 2011/2012.

13Rwanda’s Official Development Assistance Report
FY 2011- 2012
Figure 5: ODA allocations of Aid Modalities by Sectors.
In the below chart (Figure 6), we compare ODA that was provided to those sectors traditionally considered as productive sector versus non-productive sectors. Non-productive sectors include mainly social sectors such as health, education, water and sanitation, and social protection, but also include sectors such as governance and decentralisation, environmental protection and youth culture and sports. 72% of all ODA was provided to non-productive sectors, such as health, education, and social protection. Only 28% of ODA was provided to productive sectors, such as agriculture, energy, transport, industry and commerce, as well as communication/ICT. Compared to the FY 2010/2011, the share of ODA provided to productive sectors has slightly reduced from 31% to 28%. This is mostly due to the substantive increase of the Global Fund which was disbursed to the health sector. In addition, the significant increase to the social protection sector further added to the increased share of the ODA that went to the non-productive sector.
The biggest contributors to productive sectors included: World Bank, European Union Delegation, Netherlands, the African Development Bank, and United States of America (majority of their support goes to the agriculture sector). More than half of the ODA to the productive sectors is provided in the agriculture sector, followed by energy and transport. It is also worth noting that some of the Partners not captured in this report, such as China and the Arab Funds, contribute most of their funding to productive sectors, making actual financing to these productive sectors higher than what is reported here. In addition, the funding from the USA in the productive sector is entirely in the agriculture sector through their Strategic Objective Grant Agreement Seven (SOAG 07).
Figure 6: FY 2011/2012 ODA to Productive versus Non-Productive Sectors
Figure 7 illustrates the FY 2011/2012 ODA received according to the four MDG/EDPRS themes, Growth, Rural Development, Human Development and Governance. Compared to the allocation of ODA by MDGs/EDPRS Themes in the previous FY (FY 2010/2011), the notable change is the increased share of ODA that is provided to governance sector. This is mostly due to the increased funding to the social protection (which could be considered as rural development as well). The remaining allocation to other EDPRS themes saw a slight reduction in each theme. Human Development consumed over half of ODA (53%), followed by Rural Development (20%).
Non/Productive Sectors Productive Sectors
72%
28%

14 Rwanda’s Official Development Assistance ReportFY 2011- 2012
Figure 7: FY 2011/2012 ODA to MDGs/EDPRS Themes2
5.4 Development Assistance from Non-OECD-DAC Development Partners.
It has been difficult to report on the development assistance provided by non-OECD-DAC Development Partners, mostly due to the fact that their assistance is not reported in the DAD. However, their development assistance has been increasingly playing an important role in Rwanda’s development efforts. Most of non-OECD-DAC Development Partners are non-resident, thus difficult to secure from them exact ODA information especially in terms of disbursement. This is mostly due to the fact that direct payment is their commonly used modality of ODA disbursement. It is often the case that these partners pay directly to a contractor/vendor without channelling it through the Government accounts as well as procedures, thus resulting in lack of information in public accounts relating to actual amount of payment. However through on-going discussions, the Government requested these partners to either report the direct payment/disbursement information in the DAD or send the relevant information to MINECOFIN to be reported in the DAD on their behalf.
Nevertheless, the south-south cooperation in Rwanda has seen a steady increase in terms of the volume and the number of actors. The total volume disbursement of ODA from these partners was roughly US dollars 21.8 Million in FY 2011/2012, and these support is provided exclusively through project support. The major sectors of intervention/support are transport and energy infrastructure with limited support in health and water supply. India is one of the most recent emerging development partners with a consistent support in energy sector due to 2010 signed loan agreement to finance the Nyabarongo hydropower plant worth US$ 80 million. China as the oldest partner in the non OECD-DAC partners has seen a smaller volume of ODA compared to previous years due to the fact that most of their projects were closed in the previous fiscal year (FY 2010/2011) and the newly developed projects have not yet been implemented in FY 2011/2012. The other bloc of non- OECD-DAC development partners is constituted of Arab Funds which continued to provide ODA to Rwanda. For most of the projects, Arab Funds arrange a co-financing mechanism which facilitates synergy with government projects as well as monitoring and information flows.
While non-OECD-DAC Development Partners provide a small share of total ODA to Rwanda, it is noted that their ODA constitutes a high portion of preferential loans to Rwanda.
Table 5: Table FY2011/2012 ODA from none OECD-DAC Development Partnes
Development Partners DISBURSED ODA 2011/2012 USD
India (Exim bank) 11,195,708
China (Exim bank) 5,590,966
OPEC Fund for International Development (OFID) 2,269,008
Arab Bank for Economic Development in Africa (BADEA) 1,466,506
Kuwait Fund for Arab Economic Development (KFAED) 1,321,455
TOTAL 21,843,643
Human Development Rural Development Governance Growth
20%
10%17%
53%
2The EDPRS Themes include the following sectors as classified in the DAD for this reporting purpose: (1) Growth: Industry and Commerce (Private Sector Development), fuel and energy, and transport and communication. (2) Rural Development: Environmental Protection, Agriculture, Land Housing & Community Amenities; and Water and Sanitation. (3) Human Development: Youth Culture and Sports, Health, and Education: (4) Governance: Legislative and executive organs, public order and safety (these two sectors relate to governance and decentralization in this report), and social protection.

15Rwanda’s Official Development Assistance Report
FY 2011- 2012
6. Predictability of ODA Flows
6.1 The Predictability of All Support
The aggregate level predictability of ODA in FY 2011/2012 was very high, recording 99.7%. Several partners recorded 100% of predictability, actually disbursing the exact volume of ODA they scheduled for disbursement. These include USA and South Korea. The EU Delegation disbursed almost the exact volume of ODA they scheduled for disbursement. It is however worth noting that some Development Partners consider predictability slightly different from what the Government of Rwanda considers. The Government of Rwanda considers whether what was scheduled for disbursement to Rwanda was actually disbursed and received by/in Rwanda (both financial as well as in-kind). However, for some Development Partners due to their modality of cooperation. For example, USAID considers that once the allocation to Strategic Objectives (SOs) is approved, this is considered disbursed. Thus, for these partners, their predictability is always 100%.
Even if the aggregate level predictability of ODA was very high, the predictability rate varied greatly across DPs. Several partners have reduced their disbursement rate, such as Belgium, Luxemburg, Sweden, Switzerland, and the World Bank. Several others have disbursed considerably more than what they scheduled for disbursement, such as the Global Fund.
Some partners have improved their predictability, including African Development Bank, Canada, Japan, Netherlands and the UN.
6.2 ODA Predictability According to Aid Modality and Sectors
When examining predictability rate across aid modalities (Table 5) one would notice that predictability for GBS and SBS is relatively good, as compared to predictability of Project Support. In FY 2011/2012, the SBS modality registered the highest predictability at 93%, closely followed by GBS. Predictability of Project Support was 88%. This table did not include some 89 million USD in the analysis; due to those ODA did not specify the aid modality in the DAD.
Table 6: 2011/2012 ODA Predictability by Aid Modality
Modality Committed (USD) Disbursed (USD) % Predictability
General Budget Support (Grant/Loan) 291,928,023 269,612,165 92%
Sector Budget Support (Grant and Loan) 116,248,365 124,815,402 93%
Project Support (Grant/Loan, Financial and In-Kind) 703,902,564 795,707,663 88%
A closer look at predictability of ODA by various aid modalities as well as types of ODA (grants v.s. loans) revealed that predictability of grants is relatively better across all aid modalities (except for GBS). In particular, the low predictability of project support loan is of great concern, which requires further analysis as to the reasons for this low predictability. For example, is this because of the slow implementation of prerequisites for the effectiveness of loans that result in low disbursement rate of loans, or is it due to the rate of implementation that causes low rate of disbursement?
Table 7: 2011/2012 ODA Predictability by Aid Modality and Loan versus Grant
Modality Committed (USD) Disbursed (USD) % Predictability
Grant - General Budget Support 226,928,023 207,354,149 91%
Loan - General Budget Support 65,000,000 62,258,016 96%
Grant - Sector Budget Support 96,748,365 99,087,219 98%
Loan - Sector Budget Support 19,500,000 25,728,183 76%
Grant - Project Support / Financial 525,763,258 704,320,677 75%
Grant - Project Support / In-Kind 42,651,104 40,404,455 95%
Loan - Project Support / Financial 135,488,202 50,982,531 38%

16 Rwanda’s Official Development Assistance ReportFY 2011- 2012
Considering predictability of ODA by sectors (Table 7), the very low score may be in part due to poor reporting/over-reporting of commitment information in the DAD. Environmental protection, fuel and energy, and education have seen the improved predictability since the FY 2010/2011, while agriculture sector remains relatively low at 62%. The health sector and land housing received considerably higher level of disbursement compared to what was scheduled. Industry and commerce (private sector development), social protection and governance and decentralisation also received more than what was scheduled.
Table 8: Predictability of ODA by Sectors
Sector % Predictability
Governance and Decentralisation 107%
Environmental Protection 91%
Agriculture 62%
Industry and Commerce (Private Sector Development) 118%
Fuel and Energy 80%
Transport and Communication 73%
Land Housing & Community Amenities 135%
Water and Sanitation 118%
Youth, Culture and Sports 81%
Health 134%
Education 92%
Social Protection 114%
Predictability of aid both in terms of in-year predictability as well as medium-term predictability is of significant importance to the Government’s ability to execute and implement development projects and programmes effectively to have impacts on quality of lives of Rwandans. Over the years, the Government of Rwanda and Development Partners have worked together to improve predictability of aid. For example, efforts made by Development Partners to coordinate and harmonize better the conditionality framework of the Budget Support through Partnership Agreement as well as the Budget Support Harmonisation Group have resulted in improvement of predictability of budget support. Non-predictable aid (particularly in-year predictability) results in the Government covering the gaps through T-Bill, which have financing costs imposed on the Government. For example, in FY 2009/2010, the Government incurred approximately 2.2 million USD of financing costs in order to cover the financial gaps due to the delayed disbursement of budget support. In this regard, significant level of aid that is being suspended/delayed experienced in FY 2012/2013 will have catastrophic impacts on the Government’s ability to implement national development programmes. The Government is delaying implementation of a number of development projects due to the unavailability of funds, which would have negative impacts on the development and poverty reduction gains achieved through collaborative efforts of Government and its partners.

17Rwanda’s Official Development Assistance Report
FY 2011- 2012
7. Aid on BudgetAid on Budget in the Rwandan context is defined as ODA (external grants and loans) included in the Finance Law, which is approved by the Parliaments in accordance with the Organic Law No. 37/2006 of 12/09/2006 on State Finance and Property (the “Organic Budget Law”) and disbursed using GoR budget procedures. Aid on budget is therefore an important indicator to assess the extent in which aid is subject to the Parliamentary scrutiny, which enhances domestic accountability and ownership for the ODA Rwanda receives.
Table 9: Aid on Budget (FY 2010/2011 and FY 2011/2012)
Development Partners% ODA on Budget (FY
2011/2012)% ODA on Budget (FY
2010/2011)
AFDB 67% 51%
BELGIUM 72% 54%
CANADA 0% 0%
EUROPEAN UNION DELEGATION 95% 71%
GERMANY 74% 67%
GLOBAL FUND 39% 27%
JAPAN 0% 9%
LUXEMBOURG 0% 76%
NETHERLANDS 92% 94%
SOUTH KOREA 0% 0%
SWEDEN 49% 92%
SWITZERLAND 49% 53%
UNITED KINGDOM 77% 85%
UNITED STATES 4% 3%
WORLD BANK 96% 100%
UNITED NATIONS 15% 36%

18 Rwanda’s Official Development Assistance ReportFY 2011- 2012
8. Monitoring the Implementation of the DoLSince the agreement reached on Development Partners’ Division of Labour (DoL) in 2010, new development cooperation frameworks and programmes that have signed after 2010 have endeavoured to implement the agreed Division of Labour. The DoL principles called for more appropriate distribution of Development Partners’ support across sectors in line with the national priorities, more sizable support in any given sector, and support provided in a way that reduces transaction costs posed on the Government side. The principle of maximum 3 sectors per DP and neutral impact on the DPs’ ODA volume further guided the Government and Development Partner’s negotiation and agreement of their development cooperation framework. Taking on board the need for a pragmatic approach, the three DoL sectors will be only applicable for a new programme/project that is signed after the DoL agreement in 2010. This means that any existing contract/projects that have been run prior to the DoL agreement will run their course to complete the implementation/contract, even if these projects may be operational in sectors outside of the agreed DoL sector.
Since 2010, the following Development Partners have signed their new development cooperation framework/country assistance strategies: African Development Bank, Belgium, Germany, Netherlands, and Sweden. In general, these cooperation framework/country assistance strategies align to the agreed DoL sectors. Any new projects/programmes formulated within the new development cooperation framework mostly are aligned to the agreed DoL sectors. Many development partners also strive to move toward sizable support and reduction of transaction costs.
The table outlines the current distribution of ODA across DoL sectors, the average number and the size of interventions per DP in any given sector. The sector classification used in the DAD differs from the sector classification of the DoL. Thus, the ODA allocation across DoL sector may not accurately reflect the actual DP engagement in the DoL sector. For example, DAD does not have a sector called decentralisation as a standalone sector. Furthermore, DAD does not distinguish the contribution through the basket funds. This makes difficult to accurately record the nature of DP engagement in any given sectors. Nonetheless, the table highlights the sector receiving sizable contribution as well as those sectors which may be challenged in dealing with multiple small size projects. Given that the table outlines the ‘current’ distribution of ODA across DoL sectors, the table includes all the projects/programmes/contracts that started their implementation prior to the DoL agreement in 2010. As many Development Partners are formulating their new development cooperation framework/country assistance strategies in the context of the next EDPRS, more improved alignment to the DoL is expected.
Notable changes in terms of reduced fragmentation can be seen in the following sectors: agriculture, transport & ICT, social protection, and health and population. These sectors have seen the average size of initiatives in the sector increased considerably (in some cases, doubled from the previous FY). These sectors also observed less active development partners, while the total funding to these sectors have increased considerably. It therefore suggests that the Division of Labour agreement has started to have impact in terms of reduced fragmentation and increased sizable contribution. However, there are also sectors that have seen increased ‘fragmentation’. For example, there are nine active Development Partners in FY 2011/2012 compared to seven in the FY 2010/2011, with the total funding to the sector has seen only a slight increase. Thus, the average size of initiative increased. There are also several sectors that have seen reduced number of Development Partners with less funding to the sectors. These include: decentralisation, manufacturing, and energy. With regard to the decentralisation, this reduced funding may be the case that some of the Development Partners support to this sector may be considered under the social protection.
The effective implementation of the Division of Labour however requires analysis of sector financing and nature and modality of DP engagement in any given sectors. Given that the DAD sector classification differs from the DoL sector, and more detailed analysis is needed for each project/programme level reporting made in the DAD, further consideration may be needed to how the DAD reporting can be improved to effectively map out DP sector engagement in the DoL sectors as well as capture accurately the dialogue on project/financing agreement and its compliance to the DoL agreement.

19Rwanda’s Official Development Assistance Report
FY 2011- 2012
Table 10. Division of Labour M
apping
DP / Sector
Justice, R
econciliation, Law
& O
rder
Decentralization
& C
DF
Manufacturing
Services & O
ff-Farm
Industries
Forestry, Land &
Environment
Agriculture
Water &
Sanitation
EnergyTransport &
ICT
Youth, Sports &
Culture
Employm
entSocial Protection
Health &
PopulationEducation
Totals
E1E4 by Individual
AFD
B0
00
01
592,0760
05
32,101,892 1
1,540,4240
01
7,623,6100
00
00
00
01
829,5745
(of which is SBS &
Basket Funds)0
00
00
00
01
20,020,0000
00
00
00
00
00
00
00
0
00
00
1592,076
00
412,081,892
11,540,424
00
17,623,610
00
00
00
00
1829,574
22,667,576
BELG
IUM
11,653,403
11,178,528
00
00
6 6,278,687
26,833,803
34,516,714
00
00
1840,883
00
618,750,177
1316,496
8
(of which is SBS &
Basket Funds)0
00
00
00
00
00
00
00
00
00
00
01
6,250,000
11,653,403
11,178,528
00
00
66,278,687
26,833,803
34,516,714
00
00
1840,883
00
512,500,177
1316,496
34,118,691
CA
NA
DA
00
2983,646
00
00
1 3,017,241
00
00
00
00
00
00
00
00
2
(of which is SBS &
Basket Funds)0
00
00
00
00
00
00
00
00
00
00
00
00
0
00
2983,646
00
00
13,017,241
00
00
00
00
00
00
00
00
4,000,887
EURO
PEAN
CO
MM
ISSION
55,540,390
00
11,247,478
12,684,524
2 7,838,993
21,387,122
15,927,111
38,146,782
00
00
14,761,905
00
00
7
(of which is SBS &
Basket Funds)1
2,976,1900
00
01
2,684,5240
00
00
00
00
00
00
00
00
0
42,564,200
00
11,247,478
00
27,838,993
21,387,122
15,927,111
38,146,782
00
00
14,761,905
00
00
31,873,591
GER
MA
NY
1640,023
29,070,303
00
11,005,952
00
00
1107,351
00
22,109,127
2531,261
00
49,960,469
22,125,044
8
(of which is SBS &
Basket Funds)0
00
00
00
00
00
00
00
00
00
01
4,625,9580
0
1640,023
29,070,303
00
11,005,952
00
00
1107,351
00
22,109,127
2531,261
00
35,334,511
22,125,044
20,923,572
GLO
BA
L FUN
D0
00
00
00
00
00
00
00
00
00
00
02
193,708,9920
01
(of which is SBS &
Basket Funds)0
00
00
00
00
00
00
00
00
00
00
00
00
0
00
00
00
00
00
00
00
00
00
00
00
2193,708,992
00
193,708,992
JAPA
N0
00
01
165,3480
02
1,705,981 2
6,990,5594
2,270,6685
811,9350
00
00
00
04
3,275,7718
(of which is SBS &
Basket Funds)0
00
00
00
00
00
00
00
00
00
00
00
00
0
00
00
1165,348
00
21,705,981
26,990,559
42,270,668
5811,935
00
00
00
00
43,275,771
15,220,262
LUX
EMB
OU
RG
00
00
00
00
1 1,286,816
00
00
00
00
00
00
12,094,671
00
E1: 2
(of which is SBS &
Basket Funds)0
00
00
00
00
00
00
00
00
00
00
00
00
0
00
00
00
00
11,286,816
00
00
00
00
00
00
12,094,671
00
3,381,487
NET
HER
LAN
DS
15,714,286
44,670,709
00
17,758,621
00
00
39,114,663
00
00
22,247,615
00
00
17,380,952
E1: 10
(of which is SBS &
Basket Funds)1
5,714,2860
00
00
00
00
00
00
00
00
00
00
01
7,380,952
00
44,670,709
00
17,758,621
00
00
39,114,663
00
00
22,247,615
00
00
00
23,791,608
SWED
EN1
251,8890
00
02
5,447,1180
00
00
00
00
00
01
8,564,2320
00
E1: 6
(of which is SBS &
Basket Funds)0
00
00
00
00
00
00
00
00
00
00
00
00
0
1251,889
00
00
25,447,118
00
00
00
00
00
00
18,564,232
00
00
14,263,239
SWIT
ZER
LAN
D0
01
87,7660
00
01
120,0001
6,1070
00
00
00
01
87,7665
1,401,2050
0E1: 3
(of which is SBS &
Basket Funds)0
00
00
00
00
00
00
00
00
00
00
00
00
0
00
187,766
00
00
1120,000
16,107
00
00
00
00
187,766
51,401,205
00
1,702,844
UN
ITED
KIN
GD
OM
21,027,646
00
00
1 4,013,977
1 10,844,828
00
00
00
00
00
18,344,830
12,586,207
126,500,000
E1: 4
(of which is SBS &
Basket Funds)0
00
00
00
01
10,844,8280
00
00
00
00
00
12,586,207
126,500,000
21,027,646
00
00
14,013,977
00
00
00
00
00
00
18,344,830
00
13,386,453
UN
ITED
STAT
ES1
14,349,0000
00
00
01
50,258,000 0
00
00
00
00
00
03
159,103,9260
0E1: 3
(of which is SBS &
Basket Funds)0
00
00
00
00
00
00
00
00
00
00
00
00
0
114,349,000
00
00
00
150,258,000
00
00
00
00
00
00
3159,103,926
00
223,710,926
WO
RLD
BA
NK
00
00
12,481,703
2 414,151
5 26,210,138
00
517,530,432
216,894,516
00
00
346,171,120
00
22,400,000
E1: 9
(of which is SBS &
Basket Funds)0
00
00
00
00
00
00
00
00
00
02
45,752,4570
00
0
00
00
12,481,703
2414,151
526,210,138
00
517,530,432
216,894,516
00
00
1418,663
00
22,400,000
66,349,603
UN
ITED
NA
TIO
NS
182,604,081
00
11,767,883
1510,613,499
12 12,419,027
00
00
1191,109
00
414,849,842
257,285,182
21,420,336
E1: 9
(of which is SBS &
Basket Funds)0
00
00
00
00
00
00
00
00
00
00
00
00
0
182,604,081
00
11,767,883
1510,613,499
1212,419,027
00
00
00
1191,109
00
414,849,842
257,285,182
21,420,336
51,150,959
SOU
TH
KOR
EA0
00
00
00
00
00
00
00
00
00
00
00
02
868,285
(of which is SBS &
Basket Funds)0
00
00
00
00
00
00
00
00
00
00
00
00
0
00
00
00
00
00
00
00
00
00
00
00
00
2868,285
TOTA
L (E2)30
31,780,71810
15,990,9525
6,254,48823
31,937,84237
151,961,6038
16,758,01517
39,466,93911
33,476,8433
2,300,2365
3,619,75911
82,779,69547
394,890,82916
45,116,458
Average N
o. of Projects per Sector (E3)4
21
33
23
32
22
62
Average Size of Initiative Provided to the
Sector by Sector (E4)824,652
1,599,0951,250,898
1,329,6963,459,908
2,094,7522,321,585
3,043,349766,745
723,9524,114,138
8,668,833802,536
No of A
ctive DPs
85
57
115
64
23
68
9

20 Rwanda’s Official Development Assistance ReportFY 2011- 2012
9. ConclusionODA to the Government of Rwanda saw a substantial increase since the previous fiscal year. The nature and type of ODA more or less remained similar, while noting that the fact that development cooperation in Rwanda had experienced remarkable transformation in recent years. This is due to both the Government and its Development Partners’ commitment toward improvement of country systems, aid effectiveness reform, strengthening of aid management system and procedures, as well as for attainment of development results. Rwanda indeed celebrated significant progresses in 2012, reported by the third Integrated Household Living Condition survey as well as the fourth Demographic Health Survey published in early 2012. According to these surveys, Rwand achieved a double a double digit reduction of poverty (11.8%) since 2005; tremendous reduction of the infant mortality since 2005; halving the under-five mortality since 2005; doubling net secondary school attendance, among others. There is no doubt that these results were achieved through strengthened development partnership, strong community participation and contribution of all stakeholders. Stronger partnership and the trust in which development partners have had in the Government of Rwanda’s commitment to development results as well as the strength of the national country systems is indeed reflected in the increased level of development cooperation despite the global financial crisis as well as the continuous efforts being made by development partners on aid modalities.
It is, however, regrettable to note that the recent aid landscape resulted in a significant level of aid being suspended/delayed in FY 2012/2013 has had catastrophic impacts on the Government’s ability to implement national development programmes and execute national budget adequately. The Government is delaying implementation of a number of development projects due to the unavailability of funds in order to address the shortfalls of financial resources. This would likely to have negative impacts on the development and poverty reduction gains achieved through collaborative efforts of Government and its partners.
The Government of Rwanda, however, remains committed to achieving the development and poverty reduction goals and targets set for the EDPRS/EDPRS II as well as Rwanda’s Vision 2020 to transform lives of all Rwandan.

21Rwanda’s Official Development Assistance Report
FY 2011- 2012

22 Rwanda’s Official Development Assistance ReportFY 2011- 2012
Ministry of Finance and Economic Planning - External Finance Unit P.O. Box 158 Kigali - Rwanda | Tel: +250 (0) 252 577 994 | Fax: +250 (0) 252 577 581
E-mail: [email protected] | www.minecofin.gov.rw | www.devpartners.gov.rw
Ministry of Finance and Economic Planning - External Finance Unit P.O. Box 158 Kigali - Rwanda | Tel: +250 (0) 252 577 994 | Fax: +250 (0) 252 577 581
E-mail: [email protected] | www.minecofin.gov.rw | www.devpartners.gov.rw