office of fossil energy cycle ghg... · office of fossil energy national energy technology...
TRANSCRIPT

Life Cycle Greenhouse Gas Perspective on Exporting Liquefied Natural Gas from the United States
May 29, 2014 DOE/NETL-2014/1649
OFFICE OF FOSSIL ENERGY
National Energy Technology Laboratory

Disclaimer This report was prepared as an account of work sponsored by an agency of the United States Government. Neither the United States Government nor any agency thereof, nor any of their employees, makes any warranty, express or implied, or assumes any legal liability or responsibility for the accuracy, completeness, or usefulness of any information, apparatus, product, or process disclosed, or represents that its use would not infringe privately owned rights. Reference therein to any specific commercial product, process, or service by trade name, trademark, manufacturer, or otherwise does not necessarily constitute or imply its endorsement, recommendation, or favoring by the United States Government or any agency thereof. The views and opinions of authors expressed therein do not necessarily state or reflect those of the United States Government or any agency thereof.

Author List:
National Energy Technology Laboratory (NETL)
Timothy J. Skone, P.E. Senior Environmental Engineer
Strategic Energy Analysis and Planning Division
Energy Sector Planning and Analysis (ESPA)
Gregory Cooney, Matthew Jamieson, James Littlefield, Joe Marriott, Ph.D. Booz Allen Hamilton, Inc.
This report was prepared by Energy Sector Planning and Analysis (ESPA) for the United States Department of Energy (DOE), National Energy Technology Laboratory (NETL). This work was completed under DOE NETL Contract Number DE-FE0004001. This work was performed under ESPA Task 150.08.02.
The authors wish to acknowledge the excellent guidance, contributions, and cooperation of the NETL staff.
DOE Contract Number DE-FE0004001

This page intentionally left blank.

Life Cycle GHG Perspective on Exporting LNG from the U.S.
Table of Contents 1 Introduction ...................................................................................................................................1 2 LCA Approach ..............................................................................................................................1 3 Natural Gas Modeling Approach ..................................................................................................3 4 Coal Modeling Approach ..............................................................................................................4 5 Key Modeling Parameters.............................................................................................................5 6 Results ...........................................................................................................................................7 7 Summary and Study Limitations ................................................................................................18 8 References ...................................................................................................................................19 Appendix A – Life Cycle Results in IPCC AR4 and AR5 GWPs……………………………...A-1
i

Life Cycle GHG Perspective on Exporting LNG from the U.S.
Tables Table 2-1: IPCC AR4 and AR5 Global Warming Potentials (Forster, et al., 2007 and IPCC,
2013) ............................................................................................................................ 3 Table 5-1: Key Modeling Parameters for Natural Gas Extraction, Export, and Power Generation
– LNG Cases ............................................................................................................... 6 Table 5-2: Key Modeling Parameters for Natural Gas Extraction, Export, and Power Generation
– Russian Cases ........................................................................................................... 6 Table 5-3: Key Modeling Parameters for Coal Extraction and Power Generation ........................ 6 Table 5-4: Parameters for Natural Gas Extraction .......................................................................... 7 Table 5-5: Parameters for Natural Gas Processing ......................................................................... 8 Table 5-6: Parameters for Natural Gas Transmission by Pipeline .................................................. 8 Table 6-1: Coal and Natural Gas Breakeven for U.S. LNG and Russian NG Scenarios .............. 14
Figures
Figure 6-1: Life Cycle GHG Emissions for Natural Gas and Coal Power in Europe .................... 9 Figure 6-2: Life Cycle GHG Emissions for Natural Gas and Coal Power in Asia ....................... 10 Figure 6-3: Speciated Life Cycle GHG Emissions of Natural Gas Power – U.S. LNG to
Rotterdam Scenario ................................................................................................... 11 Figure 6-4: Speciated Life Cycle GHG Emissions of Natural Gas Power – Russian NG to
Rotterdam Scenario ................................................................................................... 12 Figure 6-5: Speciated Life Cycle GHG Emissions of Coal Power ............................................... 12 Figure 6-6: 100-yr GWP comparison of Coal and NG Power in Europe and Asia ...................... 13 Figure 6-7: 20-yr GWP comparison of Coal and NG Power in Europe and Asia ........................ 13 Figure 6-8: Coal and Natural Gas Breakeven for U.S. LNG and Russian NG Scenarios (100-year
GWP) ......................................................................................................................... 15 Figure 6-9: Coal and Natural Gas Breakeven for U.S. LNG and Russian NG Scenarios (20-year
GWP) ......................................................................................................................... 15 Figure 6-10: Uncertainty Tornado LNG – New Orleans to Rotterdam, Netherlands ................... 16 Figure 6-11: Uncertainty Tornado LNG – Oran, Algeria to Rotterdam, Netherlands .................. 16 Figure 6-12: Uncertainty Tornado LNG – New Orleans to Shanghai, China .............................. 17 Figure 6-13: Uncertainty Tornado LNG – Darwin, Australia to Osaka, Japan ............................ 17 Figure 6-14: Uncertainty Tornado Russian NG – Yamal, Russia to Rotterdam, Netherlands ..... 17 Figure 6-15: Uncertainty Tornado Russian NG – Yamal, Russia to Shanghai, China ................. 18 Figure 6-16: Uncertainty Tornado Coal – Europe and Asia Regional Production ....................... 18
ii

Life Cycle GHG Perspective on Exporting LNG from the U.S.
Acronyms and Abbreviations AR4 Fourth Assessment Report (IPCC) AR5 Fifth Assessment Report (IPCC) AU Australia Btu British thermal unit CH4 Methane CO2 Carbon dioxide CO2e Carbon dioxide equivalent DZ Algeria ECF Energy conversion facility EIA Energy Information Administration EU End use GHG Greenhouse gas GWP Global warming potential HRSG Heat recovery steam generator I-6 Illinois No. 6 IPCC Intergovernmental Panel on Climate
Change JP Japan kg Kilogram km Kilometer lb Pound
LCA Life cycle analysis LNG Liquefied natural gas mi Mile MWe Megawatt electric MWh Megawatt-hour N2O Nitrous Oxide NL Netherlands Nmi Nautical mile NETL National Energy Technology
Laboratory NGCC Natural gas combined cycle NSPS New Source Performance Standards PRB Powder River Basin PT Product Transport RMA Raw material acquisition RMT Raw material transport RU Russia SF6 Sulfur hexafluoride scf Standard cubic foot SCPC Supercritical pulverized coal U.S. United States
iii

This page intentionally left blank.

Life Cycle GHG Perspective on Exporting LNG from the U.S.
1 Introduction This analysis calculates the life cycle greenhouse gas (GHG) emissions for regional coal and imported natural gas power in Europe and Asia. The primary research questions are as follows:
• How does exported liquefied natural gas (LNG) from the U.S. compare with regional coal (or other LNG sources) for electric power generation in Europe and Asia, from a life cycle greenhouse gas (GHG) perspective?
• How do those results compare with natural gas sourced from Russia and delivered to the same European and Asian markets via pipeline?
The National Energy Technology Laboratory (NETL) exercised its life cycle analysis (LCA) model to represent unconventional natural gas production and transport to a New Orleans liquefaction facility, liquefaction, and then transport to an import terminal in Rotterdam, Netherlands to represent a European market and to Shanghai, China to represent Asian Markets. LNG from Oran, Algeria was modeled to represent an alternative regional LNG European market supply source with a destination of Rotterdam and LNG from Darwin, Australia was modeled to represent an alternative regional LNG Asian market supply source with a destination of Osaka, Japan. Conventional natural gas extracted from the Yamal region of Siberia in Russia was modeled as the regional pipeline gas alternative for both the European and Asian markets. Regional coal production and consumption (i.e., Germany and China) were also modeled. Scenario specific variability was modeled by adjusting methane leakage for natural gas production, coal type (bituminous and sub-bituminous), transport distance (ocean tanker for LNG and rail for coal), and power plant efficiency.
This analysis is based on data that were originally developed to represent U.S. energy systems. In general, the NETL natural gas and coal LCA models were adapted for this study. U.S. natural gas production and average U.S. coal production were modeled as representative of foreign natural gas and coal production. No ocean transport of coal was included to represent the most conservative coal profile (regionally sourced or imported). The specific LNG export/import locations used in this study were chosen to represent an estimate for a region (e.g. New Orleans as U.S. Gulf Coast). Specific locations were required to allow for the estimation of LNG transport distances and do not imply the likelihood that LNG export or import will occur from that exact location. The same assumptions hold true for the Russian natural gas cases.
2 LCA Approach This is a cradle-to-grave LCA that begins with extraction of natural gas or coal and ends with electricity delivered to the consumer. NETL uses five life cycle (LC) stages, beginning with the acquisition of raw materials and ending with energy consumption. These five life cycle stages are listed below:
• LC Stage #1: Raw Material Acquisition (RMA) includes extraction of a natural resource and any necessary processing steps that prepare it for transport. The raw materials of this analysis are natural gas and coal.
• LC Stage #2: Raw Material Transport (RMT) includes the transport of a raw material between the extraction site and power plant. Natural gas is transported by pipeline and ocean tanker for the LNG cases and pipeline only for the Russian natural gas cases; coal is transported by rail.
• LC Stage #3: Energy Conversion Facility (ECF) includes the operation of a power plant that converts fuel to energy. The power plants of this analysis convert natural gas or coal to
1

Life Cycle GHG Perspective on Exporting LNG from the U.S.
electricity. The handling and disposal of coal waste products are outside of the boundary of this analysis and are assumed to have minimal GHG emissions relative to the other processes considered in this analysis.
• LC Stage #4: Product Transport (PT) moves the product from the ECF to the consumer. In this analysis, electricity is transported over a national electricity grid.
• LC Stage #5: End Use (EU) represents the final consumption of a product. In this analysis, no burdens are associated with the consumption of electricity.
Four scenarios are modeled in this analysis for two different geographies (Europe and Asia)1:
• Scenario 1: Natural gas is extracted in the U.S. from the Marcellus Shale, transported by pipeline to an LNG facility where it is compressed and loaded onto an LNG tanker, transported to an LNG port in the receiving country (Rotterdam for the European case and Shanghai for the Asian case) where it is re-gasified, and then transported to a natural gas power plant. It was assumed that the power plant is located near the LNG import site.
• Scenario 2: This is the same as Scenario 1, except that the natural gas comes from a regional source relative to the destination. In the European case, the source is Algeria, and in the Asian case, the source is Australia. It was assumed that the regional gas is produced using conventional extraction methods. The LNG tanker transport distance is adjusted accordingly.
• Scenario 3: Natural gas is produced in the Siberian region of Russia utilizing conventional extraction methods and is transported by pipeline to a power plant in Europe or Asia.
• Scenario 4: Coal is extracted in the region of study (Europe or Asia) and transported by rail to a domestic coal-fired power plant in China or Germany. This analysis models both surface sub-bituminous and underground bituminous coals based on U.S. extraction data.
In all four scenarios, electricity is distributed using existing transmission infrastructure. The functional unit, which serves as a basis for comparison, is 1 MWh of electricity delivered to a consumer. The results of this analysis include only GHG emissions. GHGs in this inventory are reported on a common mass basis of carbon dioxide equivalents (CO2e) using the global warming potentials (GWP) of each gas from the 2013 Intergovernmental Panel on Climate Change (IPCC) Fifth Assessment Report (AR5) (IPCC, 2013). The default GWP used is the 100-year time frame but, in some cases, results for the 20-year time frame are presented as well. Table 2-1 shows the GWPs used for the GHGs inventoried in this study. The Appendix also provides results on the basis of the GWPs developed in the Fourth Assessment Report (AR4) in the Appendix (Forster, et al., 2007). Note that the AR5 GWP value used for fossil methane emissions was 30. There are no biogenic methane releases in the natural gas or coal models. The AR5 GWP for biogenic methane is 28.
1 The goal of this analysis is to model plausible (medium and long distance) export scenarios while also considering regional fuel alternatives. The purpose of the medium and long distance scenarios is to establish low and high bounds for likely results.
2

Life Cycle GHG Perspective on Exporting LNG from the U.S.
Table 2-1: IPCC AR4 and AR5 Global Warming Potentials (Forster, et al., 2007 and IPCC, 2013)
GHG AR5 (IPCC 2013) AR4 (IPCC 2007)
20-year 100-year (Default) 20-year 100-year
CO2 1 1 1 1 CH4 85 30 72 25 N2O 264 265 289 298 SF6 17,500 23,500 16,300 22,800
3 Natural Gas Modeling Approach NETL’s natural gas model uses a comprehensive set of parameters within a flexible network of unit processes, allowing the modeling of different types of natural gas sources. Key variables include lifetime well production rates, emission factors for episodic emissions (e.g. completions and workovers), flaring rates at extraction and processing, workover and liquid unloading frequency, and pipeline distance. The model currently has scenarios for natural gas from the following seven sources: conventional onshore, associated, conventional offshore, tight gas, Barnett Shale, Marcellus Shale, and coal bed methane. For additional details on the natural gas model, refer to the NETL Life Cycle Analysis of Natural Gas Extraction and Power Generation (NETL, 2014). For Scenario 1 of this analysis, all natural gas is modeled as unconventional gas from the Marcellus Shale. For the purposes of this analysis, Marcellus Shale gas was utilized as a proxy for new unconventional natural gas production. The life cycle GHG emissions for the extraction of natural gas from Barnett Shale, Marcellus Shale, and tight gas as modeled in the NETL Life Cycle Analysis of Natural Gas Extraction and Power Generation differed by less than 2 percent (NETL, 2014). For Scenarios 2 and 3, the extraction process is modeled after conventional onshore natural gas production in the U.S. This includes both the regional LNG supply options (Algeria for Europe and Australia for Asia) and extraction in Siberia for pipeline transport to the demand centers.
In all three natural gas scenarios, the extracted and processed natural gas is transported via pipeline, either to an LNG terminal (Scenarios 1 and 2) or directly to a power plant (Scenario 3). The transmission of natural gas by pipeline involves the combustion of a portion of the natural gas in compressors as well as fugitive losses of natural gas. For Scenarios 1 and 2, the pipeline distance from natural gas extraction site to the LNG terminal is 971 km. This is the average distance of natural gas pipeline transmission in the U.S. (NETL, 2014). This distance is based on the characteristics of the entire transmission network and delivery rate for natural gas in the U.S. Note, the same pipeline distance is utilized for both the U.S. and regional LNG scenarios. This simplification was utilized to focus on the differences in life cycle GHG emissions from transport of the LNG.
NETL’s model also includes an option for the LNG supply chain. After extraction and processing, natural gas is transported by pipeline to a liquefaction facility. The LNG is then loaded onto an ocean tanker, transported to an LNG terminal with regasification operations, and then fed to a pipeline that transports it to a power plant. The data for the LNG supply chain accounts for the construction and operation of LNG infrastructure. For this analysis, it was assumed that the natural gas power plant in each of the import destinations is existing and located close to the LNG port, so no additional pipeline transport of natural gas is modeled in the destination country.
For the U.S. (New Orleans) to Shanghai, China route, it was assumed that the Panama Canal is a viable option for LNG tankers. This assumption is tested in the uncertainty analysis section of this study. All other routes (New Orleans to Rotterdam, Netherlands; Oran, Algeria to Rotterdam,
3

Life Cycle GHG Perspective on Exporting LNG from the U.S.
Netherlands; and Darwin, Australia to Osaka, Japan) do not require the use of a canal. The distances used for LNG transport are available in Table 5-1.
For Scenario 3, the pipeline distance was calculated based on the great circle distance between the Yamal district of Siberia, Russia to a power plant located in Rotterdam, Netherlands or Shanghai, China. Yamal was chosen as the extraction site because that region accounted for 82.6 percent of Russian natural gas production in 2012 (EIA, 2013). The great circle distance is the shortest possible distance between two points on a sphere and was therefore used to represent the shortest possible pipeline distance between the extraction source and the power plant. An additional 1,000 km of pipeline transport were added to the great circle distance to specify the expected pipeline transport distance. Given the extensive pipeline networks in Europe and Asia, determining an actual distance was not possible, nor was it required for this level of analysis. This assumption is tested in the uncertainty analysis section of this study. The distances used for pipeline transport of Russian gas are available in Table 5-2.
The efficiency of the destination power plant is an important parameter required for determining the life cycle emissions for natural gas power. Average baseload natural gas-fired power plants in the U.S. have a net efficiency of 46.4 percent (NETL, 2014). This analysis utilized the range of efficiencies that are consistent with the NETL modeling of natural gas power in the U.S. (NETL, 2014). This analysis assumed the same range of power plant efficiencies in the destination countries as was used for the U.S. model. The efficiency range is designed to be representative of fleet baseload power plants.
The transmission of electricity from the power plant to consumer incurs a 7 percent loss of electricity. The consumption of electricity does not have any energy or material flows. A comprehensive list of the modeling parameters and values for the natural gas scenarios are provided in Table 5-1 and Table 5-2.
4 Coal Modeling Approach This analysis utilizes NETL’s existing LCA model for the extraction and transport of sub-bituminous and bituminous coal in the U.S. for foreign extraction in Germany and China. Foreign coal production was modeled as having emissions characteristics equivalent to average U.S. coal production.
Raw material extraction for coal incorporates extraction profiles for coal derived from the Powder River Basin (PRB), where sub-bituminous, low-rank coal is extracted from thick coal seams (up to approximately 180 feet) via surface mines located in Montana and Wyoming, and coal derived from the Illinois No. 6 (I-6) coal seam, where bituminous coal is extracted via underground longwall and continuous mining. In general, PRB represents coal from surface mining sources, and I-6 coal represents coal from underground sources. The regionally extracted coal is transported to the power plant by rail in both the European and Asian cases. The expected rail distance for both locations is 725 miles.
PRB coal is modeled using modern mining methods in practice at the following mines: Peabody Energy’s North Antelope-Rochelle mine (97.5 million short tons produced in 2008), Arch Coal, Inc.’s Black Thunder Mine (88.5 million short tons produced in 2008), Rio Tinto Energy America’s Jacobs Ranch (42.1 million short tons produced in 2008), and Cordero Rojo Operation (40.0 million short tons produced in 2008). These four mines were the largest surface mines in the United States in 2008 according to the National Mining Association’s 2008 Coal Producer Survey (National Mining Association, 2009). For the purposes of this assessment, it is assumed that the coal seam in the area of active mining was previously drilled to extract methane. Based on the NETL Quality Guidelines
4

Life Cycle GHG Perspective on Exporting LNG from the U.S.
for Energy Systems Studies, this analysis uses a factor of 8 scf/ton for coal bed methane emissions for surface mining of PRB coal and a heating value of 8,564 Btu/lb (NETL, 2010a; 2012).
I-6 coal is part of the Herrin Coal seam, and is a bituminous coal that is found in seams in the southern and eastern regions of Illinois and surrounding areas that typically range from about 2 to 15 feet in thickness. I-6 coal is commonly extracted via underground mining techniques, including continuous and longwall mining. I-6 coal seams may contain relatively high levels of mineral sediments or other materials, and therefore require coal cleaning (beneficiation) at the mine site. During the acquisition of I-6 coal, methane is released during both the underground coal extraction and the post-mining coal preparation activities. Based on the NETL Quality Guidelines for Energy Systems Studies, this analysis uses a factor of 360 scf/ton for coal bed methane emissions for underground mining of I-6 coal and a heating value of 11,666 Btu/lb (NETL, 2010b; 2012).
The heating value of coal and the heat rate of the power plant were used to determine the feed rate of coal to the power plant. Average baseload coal-fired power plants in the U.S. have a net efficiency of 33.0 percent (NETL, 2014). For consistency, this analysis utilized the range of efficiencies that were previously used for the modeling of coal power in the U.S. (NETL, 2014). This analysis assumed the same range of power plant efficiencies for Europe and Asia as the U.S. model. The efficiency range is designed to be representative of fleet baseload power plants.
Electricity transmission and consumption is modeled using the same data used by the natural gas power scenario. The transmission of electricity from the power plant to consumer incurs a 7 percent loss of electricity. The consumption of electricity does not have any energy or material flows. A comprehensive list of the modeling parameters and values for the coal scenarios are provided in Table 5-3.
5 Key Modeling Parameters The LCA results are sensitive to changes in natural gas and coal and extraction characteristics, transport distances, and power plant performance. The key parameters for the natural gas scenarios are shown in Table 5-1 (LNG) and Table 5-2 (Russian natural gas), and the key parameters for the coal scenario are shown in Table 5-3. The range of natural gas methane leakage rates is calculated as a function of more specific parameters used in that model, such as the flaring rate, well completion, and well workover factors. The range in leakage rate is a function of the uncertainty of the underlying parameters. These parameter values and ranges are detailed in Tables 5-4, 5-5, and 5-6, as well as the the NETL Life Cycle Analysis of Natural Gas Extraction and Power Generation (NETL, 2014).
The methane leakage for the Russian natural gas cases is higher than the leakage for LNG because of the difference in the pipeline distance. There are also slight differences in methane leakage from extraction between the difference gas types, but the majority of the difference is driven by pipeline losses. A methane leakage breakeven analysis is conducted in Section 6 of this document. That analysis determines the breakeven leakage at which the life cycle GHG emissions for natural gas power would equal those for the coal reference case. NETL’s upstream results are consistent with other life cycle studies on natural gas. For a more detailed review of the status of current natural gas research, related uncertainties, and a comparison of the NETL life cycle GHG results with those from literature, see Section 6 of the NETL Life Cycle Analysis of Natural Gas Extraction and Power Generation (NETL, 2014).
5

Life Cycle GHG Perspective on Exporting LNG from the U.S.
Table 5-1: Key Modeling Parameters for Natural Gas Extraction, Export, and Power Generation – LNG Cases
LC Stage Model Parameter Low Expected High
LC Stage #1 (RMA) and #2 (RMT)
Methane Leakage
(cradle-to-liquefaction)
Marcellus Shale Gas 1.2% 1.4% 1.6%
Conventional Onshore Gas 1.1% 1.3% 1.6%
Gas Type Marcellus Shale – U.S. Gas Conventional Onshore – Regional Gas
Pipeline Distance (Extraction to LNG Facility) (km) 777 971 1,166
Transport Distances
(Nautical mi)
New Orleans to Rotterdam, Netherlands 4,301 4,801 5,301
Oran, Algeria to Rotterdam, Netherlands 1,082 1,582 2,082
New Orleans to Shanghai, China 9,497 9,997 14,844
Darwin, Australia to Osaka, Japan 2,385 2,885 3,385
LC Stage #3 (ECF) Power Plant Net Efficiency 41.2% 46.4% 49.2%
LC Stage #4 (PT) Electricity Transmission and Distribution Loss 7%
Table 5-2: Key Modeling Parameters for Natural Gas Extraction, Export, and Power Generation – Russian Cases
LC Stage Model Parameter Low Expected High
LC Stage #1 (RMA) and #2 (RMT)
Methane Leakage1
(cradle-to-delivered)
Yamal, Russia to Rotterdam, Netherlands 2.8% 3.4% 4.1%
Yamal, Russia to Shanghai, China 3.7% 4.3% 5.0%
Gas Type Conventional Onshore
Pipeline Distance (km)
Yamal, Russia to Rotterdam, Netherlands 3,792 4,792 5,792
Yamal, Russia to Shanghai, China 5,447 6,447 7,447
LC Stage #3 (ECF) Power Plant Net Efficiency 41.2% 46.4% 49.2%
LC Stage #4 (PT) Electricity Transmission and Distribution Loss 7%
Table 5-3: Key Modeling Parameters for Coal Extraction and Power Generation
LC Stage Model Parameter Low Expected High
LC Stage #1 (RMA) Coal Mine Methane (scf/ton) 8 8 360
Coal Type PRB PRB I-6
LC Stage #2 (RMT) Rail Transport Distance (miles) 225 725 1,225
LC Stage #3 (ECF) Power Plant Net Efficiency 28.3% 33.0% 36.7%
LC Stage #4 (PT) Electricity Transmission and Distribution Loss 7%
1 U.S. conventional onshore extraction is used as a proxy for Russian natural gas extraction in the model for this analysis. The differences in the calculated leakage rates for Russian natural gas (as compared to the U.S. leakage rates in Table 5-1) are driven only by the longer pipeline transmission distance for the extracted gas. As the pipeline distance increases, the total methane leakage from pipeline transmission increases and so does the amount of natural gas that is extracted to meet the same demand for delivered natural gas.
6

Life Cycle GHG Perspective on Exporting LNG from the U.S.
Table 5-4 summarizes the key extraction parameters for each extraction type. The average production rate of each well is used to apportion episodic emissions per unit of gas produced. Episodic emissions occur as one-time impulses or, in some cases, as periodic well maintenance activities. Examples of episodic emissions include the volume of natural gas vented during well completions and workovers (which are higher for unconventional wells than for conventional wells) and liquid unloading (a practice assumed to be unique to onshore conventional wells). Flaring rate is a modeling parameter because the global warming potential of vented natural gas, which is composed mostly of methane, can be reduced if it is flared to CO2. Emissions from valves and other sources are key sources of emissions that occur during steady-state extraction operations. Table 5-4 also shows uncertainty bounds when such data are available. The two uncertainties that the model accounts for during natural gas extraction are well production rates and flaring rates.
Table 5-4: Parameters for Natural Gas Extraction
Property (Units) Onshore Conventional Marcellus Shale
Natural Gas Source
Average Production Rate (Mcf/day)
L 46 201
E 66 297
H 86 450
Expected EUR (Bcf) 0.72 3.25
Natural Gas Extraction
Flaring Rate of Vented NG (%) 51% (41 - 61%) 15% (12 - 18%)
Well Completion (Mcf natural gas/episode) 37 9,000
Well Workover (Mcf natural gas/episode) 2.44 9,000
Lifetime Well Workovers (Episodes/well) 1.1 0.3
Liquids Unloading (Mcf/episode) 3.57 N/A
Lifetime Liquid Unloadings (Episodes/well) 930 N/A
Valve Emissions, Fugitive (lb. CH₄/Mcf) 0.11
Other Sources, Point Source (lb. CH₄/Mcf) 0.003
Other Sources, Fugitive (lb. CH₄/Mcf) 0.043
Table 5-5 shows the modeling parameters for natural gas processing. It accounts for the removal efficiencies and emissions from acid gas removal and dehydration, emissions from valves and other processing infrastructure, and the type of compressors used at processing facilities. All natural gas processing plants are assumed to have the same performance characteristics, regardless of natural gas source. The one exception is compressor profiles; most onshore processing plants use gas-powered reciprocating compressors, all offshore processing plants use gas-powered centrifugal compressors, and processing plants in the Barnett Shale region uses a combination of gas-powered reciprocating and electrically-powered centrifugal compressors.
7

Life Cycle GHG Perspective on Exporting LNG from the U.S.
Table 5-5: Parameters for Natural Gas Processing
Property (Units) Onshore Conventional Marcellus Shale
Acid Gas Removal (Amine Absorber and Regenerator)
Flaring Rate of Vented NG (%) 100%
CH₄ Absorbed (lb. CH₄/Mcf) 0.04
CO₂ Absorbed (lb. CO₂/Mcf) 0.56
H₂S Absorbed (lb. H₂S/Mcf) 0.21
NMVOC Absorbed (lb. NMVOC/Mcf) 6.59
Dehydration (Glycol Dehydrator and Regenerator)
Flaring Rate of Vented NG (%) 100%
Water Removed (lb. H₂O/Mcf) 0.045
CH₄ Emission Rate (lb. CH₄/Mcf) 0.0003
Valves & Other Sources of Emissions
Flaring Rate (%) 100%
Valve Emissions, Fugitive (lb. CH₄/Mcf) 0.0003
Other Sources, Point Source (lb. CH₄/Mcf) 0.02
Other Sources, Fugitive (lb. CH₄/Mcf) 0.03
Natural Gas Compressor Profile at Processing Plant
Gas-powered Reciprocating (%) 100% 100%
Gas-powered Centrifugal (%) 0% 0%
Electrically-powered Centrifugal (%) 0% 0%
Table 5-6 shows the modeling parameters for natural gas transmission by pipeline. An average transmission distance of 971 km (604 miles) with an uncertainty of +/- 20 percent is used for all natural gas types. The mix of compressor technologies used for natural gas transmission is also parameterized.
Table 5-6: Parameters for Natural Gas Transmission by Pipeline
Property (Units) Value (Uncertainty)
Pipeline Transport Distance (km) 971 (777 – 1,166)
Distance Between Compressors (km) 121
Compressor, Gas-powered Reciprocating (%) 78%
Compressor, Gas-powered Centrifugal (%) 19%
Compressor, Electrical, Centrifugal (%) 3%
6 Results The LCA results for natural gas and coal power generation in Europe and Asia are shown in Figure 6-1 and Figure 6-2, respectively. The results in both figures are shown on both 100-year and 20-year GWP time frames, which is especially important due to the uncaptured venting and fugitive emissions of methane in natural gas systems. Detailed results for all of the scenarios in these figures are provided in the Appendix for both AR4 and AR5 GWPs. It is important to note that the results from this analysis bracket the range of variability based on the cumulative change to the key
8

Life Cycle GHG Perspective on Exporting LNG from the U.S.
parameters. Figure 6-1 and Figure 6-2 report an expected value for each of the scenarios. These values should not be interpreted as the most likely values due to the wide range of scenario variability and uncertainty in the underlying modeled data. Rather, the expected values allow for the evaluation of the contribution of each of the major processes to the total life cycle emissions (e.g. extraction, transport, combustion). The results should be interpreted as general guidance to provide perspective on trends only and not as prescriptive, scenario-specific results.
Figure 6-1: Life Cycle GHG Emissions for Natural Gas and Coal Power in Europe
In general, the results from Figure 6-1 and Figure 6-2 indicate that for most scenarios in both the European and Asian regions, the generation of power from imported natural gas has lower life cycle GHG emissions than power generation from regional coal. On the basis of a 20-year GWP, there is some overlap in the uncertainty bars for the Russian natural gas and regional coal cases for both Europe and Asia. Additionally, there is a small overlap between the uncertainty bars for the U.S. LNG to Shanghai case and regional coal case on a 20-year GWP basis. It is important to note that this overlap is based on an assumption of high methane leakage (1.6%) and low power plant efficiency (41.2%) for U.S. LNG and low methane content (8 scf/ton) and high power plant efficiency (36.7%) for regional coal. Given the uncertainty in the underlying model data, it is not clear if there are any significant differences between the corresponding European and Asian cases other than the LNG transport distance from the U.S. and the pipeline distance from Russia. Differences between the U.S LNG, regional LNG, and Russian natural gas options are also indeterminate on a 100-year GWP basis due to the underlying uncertainty in the modeling data, therefore no significant increase or decrease in net climate impact is anticipated from any of these scenarios. It is important to note that the European and Asian coal scenarios are identical because the same parameter ranges are used for both.
629 606 612
1,089
787 754 887
1,095
0
250
500
750
1,000
1,250
1,500
1,750
NG:
New
Orle
ans t
oRo
tter
dam
, Net
herla
nds
NG:
Ora
n, A
lger
ia to
Rott
erda
m, N
ethe
rland
s
NG:
Yam
al, R
ussia
toRo
tter
dam
, Net
herla
nds
Coal
: Eur
opea
n Re
gion
al
NG:
New
Orle
ans t
oRo
tter
dam
, Net
herla
nds
NG:
Ora
n, A
lger
ia to
Rott
erda
m, N
ethe
rland
s
NG:
Yam
al, R
ussia
toRo
tter
dam
, Net
herla
nds
Coal
: Eur
opea
n Re
gion
al
100-yr GWP 20-yr GWP
Gre
enho
use
Gas
Em
issi
ons
AR5
GW
P (k
g CO
₂e/M
Wh)
Natural Gas/Coal Extraction Natural Gas Processing Domestic Pipeline TransportLiquefaction Tanker/Rail Transport Tanker Berthing & DeberthingLNG Regasification Power Plant Operations Electricity T&D
9

Life Cycle GHG Perspective on Exporting LNG from the U.S.
Both figures show that the majority of GHG emissions come from combustion at the power plant; however, the contributions from the upstream acquisition of the two fuels are very different. For the natural gas scenarios, 31 to 37 percent of the life cycle emissions are from the natural gas supply chain, compared to 1.3 percent for coal on a 100-year basis. On a 20-year basis, the upstream share for the natural gas scenarios increases to 45 to 59 percent, compared to 1.4 percent for coal, due to high global warming potential associated with methane. The results show that the LNG and Russian natural gas cases produce essentially the same amount of GHG emissions on a 100-year basis. The emissions from the steps involved in LNG (liquefaction, tanker transport, and regasification) are approximately equal to the pipeline transport emissions for the Russian natural gas cases. However, when comparing the scenarios on a 20-year basis, the difference between the LNG and Russian natural gas cases is more significant. This is driven by the pipeline contribution to the Russian natural gas GHG results. The majority of pipeline emissions are methane, which has a much higher GWP on a 20-year basis. The natural gas power results are based on U.S natural gas production in 2010. The results do not include the anticipated 30 percent reduction in upstream life cycle greenhouse gas emissions for new marginal unconventional wells in compliance with EPA’s 2012 New Source Performance Standards (NSPS) for the oil and gas sector. On a complete life cycle basis through power production the net reduction would be approximately 3.4 percent for the U.S. LNG scenarios and 7.4 percent for the Russian natural gas scenarios. This is based on the assumption that the Russian natural gas industry would implement the same changes as prescribed for the U.S.
Figure 6-2: Life Cycle GHG Emissions for Natural Gas and Coal Power in Asia
Compared to domestically produced and combusted gas, there is a significant increase in the life cycle GHG emissions that are attributed to the LNG supply chain, specifically from liquefaction, tanker transport, and regasification processes. Figure 6-3 shows the speciated GHGs from the key
660 613 661
1,089
824 763
1,009 1,095
0
250
500
750
1,000
1,250
1,500
1,750
NG:
New
Orle
ans t
oSh
angh
ai, C
hina
NG:
Dar
win
, Aus
tral
ia to
Osa
ka, J
apan
NG:
Yam
al, R
ussia
toSh
angh
ai, C
hina
Coal
: Chi
nese
Reg
iona
l
NG:
New
Orle
ans t
oSh
angh
ai, C
hina
NG:
Dar
win
, Aus
tral
ia to
Osa
ka, J
apan
NG:
Yam
al, R
ussia
toSh
angh
ai, C
hina
Coal
: Chi
nese
Reg
iona
l
100-yr GWP 20-yr GWP
Gre
enho
use
Gas
Em
issi
ons
AR5
GW
P (k
g CO
₂e/M
Wh)
Natural Gas/Coal Extraction Natural Gas Processing Domestic Pipeline TransportLiquefaction Tanker/Rail Transport Tanker Berthing & DeberthingLNG Regasification Power Plant Operations Electricity T&D
10

Life Cycle GHG Perspective on Exporting LNG from the U.S.
processes in the natural gas power production life cycle for the U.S. LNG to Rotterdam scenario on a 100-yr GWP basis. The liquefaction, ocean transport, and regasification of natural gas are energy intensive activities with significant GHG emissions, accounting for 17.5 percent of the cradle-to-grave emissions in this scenario. For comparison, the natural gas extraction, processing, and transport activities in the exporting country (either U.S. or regional) account for 16.0 percent of the cradle-to-grave emissions. In this study, Marcellus Shale natural gas is used as an example, but the same patterns would be shown for other types of natural gas. As shown by Figure 6-3, methane emissions account for 13.8 percent of the total life cycle GHG emissions, while CO2 accounts for 85.5 percent. The total emissions from the plant stack account for 65.9 percent of the total life cycle GHG emissions.
For comparison, a speciated GHG drilldown is also shown for the Russian natural gas to Rotterdam scenario in Figure 6-4 on a 100-yr GWP basis. In that scenario, methane emissions account for 24.6 percent of the total life cycle GHG emissions, while CO2 accounts for 74.8 percent. In the Russian scenario, 67.7 percent of the total life cycle GHG emissions are direct emissions from the power plant stack. The increased percentage of methane emissions is the result of larger methane leakage due to the longer pipeline distance. As previously mentioned, the emissions from the steps involved in LNG (liquefaction, tanker transport, and regasification) are approximately equal to the pipeline transport emissions for the Russian natural gas cases.
Figure 6-5 shows a speciated GHG drilldown for the coal power production case on a 100-yr GWP basis. Methane emissions, primarily from releases during coal mining, account for 0.4 percent of the total life cycle GHG emissions, compared to 98.8 percent for CO2. The contribution of methane to the total life cycle GHG emissions for the coal scenario is significantly less than for the natural gas scenarios. For the coal power plant, 97.7 percent of the total GHG emissions come directly from power plant stack emissions. As shown by the figures, the upstream extraction, processing, and transport emissions are much more significant for the natural gas supply chain than for coal.
Figure 6-3: Speciated Life Cycle GHG Emissions of Natural Gas Power – U.S. LNG to Rotterdam Scenario
629
3
415
20
1
25
64
32
34
34
0 100 200 300 400 500 600 700 800
Total
Electricity T&D
Power Plant Operations
LNG Regasification
Tanker Berthing/Deberthing
Tanker Transport
Liquefaction
Domestic Pipeline Transport
Natural Gas Processing
Natural Gas Extraction
Greenhouse Gas Emissions AR5 100-yr GWP (kg CO₂e/MWh)
CO₂ CH₄ N₂O SF₆
11

Life Cycle GHG Perspective on Exporting LNG from the U.S.
Figure 6-4: Speciated Life Cycle GHG Emissions of Natural Gas Power – Russian NG to Rotterdam Scenario
Figure 6-5: Speciated Life Cycle GHG Emissions of Coal Power
Figure 6-6 and Figure 6-7 utilize the uncertainty bands shown in Figure 6-1 and Figure 6-2 to compare the range of LC GHG emissions for the gas and coal scenarios in Europe and Asia on 100 and 20-year bases. On a 100-year basis, natural gas power is 25 to 61 percent less than coal for Europe and 18 to 59 percent less than coal for Asia. The small difference in the ranges for Europe and Asia is driven by the longer transport distances for natural gas to Asia (both LNG from the U.S. and pipeline from Russia). On a 20-year basis, there is still potential for natural gas to have lower GHG emissions than coal (up to 57 percent less); however, the high end of the Russian gas results overlap with the low range of the coal results for both Europe and Asia and the high end of the U.S LNG results overlap with the coal results for Asia. As noted, the 20-year GWP emissions for the Russian natural gas scenarios are driven by the methane emissions from pipeline transport. The estimated pipeline distances for Russian natural gas transport are roughly four to eight times longer than for the LNG cases.
612
3
415
136
31
27
0 100 200 300 400 500 600 700 800
Total
Electricity T&D
Power Plant Operations
Domestic Pipeline Transport
Natural Gas Processing
Natural Gas Extraction
Greenhouse Gas Emissions AR5 100-yr GWP (kg CO₂e/MWh)
CO₂ CH₄ N₂O SF₆
1,089
3
1,063
14
8
0 250 500 750 1,000 1,250 1,500
Total
Electricity T&D
Power Plant Operations
Coal Transport
Coal Extraction
Greenhouse Gas Emissions AR5 100-yr GWP (kg CO₂e/MWh)
CO₂ CH₄ N₂O SF₆
12

Life Cycle GHG Perspective on Exporting LNG from the U.S.
Figure 6-6: 100-yr GWP comparison of Coal and NG Power in Europe and Asia
Figure 6-7: 20-yr GWP comparison of Coal and NG Power in Europe and Asia
0 400 800 1,200 1,600
Regional Coal
Russian NG (Yamal, RU to Shanghai, CN)
Regional LNG (Darwin, AU to Osaka, JP)
U.S. LNG (New Orleans, US to Shanghai, CN)
Regional Coal
Russian NG (Yamal, RU to Rotterdam, NL)
Regional LNG (Oran, DZ to Rotterdam, NL)
U.S. LNG (New Orleans, US to Rotterdam, NL)As
iaEu
rope
Greenhouse Gas Emissions AR5 100-yr GWP (kg CO₂e/MWh)
NG is 61% to 25% less than coal
NG is 59% to 18% less than coal
0 400 800 1,200 1,600
Regional Coal
Russian NG (Yamal, RU to Shanghai, CN)
Regional LNG (Darwin, AU to Osaka, JP)
U.S. LNG (New Orleans, US to Shanghai, CN)
Regional Coal
Russian NG (Yamal, RU to Rotterdam, NL)
Regional LNG (Oran, DZ to Rotterdam, NL)
U.S. LNG (New Orleans, US to Rotterdam, NL)
Asia
Euro
pe
Greenhouse Gas Emissions AR5 20-yr GWP (kg CO₂e/MWh)
NG is 57% less to 13% greater than coal
NG is 57% less to 27% greater than coal
13
Life Cycle GHG Perspective on Exporting LNG from the U.S.
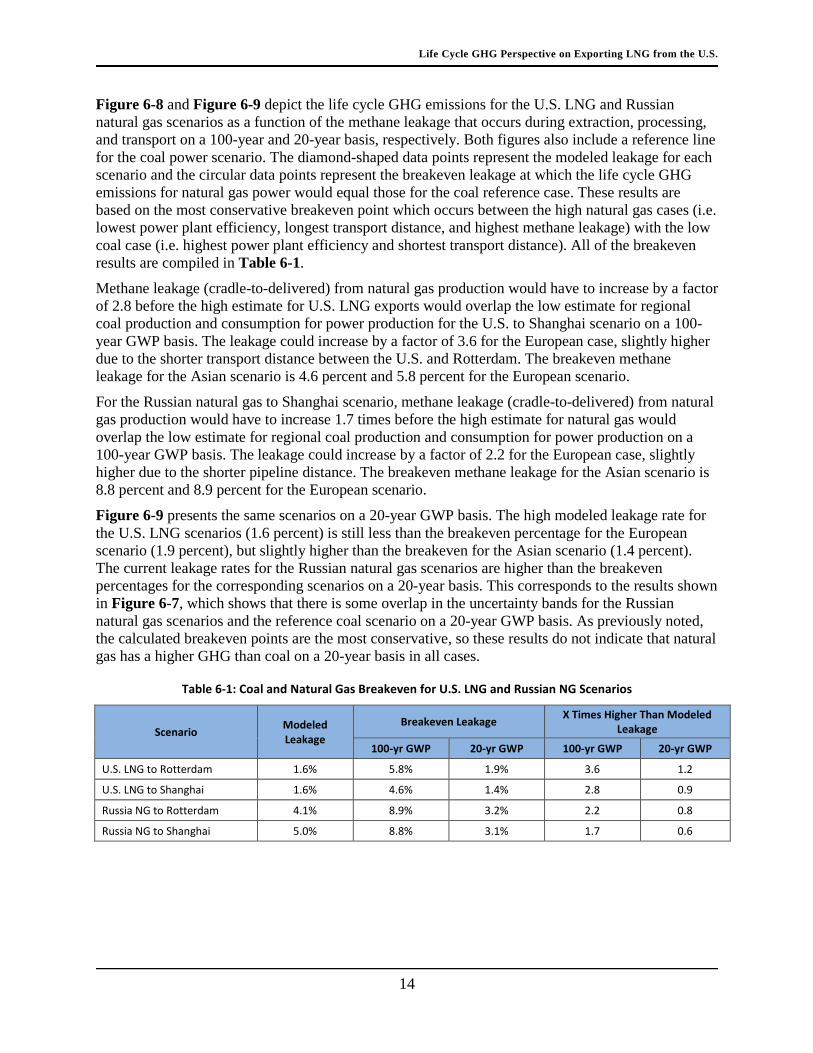
Figure 6-8 and Figure 6-9 depict the life cycle GHG emissions for the U.S. LNG and Russian natural gas scenarios as a function of the methane leakage that occurs during extraction, processing, and transport on a 100-year and 20-year basis, respectively. Both figures also include a reference line for the coal power scenario. The diamond-shaped data points represent the modeled leakage for each scenario and the circular data points represent the breakeven leakage at which the life cycle GHG emissions for natural gas power would equal those for the coal reference case. These results are based on the most conservative breakeven point which occurs between the high natural gas cases (i.e. lowest power plant efficiency, longest transport distance, and highest methane leakage) with the low coal case (i.e. highest power plant efficiency and shortest transport distance). All of the breakeven results are compiled in Table 6-1.
Methane leakage (cradle-to-delivered) from natural gas production would have to increase by a factor of 2.8 before the high estimate for U.S. LNG exports would overlap the low estimate for regional coal production and consumption for power production for the U.S. to Shanghai scenario on a 100-year GWP basis. The leakage could increase by a factor of 3.6 for the European case, slightly higher due to the shorter transport distance between the U.S. and Rotterdam. The breakeven methane leakage for the Asian scenario is 4.6 percent and 5.8 percent for the European scenario.
For the Russian natural gas to Shanghai scenario, methane leakage (cradle-to-delivered) from natural gas production would have to increase 1.7 times before the high estimate for natural gas would overlap the low estimate for regional coal production and consumption for power production on a 100-year GWP basis. The leakage could increase by a factor of 2.2 for the European case, slightly higher due to the shorter pipeline distance. The breakeven methane leakage for the Asian scenario is 8.8 percent and 8.9 percent for the European scenario.
Figure 6-9 presents the same scenarios on a 20-year GWP basis. The high modeled leakage rate for the U.S. LNG scenarios (1.6 percent) is still less than the breakeven percentage for the European scenario (1.9 percent), but slightly higher than the breakeven for the Asian scenario (1.4 percent). The current leakage rates for the Russian natural gas scenarios are higher than the breakeven percentages for the corresponding scenarios on a 20-year basis. This corresponds to the results shown in Figure 6-7, which shows that there is some overlap in the uncertainty bands for the Russian natural gas scenarios and the reference coal scenario on a 20-year GWP basis. As previously noted, the calculated breakeven points are the most conservative, so these results do not indicate that natural gas has a higher GHG than coal on a 20-year basis in all cases.
Table 6-1: Coal and Natural Gas Breakeven for U.S. LNG and Russian NG Scenarios
Scenario Modeled Leakage
Breakeven Leakage X Times Higher Than Modeled Leakage
100-yr GWP 20-yr GWP 100-yr GWP 20-yr GWP
U.S. LNG to Rotterdam 1.6% 5.8% 1.9% 3.6 1.2
U.S. LNG to Shanghai 1.6% 4.6% 1.4% 2.8 0.9
Russia NG to Rotterdam 4.1% 8.9% 3.2% 2.2 0.8
Russia NG to Shanghai 5.0% 8.8% 3.1% 1.7 0.6
14

Life Cycle GHG Perspective on Exporting LNG from the U.S.
Figure 6-8: Coal and Natural Gas Breakeven for U.S. LNG and Russian NG Scenarios (100-year GWP)
Figure 6-9: Coal and Natural Gas Breakeven for U.S. LNG and Russian NG Scenarios (20-year GWP)
1.6% 4.1%
1.6% 5.0%
5.8%
8.9%
4.6% 8.8%
400
600
800
1,000
1,200
1,400
1,600
0% 2% 4% 6% 8% 10% 12%
Gre
enho
use
Gas
e Em
issi
ons
AR5
100-
yr G
WP
(k
g CO
₂e/M
Wh)
Upstream Natural Gas Leakage Rate (CH₄ Leakage/NG Delivered)
U.S. LNG to Rotterdam Russian NG to Rotterdam U.S. LNG to Shanghai
Russian NG to Shanghai Coal
1.6%
4.1% 1.6%
5.0%
1.9%
3.2%
1.4% 3.1%
400
500
600
700
800
900
1,000
1,100
1,200
1,300
0% 1% 2% 3% 4% 5% 6%
Gre
enho
use
Gas
Em
issi
ons
AR5
20-y
r GW
P
(kg
CO₂e
/MW
h)
Upstream Natural Gas Leakage Rate (CH₄ Leakage/NG Delivered)
U.S. LNG to Rotterdam Russian NG to Rotterdam U.S. LNG to Shanghai
Russian NG to Shanghai Coal
15

Life Cycle GHG Perspective on Exporting LNG from the U.S.
Figure 6-10 through Figure 6-16 are uncertainty tornado diagrams for each of the 100-year GWP scenarios from Figure 6-1 and Figure 6-2. The parameter ranges for these figures are based on the values in Table 5-1, Table 5-2 and Table 5-3. These figures show the uncertainty in the total life cycle results based on changes to only a single parameter or variable.
As expected, the power plant efficiency contributes a significant fraction of the uncertainty for the natural gas and coal scenarios. These figures generally indicate that the transport of LNG contributes very little uncertainty to the overall result, except in the New Orleans to Shanghai LNG case. The base case assumption for that scenario is that the LNG tanker travels to Shanghai via the Panama Canal. In the event that this is not possible due to ship dimensions, the transport distance increases by approximately 50 percent. The emissions associated with the extraction and processing of natural gas do contribute considerably to the uncertainty of the overall emissions. For more details on the factors the drive the uncertainty of upstream natural gas extraction, refer to the NETL Life Cycle Analysis of Natural Gas Extraction and Power Generation (NETL, 2014). For the Russian natural gas cases shown in Figure 6-14 and Figure 6-15, uncertainty in the pipeline transport distance results is a large driver in the overall uncertainty of the life cycle result. As previously noted, the exact distance the natural gas travels from the extraction point in Yamal to the destination power plant is unknown, so a wide range spanning 2,000 km from low to high was used to represent all potential scenarios. It should be noted that the type of coal used at the power plant does account for some uncertainty in the model. The high case utilizes I-6 coal, which has higher acquisition emissions due to higher methane emissions at the coal mine.
Figure 6-10: Uncertainty Tornado LNG – New Orleans to Rotterdam, Netherlands
Figure 6-11: Uncertainty Tornado LNG – Oran, Algeria to Rotterdam, Netherlands
550 575 600 625 650 675 700 725 750
LNG Tanker Distance
Natural Gas Extraction and Processing
Power Plant Efficiency
Greenhouse Gas Emissions AR5 100-yr GWP (kg CO₂e/MWh)
550 575 600 625 650 675 700 725 750
LNG Tanker Distance
Natural Gas Extraction and Processing
Power Plant Efficiency
Greenhouse Gas Emissions AR5 100-yr GWP (kg CO₂e/MWh)
16

Life Cycle GHG Perspective on Exporting LNG from the U.S.
Figure 6-12: Uncertainty Tornado LNG – New Orleans to Shanghai, China
Figure 6-13: Uncertainty Tornado LNG – Darwin, Australia to Osaka, Japan
Figure 6-14: Uncertainty Tornado Russian NG – Yamal, Russia to Rotterdam, Netherlands
550 575 600 625 650 675 700 725 750
LNG Tanker Distance
Natural Gas Extraction and Processing
Power Plant Efficiency
Greenhouse Gas Emissions AR5 100-yr GWP (kg CO₂e/MWh)
550 575 600 625 650 675 700 725 750
LNG Tanker Distance
Natural Gas Extraction and Processing
Power Plant Efficiency
Greenhouse Gas Emissions AR5 100-yr GWP (kg CO₂e/MWh)
550 575 600 625 650 675 700 725 750
Pipeline Distance
Natural Gas Extraction and Processing
Power Plant Efficiency
Greenhouse Gas Emissions AR5 100-yr GWP (kg CO₂e/MWh)
17

Life Cycle GHG Perspective on Exporting LNG from the U.S.
Figure 6-15: Uncertainty Tornado Russian NG – Yamal, Russia to Shanghai, China
Figure 6-16: Uncertainty Tornado Coal – Europe and Asia Regional Production
7 Summary and Study Limitations This analysis has determined that the use of U.S. LNG exports for power production in European and Asian markets will not increase GHG emissions, on a life cycle perspective, when compared to regional coal extraction and consumption for power production. Given the uncertainty in the underlying model data, it is not clear if there are any significant differences between the corresponding European and Asian cases other than the LNG transport distance from the U.S. and the pipeline distance from Russia. Differences between the U.S LNG, regional LNG, and Russian natural gas options are also indeterminate due to the underlying uncertainty in the modeling data, therefore no significant increase or decrease in net climate impact is anticipated from any of these scenarios. It is important to note that the European and Asian coal scenarios are identical because the same parameter ranges are used for both.
A limitation of this study is that the NETL natural gas life cycle analysis model and NETL coal life cycle analysis model are U.S.-based models that were adapted for foreign natural gas and coal production as well as power generation. The specific LNG export/import locations used in this study were chosen to represent an estimate for a region (e.g. New Orleans as U.S. Gulf Coast). Specific locations were required to allow for the estimation of LNG transport distances and do not imply the likelihood that LNG export or import will occur from that exact location. The same assumptions hold true for the Russian natural gas cases. Another limitation is that the efficiencies and other end uses for regional fuel alternatives are not considered.
550 575 600 625 650 675 700 725 750
Pipeline Distance
Natural Gas Extraction and Processing
Power Plant Efficiency
Greenhouse Gas Emissions AR5 100-yr GWP (kg CO₂e/MWh)
900 950 1,000 1,050 1,100 1,150 1,200
Rail Distance
Coal Type
Power Plant Efficiency Efficiency
Greenhouse Gas Emissions AR5 100-yr GWP (kg CO₂e/MWh)
18

Life Cycle GHG Perspective on Exporting LNG from the U.S.
8 References EIA. (2013). Russia Analysis Brief Retrieved December 16, 2013, 2013, from
http://www.eia.gov/countries/cab.cfm?fips=RS
Forster, P., Ramaswamy, V., Artaxo, P., Berntsen, T., Betts, R., Fahey, D. W., Dorland, R. V. (2007). Changes in Atmospheric Constituents and in Radiative Forcing. In S. Solomon, D. Qin, M. Manning, Z. Chen, M. Marquis, K. B. Averyt, M.Tignor & H. L. Miller (Eds.), Climate Change 2007: The Physical Science Basis. Contribution of Working Group I to the Fourth Assessment Report of the Intergovernmental Panel on Climate Change (pp. 212-213). Cambridge, United Kingdom and New York, NY, USA: Intergovernmental Panel on Climate Change.
IPCC. (2013). Climate Change 2013 The Physical Science Basis. New York: Cambridge University Press: Intergovernmental Panel on Climate Change Retrieved December 12, 2013, from https://www.ipcc.ch/report/ar5/wg1/
National Mining Association. (2009). 2008 Coal Producer Survey. Washington, DC: Retrieved August 23, 2011, from http://www.nma.org/pdf/members/coal_producer_survey2008.pdf
NETL. (2010a). Quality Guidelines for Energy System Studies: Methane Emissions from Mining Powder River Basin Coals. DOE/NETL-2010/1446. Pittsburgh, PA: National Energy Technology Laboratory. Retrieved December 12, 2013 from http://www.netl.doe.gov/File%20Library/Research/Energy%20Analysis/Publications/DOE-NETL-2010-1446-QGESSMethaneEmissionsPRB.pdf
NETL. (2010b). Quality Guidelines for Energy System Studies: Methane Emissions from Mining Illinois Basin Coals. DOE/NETL-400/2010/1445. Pittsburgh, PA: National Energy Technology Laboratory. Retrieved December 12, 2013 from http://www.netl.doe.gov/File%20Library/Research/Energy%20Analysis/Publications/DOE-NETL-2010-1445-QGESSMethaneEmissionsIllns.pdf
NETL. (2012). Quality Guidelines for Energy System Studies: Detailed Coal Specifications. DOE/NETL-401/012111. Pittsburgh, PA: National Energy Technology Laboratory. Retrieved December 12, 2013 from http://www.netl.doe.gov/File%20Library/research/energy%20analysis/publications/QGESS_DetailCoalSpecs_Rev4_20130510.pdf
NETL. (2014). Life Cycle Analysis of Natural Gas Extraction and Power Generation. (DOE/NETL-2014/1646). Pittsburgh, PA: National Energy Technology Laboratory.
Portworld. (2013). PortWorld Distance – Ship Voyage Distance Calculator. 2013 Petromedia Ltd. Retrieved December 9, 2013 from http://www.portworld.com/map/
19

This page intentionally left blank.

Life Cycle GHG Perspective on Exporting LNG from the U.S.
Appendix A – Life Cycle Results in IPCC AR4 and AR5 GWPs
Table A-1: Life Cycle GHG Emissions for Natural Gas and Coal Power in Europe IPCC AR-4
GWP ........................................................................................................................ A-2 Table A-2: Life Cycle GHG Emissions for Natural Gas and Coal Power in Asia IPCC AR-4
GWP ........................................................................................................................ A-3 Table A-3: Life Cycle GHG Emissions for Natural Gas and Coal Power in Europe IPCC AR-5
GWP ........................................................................................................................ A-4 Table A-4: Life Cycle GHG Emissions for Natural Gas and Coal Power in Asia IPCC AR-5
GWP ........................................................................................................................ A-5
A-1

Life Cycle GHG Perspective on Exporting LNG from the U.S.
Table A-1: Life Cycle GHG Emissions for Natural Gas and Coal Power in Europe IPCC AR-4 GWP (kg CO2e/MWh)
Life Cycle Process
100-yr GWP 20-yr GWP
New Orleans to
Rotterdam, Netherlands
Oran, Algeria to
Rotterdam, Netherlands
Yamal, Russia to
Rotterdam, Netherlands
European Regional
Coal
New Orleans to
Rotterdam, Netherlands
Oran, Algeria to
Rotterdam, Netherlands
Yamal, Russia to
Rotterdam, Netherlands
European Regional
Coal
Natural Gas/Coal Extraction 29.0 24.9 22.8 7.8 75.8 65.8 60.3 13.6
Natural Gas Processing 32.1 31.8 29.1 N/A 54.3 53.7 49.2 N/A
Domestic Pipeline Transport 27.8 27.5 117.5 N/A 69.8 69.1 295.1 N/A
Liquefaction 63.6 62.9 N/A N/A 63.6 62.9 N/A N/A
Tanker/Rail Transport 24.7 8.0 N/A 14.4 27.6 9.0 N/A 15.3
Tanker Berthing & Deberthing 1.5 1.5 N/A N/A 1.6 1.6 N/A N/A
LNG Regasification 17.7 17.7 N/A N/A 39.3 39.3 N/A N/A
Power Plant Operations 414.7 414.7 414.7 1,063.0 415.2 415.2 415.2 1,063.7
Electricity T&D 3.3 3.3 3.3 3.4 2.3 2.3 2.3 2.5
Total 614.3 592.3 587.4 1,088.6 749.4 719.0 822.1 1,095.1
Low 567.5 547.6 527.4 969.4 679.2 652.9 707.9 974.6
High 708.0 683.6 696.4 1,391.4 883.0 849.2 1,015.0 1,604.2
A-2

Life Cycle GHG Perspective on Exporting LNG from the U.S.
Table A-2: Life Cycle GHG Emissions for Natural Gas and Coal Power in Asia IPCC AR-4 GWP (kg CO2e/MWh)
Life Cycle Process
100-yr GWP 20-yr GWP
New Orleans to
Shanghai, China
Darwin, Australia to
Osaka, Japan
Yamal, Russia to
Shanghai, China
Chinese Regional
Coal
New Orleans to
Shanghai, China
Darwin, Australia to
Osaka, Japan
Yamal, Russia to
Shanghai, China
Chinese Regional
Coal
Natural Gas/Coal Extraction 29.5 25.0 23.3 7.8 77.1 66.1 61.7 13.6
Natural Gas Processing 32.7 31.9 29.8 N/A 55.2 53.9 50.3 N/A
Domestic Pipeline Transport 28.3 27.7 158.1 N/A 71.0 69.4 396.9 N/A
Liquefaction 64.7 63.2 N/A N/A 64.7 63.2 N/A N/A
Tanker/Rail Transport 52.3 14.7 N/A 14.4 58.4 16.5 N/A 15.3
Tanker Berthing & Deberthing 1.5 1.5 N/A N/A 1.6 1.6 N/A N/A
LNG Regasification 17.7 17.7 N/A N/A 39.3 39.3 N/A N/A
Power Plant Operations 414.7 414.7 414.7 1,063.0 415.2 415.2 415.2 1,063.7
Electricity T&D 3.3 3.3 3.3 3.4 2.3 2.3 2.3 2.5
Total 644.6 599.6 629.1 1,088.6 784.8 727.5 926.5 1,095.1
Low 595.8 554.5 566.8 969.4 712.1 660.8 806.2 974.6
High 772.2 691.9 743.5 1,391.4 958.7 858.9 1,133.0 1,604.2
A-3

Life Cycle GHG Perspective on Exporting LNG from the U.S.
Table A-3: Life Cycle GHG Emissions for Natural Gas and Coal Power in Europe IPCC AR-5 GWP (kg CO2e/MWh)
Life Cycle Process
100-yr GWP 20-yr GWP
New Orleans to Rotterdam, Netherlands
Oran, Algeria to
Rotterdam, Netherlands
Yamal, Russia to
Rotterdam, Netherlands
European Regional
Coal
New Orleans to Rotterdam, Netherlands
Oran, Algeria to
Rotterdam, Netherlands
Yamal, Russia to
Rotterdam, Netherlands
European Regional
Coal
Natural Gas/Coal Extraction 33.9 29.3 26.8 7.8 88.7 77.2 70.6 13.6
Natural Gas Processing 34.5 34.1 31.2 N/A 60.4 59.7 54.7 N/A
Domestic Pipeline Transport 32.3 32.0 136.4 N/A 81.4 80.6 344.2 N/A
Liquefaction 63.6 62.9 N/A N/A 63.6 62.9 N/A N/A
Tanker/Rail Transport 25.0 8.1 N/A 14.4 28.4 9.2 N/A 15.3
Tanker Berthing & Deberthing 1.5 1.5 N/A N/A 1.6 1.6 N/A N/A
LNG Regasification 20.0 20.0 N/A N/A 45.3 45.3 N/A N/A
Power Plant Operations 414.7 414.7 414.7 1,063.0 415.3 415.3 415.3 1,063.7
Electricity T&D 3.4 3.4 3.4 3.4 2.5 2.5 2.5 2.5
Total 628.8 605.9 612.5 1,088.6 787.2 754.4 887.4 1,095.1
Low 579.5 559.0 546.8 969.4 710.5 682.4 758.2 974.6
High 726.7 701.4 730.4 1,391.4 931.8 895.3 1,103.5 1,604.2
A-4

Life Cycle GHG Perspective on Exporting LNG from the U.S.
Table A-4: Life Cycle GHG Emissions for Natural Gas and Coal Power in Asia IPCC AR-5 GWP (kg CO2e/MWh)
Life Cycle Process
100-yr GWP 20-yr GWP
New Orleans to Shanghai,
China
Darwin, Australia to
Osaka, Japan
Yamal, Russia to
Shanghai, China
Chinese Regional
Coal
New Orleans to Shanghai,
China
Darwin, Australia to
Osaka, Japan
Yamal, Russia to
Shanghai, China
Chinese Regional
Coal
Natural Gas/Coal Extraction 34.5 29.4 27.4 7.8 90.2 77.5 72.3 13.6
Natural Gas Processing 35.1 34.3 32.0 N/A 61.4 60.0 56.0 N/A
Domestic Pipeline Transport 32.9 32.1 183.5 N/A 82.9 80.9 463.0 N/A
Liquefaction 64.7 63.2 N/A N/A 64.7 63.2 N/A N/A
Tanker/Rail Transport 52.9 14.9 N/A 14.4 60.1 16.9 N/A 15.3
Tanker Berthing & Deberthing 1.5 1.5 N/A N/A 1.6 1.6 N/A N/A
LNG Regasification 20.0 20.0 N/A N/A 45.3 45.3 N/A N/A
Power Plant Operations 414.7 414.7 414.7 1,063.0 415.3 415.3 415.3 1,063.7
Electricity T&D 3.4 3.4 3.4 3.4 2.5 2.5 2.5 2.5
Total 659.6 613.4 660.9 1,088.6 824.0 763.2 1,009.1 1,095.1
Low 608.3 565.9 592.4 969.4 744.6 690.6 872.8 974.6
High 792.1 709.8 785.1 1,391.4 1,010.7 905.5 1,241.1 1,604.2
A-5
www.netl.doe.gov Pittsburgh, PA • Morgantown, WV • Albany, OR • Sugar Land, TX • Anchorage, AK
(800) 553-7681
Timothy J. Skone, P.E. [email protected]
Joe Marriott, Ph.D. [email protected]