office of evidence based practice specific care question ......sugars as a strategy to “rethink...
TRANSCRIPT
Office of Evidence Based Practice – Specific Care Question: Artificial Sweeteners
If you have questions regarding this Specific Care Question – please contact [email protected] or [email protected] 1
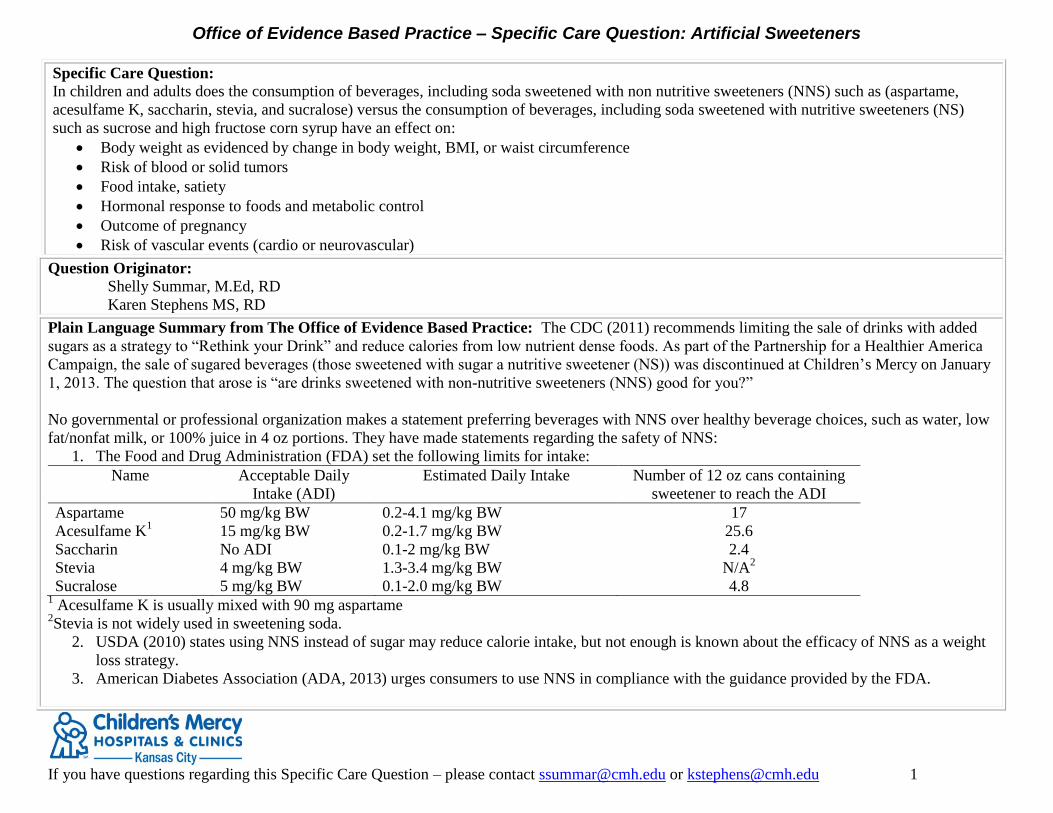
Specific Care Question:
In children and adults does the consumption of beverages, including soda sweetened with non nutritive sweeteners (NNS) such as (aspartame,
acesulfame K, saccharin, stevia, and sucralose) versus the consumption of beverages, including soda sweetened with nutritive sweeteners (NS)
such as sucrose and high fructose corn syrup have an effect on:
Body weight as evidenced by change in body weight, BMI, or waist circumference
Risk of blood or solid tumors
Food intake, satiety
Hormonal response to foods and metabolic control
Outcome of pregnancy
Risk of vascular events (cardio or neurovascular)
Question Originator:
Shelly Summar, M.Ed, RD
Karen Stephens MS, RD
Plain Language Summary from The Office of Evidence Based Practice: The CDC (2011) recommends limiting the sale of drinks with added
sugars as a strategy to “Rethink your Drink” and reduce calories from low nutrient dense foods. As part of the Partnership for a Healthier America
Campaign, the sale of sugared beverages (those sweetened with sugar a nutritive sweetener (NS)) was discontinued at Children’s Mercy on January
1, 2013. The question that arose is “are drinks sweetened with non-nutritive sweeteners (NNS) good for you?”
No governmental or professional organization makes a statement preferring beverages with NNS over healthy beverage choices, such as water, low
fat/nonfat milk, or 100% juice in 4 oz portions. They have made statements regarding the safety of NNS:
1. The Food and Drug Administration (FDA) set the following limits for intake:
Name Acceptable Daily
Intake (ADI)
Estimated Daily Intake Number of 12 oz cans containing
sweetener to reach the ADI
Aspartame 50 mg/kg BW 0.2-4.1 mg/kg BW 17
Acesulfame K1 15 mg/kg BW 0.2-1.7 mg/kg BW 25.6
Saccharin No ADI 0.1-2 mg/kg BW 2.4
Stevia 4 mg/kg BW 1.3-3.4 mg/kg BW N/A2
Sucralose 5 mg/kg BW 0.1-2.0 mg/kg BW 4.8 1 Acesulfame K is usually mixed with 90 mg aspartame
2Stevia is not widely used in sweetening soda.
2. USDA (2010) states using NNS instead of sugar may reduce calorie intake, but not enough is known about the efficacy of NNS as a weight
loss strategy.
3. American Diabetes Association (ADA, 2013) urges consumers to use NNS in compliance with the guidance provided by the FDA.

Office of Evidence Based Practice – Specific Care Question: Artificial Sweeteners
If you have questions regarding this Specific Care Question – please contact [email protected] or [email protected] 2
4. The Academy of Nutrition and Dietetics (AND, 2012) recommends consumers use NNS within the ADI to sweeten foods without adding
unnecessary carbohydrates.
5. The National Cancer Institute (National Cancer Institute, 2009) states in the U.S. as of 2009 there is no clear evidence of NNS being
associated with cancer risk.
The literature on this topic is divergent. Randomized control trials are difficult to conduct since the outcomes of interest can take years to develop.
Large cohort studies that have addressed these questions can only produce associations. It is known that NS play a role in excess daily calorie
intake, and are linked to obesity, but the role of NNS and weight maintenance or loss is not clear (AND, 2012, ADA, 2013, USDA, 2010).
Harm related to the use of NNS is also unclear. Shiffman (2012) comments there are significant gaps in what is known about NNS including the
pharmacokinetics, “sweetener-drug” interactions, and the role NNS play in body weight regulation.
Based on the evidence included in this review and the recommendations made by the FDA, USDA, ADA, AND, and the NCI restricting the sale of
beverages sweetened with NNS is not warranted at this time. Further research may influence our confidence in the estimate of effect and may
change the outcome of this review.
The section below labeled Thumbnails has been added to help the reader; Control/Click on the first author’s name of each article will link to the
further figures and details pertaining to that study.
Thumbnails BMI Weight Change
(de Ruyter,
Olthof,
Kuijper, &
Katan, 2012)
USA
Risk of bias was low although subjects were
able to tell they were
assigned to the NNS
group.
Those randomized to the NNS group had significantly greater weight loss than those in the NS beverage
group.
(Duffey,
Steffen, Van
Horn,
Jacobs, &
Popkin,
2012) USA
Risk of bias is moderate.
Large adult cohort study,
the CARDIA Study.
Those who did not drink NNS beverages did not have higher risk of elevated fasting blood glucose or
blood lipid levels over twenty years.

Office of Evidence Based Practice – Specific Care Question: Artificial Sweeteners
If you have questions regarding this Specific Care Question – please contact [email protected] or [email protected] 3
(Ebbeling et
al., 2012)
USA
Risk of bias is low.
Adolescents.
There was a significant difference in BMI change in all subjects at 2 years. For those in the NNS
beverage group, weight loss was significantly greater. There was a difference between ethnicities. Non
Hispanics had higher BMIs at two years, whereas Hispanic subjects who drank NNS beverages had
significantly lower BMI at 2 years.
(Tate et al.,
2012) USA Risk of bias is low. There was no difference between those who drank water and those who drank NNS beverages, outcome
weight loss.
(Vanselow et
al
2009 USA,
Pereira,
Neumark-
Sztainer, &
Raatz, 2009)
USA
Risk of bias is high. It is
a prospective cohort
study of adolescents;
follow-up of subjects
does not reach 80%.
Low calorie beverage intake was significantly related to weight gain. Intake of sports drinks or soy milk
was not evaluated.
BMI was calculated on self report, not measured values.
Overall, the strength of the evidence is low. Most evidence comes from cohort studies that produce associations, not cause and effect. Although the
risk of bias in these cohort studies is low, by design, the strength of the evidence is low. Furthermore, the results cannot be grouped due to the
heterogeneity of treatments, length of treatment and outcomes followed. No recommendation regarding the consumption of NNS beverages and BMI
or weight change can be made at this time.
Cancers
(Schernhammer
et al., 2012)
USA
Risk of bias is moderate.
Adults, the Nurses’
Health Study and the
Health Professionals
Follow-up Study.
Consumption of NNS beverage was not associated with the risk of multiple myeloma or non-
Hodgkin’s lymphoma (NHL) in women.
Consumption of NNS beverage was associated with the risk of multiple myeloma and NHL in men
Consumption of NNS beverage was associated with the risk of leukemia in both men and women.
Although this is a large cohort study that was well managed, the results are still associative, not causative. Risk for multiple myeloma, NHL and
leukemia vary on amount of NNS beverage consumed. It appears the risk for men is greater than the risk for women. Time to incident diagnosis was
not assessed in the study.

Office of Evidence Based Practice – Specific Care Question: Artificial Sweeteners
If you have questions regarding this Specific Care Question – please contact [email protected] or [email protected] 4
Food intake/ Satiety
(Anton et al.,
2010) USA
Risk of bias is high
Although it is an RCT,
the confidence intervals
are wide, and the
findings are not precise.
After a preload of NS beverage or NNS beverage, calorie intake at the next two meals (lunch and
dinner) was not significantly different.
(Appleton
& Blundell,
2007) UK
Risk of bias is
moderate. Allocation
concealment and
blinding are not
described.
Habitual high consumers vs. habitual low consumers of NNS beverages did not show difference in
energy intake over the rest of one day. There was a difference between the two types of consumers that
was independent of pre-load.
(Garnier-
Sange,
Lebalnc, &
Verger, 2001)
France
Risk of bias is high. It is
a self reported survey.
Children with Type 1 diabetes mellitus were surveyed for 5 day food diaries. Food intake was assessed
for amount of 5 different NNS and the Theoretical Maximum Daily Intake (TMDI) was calculated and
compared to the Acceptable Daily Intake (ADI).In no instance was the amount consumed by this group,
who is likely to consume NNS, near the ADI.
(Tate, et al.,
2012) USA
The risk of bias is low. Consumption of NNS beverage versus water, the sum of calories from all beverage sources over 6
months was not different between groups.
Consumption of NNS beverages versus water, the average daily caloric intake was different between
groups.
The strength of evidence from the included studies is low. Tate et al (2012) is the stronger of the included studies, but small sample sizes make
conclusions difficult to confirm. The data presented by Garnier-Sange et al. (2001) are reassuring that in a likely group of consumers of NNS, the
ADI was not reached. Hormone response/Metabolic Control
(Borstov et
al., 2011)
USA
Risk of bias is high.
Cross-sectional survey
Children with Type 1
DM (≥ 10 years)
As NNS beverage intake increase, HbgA1c values were higher.
As NNS beverage intake increase, serum LDL levels increased.
As NNS beverage intake increased, diastolic blood pressure was the same.
(
Brown
Walter, &
Rother,
2009), USA
The risk of bias is low. Crossover design. Oral
glucose tolerance test
after NNS beverage or
NS beverage.
Neither Glucose (AUC), nor Insulin (AUC) were significantly different at 180 minutes between
interventions.
GLP-1 was significantly higher in the NSS group at 180 minutes. The clinical significance of this
finding is unknown.

Office of Evidence Based Practice – Specific Care Question: Artificial Sweeteners
If you have questions regarding this Specific Care Question – please contact [email protected] or [email protected] 5
(Brown, de
Banate, &
Rother, 2010)
USA
Risk of bias in the
included studies is high.
Great heterogeneity
among the included
studies. Systematic
review of pediatric
cohort studies.
16 studies were included. Nine showed a positive correlation between NNS beverage intake and body
weight/BMI. The three interventional studies show no effect of the consumption of NNS beverage on
weight loss or BMI. Two of the included studies assess the relationship between NNS beverage on
metabolic syndrome and found no causative or associative effects.
(Fgherazzi et
al, 2013)
France
Risk bias is moderate. It
is a well done, large
cohort study.
Both the consumption of NS (>11 oz/ week) and NNS (>20/wk) beverages were associated with Type 2
diabetes. Consumption of 100% fruit juice was not. Sensitivity analysis was done and BMI partly
mediated the effect. The study included women only.
(De Koning,
Malik, Rimm,
Willett, & Hu,
2011) USA
Risk of bias is
moderate. Large adult
cohort study the Health
Professionals Follow-up
Study.
Consumption of NNS beverages was associated with overall higher diet quality.
Intake of NNS was not associated with Type 2 diabetes.
(Lin &
Curhan, 2011) Risk of bias is
moderate. It is a well
done large cohort study
Two servings or more than 2 servings per day of NNS soda were associated with faster kidney function
decline. No association between lower levels of NNS soda intake was associated with decline. No
significant associations with MA or eGFR decline were noted for any of the NS soda categories.
(Nettleton et
al., 2009)
USA
Risk of bias is low
Adults
The risk of metabolic syndrome is 36% greater in those who drank ≥ 1 serving of NNS soda per day.
However, adjusting for adiposity made the results non significant.
If subjects who were positive for any indicator of metabolic syndrome at baseline were excluded, the
hazard ratio of subsequently acquiring metabolic syndrome was non-significant.
(Wiebe et al.,
2011) Canada
This is a meta analysis
of 53 adult RCTs. The
risk of bias in the
included studies is high.
The number of subjects
in each study is small
and 13/53 studies
followed subjects for >
1 week.
Those who drank NNS beverages had greater weight loss. Energy intake over one day was not
statistically different between those who drank NS beverages and those who drank NNS beverages, but
may have been clinically significant. The consumption of NNS beverages had no effect on HbgA1c or
blood lipid levels.
Although this is a meta-analysis the included studies are of very low to low quality. The major finding
is that adequately powered randomized controlled trials are needed to provide answers.
The studies included in this outcome have high heterogeneity. As such, it is difficult to pool results to strengthen estimates of effect.

Office of Evidence Based Practice – Specific Care Question: Artificial Sweeteners
If you have questions regarding this Specific Care Question – please contact [email protected] or [email protected] 6
Pregnancy
(Englund-
Ogge et al.,
2012)
Norway
The risk of bias is low.
Data is from a large
cohort study of women
of childbearing age, the
Norwegian Mother and
Child Cohort Study
(1999-2008)
Statistically significant associations were found between the intake of > 1 serving per day NNS
beverage (OR 1.11 95% CI [100, 1.24]) and NS beverage (OR 1.25 95% CI [1.08, 1.45]) intake and
preterm birth. A dose response effect was found. Both NNS and NS increased the risk of preterm
delivery.
Both NNS and NS beverage intake increased with increasing BMI.
(Halldorsson,
Strom,
Petersen, &
Olsen, 2010),
Denmark
The risk of bias is low.
Data is from a large
cohort study of women
of childbearing age, the
Danish National Birth
Cohort (1996-2002)
No association was seen between NS beverage consumption and preterm delivery.
Intake of NNS beverage and preterm birth was strongly associated.
Odds ratios increased as number of servings (250ml/serving) increased from < 1 per week to ≥ 4 per
day. Women who consumed NNS soft drinks ≥ 1 per day had an adjusted OR of 1.38 95% CI {1.15,
1.65]
Preterm delivery was driven by medically induced delivery rather than by spontaneous delivery in this
cohort.
The included studies are two well-managed cohort studies. Other factors besides beverage intake are related to preterm birth.
Vascular Disease and Stroke
(Bernstein, de
Koning, Flint,
Rexrode, &
Willett, 2012)
USA
The risk of bias is low. Data is from the Nurses’
Health Study and the
Health Professionals
Follow-up Study
(Adults)
Increased consumption of NNS AND NS beverages was associated with higher risk of stroke in
women.
(Gardener et
al., 2012)
USA
The risk of bias is low. Data is from a large,
adult cohort study, the
Northern Manhattan
Study
Daily NNS soda consumption was associated with 43% increase risk of vascular events.
Those who drank 1 NSS/month to 6/week did not have significantly increased risk.
The included studies show an association between NNS beverage consumption and risk of vascular disease and stroke. Both studies address the
concern of reverse causality. Those with increased BMI choose NNS beverages and have increased risk for vascular disease/events independent of
beverage choice.

Office of Evidence Based Practice – Specific Care Question: Artificial Sweeteners
If you have questions regarding this Specific Care Question – please contact [email protected] or [email protected] 7
EBP Scholar’s responsible for analyzing the literature:
Jarrod Dusin, MS, RD, LD
Andrea Melanson, OTD, OTR/L,
Jamie Menown, RN, CPN
Ashley Havlena, RN, BSN
Kerri Kuntz, BSN, RNC-OB, C-EFM
Julia Leamon, MSN, RN, CPN
Marilyn Maddox, RN-BC, MSN, CCRN
Joyce McCollum, RN, CNOR
Lindsey Thompson, MS, RD, LD
Teresa Tobin, MSOD, RRT
Trisha Williams, RN, BSN, CPN
EBP team member responsible for reviewing, synthesizing, and developing this literature: Nancy H Allen, MS, MLS, RD,LD, CNSC
Medical Librarian: Keri Swaggart, MLIS, AHIP
Editor: Kristin Knight, RD
Search Strategy and Results:
The search of the medical literature was completed on Nov. 14, 2012. 86 citations were returned to the team leaders for them to review and select
articles. From this list 36 articles were selected by the team leaders. After close reading of the selected articles by the EBP Scholars, 22 articles are
included in this synopsis. (See the Reference list and the Table of Excluded Studies)
Method Used for Appraisal and Synthesis:
The Cochrane Collaborative computer program, Review Manager (RevMan 5.1.7) was used to synthesize 4 of the included studies. The remainder
of the studies were analyzed using the Critical Appraisal Skills Programme (CASP) synthesis tools.
Updated February 8 2013 April 4, 2013, April 19 2013, August 5, 2013 August 29, 2013, September 11, 2013
Study Details Characteristics of included studies- RCTs: Tables:

Office of Evidence Based Practice – Specific Care Question: Artificial Sweeteners
If you have questions regarding this Specific Care Question – please contact [email protected] or [email protected] 8
Brown 2009
Methods Two 75-g oral glucose tolerance tests (OGTTs) on separate days after a 10-h fast. Cross over design
Participants 22 healthy subjects 12–25 years of age; 45% male, 41% Caucasian
Interventions Intervention: 240 ml of caffeine-free NNS soda (Diet Rite cola) sweetened with sucralose and acesulfame- K 10
min prior to the glucose load.
Control: 240 ml unflavored carbonated water, 10 min prior to the glucose load.
Outcomes Serum glucose
Serum insulin
Serum GLP-1
Notes Significance was only found for GLP-1; area under the curve at 180 minutes. The GLP-1 peak was significantly
higher with NNS soda versus carbonated water (P= 0.003). Timing of the peak was not changed.
Risk of bias table
Bias Scholars'
Judgment Support for Judgment
Random sequence generation (selection
bias)
Low risk States carbonated water or NNS soda were given in randomized order, but does not state
how randomized.
Allocation concealment (selection bias) Unclear risk Does not state who knew which beverage was being served.
Blinding of participants and personnel
(performance bias)
Unclear risk Subjects would be able to tell if they were drinking the NS drink or not.
Blinding of outcome assessment (detection
bias)
Low risk Does not state if lab personnel who drew the lab knew if the subject consumed the
intervention or control drink.
Incomplete outcome data (attrition bias) Low risk All completed the study, all results are reported.
Selective reporting (reporting bias) Low risk Not identified.
Other bias Unclear risk
de Ruyter 2012
Methods Double-blind Randomized Controlled Trial
Participants Children - 4 years 10 months to 11 years 11 months of age at eight elementary schools near Amsterdam.
NNS group N=319. NS group N=322
Data was collected for 20 months: Nov 14 2009 to July 22 2011

Office of Evidence Based Practice – Specific Care Question: Artificial Sweeteners
If you have questions regarding this Specific Care Question – please contact [email protected] or [email protected] 9
Inclusion criteria:
- Healthy school going boys and girls.
- Children who already habitually consume 250 mL per day or more of NS drinks.
Exclusion criteria:
- Using medication or under medical treatment for obesity.
- Any acute or chronic disease such as diabetes, growth disorders, Celiac disease, or serious gastroenterology (for
example inflammatory bowel disease).
- Medical history or surgical events known to interfere with the study.
- Participation in another intervention trial up to 3 months before and during the study if the intervention interferes
with the current study.
- Physical disabilities that hamper the measurements.
- Intention to change location of residence and primary school during the study period.
Interventions NNS group- 1 can per day of a non-caloric, NNS, noncarbonated beverage.
NS group- a sugar-containing noncarbonated beverage was distributed to each child.
Outcomes Primary outcome: BMI z score for age and sex.
Secondary outcomes waist to height ratio, sum of 4 skin fold measures, fat mass by electrical impedance.
Notes Intent to treat analysis was preformed.
21% of NNS participants were able to correctly identify they were drinking NNS beverage while only 3% correctly
identified their beverage in the NS group.
A total of 26% of the participants stopped consuming the beverages.
Risk of bias table
Bias Scholars’
Judgment Support for Judgment
Random sequence generation (selection
bias)
Low risk The study used computer generated randomization.
Allocation concealment (selection bias) Low risk The study used computer generated randomization.
Blinding of participants and personnel
(performance bias)
Unclear risk 21% of the NNS participants were able to correctly identify they were drinking NNS
beverage while only 3% correctly identified their beverage in the NS group.
Blinding of outcome assessment (detection
bias)
Low risk Blinding of outcome assessment ensured.
Incomplete outcome data (attrition bias) Low risk No missing outcome data.

Office of Evidence Based Practice – Specific Care Question: Artificial Sweeteners
If you have questions regarding this Specific Care Question – please contact [email protected] or [email protected] 10
Selective reporting (reporting bias) Low risk The study protocol is available and all of the study's pre-specified outcomes that are of
interest in the review have been reported.
Other bias Unclear risk
Ebbeling 2012
Methods Randomized control trial
Participants N: 224; 124 boys and 100 girls; adolescents.
Inclusion criteria: consume ≥ 12oz serving per day of NS beverage or 100% fruit juice.
Subjects were in 9th or 10th grade.
BMI above the 85% for sex and age.
Interventions Experimental:
1-year home delivery of non-caloric beverages every 2 weeks.
Monthly motivation phone calls with parents lasting 30 minutes per call.
3 check-in visits with subjects lasting 20 minutes per visit.
Written intervention with instruction to drink the beverages which were mailed to participants.
Gift cards were mailed to participants in control group at 4 and 8 months as a retention strategy.
Control: $50.00 supermarket gift cards
Outcomes Primary outcome: BMI at 2 years
Notes Performed sub-analysis based on ethnic group
Risk of bias table
Bias Scholars'
Judgment Support for Judgment
Random sequence generation (selection
bias)
Low risk Computer generated stratified random sequence of assignment that created sequences in
permuted in blocks of 2 and 4. Separate sequences were generated for each stratum as
defined by a combination of recruitment site, sex, and obesity status and stored in the
data-management system.
Allocation concealment (selection bias) Low risk All personnel are masked to group assignment.
Blinding of participants and personnel
(performance bias)
Low risk Single blinded: subjects know which group they are in by the delivery of the beverages
to their homes every 2 weeks.

Office of Evidence Based Practice – Specific Care Question: Artificial Sweeteners
If you have questions regarding this Specific Care Question – please contact [email protected] or [email protected] 11
Blinding of outcome assessment (detection
bias)
Low risk Those who conducted phone interviews were not aware of group assignment. Used pre-
determined open dialog for phone conversations for consistency.
Incomplete outcome data (attrition bias) Low risk Retention of subjects was 97% and 93% for years 1 and 2 respectively.
Selective reporting (reporting bias) Low risk Results were given for both the 1 and 2 year intervals.
Other bias Low risk The study appears to be free of other sources of bias.
Tate 2012
Methods 3-arm, single-center, single-blinded randomized clinical trial.
Participants 318 adults aged 18-65 who consumed ≥ 280 kcal per day in caloric beverages (excluding milk) were enrolled as
participants and finished the study.
Interventions Group 1: Water- replace ≥ 2 servings of NS soda (≥200 kcal per serving) with water N= 108
Group 2: NNS beverage - replace ≥ 2 servings of NS soda (≥200 kcal per serving) with NNS beverages N= 105
Group 3: Control - monthly group meetings and diet information N= 105
Outcomes Outcomes were assessed at baseline, 3 months and 6 months
BMI
Blood pressure
Fasting blood samples
Urine osmolality
Dietary intake data
looked at weight loss, type of beverage/calories, and total
Notes Supported by a grant from Nestle Waters USA. Water for the study was provided by Nestle Waters USA
Risk of bias table
Bias Scholars'
Judgment Support for Judgment
Random sequence generation (selection
bias)
Low risk Computer-generated random-numbers method by the project coordinator.
Allocation concealment (selection
bias)
Low risk Allocation was concealed from the participants and investigators until randomization
was revealed at the initial group session.
Blinding of participants and
personnel (performance bias)
Low risk Single blind
Blinding of outcome assessment (detection
bias)
Low risk

Office of Evidence Based Practice – Specific Care Question: Artificial Sweeteners
If you have questions regarding this Specific Care Question – please contact [email protected] or [email protected] 12
Incomplete outcome data (attrition bias) Low risk 84-88% completed the study across groups. However, data was analyzed with “intention
to treat” analysis which maintains all initial subjects, minimizing bias.
Selective reporting (reporting bias) Low risk
Other bias Low risk To limit seasonal effects of beverage consumption, the study was conducted in 5 cohorts
at different times of the year.
Figures: (For help reading forest plots, see Appendix 1) Forest Plots of Comparisons
NNS soda vs. carbonated water, outcome: Glucose (mmol/liter), area under the curve at 180 minutes.
NNS soda vs. carbonated water, outcome: Insulin (pmol/liter), area under the curve at 180 minutes.
Study or Subgroup Brown 2009
Total (95% CI) Heterogeneity: Not applicable Test for overall effect: Z = 0.06 (P = 0.96)
Mean 6.2
SD 6.1
Total 22
22
Mean 6.3
SD 5.9
Total 22
22
Weight 100.0%
100.0%
IV, Fixed, 95% CI -0.10 [-3.65, 3.45]
-0.10 [-3.65, 3.45]
NNS beverage Carbonated water Mean Difference Mean Difference IV, Fixed, 95% CI
-10 -5 0 5 10 Favors NNS bevearge Favors carbonated water
Study or Subgroup Brown 2009
Total (95% CI) Heterogeneity: Not applicable Test for overall effect: Z = 0.00 (P = 1.00)
Mean 1.1
SD 0.6
Total 22
22
Mean 1.1
SD 0.7
Total 22
22
Weight 100.0%
100.0%
IV, Fixed, 95% CI 0.00 [-0.39, 0.39]
0.00 [-0.39, 0.39]
NNS beverage Carbonated water Mean Difference Mean Difference IV, Fixed, 95% CI
-0.5 -0.25 0 0.25 0.5 Favors NNS beverage Favors carbonated water

Office of Evidence Based Practice – Specific Care Question: Artificial Sweeteners
If you have questions regarding this Specific Care Question – please contact [email protected] or [email protected] 13
NNS soda vs. carbonated water, outcome: GLP-1 (pmol/liter) area under the curve at 180 minutes.
One NNS beverage versus one NS beverage per day in children 4-11 years, outcome: BMI z score at 18 months
NNS beverage vs. NS beverage, outcome: BMI change all subjects at 2 years.
NNS beverage vs. NS beverage, outcome: BMI among non-Hispanic subjects at 2 years.
Study or Subgroup Brown 2009
Total (95% CI) Heterogeneity: Not applicable Test for overall effect: Z = 2.07 (P = 0.04)
Mean 24
SD 15.2
Total 22
22
Mean 16.2
SD 9
Total 22
22
Weight 100.0%
100.0%
IV, Fixed, 95% CI 7.80 [0.42, 15.18]
7.80 [0.42, 15.18]
NSS beverage Carbonated water Mean Difference Mean Difference IV, Fixed, 95% CI
-20 -10 0 10 20 Favors NNS beverage Favors carbonated water

Office of Evidence Based Practice – Specific Care Question: Artificial Sweeteners
If you have questions regarding this Specific Care Question – please contact [email protected] or [email protected] 14
NNS vs. NS beverage, outcome: BMI among Hispanic subjects at 2 years.
NNS vs. water, outcome: Weight loss.
NNS vs. water, outcome: Beverage calories.
NNS vs. water, outcome: Total calories.

Office of Evidence Based Practice – Specific Care Question: Artificial Sweeteners
If you have questions regarding this Specific Care Question – please contact [email protected] or [email protected] 15
Critically Appraised Topic (CAT) Author, date, country
Patient Group Level of Evidence (Oxford)
Research design
Significant results Limitations
BMI/Waist Circumference/Body weight
Duffey
2012, USA
Young adults (18-30 years of age in 1985-1986)
Level 4
Inception cohort with < 80% follow- up (72% follow-up occurred. Young adults from the CARDIA Study. 4 cities in the US. Interviewer administered diet history at 2, 5, 7, 10, 15, and 20 y after baseline.
Subjects were separated into 4 subgroups from 2 groups:
Followers of a Western diet (2,383 total): Consumers of NNS beverage (312) Non consumers of NNS beverage (2071) Followers of a Prudent diet (1,778 total): Consumers of NS beverage (613) Non consumers of NNS beverage (1165) Prudent diet is defined as: higher intake of fruit,
whole grains, milk, nuts and seeds). Western diet is considered to be a higher intake of fast food, meat and poultry, pizza and snacks.
Results were reported as Hazard Ratios (HR)1
For the Prudent versus Western diet comparison, for those who followed a Prudent diet there was no greater hazard of having a high waist circumference, high fasting glucose, but there was greater hazard of having low HDL-C, high TGs and high blood pressure 20 years later.
For the Non consumer of NNS beverage versus Consumer of NNS beverages comparison, for those who did not consume NNS beverages there was no greater risk of high fasting glucose, low HDL-C, high TGs, or high blood pressure 20 years later.
The hazard of metabolic syndrome was lower in both the Prudent diet group and the Non consumer group.
At the outset those who followed a Western diet and were consumers of NNS beverages had a higher BMI than those who either followed a Prudent diet (consumers & non consumers) and those who followed a Western diet and were non consumers.
Vanselow et al 2009 USA
Adolescents from 31 public middle and high schools in MN, USA N= 2,294 Males= 1,032; Females =
Level 2b
Prospective cohort with 78% follow-up Needs 80% follow-up to be considered good follow-up.
Unexpectedly, NS beverages were not shown to be positively associated with weight gain
White milk was found to be inversely associated with weight gain
There was a significant positive association between low calorie soft drink intake and weight gain. However, it was not present when adjustment for dieting and parental weight related concerns were used for adjustment.
Strengths of this study are it is a 5 year longitudinal evaluation of the associations between beverage consumption and BMI. A variety of beverages were compared; dieting and weight-concerns were taken into account. Limitations of this study are: -data was collected by self report over 5

Office of Evidence Based Practice – Specific Care Question: Artificial Sweeteners
If you have questions regarding this Specific Care Question – please contact [email protected] or [email protected] 16
1,262. Mean age 14.9 years.
years -drinks such as sports drinks, soy milk or almond milk were not taken into consideration -BMI was calculated on reported weight/height, not measured values
Cancers
Schernhammer et al
2012 USA
Men and women in the Health Professionals Follow-up Study and the Nurses’ Health Study
Level 1b
Observational Cohort study Data collected from food frequency questionnaires. Total aspartame was calculated from this resource.
Of 121,701 female and 51,529 males who participated, 1,324 non-Hodgkin’s lymphomas (1.1%), 285 multiple myelomas (0.2%) and 339 leukemia (0.3%) were identified over 22 years.
Multiple versions of modeling were used. Men and women were analyzed separately to examine sex differences. Amount of NNS soda consumed daily and participant age were used as analysis groupings.
The mean daily aspartame intake in consumers was 114 mg/d in the Nurses’ Health Study and 102 mg/d in the Health Professional Follow up study (ADI is 50 mg/kg/BW in the USA).
In men the risk for NHL was significantly increased for subjects who drank ≥ 1 serving of NNS soda per day (RR=1.31, 95% CI [1.01, 1.72] compared with those who reported no consumption. Risk was greater for those who consumed ≥ 2 servings per day RR=1.69, 95% CI [1.17, 2.45].
There was no association between NNS soda consumption (≥ 2 servings per day) and risk of all NHL in women. RR=1.12, 95% CI [0.81, 1.56].
Multiple myeloma risk was higher in men who
drank 1 servings of NNS soda per day (RR=2.02, 95% CI [1.20,3.40]
There was no association with risk of multiple myeloma in women with NNS soda consumption.
Leukemia risk was elevated in high intake categories of NNS soda in both men and women. RR= 1.42. 95% CI [1.00, 2.02]
Unexpectedly, a higher consumption of ≥ 1 NS
Only studied adults. May not be applicable to children. Relied on self reported food frequency questionnaires. However, they tried to minimize bias by using a prospective approach to collecting this data. Relied on self reported cancer diagnosis as well.

Office of Evidence Based Practice – Specific Care Question: Artificial Sweeteners
If you have questions regarding this Specific Care Question – please contact [email protected] or [email protected] 17
soda was associated with higher risk of NHL RR= 1.66. 95% CI [1.10, 2.51] in men but not women.
Food intake
Anton et al 2010, USA
19 lean (BMI 20-24.9) and 12 obese (BMI 30-39.9) adults Age 19-50 years
Level 1b: Randomized Control trial with wide confidence intervals.
Cross over intervention study
In the preload with stevia vs. preload with sucrose group, calorie intake at lunch was not different between groups.
In the preload with aspartame vs. the preload with sucrose group, calorie intake at lunch was not different between groups.
Wide confidence intervals
Appleton
& Blundell 2007, UK
10 women –high consumers of NNS beverages
10 women low consumers of NNS beverages
Level 1b
Pre-load procedure. All subjects were tested with each preload and intake was measured after the preload. Preloads 330 ml of water (W), NNS beverage (NNS), and NS beverage (NS)
Test meal intake (NNS vs. W) - low consumers of NNS beverage consumed more after NNS compared to water. High NNS consumers showed no difference in consumption after an NNS preload compared to water.
Test meal intake (NNS vs. NS) – No difference was seen between high and low habitual consumers and meal intake after a preload that contained NS.
There was significant difference in intake between high and low consumers of NNS beverages, independent of preload.
Does not state if preloads were randomly assigned to subjects. Does not state if preload administration was blinded.
Garnier
-Sagne, Leblanc & Verger, 2001
Survey of 227 children (112 girls, 115 boys) aged 2-20 years with Type 1 diabetes
Level 4: Survey
5 days food diary assessed for NNS intake (all types) from all sources to estimate the Theoretical Maximum Daily Intake (TMDI) and compare to the Acceptable Daily Intake (ADI) as determined by the 1994 European Directive 94/35/CE.
Of the 227 subjects who returned surveys, 192 subjects consumed aspartame. The ADI for aspartame = 40 mg/kg/d. The mean amount taken by the consumer group = 2.4 mg/kg/d (median= 1.1 mg/kg/d; maximum 15.6 mg/kg/d).
Of the 227 subjects who returned surveys, 174 consumed saccharin. The ADI for saccharin = 5 mg/kg/d. The mean amount taken by consumers =0.3 mg/kg/d (median 0.1 mg/kg/d; maximum 2.7 mg/kg/d).
Self reported food intake data.

Office of Evidence Based Practice – Specific Care Question: Artificial Sweeteners
If you have questions regarding this Specific Care Question – please contact [email protected] or [email protected] 18
Metabolic Control
Borstov et al
2011 USA
Youth (10 years or older) with Type 1 diabetes mellitus (DM) N= 1,806 observations were included.
Level 4b
Cross sectional cohort- subjects completed a valid FFQ for 7 days prior to clinic visit. Blood pressure and fasting blood chemistry values were compared between those with no NNS beverage intake, moderate NNS beverage intake and high NNS beverage intake.
In the previous week: -11% reported no NNS beverage intake -34% reported one serving per day -55% reported one or more serving per day Metabolic Characteristics and CVD risk factors in NNS Beverage intake group: -HgbA1c (%): None 8.7 (8.4-9.1); <1 Glass/d 8.9 (8.6-9.2); 1 Glass/d or more 9.3 (9.0-9.6). - Significantly different even when adjusted for confounding variables. -LDL Chol (mg/dl): None 98 (92-104); <1 Glass/d 101 (96-107); 1 Glass/d or more 104 (99-109). - Significantly different even when adjusted for confounding variables. -Diastolic Blood Pressure (mm Hg): None 67 (65-69); < 1 Glass/d 68 (66-69); 1 Glass/d or more 68(66-70). - No significant difference.
Observational study. Food frequency questionnaires can promote erroneous self reporting. There are many confounding variables too.
Brown et al
2010 USA
Systematic Review
Level 2a
SR of cohort pediatric studies
18 studies were identified: -6 on NNS effect on food intake -3 randomized control trials -3 observational cross sectional studies -6 prospective cohort studies
Observational studies on NNS and weight gain- 9 studies addressed this question. One study showed a positive correlation between the intake of NNS beverage use and elevated BMI or % body fat.
Interventional studies on NNS and weight gain- 3 studies (small) have shown no effect on weight loss, or BMI.
Affect on the metabolic syndrome- two studies address this, and neither found causative or associative effects.
Many confounding factors that are difficult to control. From observational studies, decision to consume NNS is made by those who are concerned about their weight. In children, this decision is made by parents who are concerned. Timing of the NNS beverage prior to a meal is a bigger determinant of food intake than the beverage alone.
De Koning et
Adult men N= 51,529 Aged 40-75
Level 1b Large cohort study (Health
Consumption of NS beverages (colas) was significantly associated with lower overall diet quality
Participants are only white men, difficult to generalize findings There is potential for confounding by

Office of Evidence Based Practice – Specific Care Question: Artificial Sweeteners
If you have questions regarding this Specific Care Question – please contact [email protected] or [email protected] 19
al
2011 USA
Professionals Follow up Study)
Consumption of NNS beverages was significantly associated with overall higher diet quality.
In a large cohort of men, NNS beverages were not associated with Type 2 diabetes.
factors that were not controlled.
Fagherazzi et al., 2013) France
Adult women N=66,118
Level 1b Large cohort
Women in the highest quartiles of both NS and NNS beverages had increased risk of Type 2 diabetes. The associations were mediated by BMI.
Participants were only women, difficult to generalize findings.
Lin, et al 2011 USA
Adult women N= 300 Nurses’ Health Study
Level 1b Large cohort
Microalbuminuria no difference was noted between NS and NNS beverage drinkers
Estimated GFR no difference was noted between NS and NNS beverage drinkers
A low number of subjects drank > 1 NS beverage/d.
Nettleton et al
2009 USA
6,813 adults, Caucasian, African American, Hispanic, and Chinese aged 45-84 years
Level 1b
Large cohort (MESA Study: Multi-Ethnic Study of Atherosclerosis) Baseline food frequency questionnaire and identification of Type 2 diabetes every other year for 6 years.
Compared with non-consumers, the risk of metabolic syndrome was 36% greater in those consuming 1 or more servings of NNS soda daily. However, adjusting for baseline measurements of adiposity made these results not significant. If subjects with any metabolic component at baseline were excluded, (leaving N = 1,078) the hazard ratio of developing any metabolic syndrome component was not significant.
Compared with non-consumers, the risk of Type 2 diabetes was 67% greater. Adjusting for baseline measurements of adiposity slightly attenuated results but they were still significant.
Unexpectedly NS soda consumption was not associated with the risk of either metabolic syndrome or Type 2 diabetes (data not shown, just summarized).
Causality cannot be concluded from an observational study. There is possibility of confounding from other lifestyle or dietary practices.
Wiebe et al
2011 Canada
53 studies included
Level 1b Systematic review with meta analysis.
Outcome: weight management, blood glucose and blood lipids.
3 trials compared NNS (either aspartame, cyclamate or a mixture) to sucrose.
Weight One study did not report significant loss in BMI in
the NNS group (133 participants, 0.3kg/m2 (-
1.1,0.5). A study in overweight participants, those who
consumed NNS had significantly greater loss
Trials were of low quality with a median Jadad score of 1. Jadad scores range from 1-5 with higher being better.
Heterogeneity between studies was
great, reported to be ≥ 77% for most questions.

Office of Evidence Based Practice – Specific Care Question: Artificial Sweeteners
If you have questions regarding this Specific Care Question – please contact [email protected] or [email protected] 20
in BMI over ten weeks (41 participants, -0.9 kg/m2 (-1.5,-0.4).
Energy intake Two trials reported significant effect of lower
energy intake in the NNS groups. [133 participants, (-283 kcals (-414,-153)] and [41 participants (-491 (-806, -177).
Other No effect of NNS type on HbA1c. One trial reported no effect of NNS on total
cholesterol, HDL cholesterol or triglycerides in 10 Type 1 diabetics.
One trial showed no effect of NNS on triglycerides in 41 overweight subjects.
Pregnancy
Englund-
Ogge et al 2012 Norway
Norwegian Mother and Child Cohort; N = 60,761 women.
Level 1b
Cohort study. Lifestyle (2 questionnaires, not clear if validated) and food frequency questionnaire (1 questionnaire was validated).
Frequent NNS beverage drinkers (≥ 4 servings per day) had an unadjusted odds ratio for preterm delivery of 1.22 95% CI {1.00, 1.47] relative to never drinkers of NNS beverages, but was not significant after confounders were considered.
The highest frequency of NS beverages was also associated with preterm delivery.
The trend for NS beverages and preterm delivery at the highest level of intake was stronger than the trend for NNS beverages.
The wording of the outcomes of the study is concerning. The authors state, ”a small but significant association between daily intake of NNS beverages and preterm delivery was found (aOR 1.15; 95% CI 1.01,1.32, P-trend 0.07).”
Halldorsson et al
2010 Denmark
Danish National Birth Cohort N= 59,334 pregnant women (1996-2002)
Level 1b
Cohort study mid-pregnancy food frequency questionnaire. The primary outcome was preterm delivery (< 37 weeks gestation).
A greater BMI and difference in energy intake were observed for those who drank NNS soda versus those who drank the NS soda.
No association with preterm delivery was observed for NS soda.
The intake of NNS soda was strongly associated with an increased risk of preterm delivery. Odds ratio 1.78 (95% CI: 1.19, 2.66).
Preterm delivery was driven by medically induced delivery rather than by spontaneous delivery.
Vascular disease (cardiovascular and neurovascular)
Bernstein et al,
2012 USA
Nurses’ Health Study (80,045 female
Level 1b
Cohort- all participants completed a 61 item food
Increased consumption of NS AND NNS sodas was associated with higher risk of stroke. The risk was higher in women than in men.
The pooled relative risk for stroke if ≥ 1 serving of
This is an observational study. There is potential for residual and unmeasured confounding. The finding of an association between NNS soda and

Office of Evidence Based Practice – Specific Care Question: Artificial Sweeteners
If you have questions regarding this Specific Care Question – please contact [email protected] or [email protected] 21
nurses) and the Health Professions Follow up study (43,371 male health professionals)
frequency questionnaire every 2 years. Cohorts were grouped on number of soda servings consumed. Stroke incidence was determined by self report and confirmed by medical imaging. Follow up was 28 years for women and 22 years for men.
NNS soda per day versus none was 1.16 (95% CI: 1.05, 1.28). This finding was independent of dietary and non-dietary cardio-vascular disease risk factors, such as BMI, and energy intake.
stroke risk is a new finding, so it has to be interpreted with caution. New research is likely to change confidence in this effect measure. Due to a low number of hemorrhagic strokes in men, the association needs to be carefully interpreted.
Gardener et al,
USA 2012
Adults N=2,564 the Northern Manhattan Study
Level 1b
Population based cohort study. FFQ were evaluated at baseline, and screened annually by telephone for the need for an in person interview. Hospital records were looked at for each subject for morbidity and mortality data (Incident vascular disease).
The mean age of subjects at baseline was 68.6 years of age.
Frequent NNS soda consumption was associated with white race, former smoking, hypertension, elevated blood sugar, lower HDL, elevated triglycerides, increased waist circumference, BMI, peripheral vascular disease, previous cardiac disease and the metabolic syndrome.
NS soda consumption was associated with male sex, Black race, current smoking, carbohydrate consumption, greater diastolic BP and lower prevalence of diabetes and hypercholesterolemia.
No association between NS soda consumption and risk of combined vascular events.
Daily NNS soda consumption was associated with 43% increased risk of vascular events. Light NNS
soda users did not have significantly increased risk.
The number of daily NNS soda users was small. (163 of 2,564 subjects or 6%)
Information on NNS soda consumption was only collected at baseline. If the subject’s preference changed it was not known.
1. Hazard ratio is the ratio of the hazard (chance of something harmful happening) of an event in one group observations divided by the hazard of an event in
the other group. A HR of 1 means the event has the same chance occurring in each group. A HR of 3 reveals 3 times the risk.

Office of Evidence Based Practice – Specific Care Question: Artificial Sweeteners
If you have questions regarding this Specific Care Question – please contact [email protected] or [email protected] 22
References:
American Diabetes Association.(2013, May). Artificial Sweeteners. Retrieved from ADA website http://www.diabetes.org/food-and-
fitness/food/what-can-i-eat/artificial-sweeteners/
Anton, S. D., Martin, C. K., Han, H., Coulon, S., Cefalu, W. T., Geiselman, P., & Williamson, D. A. (2010). Effects of stevia, aspartame,
and sucrose on food intake, satiety, and postprandial glucose and insulin levels. Appetite, 55(1), 37-43. doi:
10.1016/j.appet.2010.03.009
Appleton, K. M., & Blundell, J. E. (2007). Habitual high and low consumers of artificially-sweetened beverages: effects of sweet taste and
energy on short-term appetite. Physiol Behav, 92(3), 479-486. doi: S0031-9384(07)00158-8 [pii]
Bernstein, A. M., de Koning, L., Flint, A. J., Rexrode, K. M., & Willett, W. C. (2012). Soda consumption and the risk of stroke in men and
women. Am J Clin Nutr, 95(5), 1190-1199. doi: 10.3945/ajcn.111.030205]
Bortsov, A. V., Liese, A. D., Bell, R. A., Dabelea, D., D'Agostino, R. B., Jr., Hamman, R. F., . . . Mayer-Davis, E. J. (2011). Sugar-
sweetened and diet beverage consumption is associated with cardiovascular risk factor profile in youth with type 1 diabetes. Acta
Diabetol, 48(4), 275-282. doi: 10.1007/s00592-010-0246-9
Brown, R. J., de Banate, M. A., & Rother, K. I. (2010). Artificial sweeteners: a systematic review of metabolic effects in youth. Int J
Pediatr Obes, 5(4), 305-312. doi: 10.3109/17477160903497027
Brown, R. J., Walter, M., & Rother, K. I. (2009). Ingestion of diet soda before a glucose load augments glucagon-like peptide-1 secretion.
Diabetes Care, 32(12), 2184-2186. doi: 10.2337/dc09-1185
Centers of Disease Control. 2013, September 2013). Rethink your drink. Retrieved from the CDC website
http://www.cdc.gov/healthyweight/healthy_eating/drinks.html
de Koning, L., Malik, V. S., Rimm, E. B., Willett, W. C., & Hu, F. B. (2011). Sugar-sweetened and artificially sweetened beverage
consumption and risk of type 2 diabetes in men. Am J Clin Nutr, 93(6), 1321-1327. doi: 10.3945/ajcn.110.007922
de Ruyter, J. C., Olthof, M. R., Kuijper, L. D., & Katan, M. B. (2012). Effect of sugar-sweetened beverages on body weight in children:
design and baseline characteristics of the Double-blind, Randomized INtervention study in Kids. Contemp Clin Trials, 33(1), 247-
257. doi: 10.1016/j.cct.2011.10.007
Duffey, K. J., Steffen, L. M., Van Horn, L., Jacobs, D. R., Jr., & Popkin, B. M. (2012). Dietary patterns matter: diet beverages and
cardiometabolic risks in the longitudinal Coronary Artery Risk Development in Young Adults (CARDIA) Study. Am J Clin Nutr,
95(4), 909-915. doi: 10.3945/ajcn.111.026682
Ebbeling, C. B., Feldman, H. A., Chomitz, V. R., Antonelli, T. A., Gortmaker, S. L., Osganian, S. K., & Ludwig, D. S. (2012). A
randomized trial of sugar-sweetened beverages and adolescent body weight. N Engl J Med, 367(15), 1407-1416. doi:
10.1056/NEJMoa1203388

Office of Evidence Based Practice – Specific Care Question: Artificial Sweeteners
If you have questions regarding this Specific Care Question – please contact [email protected] or [email protected] 23
Englund-Ogge, L., Brantsaeter, A. L., Haugen, M., Sengpiel, V., Khatibi, A., Myhre, R., Jacobsson, B. (2012). Association between intake
of artificially sweetened and sugar-sweetened beverages and preterm delivery: a large prospective cohort study. Am J Clin Nutr,
96(3), 552-559. doi: 10.3945/ajcn.111.031567
Fagherazzi, G., Vilier, A., Saes Sartorelli, D., Lajous, M., Balkau, B., & Clavel-Chapelon, F. (2013). Consumption of artificially and sugar-
sweetened beverages and incident type 2 diabetes in the Etude Epidemiologique aupres des femmes de la Mutuelle Generale de
l'Education Nationale-European Prospective Investigation into Cancer and Nutrition cohort. Am J Clin Nutr, 97(3), 517-523. doi:
10.3945/ajcn.112.050997
Food and Drug Administration. (2013, Sept.) Food additives permitted for direct addition to food for human consumption. CRF Title 21
§172 Retrieved from http://www.accessdata.fda.gov/scripts/cdrh/cfdocs/cfCFR/CFRSearch.cfm?CFRPart=172
Garnier-Sagne, I., Leblanc, J. C., & Verger, P. (2001). Calculation of the intake of three intense sweeteners in young insulin-dependent
diabetics. Food an Chemical Toxicology, 39, 745-749.
Gardener, H., Rundek, T., Markert, M., Wright, C. B., Elkind, M. S., & Sacco, R. L. (2012). Diet soft drink consumption is associated with
an increased risk of vascular events in the Northern Manhattan Study. J Gen Intern Med, 27(9), 1120-1126. doi: 10.1007/s11606-
011-1968-2
Halldorsson, T. I., Strom, M., Petersen, S. B., & Olsen, S. F. (2010). Intake of artificially sweetened soft drinks and risk of preterm delivery:
a prospective cohort study in 59,334 Danish pregnant women. Am J Clin Nutr, 92(3), 626-633. doi: 10.3945/ajcn.2009.28968
Lin, J., & Curhan, G. C. (2011). Associations of sugar and artificially sweetened soda with albuminuria and kidney function decline in women.
Clin J Am Soc Nephrol, 6(1), 160-166. doi: 10.2215/CJN.03260410 CJN.03260410 [pii]
National Cancer Institute. (2013, Sept). Artificial sweeteners and cancer: National Cancer Institute fact sheet.Retrieved from
http://www.cancer.gov/cancertopics/factsheet/Risk/artificial-sweeteners
Nettleton, J. A., Lutsey, P. L., Wang, Y., Lima, J. A., Michos, E. D., & Jacobs, D. R., Jr. (2009). Diet soda intake and risk of incident
metabolic syndrome and type 2 diabetes in the Multi-Ethnic Study of Atherosclerosis (MESA). Diabetes Care, 32(4), 688-694. doi:
10.2337/dc08-1799
Schernhammer, E. S., Bertrand, K. A., Birmann, B. M., Sampson, L., Willett, W. C., & Feskanich, D. (2012). Consumption of artificial
sweetener- and sugar-containing soda and risk of lymphoma and leukemia in men and women. Am J Clin Nutr, 96(6), 1419-1428.
doi: 10.3945/ajcn.111.030833
Schiffman, S. S. (2012). Rationale for further medical and health research on high-potency sweeteners. Chem Senses, 37(8), 671-679. doi:
10.1093/chemse/bjs053bjs053 [pii]
Tate, D. F., Turner-McGrievy, G., Lyons, E., Stevens, J., Erickson, K., Polzien, K., . . . Popkin, B. (2012). Replacing caloric beverages with
water or diet beverages for weight loss in adults: main results of the Choose Healthy Options Consciously Everyday (CHOICE)
randomized clinical trial. Am J Clin Nutr, 95(3), 555-563. doi: 10.3945/ajcn.111.026278

Office of Evidence Based Practice – Specific Care Question: Artificial Sweeteners
If you have questions regarding this Specific Care Question – please contact [email protected] or [email protected] 24
US Departments of Agriculture (2010). Report of the Dietary Guidelines Advisory Committee on the Dietary Guidelines for Americans.
Wahsington, DC. Retrieved from:
http://www.cnpp.usda.gov/Publications/DietaryGuidelines/2010/DGAC/Report/2010DGACReport-camera-ready-Jan11-11.pdf.
Vanselow, M. S., Pereira, M. A., Neumark-Sztainer, D., & Raatz, S. K. (2009). Adolescent beverage habits and changes in weight over
time: findings from Project EAT. Am J Clin Nutr, 90(6), 1489-1495. doi: 10.3945/ajcn.2009.27573
Wiebe, N., Padwal, R., Field, C., Marks, S., Jacobs, R., & Tonelli, M. (2011). A systematic review on the effect of sweeteners on glycemic
response and clinically relevant outcomes. BMC Med, 9, 123. doi: 10.1186/1741-7015-9-123
Excluded Studies:
Authors Reason for Exclusion
Anderson, Foreyt, Sigman-Grant, & Allison, 2012 Narrative review
Bloomgarden, 2011 Narrative review
Blum et al., 2008 Does not answer the question
Chen et al., 2009 NS soda only
Elfhag, Tynelius, & Rasmussen, 2007 Does not answer the question
Eshak et al., 2012 NS soda only
Fiorito, et al., 2010 NS soda only
Frank et al., 2008 Does not answer the question
Maersk et al., 2012 NS soda only
Malik & Hu, 2012 Narrative review
Monsivais, Perrigue, & Drewnowski, 2007 Does not answer the question
Nguyen, Choi, Lustic, & Hsu, 2009 NS soda only
Nissinen et al., 2009 NS beverage only
Ogden, 2011 NS beverage only
Park, Blanck, Sherry, Brener, & O'Toole, 2012 Does not answer the question
Polyak et al., 2010 Animal study
Renwick & Molinary, 2010 Narrative review
Reedy & Krebs-Smith, 2010 Does not answer the question
(Skokan, Endler, Wulkersdorfer, Magometschnigg, & Spranger, 2007) NS only
Swithers, Laboy, Clark, Cooper, & Davidson, 2012 Animal study
Weihrauch & Diehl, 2004 Narrative review
Wojcicki & Heyman, 2012 Narrative review
Yang, 2010 Narrative review

Office of Evidence Based Practice – Specific Care Question: Artificial Sweeteners
If you have questions regarding this Specific Care Question – please contact [email protected] or [email protected] 25
Excluded:
Academy of Nutrition and Dietetics, (2013). Position of the Academy of Nturition and Dietetics: Use of nutritive and nonnutritive sweeteners. J.
Acad Nutr Diet, 112, 739-758.
Anderson, G. H., Foreyt, J., Sigman-Grant, M., & Allison, D. B. (2012). The use of low-calorie sweeteners by adults: impact on weight
management. J Nutr, 142(6), 1163S-1169S. doi: 10.3945/jn.111.149617 jn.111.149617 [pii]
Bloomgarden, Z. T. (2011). Nonnutritive sweeteners, fructose, and other aspects of diet. Diabetes Care, 34(5), e46-51. doi: 10.2337/dc11-0448
34/5/e46 [pii]
Blum, J. E., Davee, A. M., Beaudoin, C. M., Jenkins, P. L., Kaley, L. A., & Wigand, D. A. (2008). Reduced availability of sugar-sweetened
beverages and diet soda has a limited impact on beverage consumption patterns in Maine high school youth. J Nutr Educ Behav, 40(6),
341-347. doi: 10.1016/j.jneb.2007.12.004 S1499-4046(07)01131-1 [pii]
Chen, L., Appel, L. J., Loria, C., Lin, P. H., Champagne, C. M., Elmer, P. J., . . . Caballero, B. (2009). Reduction in consumption of sugar-
sweetened beverages is associated with weight loss: the PREMIER trial. Am J Clin Nutr, 89(5), 1299-1306. doi: 10.3945/ajcn.2008.27240
ajcn.2008.27240 [pii]
Elfhag, K., Tynelius, P., & Rasmussen, F. (2007). Sugar-sweetened and artificially sweetened soft drinks in association to restrained, external and
emotional eating. Physiol Behav, 91(2-3), 191-195. doi: S0031-9384(07)00069-8 [pii] 10.1016/j.physbeh.2007.02.005
Eshak, E. S., Iso, H., Kokubo, Y., Saito, I., Yamagishi, K., Inoue, M., & Tsugane, S. (2012). Soft drink intake in relation to incident ischemic heart
disease, stroke, and stroke subtypes in Japanese men and women: the Japan Public Health Centre-based study cohort I. Am J Clin Nutr,
96(6), 1390-1397. doi: 10.3945/ajcn.112.037903 ajcn.112.037903 [pii]
Fiorito, L. M., Marini, M., Mitchell, D. C., Smiciklas-Wright, H., & Birch, L. L. (2010). Girls' early sweetened carbonated beverage intake
predicts different patterns of beverage and nutrient intake across childhood and adolescence. J Am Diet Assoc, 110(4), 543-550. doi:
10.1016/j.jada.2009.12.027 S0002-8223(09)02097-5 [pii]
Frank, G. K., Oberndorfer, T. A., Simmons, A. N., Paulus, M. P., Fudge, J. L., Yang, T. T., & Kaye, W. H. (2008). Sucrose activates human taste
pathways differently from artificial sweetener. Neuroimage, 39(4), 1559-1569. doi: S1053-8119(07)01004-X [pii]
10.1016/j.neuroimage.2007.10.061
Maersk, M., Belza, A., Holst, J. J., Fenger-Gron, M., Pedersen, S. B., Astrup, A., & Richelsen, B. (2012). Satiety scores and satiety hormone
response after sucrose-sweetened soft drink compared with isocaloric semi-skimmed milk and with non-caloric soft drink: a controlled
trial. Eur J Clin Nutr, 66(4), 523-529. doi: 10.1038/ejcn.2011.223 ejcn2011223 [pii]
Malik, V. S., & Hu, F. B. (2012). Sweeteners and Risk of Obesity and Type 2 Diabetes: The Role of Sugar-Sweetened Beverages. Curr Diab Rep.
doi: 10.1007/s11892-012-0259-6

Office of Evidence Based Practice – Specific Care Question: Artificial Sweeteners
If you have questions regarding this Specific Care Question – please contact [email protected] or [email protected] 26
Monsivais, P., Perrigue, M. M., & Drewnowski, A. (2007). Sugars and satiety: does the type of sweetener make a difference? Am J Clin Nutr,
86(1), 116-123. doi: 86/1/116 [pii]
Nguyen, S., Choi, H. K., Lustig, R. H., & Hsu, C. (2009). Sugar sweetened beverages, serum uric acid, and blood pressure in adolescents. J
Pediatr, 154(6), 807-813. doi: 10.1016/j.jpeds.2009.01.015
Nissinen, K., Mikkila, V., Mannisto, S., Lahti-Koski, M., Rasanen, L., Viikari, J., & Raitakari, O. T. (2009). Sweets and sugar-sweetened soft
drink intake in childhood in relation to adult BMI and overweight. The Cardiovascular Risk in Young Finns Study. Public Health Nutr,
12(11), 2018-2026. doi: 10.1017/S1368980009005849S1368980009005849 [pii]
Ogden, C. L., Kit, B. K., Carroll, M. D., & Park, S. (2011). Consumption of sugar drinks in the United States, 2005-2008. NCHS Data Brief(71),
1-8.
Park, S., Blanck, H. M., Sherry, B., Brener, N., & O'Toole, T. (2012). Factors associated with low water intake among US high school students -
National Youth Physical Activity and Nutrition Study, 2010. J Acad Nutr Diet, 112(9), 1421-1427. doi: 10.1016/j.jand.2012.04.014
S2212-2672(12)00554-0 [pii]
Polyak, E., Gombos, K., Hajnal, B., Bonyar-Muller, K., Szabo, S., Gubicsko-Kisbenedek, A., . . . Ember, I. (2010). Effects of artificial sweeteners
on body weight, food and drink intake. Acta Physiol Hung, 97(4), 401-407. doi: 10.1556/APhysiol.97.2010.4.9 T41V783621621821 [pii]
Reedy, J., & Krebs-Smith, S. M. (2010). Dietary sources of energy, solid fats, and added sugars among children and adolescents in the United
States. J Am Diet Assoc, 110(10), 1477-1484. doi: 10.1016/j.jada.2010.07.010 S0002-8223(10)01189-2 [pii]
Renwick, A. G., & Molinary, S. V. (2010). Sweet-taste receptors, low-energy sweeteners, glucose absorption and insulin release. Br J Nutr,
104(10), 1415-1420. doi: 10.1017/S0007114510002540 S0007114510002540 [pii]
Skokan, I., Endler, P. C., Wulkersdorfer, B., Magometschnigg, D., & Spranger, H. (2007). Influence of artificial sweetener on human blood
glucose concentration. ScientificWorldJournal, 7, 1618-1621. doi: 10.1100/tsw.2007.228
Swithers, S. E., Laboy, A. F., Clark, K., Cooper, S., & Davidson, T. L. (2012). Experience with the high-intensity sweetener saccharin impairs
glucose homeostasis and GLP-1 release in rats. Behav Brain Res, 233(1), 1-14. doi: 10.1016/j.bbr.2012.04.024 S0166-
4328(12)00285-9 [pii]
Weihrauch, M. R., & Diehl, V. (2004). Artificial sweeteners--do they bear a carcinogenic risk? Ann Oncol, 15(10), 1460-1465. doi:
10.1093/annonc/mdh256 15/10/1460 [pii]
Wojcicki, J. M., & Heyman, M. B. (2012). Reducing childhood obesity by eliminating 100% fruit juice. Am J Public Health, 102(9), 1630-1633.
doi: 10.2105/AJPH.2012.300719
Yang, Q. (2010). Gain weight by "going diet?" Artificial sweeteners and the neurobiology of sugar cravings: Neuroscience 2010. Yale J Biol Med,
83(2), 101-108.

Office of Evidence Based Practice – Specific Care Question: Artificial Sweeteners
If you have questions regarding this Specific Care Question – please contact [email protected] or [email protected] 27
Appendix 1.