office of debt management - u.s. department of the … of debt management ... d. treasury net...
TRANSCRIPT

Office of Debt ManagementOffice of Debt Management
Fiscal Year 2012 Q1 ReportFiscal Year 2012 Q1 Report

Table of ContentsTable of ContentsI. Fiscal
A. Quarterly Tax Receipts p. 4B. Receipt Base Levels p. 5C. Ten Largest Outlays p. 6D. Treasury Net Non-marketable Borrowing p. 8E. Cumulative Budget Deficits by Fiscal Year p. 9F. Deficit and Borrowing Estimates p. 10G. Budget Surplus/Deficit with OMB Forecast p. 11
II. Portfolio MetricsA. Historical and Projected Net Marketable Borrowing p. 13B. Weighted Average Maturity of Marketable Debt p. 15C. Recent and Future Portfolio Composition by Issuance Type p. 16D. Recent and Future Maturity Profile p. 18
III DemandIII. DemandA. Bid-to-Cover Ratios p. 23B. Investor Class Auction Awards p. 27C. Foreign Awards at Auction p. 34D. Primary Dealer Awards at Auction p. 38
2

Section I:Fiscal
3

Quarterly Tax Receipts
100%
150%
50%
100%
% C
hang
e
0%
Year
ove
r Yea
r %
-50%
-100%
Dec
-01
Mar
-02
Jun-
02Se
p-02
Dec
-02
Mar
-03
Jun-
03Se
p-03
Dec
-03
Mar
-04
Jun-
04Se
p-04
Dec
-04
Mar
-05
Jun-
05Se
p-05
Dec
-05
Mar
-06
Jun-
06Se
p-06
Dec
-06
Mar
-07
Jun-
07Se
p-07
Dec
-07
Mar
-08
Jun-
08Se
p-08
Dec
-08
Mar
-09
Jun-
09Se
p-09
Dec
-09
Mar
-10
Jun-
10Se
p-10
Dec
-10
Mar
-11
Jun-
11Se
p-11
Dec
-11
4
Corporate Taxes Non-Withheld Taxes (incl SECA) Withheld Taxes (incl FICA)

Receipt Base Levels(12-Month Moving Average)
100
120
80
40
60 $ bn
20
40
-
Dec
-01
Mar
-02
Jun-
02Se
p-02
Dec
-02
Mar
-03
Jun-
03Se
p-03
Dec
-03
Mar
-04
Jun-
04Se
p-04
Dec
-04
Mar
-05
Jun-
05Se
p-05
Dec
-05
Mar
-06
Jun-
06Se
p-06
Dec
-06
Mar
-07
Jun-
07Se
p-07
Dec
-07
Mar
-08
Jun-
08Se
p-08
Dec
-08
Mar
-09
Jun-
09Se
p-09
Dec
-09
Mar
-10
Jun-
10Se
p-10
Dec
-10
Mar
-11
Jun-
11Se
p-11
Dec
-11
5Individual Income Taxes include withheld and non-withheld. Social Insurance Taxes include FICA, SECA, RRTA, UTF Deposits, FUTA and RUIA. Other includes excise taxes, estate and gift taxes, customs duties and miscellaneous receipts.
Individual Income Taxes Corporation Income Taxes Social Insurance Taxes Other

Ten Largest Outlays for FY 2011
900
1000
600
700
800
300
400
500$ bn
0
100
200
0
Hea
lth a
ndH
uman
Ser
vice
s
Soci
al S
ecur
ityA
dmin
istr
atio
n
efen
se-M
ilita
ry
Trea
sury
Agr
icul
ture
Labo
r
eter
ans A
ffair
s
Tran
spor
tatio
n
ce o
f Per
sonn
elM
anag
emen
t
Educ
atio
n
6
H S A De V T
Offi
c M

Q1 Levels of Ten Largest Outlays
200
250
150
n
100
$ bn
0
50
0
Hea
lth a
ndum
an S
ervi
ces
Soci
al S
ecur
ityA
dmin
istr
atio
n
efen
se-M
ilita
ry
Trea
sury
Agr
icul
ture
Labo
r
eter
ans A
ffair
s
Tran
spor
tatio
n
ce o
f Per
sonn
elM
anag
emen
t
Educ
atio
n
7
Hu S A D
e Ve T
Offi
c M
Q1 FY 2011 Q1 FY 2012

Treasury Net Non-Marketable Borrowing
20
30
10
-10
0$ bn
-20
-30
Q2-
02Q
3-02
Q4-
02Q
1-03
Q2-
03Q
3-03
Q4-
03Q
1-04
Q2-
04Q
3-04
Q4-
04Q
1-05
Q2-
05Q
3-05
Q4-
05Q
1-06
Q2-
06Q
3-06
Q4-
06Q
1-07
Q2-
07Q
3-07
Q4-
07Q
1-08
Q2-
08Q
3-08
Q4-
08Q
1-09
Q2-
09Q
3-09
Q4-
09Q
1-10
Q2-
10Q
3-10
Q4-
10Q
1-11
Q2-
11Q
3-11
Q4-
11Q
1-12
8
Fiscal Quarter
Foreign Series State and Local Govt. Series (SLGS) Savings Bonds

1,400Cumulative Budget Deficits by Fiscal Year
1,200
800
1,000
600
$ bn
200
400
0
Oct
ober
ovem
ber
ecem
ber
Janu
ary
Febr
uary
Mar
ch
Apr
il
May
June
July
Aug
ust
ptem
ber
9
No De F
Sep
FY2010 FY2011 FY2012

FY 2012-2014 Deficit and Borrowing Estimates In $ Billion
Primary Dealers* CBO** OMB***
Estimates as of: Jan-12 Aug-11 Sep-11
FY 2012 Deficit Estimate 1,127 973 1,334
FY 2013 Deficit Estimate 899 623 883
FY 2014 Deficit Estimate 737 380 476
FY 2012 Deficit Range 1,000-1,275
FY 2013 Deficit Range 580-1,120
FY 2014 Deficit Range 85-1,037
FY 2012 Marketable Borrowing Range 1,025-1,275
FY 2013 Marketable Borrowing Range 635-1,120
10
*Based on primary dealer feedback on January 23, 2012. Deficit estimates are averages. **Current law, prior to any Joint Committee actions or sequester.***Deficit projections from September 2011 – “Living Within Our Means and Investing in the Future”.

Budget Surplus/Deficit with OMB Forecast from September 2011 – “Living Within Our Means and Investing in the Future”
2%
4%
0
500
g g
‐2%
0%
-500
0
‐6%
‐4%-1,000
‐10%
‐8%
-2,000
-1,500
‐12%-2,500
1995
1996
1997
1998
1999
2000
2001
2002
2003
2004
2005
2006
2007
2008
2009
2010
2011
2012
2013
2014
2015
2016
2017
2018
2019
2020
2021
Fiscal Year
11Projection
Fiscal Year
OMB Surplus/Deficit in $ bn-(L) OMB Surplus/Deficit as a % of GDP-(R)

Section II:Portfolio Metrics
12

Historical and Projected Net Marketable Borrowing Assuming All Issuance Remains Constant
1,7871,483
1,1041,500
2,000
787
1,064965 898
7481,000
684
466525
352251
169
500
$ bn
0
(500)
2008
2009
2010
2011
2012
2013
2014
2015
2016
2017
2018
2019
2020
2021
End of Fiscal Year
TIPS 7/10/30 2/3/5 Bill OMB D fi it P j ti
13
Portfolio & SOMA holdings as of 12/30/2011. Assumes current issuance sizes for Bills, Nominal Coupons and TIPS; along with SOMA reinvestment. The principal on the TIPS securities were accreted to each projection date based on market ZCIS levels. No attempt was made to match future financing needs. OMB deficit projections are from Table S-1 of September 2011, “Living Within Our Means and Investing in the Future”. Data labels represent net borrowing numbers in billions.
TIPS 7/10/30 2/3/5 Bills OMB Deficit Projections

Historical and Projected Net Marketable Borrowing Assuming All Issuance Remains Constant $ BillionIssuance Remains Constant, $ Billion
End of Fiscal Y Bills 2/3/5 7/10/30 TIPS Net Borrowing OMB Deficit
P j tiYear s /3/5 / 0/30 S Net o o g Projections
2008 532 106 109 40 787 -
2009 503 732 514 38 1,787 -
2010 (204) 869 783 35 1,483 -
2011 (311) 576 751 88 1,104 -
2012 65 131 790 77 1,064 1,334
2013 0 134 737 93 965 833
2014 0 85 744 70 898 476
2015 0 (28) 708 69 748 525
2016 0 94 534 56 684 589
2017 0 54 354 58 466 506
2018 0 69 393 63 525 482
2019 0 40 256 57 352 511
2020 0 (2) 227 26 251 549
2021 0 (30) 197 2 169 565
14
Portfolio & SOMA holdings as of 12/30/2011. Assumes current issuance sizes for Bills, Nominal Coupons and TIPS; along with SOMA reinvestment. The principal on the TIPS securities were accreted to each projection date based on market ZCIS levels. No attempt was made to match future financing needs. OMB deficit projections are from Table S-1 of September 2011, “Living Within Our Means and Investing in the Future”. Data labels represent net borrowing numbers in billions.

Weighted Average Maturity of Marketable Debt
75
80
85hs
)
65
70
e M
atur
ity (M
onth
50
55
60
Wei
ghte
d A
vera
ge
40
45
50W
1981
1983
1985
1987
1989
1991
1993
1995
1997
1999
2001
2003
2005
2007
2009
2011
2013
2015
2017
2019
2021
Calendar Year
Historical Adjust Nominal Coupons to Match Financing Needs
15
Portfolio & SOMA holdings as of 12/30/2011. To match OMB’s projected financing needs for the next 10 years, nominal coupon securities (2-, 3-, 5-, 7-, 10-, and 30-year) were adjusted by the same percentage. OMB deficit projections are from Table S-1 of September 2011, “Living Within Our Means and Investing in the Future”. The principal on the TIPS securities were accreted to each projection date based on market ZCIS levels. This scenario does NOT represent any particular course of action that Treasury is expected to follow. Instead, it is intended to demonstrate the basic trajectory of average maturity absent changes to the mix of securities issued by Treasury.
j p g

Recent and Future Portfolio Composition by Issuance Type, Percent
80%
90%
100%
y
60%
70%
80%
folio
30%
40%
50%
% o
f Por
tf
10%
20%
0%
2006
2007
2008
2009
2010
2011
2012
2013
2014
2015
2016
2017
2018
2019
2020
2021
End of Fiscal Year
Bills Nominal Coupons TIPS (principal accreted to projection date)
16
p (p p p j )
Portfolio & SOMA holdings as of 12/30/2011. To match OMB’s projected financing needs for the next 10 years, nominal coupon securities (2-, 3-, 5-, 7-, 10-, and 30-year) were adjusted by the same percentage. OMB deficit projections are from Table S-1 of September 2011, “Living Within Our Means and Investing in the Future”. The principal on the TIPS securities were accreted to each projection date based on market ZCIS levels. This scenario does NOT represent any particular course of action that Treasury is expected to follow. Instead, it is intended to demonstrate the basic trajectory of average maturity absent changes to the mix of securities issued by Treasury.

Recent and Future Portfolio Composition by Issuance Type, Percent
End of Fiscal Year Bills Nominal Coupons
TIPS (principal accreted to
projection date)2006 21 3% 69 5% 9 2%2006 21.3% 69.5% 9.2%2007 21.6% 68.1% 10.3%2008 28.5% 61.4% 10.0%2009 28.5% 63.6% 7.9%2010 21 1% 71 9% 7 0%2010 21.1% 71.9% 7.0%2011 15.4% 77.3% 7.3%2012 14.1% 78.7% 7.3%2013 13.1% 79.3% 7.7%2014 12 5% 79 4% 8 1%2014 12.5% 79.4% 8.1%2015 12.0% 79.5% 8.5%2016 11.4% 79.8% 8.8%2017 11.0% 79.9% 9.1%2018 10 6% 80 0% 9 4%2018 10.6% 80.0% 9.4%2019 10.2% 80.1% 9.7%2020 9.8% 80.4% 9.8%
2021 9.5% 80.9% 9.7%
17
Portfolio & SOMA holdings as of 12/30/2011. To match OMB’s projected financing needs for the next 10 years, nominal coupon securities (2-, 3-, 5-, 7-, 10-, and 30-year) were adjusted by the same percentage. OMB deficit projections are from Table S-1 of September 2011, “Living Within Our Means and Investing in the Future”. The principal on the TIPS securities were accreted to each projection date based on market ZCIS levels. This scenario does NOT represent any particular course of action that Treasury is expected to follow. Instead, it is intended to demonstrate the basic trajectory of average maturity absent changes to the mix of securities issued by Treasury.
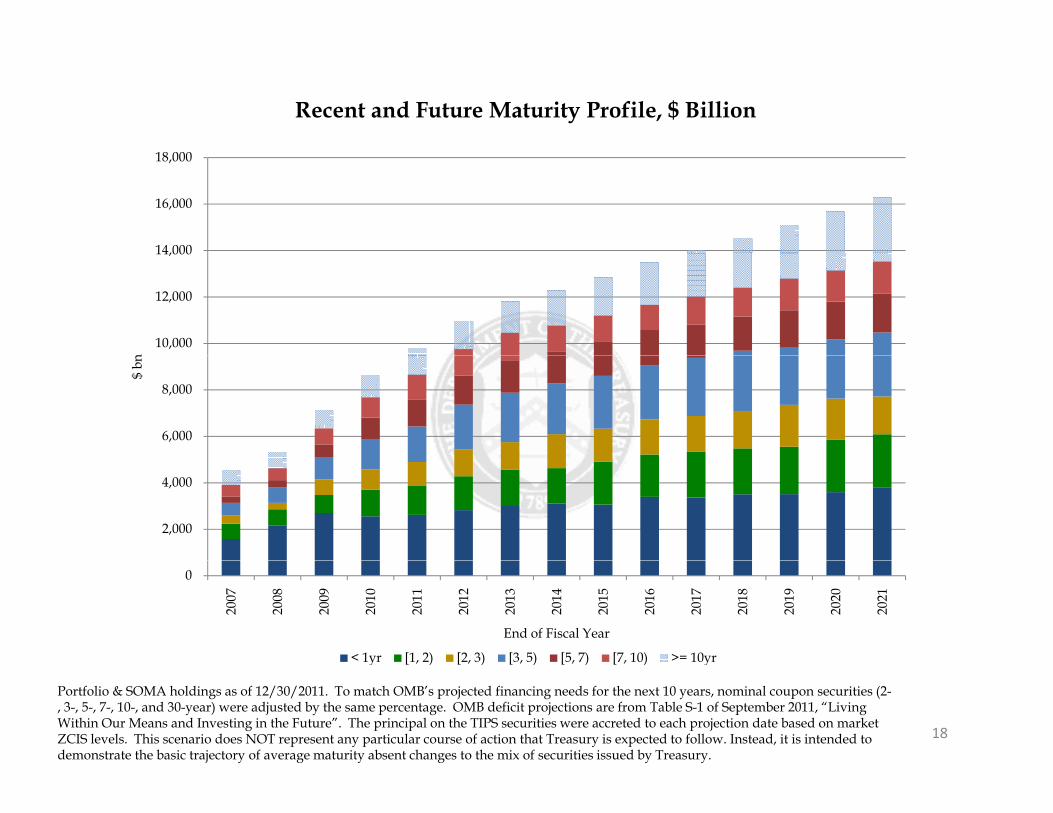
Recent and Future Maturity Profile, $ Billion
14,000
16,000
18,000
10,000
12,000
14,000
n
6,000
8,000
$ bn
2,000
4,000
0
2007
2008
2009
2010
2011
2012
2013
2014
2015
2016
2017
2018
2019
2020
2021
End of Fiscal Year
< 1yr [1, 2) [2, 3) [3, 5) [5, 7) [7, 10) >= 10yr
18
y [ , ) [ , ) [ , ) [ , ) [ , ) y
Portfolio & SOMA holdings as of 12/30/2011. To match OMB’s projected financing needs for the next 10 years, nominal coupon securities (2-, 3-, 5-, 7-, 10-, and 30-year) were adjusted by the same percentage. OMB deficit projections are from Table S-1 of September 2011, “Living Within Our Means and Investing in the Future”. The principal on the TIPS securities were accreted to each projection date based on market ZCIS levels. This scenario does NOT represent any particular course of action that Treasury is expected to follow. Instead, it is intended to demonstrate the basic trajectory of average maturity absent changes to the mix of securities issued by Treasury.

Recent and Future Maturity Profile, $ Billion
End of Fiscal Year < 1yr [1, 2) [2, 3) [3, 5) [5, 7) [7, 10) >= 10yr
2007 1,582 664 342 551 276 499 627 2008 2,151 710 280 657 318 515 690 2009 2,702 775 666 970 540 691 779 2010 2,563 1,143 872 1,310 918 881 952 2011 2,621 1,273 1,004 1,527 1,146 1,086 1,129 0 , , , , , , ,2012 2,824 1,458 1,160 1,923 1,255 1,139 1,208 2013 3,002 1,570 1,182 2,123 1,400 1,181 1,359 2014 3,114 1,518 1,467 2,177 1,361 1,133 1,543 2015 3,063 1,843 1,426 2,273 1,489 1,098 1,674 2016 3 395 1 825 1 505 2 322 1 532 1 081 1 826 2016 3,395 1,825 1,505 2,322 1,532 1,081 1,826 2017 3,370 1,967 1,541 2,500 1,427 1,221 1,999 2018 3,512 1,971 1,609 2,594 1,474 1,252 2,131 2019 3,516 2,036 1,803 2,458 1,615 1,368 2,293 2020 3,602 2,265 1,760 2,546 1,631 1,344 2,530 2021 3,811 2,281 1,627 2,751 1,686 1,370 2,760
19
Portfolio & SOMA holdings as of 12/30/2011. To match OMB’s projected financing needs for the next 10 years, nominal coupon securities (2-, 3-, 5-, 7-, 10-, and 30-year) were adjusted by the same percentage. OMB deficit projections are from Table S-1 of September 2011, “Living Within Our Means and Investing in the Future”. The principal on the TIPS securities were accreted to each projection date based on market ZCIS levels. This scenario does NOT represent any particular course of action that Treasury is expected to follow. Instead, it is intended to demonstrate the basic trajectory of average maturity absent changes to the mix of securities issued by Treasury.

Recent and Future Maturity Profile, Percent
80%
90%
100%
60%
70%
30%
40%
50%
10%
20%
0%
2007
2008
2009
2010
2011
2012
2013
2014
2015
2016
2017
2018
2019
2020
2021
End of Fiscal Year
< 1yr [1, 2) [2, 3) [3, 5) [5, 7) [7, 10) >= 10yr
20
y [ , ) [ , ) [ , ) [ , ) [ , ) y
Portfolio & SOMA holdings as of 12/30/2011. To match OMB’s projected financing needs for the next 10 years, nominal coupon securities (2-, 3-, 5-, 7-, 10-, and 30-year) were adjusted by the same percentage. OMB deficit projections are from Table S-1 of September 2011, “Living Within Our Means and Investing in the Future”. The principal on the TIPS securities were accreted to each projection date based on market ZCIS levels. This scenario does NOT represent any particular course of action that Treasury is expected to follow. Instead, it is intended to demonstrate the basic trajectory of average maturity absent changes to the mix of securities issued by Treasury.

Recent and Future Maturity Profile, Percent
End of Fiscal Year < 1yr [1, 2) [2, 3) [3, 5) [5, 7) [7, 10) >= 10yr
2007 34.8% 14.6% 7.5% 12.1% 6.1% 11.0% 13.8%2008 40.4% 13.3% 5.3% 12.3% 6.0% 9.7% 13.0%2009 37.9% 10.9% 9.3% 13.6% 7.6% 9.7% 10.9%2010 29.7% 13.2% 10.1% 15.2% 10.6% 10.2% 11.0%2011 26 8% 13 0% 10 3% 15 6% 11 7% 11 1% 11 5%2011 26.8% 13.0% 10.3% 15.6% 11.7% 11.1% 11.5%2012 25.8% 13.3% 10.6% 17.5% 11.4% 10.4% 11.0%2013 25.4% 13.3% 10.0% 18.0% 11.8% 10.0% 11.5%2014 25.3% 12.3% 11.9% 17.7% 11.1% 9.2% 12.5%2015 23.8% 14.3% 11.1% 17.7% 11.6% 8.5% 13.0%2016 25.2% 13.5% 11.2% 17.2% 11.4% 8.0% 13.5%2017 24.0% 14.0% 11.0% 17.8% 10.2% 8.7% 14.3%2018 24.1% 13.6% 11.1% 17.8% 10.1% 8.6% 14.7%2019 23.3% 13.5% 12.0% 16.3% 10.7% 9.1% 15.2%2020 23 0% 14 4% 11 2% 16 2% 10 4% 8 6% 16 1%2020 23.0% 14.4% 11.2% 16.2% 10.4% 8.6% 16.1%2021 23.4% 14.0% 10.0% 16.9% 10.4% 8.4% 16.9%
21
Portfolio & SOMA holdings as of 12/30/2011. To match OMB’s projected financing needs for the next 10 years, nominal coupon securities (2-, 3-, 5-, 7-, 10-, and 30-year) were adjusted by the same percentage. OMB deficit projections are from Table S-1 of September 2011, “Living Within Our Means and Investing in the Future”. The principal on the TIPS securities were accreted to each projection date based on market ZCIS levels. This scenario does NOT represent any particular course of action that Treasury is expected to follow. Instead, it is intended to demonstrate the basic trajectory of average maturity absent changes to the mix of securities issued by Treasury.

Section III:Demand
22

Bid-to-Cover Ratios for Treasury Bills
5
5.5
6
4
4.5
5
Rat
io
3
3.5
4
Bid-
to-C
over
2
2.5
1.5
Dec
-01
Dec
-02
Dec
-03
Dec
-04
Dec
-05
Dec
-06
Dec
-07
Dec
-08
Dec
-09
Dec
-10
Dec
-11
23
4-Week (13-week moving average) 13-Week (13-week moving average)
26-Week (13-week moving average) 52-Week (6-month moving average)
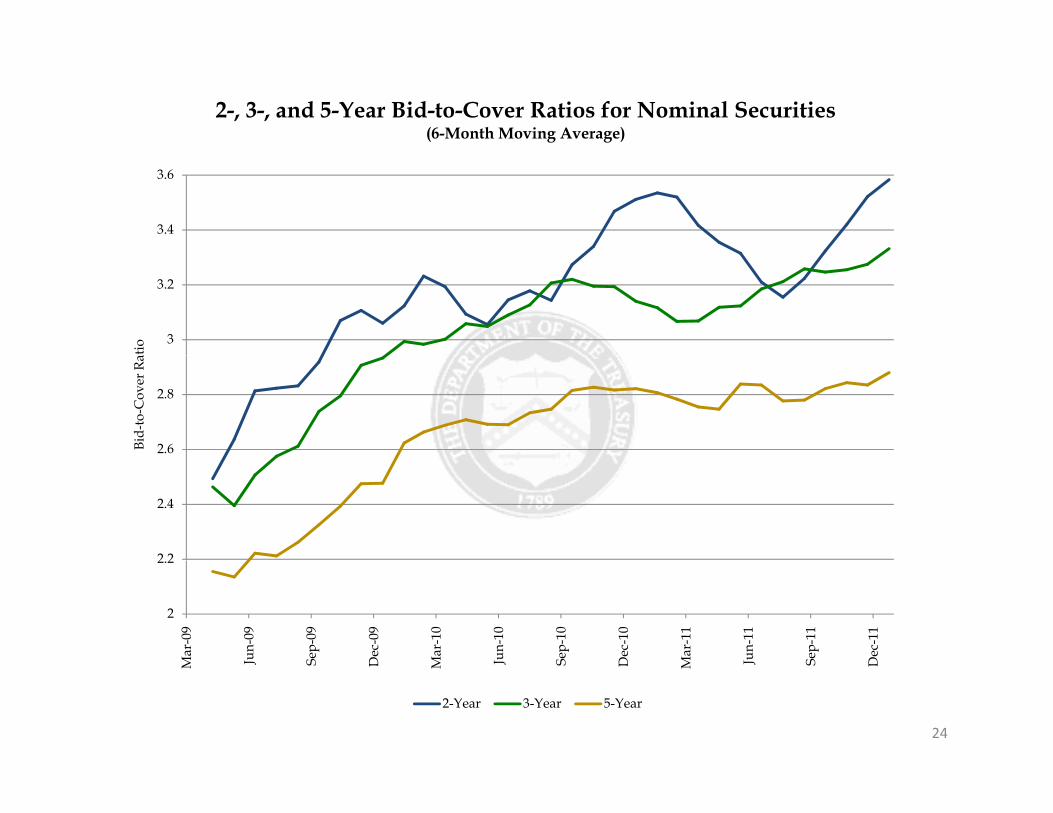
2-, 3-, and 5-Year Bid-to-Cover Ratios for Nominal Securities(6-Month Moving Average)
3.4
3.6
3
3.2
atio
2.6
2.8
Bid-
to-C
over
Ra
2 2
2.4
2
2.2
Mar
-09
Jun-
09
Sep-
09
Dec
-09
Mar
-10
Jun-
10
Sep-
10
Dec
-10
Mar
-11
Jun-
11
Sep-
11
Dec
-11
24
M J S D M J S D M J S D
2-Year 3-Year 5-Year

Bid-to-Cover Ratios for 7-, 10-, and 30-Year Nominal Securities(6-Month Moving Average)
3.2
3.4
3
atio
2.8
Bid-
to-C
over
R
2.4
2.6
2.2
Jun-
09
Sep-
09
Dec
-09
Mar
-10
Jun-
10
Sep-
10
Dec
-10
Mar
-11
Jun-
11
Sep-
11
Dec
-11
25
J S D M J S D M J S D
7-Year 10-Year 30-Year

Bid-to-Cover Ratios for TIPS
3
3.5
2.5
3
Ratio
2Bid-
to-C
over
R
1.5
1
Dec
-99
Dec
-00
Dec
-01
Dec
-02
Dec
-03
Dec
-04
Dec
-05
Dec
-06
Dec
-07
Dec
-08
Dec
-09
Dec
-10
Dec
-11
26
5-Year 10-Year (6-month moving average) 20-Year 30-Year

Investor Class Auction Awards: BillsCalendar Year 2011
Other4.1%
Foreign & International
11.0%
Investment Funds 15.8%
Primary Dealers59.1%
Other Dealers & Brokers Brokers
9.9%
27Excludes SOMA add-ons. “Other” includes categories that are each less than 2%, which include Depository Institutions, Individuals, Pension and Insurance.

Calendar Year Change in Bill Auction Awards by Investor Class
5%
10%
0%
Cha
nge
-10%
-5%
Cal
enda
r Yea
r
-15%
-20%
Prim
ary
Dea
lers
Oth
er D
eale
rs&
Bro
kers
Inve
stm
ent
Fund
s
Fore
ign
&
Inte
rnat
iona
l
28Excludes SOMA add-ons.
O I
2011 less 2010 2011 less 2009 2011 less 2008 2011 less 2007 2011 less 2006

Investor Class Auction Awards: Investor Class Auction Awards:
Other1.0%
Investor Class Auction Awards:2-, 3-, and 5-Year Nominal Securities
Calendar Year 2011Other0.7%
Investor Class Auction Awards:7-, 10-, and 30-Year Nominal Securities
Calendar Year 2011
Foreign & International
1.0%
Foreign & I t ti l International
22.6%
Primary Dealers45.5%
International 24.4%
Primary Dealers50.6%Investment
Funds 15.0%
Investment Funds
Other Dealers & Brokers
10.8%
Other Dealers &
Brokers 7.0%
Funds 22.3%
29Excludes SOMA add-ons. “Other” includes categories that are each less than 2%, which include Depository Institutions, Individuals, Pension and Insurance.

Calendar Year Change in 2-, 3-, 5-Year Nominal Securities Auction Awards by Investor Class
10%
15%
y
0%
5%
Cha
nge
-10%
-5%
Cal
enda
r Yea
r
-20%
-15%
20%
Prim
ary
Dea
lers
Oth
er D
eale
rs&
Bro
kers
Inve
stm
ent
Fund
s
Fore
ign
&
Inte
rnat
iona
l
30
2011 less 2010 2011 less 2009 2011 less 2008 2011 less 2007 2011 less 2006
Excludes SOMA add-ons.
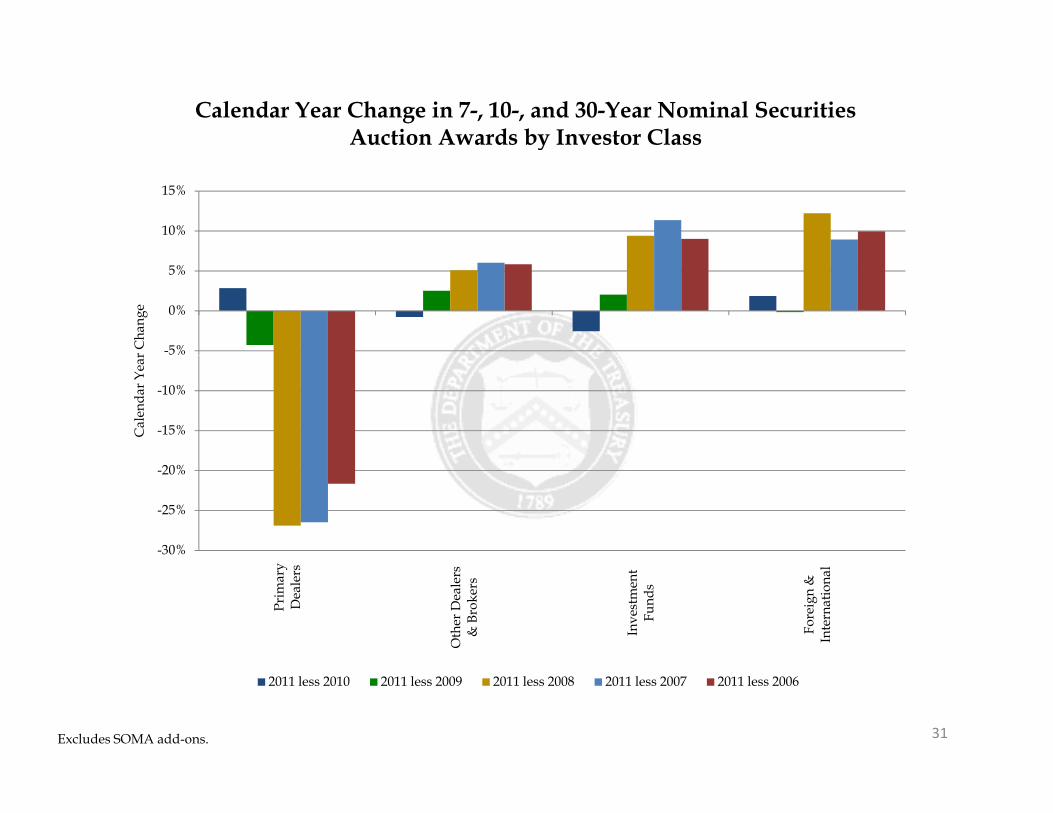
Calendar Year Change in 7-, 10-, and 30-Year Nominal Securities Auction Awards by Investor Class
10%
15%
y
-5%
0%
5%
r Cha
nge
-15%
-10%
Cal
enda
r Yea
r
-30%
-25%
-20%
Pr
imar
y D
eale
rs
Oth
er D
eale
rs&
Bro
kers
Inve
stm
ent
Fund
s
Fore
ign
&
Inte
rnat
iona
l
31
2011 less 2010 2011 less 2009 2011 less 2008 2011 less 2007 2011 less 2006
Excludes SOMA add-ons.

Investor Class Auction Awards: TIPSCalendar Year 2011
Foreign &
Other1.4%
Foreign & International
13.0%
Primary Dealers47.1%
Investment Funds 35.8%
32
Other Dealers & Brokers
2.7%
Excludes SOMA add-ons. “Other” includes categories that are each less than 2%, which include Depository Institutions, Individuals, Pension and Insurance.

Calendar Year Change in TIPS Auction Awards by Investor Class
10%
15%
5%
ar C
hang
e
-5%
0%
Cal
enda
r Yea
-10%
-15%
Prim
ary
Dea
lers
Oth
er D
eale
rs&
Bro
kers
Inve
stm
ent
Fund
s
Fore
ign
&
Inte
rnat
iona
l
33
O I
2011 less 2010 2011 less 2009 2011 less 2008 2011 less 2007 2011 less 2006
Excludes SOMA add-ons.

Foreign Awards of Treasuries at Auction, $ Billion
160
180
200
120
140
160
war
d ($
bn)
80
100
onth
ly P
riva
te A
w
40
60Mo
0
20
Jun-
09
Sep-
09
Dec
-09
Mar
-10
Jun-
10
Sep-
10
Dec
-10
Mar
-11
Jun-
11
Sep-
11
Dec
-11
34Foreign includes both private sector and official institutions.
J S D M J S D M J S D
Bills 2/3/5 7/10/30 TIPS
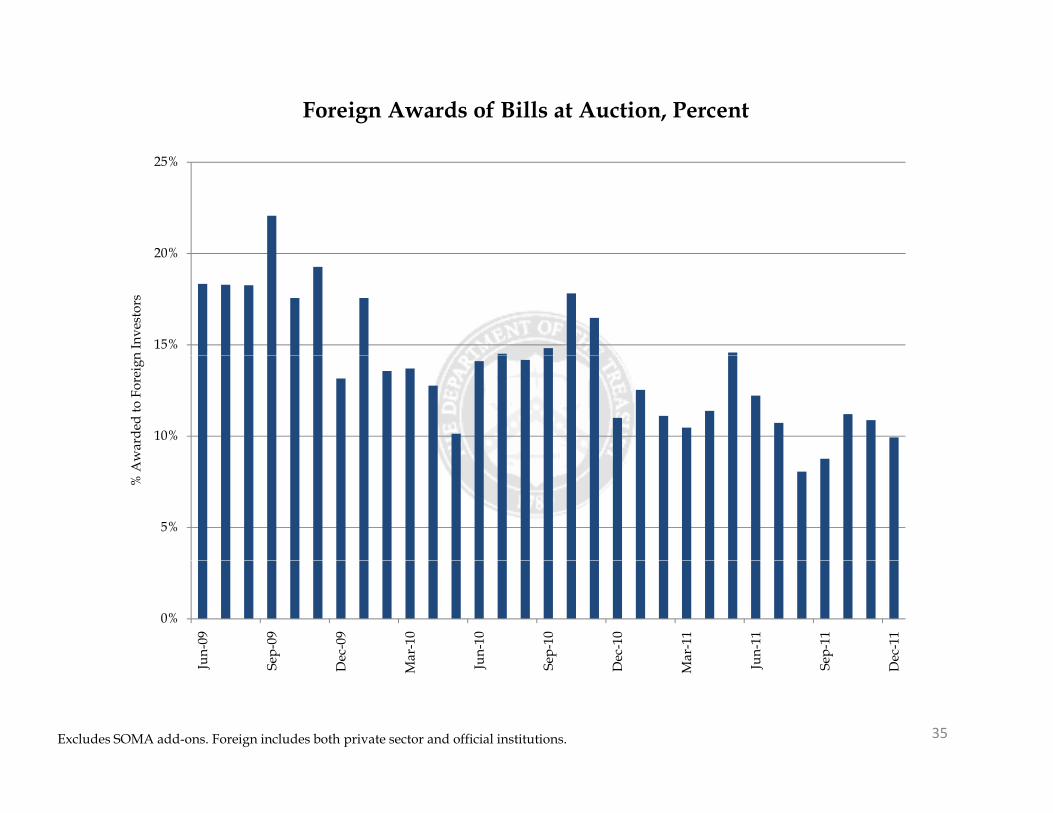
Foreign Awards of Bills at Auction, Percent
20%
25%
15%
20%
n In
vest
ors
10%
war
ded
to F
orei
gn
5%
% A
w
0%
un-0
9
ep-0
9
Dec
-09
Mar
-10
un-1
0
ep-1
0
Dec
-10
Mar
-11
un-1
1
ep-1
1
Dec
-11
35Excludes SOMA add-ons. Foreign includes both private sector and official institutions.
Ju S D M Ju S D M Ju S D

Foreign Awards of Nominal Coupons at Auction, Percent
40%
45%
50%
30%
35%
40%
n In
vest
ors
20%
25%
war
ded
to F
orei
gn
10%
15%% A
w
0%
5%
un-0
9
ep-0
9
ec-0
9
ar-1
0
un-1
0
ep-1
0
ec-1
0
ar-1
1
un-1
1
ep-1
1
ec-1
1
36Excludes SOMA add-ons. Foreign includes both private sector and official institutions.
Ju Se De
Ma Ju Se De
Ma Ju Se De
2/3/5 7/10/30

Foreign Awards of TIPS at Auction, Percent
20%
25%
15%
20%
n In
vest
ors
10%
war
ded
to F
orei
gn
5%
% A
0%
Jun-
09
Sep-
09
Dec
-09
Mar
-10
Jun-
10
Sep-
10
Dec
-10
Mar
-11
Jun-
11
Sep-
11
Dec
-11
37Excludes SOMA add-ons. Foreign includes both private sector and official institutions.
J S D M J S D M J S D
5-Year 10-Year 20-Year 30-Year

Primary Dealer Awards at Auction, Percent
65%
70%d
55%
60%
Am
ount
Aw
arde
45%
50%
Tota
l Com
petit
ive
35%
40%
% o
f T
30%
Jun-
09
Sep-
09
Dec
-09
Mar
-10
Jun-
10
Sep-
10
Dec
-10
Mar
-11
Jun-
11
Sep-
11
Dec
-11
4/13/26-Week (13-week moving average) 52-Week (6-month moving average)
38
/ / ( g g ) ( g g )
2/3/5 (6-month moving average) 7/10/30 (6-month moving average)
TIPS (6-month moving average)

U S T R E A S U R Y F L O A T I N G R A T E N O T E S
ST
RI
CT
LY
PR
IV
AT
EA
ND
CO
NF
ID
EN
TI
AL
February 2012

The demand backdrop 1
FRN issuance – motivation and estimated benefits 8
Choice of reference indices and sample structures 19
ES
1US
TR
EA
SU
RY
FL
OA
TI
NG
RA
TE
NO
T

The demand backdrop for US Treasuries – whether FRNs or fixed rate debt –
should benefit from a structural decline in the stock of high quality assets
Using market-based risk assessment provides
a useful view of the altered investment
environment
The stock of bonds issued by sovereigns
with 5Y CDS spreads below 100bp has
fallen sharply since 2007, excluding the
US (whose CDS spread is below 50bp)
In other words, US sovereign debt is now
Total debt outstanding for G-10 countries with 5Y CDSspreads less than 100bp, as of end-2007 and end-2011; USDbn
Total debt outstanding for G-10 countries with 5Y CDSspreads less than 100bp, as of end-2007 and end-2011; USDbn
8,000
10,000
12,000
14,000
16,000
18,000
20,000
United States
United Kingdom
Netherlands
Japan
Italy
Germanya higher fraction of the “higher quality”
sovereign debt universe, likely resulting
in a supportive demand backdrop for US
Treasuries
Note: Sweden and Switzerland were excluded due to lack of data. For end-2011, Canadadata is as of March 2011, and Japan data is as of September 2011. For Europeansovereigns, we assume that the amount of bills and non-domestic bonds outstanding isunchanged between 2007 and 2011.
-
2,000
4,000
6,000
8,000
End-2007 End-2011
Germany
France
Canada
Belgium
2TH
ED
EM
AN
DB
AC
KD
RO
P

Within the US fixed income markets, the share of Treasuries is growing while the
share of other high-quality assets is falling
Net issuance for various fixed income products by year ; $bnNet issuance for various fixed income products by year ; $bn
300
800
1300
1800
2300ABS Net of Fed Purchases
BABS
Agency MBS Net of Fed & TSYPurchases
AGY Net of Fed Purchases
Financial Corps (ex ABS)
3TH
ED
EM
AN
DB
AC
KD
RO
P
-1200
-700
-200
20
00
20
01
20
02
20
03
20
04
20
05
20
06
20
07
20
08
20
09
20
10
20
11
E
20
12
F
Financial Corps (ex ABS)
Non-Financial Corps
TSY Net of Fed Purchases/Sales
Net Fixed Income Supply ex Fed & TSYpurchases/sales

Will the Basel III LCR requirements trigger increased demand for US Treasuries
in general and FRNs in particular?
Market analysts estimated a Liquidity Coverage Ratio of 57% for 30 large bank holding
companies, resulting in a gross shortfall of about $500bn - $1Tn depending on mitigation
actions undertaken
While Treasury floaters would be attractive for LCR purposes, the net demand for FRNs
due to LCR provisions is likely to be modest
Treasury floaters are likely to yield less than liquid assets currently held by banks
(fixed rate Treasuries/Agencies/Agency MBS).
While Treasury floaters would be lower duration than current alternatives, many
banks are efficient duration hedgers and may be able to achieve higher returns net
of hedging cost using the current mix of assets
With the Fed currently paying banks 25bp on excess reserves, banks are likely
ignore Treasury floaters unless the yield at least matches IOER.
Also, certain regulatory capital implications of Basel III provisions related to AOCI could,
on the margin, incentivize banks to buy FRNs over fixed rate debt
However, this is one factor among several driving asset selection, and we expect the
net preference for FRNs over fixed rate debt to be rather modest
4TH
ED
EM
AN
DB
AC
KD
RO
P

Implementation of Dodd Frank’s central clearing provisions will also create some
modest net new demand for high quality collateral such as US Treasuries
Growth of value of total reported and estimated collateral,2000-2010; $bnGrowth of value of total reported and estimated collateral,2000-2010; $bn
About 82% of gross credit exposure appears
collateralized already—full implementation of Dodd-
Frank could cause demand for collateral to rise by
about $650bn
However, this does not directly translate into increased
demand for Treasuries—the ISDA margin survey also
indicates that Treasuries and Agencies make up only
about 6% of collateral, which is predominantly
composed of cash
Thus, the incremental demand for USTs due to
increased collateral requirements stemming from the
implementation of Dodd-Frank’s central clearing491707
854 922 924
1470
2649
21501984
437
719
10171209
1329 1335
2126
3957
31512934
1000
2000
3000
4000
Reported Estimated
implementation of Dodd-Frank’s central clearing
provisions could turn out to be modest.
Caveat – it is possible that the move to hold
collateral in custodial accounts rather than on a
bilateral basis could lower returns on cash and
alter the fraction of USTs in the mix. An increase
in this fraction could result in considerable
demand for USTs
In addition, the fraction of cash relative to overall
collateral could decline as short-term rates rise,
leading to higher fractions of other assets such
as USTs
Here again, any such incremental demand will
not discriminate between FRNs and fixed-rate
securities
Source: ISDA Margin Survey 2011
Value of collateral received and delivered by respondents,$mnValue of collateral received and delivered by respondents,$mn
Collateral
received Percent
Collateral
delivered Percent
Cash 877,552 81% 715,444 80%
Government securities 106,697 10% 154,821 17%
US 38,606 4% 48,409 5%
EU 22,943 2% 66,705 7%
UK 10,948 1% 13,414 1%
Japan 21,005 2% 17,438 2%
Other 13,196 1% 8,854 1%
Others 100,699 9% 29,143 3%
Total collateral 1,084,949 899,408
138 145289
491200 250
437
01999 2000 2001 2002 2003 2004 2005 2006 2007 2008 2009 2010
5TH
ED
EM
AN
DB
AC
KD
RO
P

Money market investors have been increasing Treasury holdings recently thanks
to a plunge in supply ex-Treasuries …
Money fund AUM is modestly lower over the past four years, but money
market supply has shrunk by 18%
MMMF’s are significant holders of Treasury and Agency securities
MMMF’s hold about $400bn in Treasury and Agency securities each
for combined $800bn, representing about 1/3 of AUM
In addition, repo holdings backed by Treasury securities and Agency
securities (including Agency MBS) are approximately $150bn and
$250bn, respectively
Preference for T-bills and Agency discount notes, but funds do own
coupon securities including about $125bn in Agency FRNs with
maturities 2 years or less
There could be demand for Treasury floaters yielding more than T-
bills, but MMMF preference is likely under 2 year final maturity
Other significant money market investors not bound by rule 2a-7 may have
Estimate of MMMF Treasury and agency securitiesholdings, $bnEstimate of MMMF Treasury and agency securitiesholdings, $bn
Other significant money market investors not bound by rule 2a-7 may have
interest in Treasury floaters as a substitute for lower yielding bank deposits,
money market fund shares, fixed-rate Treasuries and agencies, or other
money market instruments.
Securities Lending operations of custodial banks. Historically
buyers of floating rate ABS, corporates and agencies with maturities
out to 3 years. Market analysts have estimated total investments by
these securities lenders exceed $1tn, of which floaters currently
account for about $200bn
State and local governments. Commonly invest operating and other
funds in Treasuries, Agencies and MMMF shares.
The mortgage GSEs. Actively invest excess cash by selling Fed
funds, investing in Treasuries and repo and time deposits with a
limited number of financial institutions. Treasury floaters with yields in
excess of the Fed funds rate could be attractive.
Corporate cash. The recent growth of US corporate cash balances
has led to growth in bank deposits, MMMF and other liquid investment
strategies. For many firms, Treasury floaters could be an easy to use
alternative to these investments.
2a-7 Taxable MMF AUM vs. Money Market Supply,$bn, cumulative since 2007 year-end2a-7 Taxable MMF AUM vs. Money Market Supply,$bn, cumulative since 2007 year-end
Source: iMoneyNet, Crane Data, J.P. MorganNote: Agency securities holdings includes discount notes and floating rate notes.
Source: iMoneyNet, J.P. Morgan, Bloomberg6T
HE
DE
MA
ND
BA
CK
DR
OP

Over the past 2 years, declining supply of T-Bills and Agency obligations have forced
short-term liquidity investors into credit products such as CP/CDs, and any new supply
would likely be well received
However, in the longer term, regulation of money-market funds could alter their appeal to
investors, subsequently altering their demand profile for any floating rate note issuance.
One offset – to the extent that money market regulation could cause assets to flow
into short-term bond funds, those funds could in turn emerge as a demand source for
FRNs
... but while this could be an initial tailwind, it is unlikely to be a long-term positive
for demand
FRNs
7TH
ED
EM
AN
DB
AC
KD
RO
P

FRN issuance – motivation and estimated benefits 8
The demand backdrop 1
Choice of reference indices and sample structures 19
ES
8US
TR
EA
SU
RY
FL
OA
TI
NG
RA
TE
NO
T

Treasury terms out debt in order to reduce debt rollovers as well as the uncertainty regarding future debt
service costs. Thus, extending the average maturity of outstanding Treasury debt is most beneficial when
current term rates are low and/or the risk of large future changes in Treasury rates are at risk to the upside.
Term Treasury yields are a composite of three things
Expectations of the future path of the Fed Funds rate
Sovereign credit spreads, and
Term premium
By replacing T-Bill issuance with nominal fixed rate Treasury issuance, the Treasury locks in:
Revisiting the case to term out debt maturities
IT
S
By replacing T-Bill issuance with nominal fixed rate Treasury issuance, the Treasury locks in:
The current path of the expected increase in Fed Funds (currently benign)
Current credit costs as reflected in the current sovereign CDS credit spread (currently low)
The current yield curve term premium (currently low)
9FR
NI
SS
UA
NC
E–
MO
TI
VA
TI
ON
AN
DE
ST
IM
AT
ED
BE
NE
F

FRNs can help reduce the debt roll-over burden, without paying the yield curveterm premium, but at the expense of retaining exposure to rising interest ratesand credit costs
By issuing FRNs with a term of (say) 2 years, Treasury can capture the low funding costs of T-bills,
while effectively terming out issuance and reducing roll-over requirements
As an example, monthly issuance of (say) $10bn of 2-year FRNs raises $240bn over two years,
and increases the rollover burden by $10bn/month once the auction cycle is fully phased in (i.e.,
after two years)
Issuing an equivalent $240bn of securities by increasing 3 and 6 month bill offerings could boost
the monthly roll-over requirement by $40-80bn.
However, by choosing to substitute T-Bill issuance with FRNs rather than with fixed rate debt of
similar maturity, the Treasury:IT
S
similar maturity, the Treasury:
Does not lock in a future path of short rates, and instead takes on that risk in exchange for
not paying the (usually positive) interest rate risk premium priced into the curve
It does lock in term funding, and thus takes advantage of its currently low sovereign CDS
spread.
However, it may retain exposure to a widening in its sovereign CDS spread if its floating debt
costs are indexed to some benchmark that is affected by it (e.g., T-bill yields)
10FR
NI
SS
UA
NC
E–
MO
TI
VA
TI
ON
AN
DE
ST
IM
AT
ED
BE
NE
F

The benefits of issuing Floating Rate Notes versus fixed-rate debt
Trailing hypothetical savings (relative to a 2Y fixed rate note)from issuing a 2Y FRN indexed to 6-month T-bill yields at a zerospread, versus the trailing change in the fed funds rate over the2-year period
Trailing hypothetical savings (relative to a 2Y fixed rate note)from issuing a 2Y FRN indexed to 6-month T-bill yields at a zerospread, versus the trailing change in the fed funds rate over the2-year period
Trailing hypothetical savings (relative to a 5Y fixed rate note)from issuing a 5Y FRN indexed to 6-month T-bill yields at a zerospread, versus the trailing change in the fed funds rate over the5-year period
Trailing hypothetical savings (relative to a 5Y fixed rate note)from issuing a 5Y FRN indexed to 6-month T-bill yields at a zerospread, versus the trailing change in the fed funds rate over the5-year period
-6
-4
-2
0
2
-0.5
0.0
0.5
1.0
1.5
2.0
2.5
3.0
Cha
nge
inF
edFu
nds
Rat
e(2
yr)
%S
avin
gsof
Issu
ing
FRN
2yr - 6mo 2yr Change in Fed Funds-6
-5
-4
-3
-2
-1
0
10.0
1.0
2.0
3.0
4.0
5.0
Cha
nge
inFe
dF
unds
Rat
e(5
yr)
%S
avin
gsof
Issu
ing
FR
N
5yr - 6mo
5yr Change in Fed Funds
IT
S
FRNs allow Treasury to term out its funding while lessening average funding costs in the long run
Given typically positive term premium in the yield curve, the realization of short rates over a fixed term
(say, 2- or 5-years) will on average be lower than the ex-ante term rate
Thus, issuing FRNs—assuming the issuance spread is not too high, and assuming that FRNs substitute
for fixed rate notes—can produce cost savings on average. This has historically been the case, as shown
in the charts above
Last, to the extent that UST FRNs draw in new incremental demand from investors who cannot hedge the
interest rate risk in fixed rate Treasuries, this should result in an aggregate benefit to Treasury
4
6-1.5
-1.0
-0.5
90 91 92 93 94 95 96 97 98 99 00 01 02 03 04 05 06 07 08 09
Cha
nge
inF
edFu
nds
Rat
e(2
yr)
%S
avin
gsof
Issu
ing
FRN
2
3
4-2.0
-1.0
90 91 92 93 94 95 96 97 98 99 00 01 02 03 04 05 06
Cha
nge
inFe
dF
unds
Rat
e(5
yr)
%S
avin
gsof
Issu
ing
FR
N
11FR
NI
SS
UA
NC
E–
MO
TI
VA
TI
ON
AN
DE
ST
IM
AT
ED
BE
NE
F

Savings depend less on the choice of the reference rate index, and more on the tenorof issuance that FRNs will replace - issuing FRNs instead of Bills will yield maturityextension benefits but not cost reduction
FRNs – whether indexed to bill yields or an overnight
index such as fed funds or GCF – would have
historically produced largely similar cost savings
Charts alongside show that the rolling differential
between GC/fed funds with respect to bills is stable
and relatively small. Thus, savings from issuing
FRNs might be expected to be less dependent on the
choice of index
Savings with respect to rolling bill issuance would
be expected to be negative; the price of terming out
3-month T-bill yield and ex-post 3-month average of GC index(GCFRTSY Index) versus cost/savings of floater3-month T-bill yield and ex-post 3-month average of GC index(GCFRTSY Index) versus cost/savings of floater
0
5
10
15
20
0.05
0.10
0.15
0.20
0.25 3M T-bill yield (%; left axis)
3M avg GC (%; left axis)
Differential (bp, right axis)
IT
S
be expected to be negative; the price of terming out
debt while still paying short term rates will be
reflected in the spread over bill yields that Treasury
will need to pay on an FRN, which is discussed later.3-month T-bill yield and ex-post 3-month average of effectiveFed funds (FEDL01 Index) versus cost/savings of floater3-month T-bill yield and ex-post 3-month average of effectiveFed funds (FEDL01 Index) versus cost/savings of floater
-50.00Oct 09 Feb 10 May 10 Aug 10 Dec 10 Mar 11 Jun 11 Sep 11
-5
0
5
10
15
0.00
0.05
0.10
0.15
0.20
Oct 09 Feb 10 May 10 Aug 10 Dec 10 Mar 11 Jun 11 Sep 11
3M T-bill yield (%; left axis)
3M avg FF (%; left axis)
Differential (bp, right axis)
12FR
NI
SS
UA
NC
E–
MO
TI
VA
TI
ON
AN
DE
ST
IM
AT
ED
BE
NE
F

Estimating the forward-looking benefits to Treasury from FRN issuance
Three factors determine the costs/savings of FRNs versus fixed-rate debt
The pricing spread – e.g., what fixed spread over (say) floating 3-month bill yields Treasury
pays to issue a par priced FRN
The level of interest rate risk premium at time of issuance
The Fed’s monetary policy stance—savings are likely to be greater when the change in the
funds rate is negative, and especially when such change is more negative than the
expectations priced into forwards
The first of these – pricing spreads – will likely not be onerous enough to materially reduce theIT
S
The first of these – pricing spreads – will likely not be onerous enough to materially reduce the
savings from issuing FRNs
Even if FRNS are initially less liquid, market participants will likely arbitrage away any
significant differences from the spread implied by fixed rate note asset swap levels, thanks
to a highly developed interest rate derivatives market
Experience in other fixed income product sectors that have fixed rate notes as well as
FRNs suggests that this is historically true
13FR
NI
SS
UA
NC
E–
MO
TI
VA
TI
ON
AN
DE
ST
IM
AT
ED
BE
NE
F
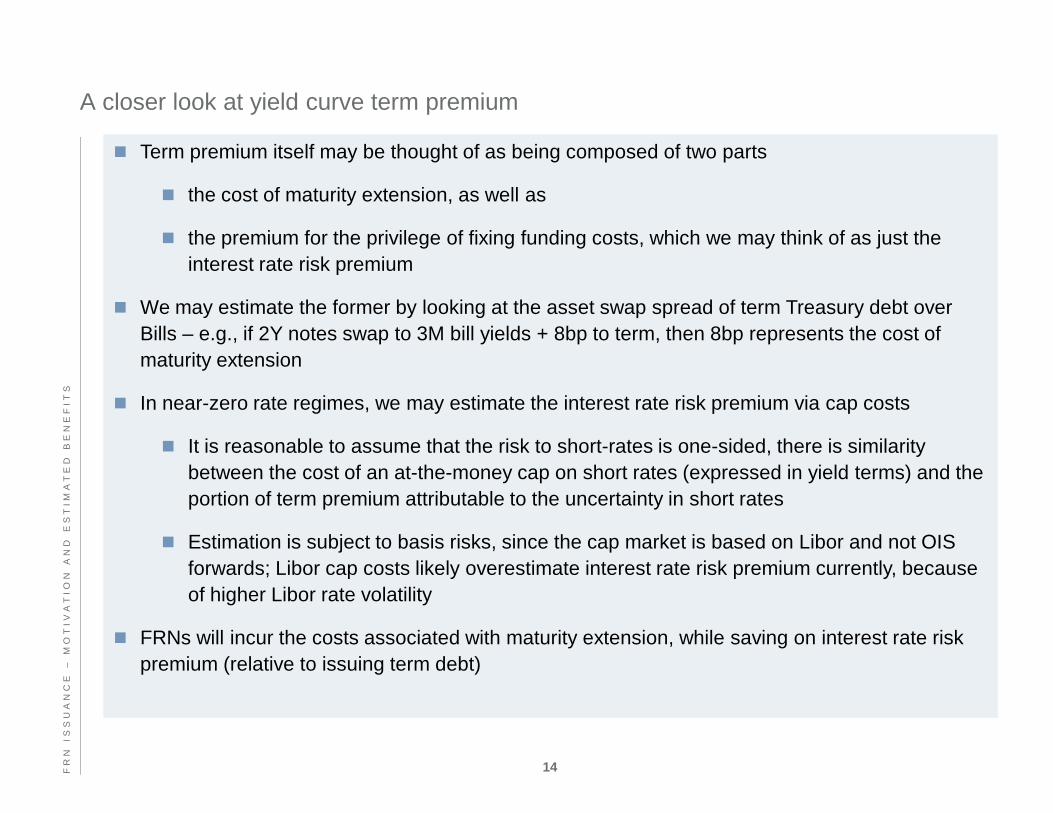
A closer look at yield curve term premium
Term premium itself may be thought of as being composed of two parts
the cost of maturity extension, as well as
the premium for the privilege of fixing funding costs, which we may think of as just the
interest rate risk premium
We may estimate the former by looking at the asset swap spread of term Treasury debt over
Bills – e.g., if 2Y notes swap to 3M bill yields + 8bp to term, then 8bp represents the cost of
maturity extension
In near-zero rate regimes, we may estimate the interest rate risk premium via cap costsIT
S
In near-zero rate regimes, we may estimate the interest rate risk premium via cap costs
It is reasonable to assume that the risk to short-rates is one-sided, there is similarity
between the cost of an at-the-money cap on short rates (expressed in yield terms) and the
portion of term premium attributable to the uncertainty in short rates
Estimation is subject to basis risks, since the cap market is based on Libor and not OIS
forwards; Libor cap costs likely overestimate interest rate risk premium currently, because
of higher Libor rate volatility
FRNs will incur the costs associated with maturity extension, while saving on interest rate risk
premium (relative to issuing term debt)
14FR
NI
SS
UA
NC
E–
MO
TI
VA
TI
ON
AN
DE
ST
IM
AT
ED
BE
NE
F

Is this the best time in the cycle for FRN issuance from Treasury’s perspective?
Estimated interest rate risk premium* by maturity; bp of yieldEstimated interest rate risk premium* by maturity; bp of yieldRolling 2-year savings from issuing a 2-year FRN linked to6-month T-bills relative to issuing fixed-rate notes versus 2Yinterest rate risk premium; bp of yield
Rolling 2-year savings from issuing a 2-year FRN linked to6-month T-bills relative to issuing fixed-rate notes versus 2Yinterest rate risk premium; bp of yield
20
30
40
50
60
70
80
90
100
1102Y3Y5Y
60
80
100
120
140
160
180
200
220
240Trailing cost savingsSavings attributable to term premium
IT
S
Current levels of interest rate risk premium are low, and the risk to the expected path of policy rates is likely asymmetrically
biased higher
The Fed’s commitment to low rates until late-2014, as well as its new communications policy of projecting a path for
the funds rate, have already lowered interest rate risk premium, and this is unlikely to rise for several years.
Given de minimis monetary policy rates currently, the next move by the Fed is only likely to take the funds rate higher
With interest rate risk premium currently near all time lows, savings are likely to be marginal
10
Jan 10 Jul 10 Jan 11 Jul 11 Jan 1220
40
Jul 10 Jan 11 Jul 11 Jan 12* Estimated as the cost of an at-the-money cap on short rates, in yield terms. This is premised on the notion that in near-zero policy rate regimes, the one-sided nature of policy raterisk makes interest rate risk premium comparable to cap costs.
15FR
NI
SS
UA
NC
E–
MO
TI
VA
TI
ON
AN
DE
ST
IM
AT
ED
BE
NE
F

What about the cost – where might Treasury FRNs price?
Estimated pricing spread on a hypothetical 2Y FRN linked to3M Treasury bills*; bpEstimated pricing spread on a hypothetical 2Y FRN linked to3M Treasury bills*; bp
Regardless of the choice of floating rate index used to
specify the coupons in any potential FRN issued by
Treasury, it is useful to consider the par priced FRN
spread-over-bills for purposes of analysis
I.e., if the basis swap market is used to transform
the FRN into a floater linked to bill yields, what
would the pricing spread be for a par priced FRN
at time of issuance
This represents the direct “cost” incurred by
Treasury, for the sole purpose of terming out its
debt0
5
10
15
20
25
Estimated pricing spread; bpAverage = 11.7
IT
S
It is reasonable to assume that this will not fall
below zero; should it do so, Treasury has a strong
incentive to issue FRNs in place of T-bills
The chart alongside shows the hypothetical pricing
spread, if FRNs were to price at the same asset swap
spread as a maturity matched fixed rate Treasury note.
This is a reasonable estimate of where FRNs might price
-5
0
Jul 10 Jan 11 Jul 11 Jan 12
* Assumes that FRNs will price at the same asset swap level as a maturitymatched bullet Treasury.
16FR
NI
SS
UA
NC
E–
MO
TI
VA
TI
ON
AN
DE
ST
IM
AT
ED
BE
NE
F

A stylized illustration of the relationship between pricing spreads and the
attractiveness to Treasury
A schematic illustration of the attractiveness of issuing FRNs from Treasury’s perspective, for various pricing spreads(versus a T-bill floating index)A schematic illustration of the attractiveness of issuing FRNs from Treasury’s perspective, for various pricing spreads(versus a T-bill floating index)
Not attractive
Attractive
FRNs deliver maturity extension at a higher
cost than term fixed-rate debt
FRNs still deliver savings from term premium
but give some of it back for the privilege of
Likely pricing
spread = bills +
maturity extension
premium
Bills + maturity
extension premium
+ interest rate risk
premium
IT
S
Very attractive
FRNs deliver maturity extension as well as
cost savings relative to term debt or rolling
bills
Bills + 0
but give some of it back for the privilege of
extension
premium
17FR
NI
SS
UA
NC
E–
MO
TI
VA
TI
ON
AN
DE
ST
IM
AT
ED
BE
NE
F
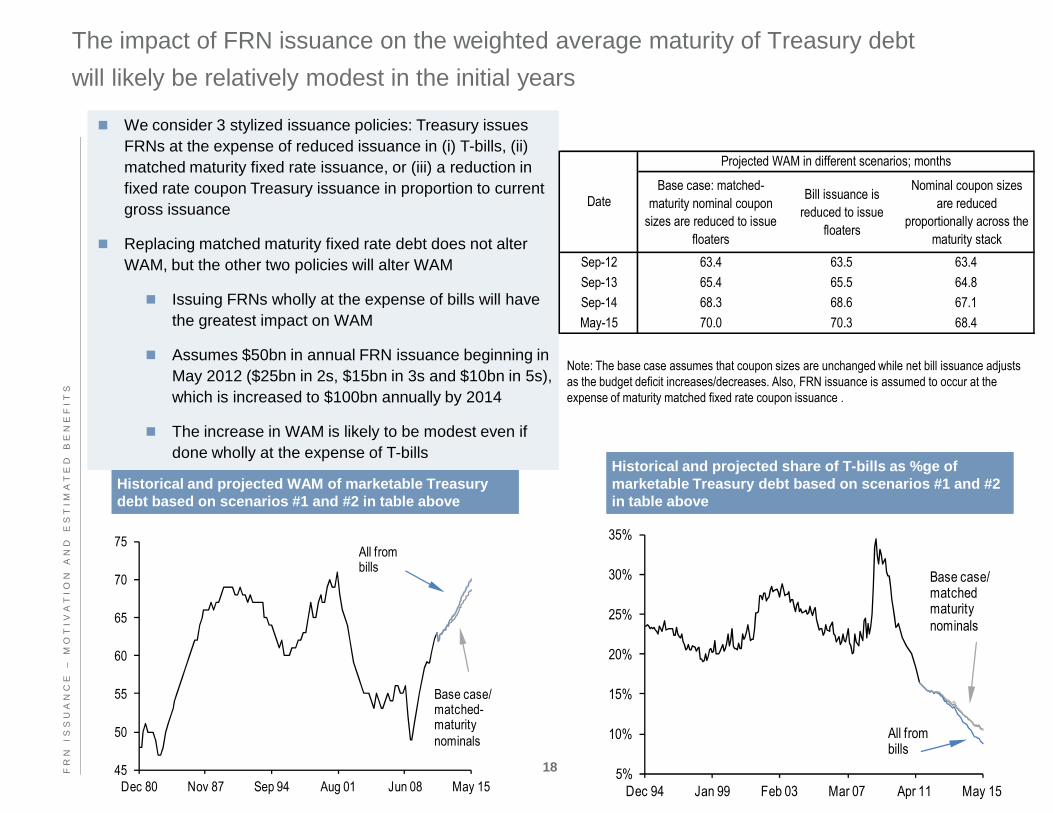
The impact of FRN issuance on the weighted average maturity of Treasury debt
will likely be relatively modest in the initial years
We consider 3 stylized issuance policies: Treasury issues
FRNs at the expense of reduced issuance in (i) T-bills, (ii)
matched maturity fixed rate issuance, or (iii) a reduction in
fixed rate coupon Treasury issuance in proportion to current
gross issuance
Replacing matched maturity fixed rate debt does not alter
WAM, but the other two policies will alter WAM
Issuing FRNs wholly at the expense of bills will have
the greatest impact on WAM
Assumes $50bn in annual FRN issuance beginning in
May 2012 ($25bn in 2s, $15bn in 3s and $10bn in 5s),
which is increased to $100bn annually by 2014
Base case: matched-
maturity nominal coupon
sizes are reduced to issue
floaters
Bill issuance is
reduced to issue
floaters
Nominal coupon sizes
are reduced
proportionally across the
maturity stack
Sep-12 63.4 63.5 63.4
Sep-13 65.4 65.5 64.8
Sep-14 68.3 68.6 67.1
May-15 70.0 70.3 68.4
Projected WAM in different scenarios; months
Date
Note: The base case assumes that coupon sizes are unchanged while net bill issuance adjustsas the budget deficit increases/decreases. Also, FRN issuance is assumed to occur at theexpense of maturity matched fixed rate coupon issuance .I
TS
Historical and projected WAM of marketable Treasurydebt based on scenarios #1 and #2 in table aboveHistorical and projected WAM of marketable Treasurydebt based on scenarios #1 and #2 in table above
45
50
55
60
65
70
75
Dec 80 Nov 87 Sep 94 Aug 01 Jun 08 May 15
Base case/matched-maturitynominals
All frombills
The increase in WAM is likely to be modest even if
done wholly at the expense of T-bills
5%
10%
15%
20%
25%
30%
35%
Dec 94 Jan 99 Feb 03 Mar 07 Apr 11 May 15
Base case/matchedmaturitynominals
All frombills
Historical and projected share of T-bills as %ge ofmarketable Treasury debt based on scenarios #1 and #2in table above
Historical and projected share of T-bills as %ge ofmarketable Treasury debt based on scenarios #1 and #2in table above
18FR
NI
SS
UA
NC
E–
MO
TI
VA
TI
ON
AN
DE
ST
IM
AT
ED
BE
NE
F

Choice of reference indices and sample structures 19
The demand backdrop 1
FRN issuance – motivation and estimated benefits 8
ES
19US
TR
EA
SU
RY
FL
OA
TI
NG
RA
TE
NO
T

The majority of the Agency floater market is linked to Libor or Fed funds
Distribution by originalmaturity (years)Distribution by originalmaturity (years)
About $153bn of Agency floaters are outstanding
currently, which is about 7.2% of the total Agency
debt market
Most of these structures reference Libor or Fed
funds as an index
Demand for floaters linked to Libor and FF
may be due in part to the deep and liquid
derivatives markets based on these
indices, allowing for efficient hedging of
risks
Distribution by underlyingbenchmark typeDistribution by underlyingbenchmark type
1M Libor 64.8%
FF Effective 25.9%
3M Libor 5.4%
Prime rate 2.8%
3M T-bill 0.7%
CPI 0.1%
Distribution by resetfrequencyDistribution by resetfrequency
Monthly 64.9%
Daily 28.6%
0-1 0.2%
1-2 16.7%
2-3 75.5%
3-4 4.9%
4-5 0.3%
5-6 1.5%
6-7 0.1%
7-8 0.0%
8-9 0.0%
10-11 0.1%
12-13 0.1%
15-16 0.4%TU
RE
S
risks
These indices have disadvantages too –
exposure to banking system credit risk (in
the case of Libor), and the Fed funds
effective rate is distorted by IOER and
related inefficiencies
Daily 28.6%
Quaterly 5.6%
Weekly 0.7%
Semi-annually 0.2%
15-16 0.4%
20-21 0.1%
>30 0.2%
FNMA, FHLMC and FHLB floaters outstanding; $bnFNMA, FHLMC and FHLB floaters outstanding; $bn
12598
123152
7045
137
318
267250
214
0
50
100
150
200
250
300
350
2001 2002 2003 2004 2005 2006 2007 2008 2009 2010 2011 20CH
OI
CE
OF
RE
FE
RE
NC
EI
ND
IC
ES
AN
DS
AM
PL
ES
TR
UC
T

The corporate floater market is also predominantly linked to Libor as an index rate
Distribution by originalmaturity (years)Distribution by originalmaturity (years)
Distribution by underlyingbenchmark typeDistribution by underlyingbenchmark type
Distribution by resetfrequencyDistribution by resetfrequency
0-1 3.42%
1-2 23.46%
2-3 34.89%
3-4 1.86%
4-5 13.76%
5-6 2.03%
6-7 5.24%
7-8 1.50%
8-9 0.28%
3M Libor 96.10%
1M Libor 3.38%
FF Effective 0.38%
6M Libor 0.09%
Prime Rate 0.04%
3M T-bill 0.01%
High grade corporate floaters outstanding*; $bnHigh grade corporate floaters outstanding*; $bn
256
444
509
392
267300
350
400
450
500
550
TU
RE
S
frequencyfrequency8-9 0.28%
9-10 12.02%
10-11 0.22%
11-12 0.24%
19-20 0.63%
12-13 0.03%
28-29 0.00%
29-30 0.32%
30-31 0.09%
Quarterly 96.13%
Monthly 3.39%
Daily 0.42%
Semi-annually 0.05%
Weekly 0.01%
* Includes only index-eligible floaters. (Floaters with <$300mn outstanding and less thanone year to maturity are excluded.)
256
212 216
200
250
2005 2006 2007 2008 2009 2010 2011
21CH
OI
CE
OF
RE
FE
RE
NC
EI
ND
IC
ES
AN
DS
AM
PL
ES
TR
UC
T

Possible Options for a Reference rate indexT
UR
ES
Index
Decrease
Treasury's
rollover risk
Diversify
Treasury's
funding
costs
Reduce
basis risk
in the
system
Already
used in
existing
markets
Will likely
appeal to retail
investors
Will likely
appeal to
money market
investors
Additional Notes
LIBOR yes partially yes yes yes yes
Provides for a variety of reset frequencies from overnight to 12-month.
More attractive to some investors as more closely linked to their
liabilities. Subject to banking system funding pressures. Diversification
benefits will be somewhat limited, since issues around sovereign credit
concerns would likely also result in higher LIBOR. Nonetheless, with
only 3 US banks in the USD Libor panel, some degree of
diversification is likely.
Typically indexed to weekly auction clearing rates. Treasury could
also explore daily resetting to secondary/ constant maturity T-bills data
released by the Fed, but this could reduce transparency. Would
enable frequent resets keeping price of floater close to par and thus
making it more attractive to investor types that value price stability such
22CH
OI
CE
OF
RE
FE
RE
NC
EI
ND
IC
ES
AN
DS
AM
PL
ES
TR
UC
T
T-bills yes no yes yes yes yes
making it more attractive to investor types that value price stability such
as money market funds. Will be of interest to investors who typically roll
T-bills. While this market exists, very small percentage of Agency and
Corporate FRNs are linked to T-bills (0.7% and 0.1% , respectively).
Changes in Bill auction schedule would result in changes in floaters in
which resets are linked to bill auctions. Not significantly different than T-
Bills, risking cannibalization of T-Bill demand.
Fed
funds eff.
rate
yes yes yes yes partially yes
Daily resets. Would enable daily resets keeping price of floater close to
par and thus making it more attractive to investor types that value price
stability such as money market funds. Predictably low in current rate
environment. Subject to changes in the Fed's monetary policy. Future
of Fed Funds market is uncertain, as future of GSEs and Fed chosen
policy tool is uncertain.
Fed
funds
target
yes yes no no yes yesA highly visible rate, but would will be hard to hedge given basis risk
with tradable markets.
GCF
repo rateyes no yes no partially yes
Could enhance Repo market itself. Could decrease demand for repo
product and indirectly for nominal Treasuries.

Comments on structural characteristics of FRNs
Issuance in the existing floater market has been concentrated in maturities 5-years and in. More than 92%
of the Agency market and 61% of the corporate floater market were issued with an original maturity of less
than 3-years.
Having a more frequent reset frequency will result in lower interest rate duration and thus lower price vol,
and could be more desirable to investors seeking stable value assets. Daily and Monthly resets are more
typical in Agency FRNs, while quarterly resets are more typical in Corporate FRNs
Treasury should floor coupons payments at zero
This does note necessarily mean a zero floor on observations of the floating index rate. For instance,
a note paying semiannual coupons, with daily accruals could result in negative observations on one or
more days between coupon payment dates. Only the ultimate coupon payment needs to be floored atTU
RE
S
more days between coupon payment dates. Only the ultimate coupon payment needs to be floored at
zero
23CH
OI
CE
OF
RE
FE
RE
NC
EI
ND
IC
ES
AN
DS
AM
PL
ES
TR
UC
T

Choice of index rate and final maturity could also be a determinant of incrementaldemand for the product
Depending on final maturity there could be significant demand
for a Treasury Floater Indexed to either overnight fed funds or
GC Repo, primarily from Money-market funds and liquidity
portfolios.
Demand for an FRN linked to either of these indices would
likely be driven by:
2a-7 Money Market Funds (if the contingent final
maturity is less than 397 days)
Corporate Treasury accounts not set-up to trade repo
Investment funds / Foreign accounts looking for a high
quality floating rate asset
1-week average of GCF Treasury index versus 1-weekaverage of par amount traded;
% $bn
1-week average of GCF Treasury index versus 1-weekaverage of par amount traded;
% $bn
50
100
150
200
250
0.00
0.05
0.10
0.15
0.20
0.25
0.30 Index level Par amount traded
TU
RE
S
quality floating rate asset
The basis between GCF and fed funds is small on a smoothed
basis, so returns on an FRN linked to either would likely be
similar
Both indices are amenable to daily resets, which would produce
very low interest rate duration risk (but not spread duration),
and thus lower price volatility. However, ratings agency
guidelines favor indices that are more than 95% correlated to
either fed funds or Libor, possibly making fed funds a better
choice
500.00
Nov
09
Feb
10
May
10
Aug
10
Nov
10
Feb
11
May
11
Aug
11
Nov
11
GC Index (GCFRTSY Index) versus effective Fed funds(FEDL01 Index); 1-week moving average; %GC Index (GCFRTSY Index) versus effective Fed funds(FEDL01 Index); 1-week moving average; %
0.00
0.05
0.10
0.15
0.20
0.25
0.30
Jul 10 Jan 11 Jul 11 Jan 12
GC indexFed funds
24CH
OI
CE
OF
RE
FE
RE
NC
EI
ND
IC
ES
AN
DS
AM
PL
ES
TR
UC
T

Description of a sample 2Y FRN linked to 6M T-bill yields
Characteristics
Maturity: 2-years
Coupon: Floating
Payment Frequency: Semi-
Annual
Reference Index: The average
auction yield of 6-mo T-bill
Auctions during reference period
Hypothetical annualized funding cost for a 2-year Treasury FRN linkedto 6-month T-bill yields versus actual 2-year Treasury yield; %Hypothetical annualized funding cost for a 2-year Treasury FRN linkedto 6-month T-bill yields versus actual 2-year Treasury yield; %
2
3
4
5
6Hypothetical annualized funding cost for 2Y FRN linked to 6M T-bills
2YTreasury yield
TU
RE
S
Day Count: Act / Act
0
1
Aug
01
Dec
01
Apr
02
Aug
02
Dec
02
Apr
03
Aug
03
Dec
03
Apr
04
Aug
04
Dec
04
Apr
05
Aug
05
Dec
05
Apr
06
Aug
06
Dec
06
Apr
07
Aug
07
Dec
07
Apr
08
Aug
08
Dec
08
Apr
09
Aug
09
Dec
09
25CH
OI
CE
OF
RE
FE
RE
NC
EI
ND
IC
ES
AN
DS
AM
PL
ES
TR
UC
T

Description of a sample 2Y FRN linked to the overnight fed funds and GCFrate indices
GC Index Floater Characteristics
Maturity: 2-years
Coupon: Floating
Payment Frequency: Semi-Annual
Reference Index: GCFRTSY <Index>
The Index is the weighted average interest paideach day on General US Treasury Collateral in thedealer to dealer repo market.
Average current daily volume is approximately$150bn.
Average Fed funds Floater Characteristics
Maturity: 2-years
Coupon: Floating
Payment Frequency: Semi-Annual
Reference Index: FEDL01 <Index>
The index represents the volume-weightedaverage of interest rates at which depositoryinstitutions lend balances at the Federal Reserve toother depository institutions overnight.
Day Count: Act / Act
TU
RE
S
$150bn.
Day Count: Act / Act
Day Count: Act / Act
26CH
OI
CE
OF
RE
FE
RE
NC
EI
ND
IC
ES
AN
DS
AM
PL
ES
TR
UC
T

Conclusions
The demand backdrop is currently favorable for US Treasuries, but it is prudent for Treasury to consider broadening its
issuance strategy to draw in more incremental demand
Floating Rate Notes issued by Treasury are one such avenue, and could be attractive to money funds, investors seeking bonds
with low duration risk, and possibly banks seeking to mitigate the accounting effects of some of the Basel III provisions
That said, any such incremental demand is likely to be modest in the near term
The current timing does not appear ideal, although initiating an issuance program now could allow Treasury to position itself to
capitalize on a more favorable market environment
Term premium in the yield curve is currently at all time lows, and the risk to the path of the funds rate is biased
asymmetrically towards higher rates since further Fed easing is not possible
However, initiating a program now could help position Treasury for a future environment marked by higher term premia
TU
RE
S
The choice of a floating rate index must balance the need for simplicity and transparency with the need to diversify Treasury’s
funding risk
Indexing to T-bills offers simplicity and transparency, but does not fully diversify funding cost risk
GCF offers the prospect of daily resets and very low duration risk, but is a more complex choice that is mostly unknown
to retail investors
Libor offers simplicity & transparency, but this index creates exposure to banking sector credit for Treasury
Indexing to average Fed funds rate offers simplicity and transparency, overnight reset frequency, and a viable
derivatives market for risk management. In addition, a reasonably well developed FRN market exists in other sectors. Its
appeal to retail investors needs to be further studied
27CH
OI
CE
OF
RE
FE
RE
NC
EI
ND
IC
ES
AN
DS
AM
PL
ES
TR
UC
T