off the beaten track - a mobile field study exploring the ... · recommender systems,...
TRANSCRIPT

Off the beaten track - a mobile field study exploring thelong tail of tourist recommendations
Nava TintarevUniversity of Aberdeen
Dept. of Computing [email protected]
Xavier AmatriainTelefónica Research
Ana FloresTelefónica Research
[email protected]@abdn.ac.uk
ABSTRACTThis paper presents a field study of a framework for per-sonalized mobile recommendations in the tourism domain,of sight-seeing Points of Interest (POI). We evaluate theeffectiveness, satisfaction and divergence from popularityof a knowledge-based personalization strategy comparing itto recommending most popular sites. We found that par-ticipants visited more of the recommended POIs for listswith popular but non-personalized recommendations. Incontrast, the personalized recommendations led participantsto visit more POIs overall and visit places “off the beatentrack”. The level of satisfaction between the two conditionswas comparable and high, suggesting that our participantswere just as happy with the rarer, “off the beaten track”recommendations and their overall experience. We concludethat personalized recommendations set tourists into a dis-covery mode with an increased chance for serendipitous find-ings, in particular for returning tourists.
Categories and Subject DescriptorsH.5.2 [User Interfaces]: User-centered Design
General TermsExperimentation, Design, Human Factors
KeywordsRecommender systems, user-centered design, field studies,mobile applications
1. INTRODUCTIONRecommender systems have been used in a number of do-
mains to help users find items that are relevant to them, in-cluding books [14], movies [30], museum exhibits [15], news[22] as well as holiday destinations [24]. Recommender sys-tems have the dual goals of improving user satisfaction withthe items they consume while also increasing benefits to thecatalog holder, or supplier of the items. To accomplish both,it is important to promote the exploration of “rare” (lesswell-known) items usually referred to as the long tail [12].This paper explores how personalization can help improvetourist recommendations on mobile devices by promotingthe long tail of tourist sites.
Copyright is held by the author/owner(s).MobileHCI 2010 September 7-10, 2010, Lisboa, Portugal.ACM 978-1-60558-835-3.
One of the challenges with the travel domain, is that com-mon approaches using collaborative filtering techniques (orhybrids thereof) do not work particularly well: collabora-tive filtering techniques work best when there is a large usercommunity, and many ratings for each user [20]. In contrast,travel activities are much less frequent than consumption inother domains such as books, movies and music. Anotherchallenge, is the complexity of travel objects: we cannotsimplify two trips to the extent that we can say that twotravelers experienced the same trip despite certain similar-ities such as the destination. Also, if one simplifies traveldescription features like the destination, then this also dam-ages the predictive ability of the recommender engine: al-ready visited destinations do not offer sufficient informationto predict the next destination.
Many previous approaches for travel recommendation havebeen on the level of destinations, or packages (e.g. hotel,flight and ski-pass). Others have been very knowledge in-tense. We consider to what extent recommendations can beused to personalize travel recommendation at the level ofPoints of Interest (POI) to recommend sights at a given lo-cation. We use a knowledge-based approach that leveragesthe existing knowledge on Wikipedia. The approach is gen-eralizable and scalable, and requires very little input fromthe users to form the personalization.
Recommendations are also available from written travelguides and tourist offices. However, these often recommendpopular or common sights to visitors with limited time togo sight-seeing. This means that the majority of travelersvisit the same sights over and over again. In most casesthese sights are worth visiting, but there is also no consid-eration for a given user’s particular taste. In this sense, themore rare, “off the beaten track” items get neglected andmay never be recommended to anyone. A more completerecommender system should be able to have a higher cover-age, and be able to cater to a variety of tastes.
Many studies discuss the hypothetical utility of recom-mendations, but very few measure their true utility. In thisstudy we measure the actual effectiveness of the recommen-dations. We study whether the recommendations are fol-lowed in a mobile field study and how satisfied users are withthe places they visit. Although the sample size is small, thisis to the best of our knowledge the largest such field studyevaluating recommendations to date. We now reiterate ourresearch questions:
1. Does personalization lead participants to see more“rare”points of interest?
2. Do participants visit more of the points of interests
when their recommendations are personalized?
3. Are our participants more satisfied with the personal-ized lists?
This paper is structured as follows, first we introduce relatedwork and our contribution in Section 2. Next, we go on givean overview of the system in which the recommendationswere applied in Section 3. After this we look at the experi-ment where we evaluated the recommendations (Section 4)and the results of the evaluation (Section 5), followed by dis-cussion and lessons learned (Section 6). Finally we concludewith our plans for future work in Section 7.
2. RELATED WORKCurrent web-based tourist recommendations have differ-
ent levels of granularity in the items they recommend. Whilethe travel recommender system described by Waszkiewiczet al. [29] and TripSay [7] only focus on destinations (e.g.Moscow), systems such as the one described by McSherry[24], and Triplehop’s TripMatcher [5, 19] recommend a com-plex vacation package including e.g. accommodation andski-passes. What is lacking in these systems, though, is auser-specific trip consisting of (among other things) sightsfor this user to visit.
In this category, there are a number of systems which rec-ommend, or at least present, a selection of POIs to visit insitu. The Cyberguide system, for instance, displays POIson a map and offers context and location-aware specific in-formation about nearby POIs [11]. Nevertheless, the systemdoes not offer personalized recommendations.
Systems that recommend mobile tourist sights appear torequire a great deal of knowledge elicitation for the domain.It takes a significant amount of effort to construct a completeontology such as the one presented by Ardissono et al. [13].However, this effort might result in reusable user models thatmay be extensible to other cities. Unfortunately, this modelis not publicly available. In the COMPASS tourist applica-tion, the authors note that the general WASP platform canbe augmented by domain specific prediction strategies [27].They do not go into details of how to make the predictionsfor points of interest. The two latter approaches are flexible,neither offers replicable, low cost, and general approach forrecommending for example sights in a city. However, thisapplication was location-aware.
Similarly, while there are a number of ontologies for travel[6], and general POIs (including sights but also venues, ho-tels and restaurants) [16], none of them is applicable forclassifying sight-seeing POI.
In addition, recent advances in technology now allow re-searchers to study factors that were previously not a possi-bility. There has been a move towards mobile field studies,considering how users behave “in the wild” [3, 18, 26]. In ourstudy, participants are tourists who are able to learn aboutthe POIs they are visiting using a mobile travel application,and we study their behavior during their touristic visit.
Another contribution of this work is to measure the ef-fectiveness of recommendation: not only how many POIparticipants visited, but also how this relates to their self-reported preferences. Most studies of recommender systems,regardless of the domain discuss the hypothetical utility ofrecommendations, but few measure their true utility. It hasbeen found that including a recommender system for video
on demand increasing the number of viewers, and that thisnumber increased with the course of time [25]. Similarly,[21] report that the number of viewed and sold items (mobilegames) increased during the usage of recommendations.
3. OVERVIEW OF THE CONSUMER SO-CIAL GROUP TOOL
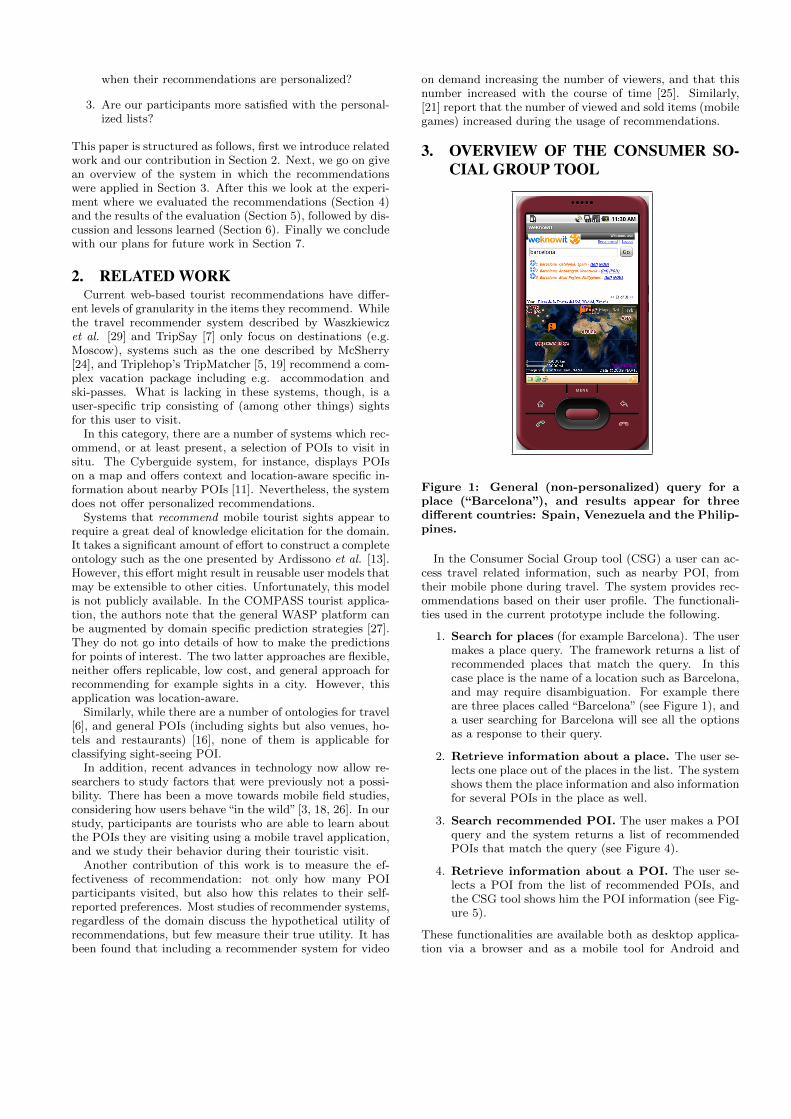
Figure 1: General (non-personalized) query for aplace (“Barcelona”), and results appear for threedifferent countries: Spain, Venezuela and the Philip-pines.
In the Consumer Social Group tool (CSG) a user can ac-cess travel related information, such as nearby POI, fromtheir mobile phone during travel. The system provides rec-ommendations based on their user profile. The functionali-ties used in the current prototype include the following.
1. Search for places (for example Barcelona). The usermakes a place query. The framework returns a list ofrecommended places that match the query. In thiscase place is the name of a location such as Barcelona,and may require disambiguation. For example thereare three places called “Barcelona” (see Figure 1), anda user searching for Barcelona will see all the optionsas a response to their query.
2. Retrieve information about a place. The user se-lects one place out of the places in the list. The systemshows them the place information and also informationfor several POIs in the place as well.
3. Search recommended POI. The user makes a POIquery and the system returns a list of recommendedPOIs that match the query (see Figure 4).
4. Retrieve information about a POI. The user se-lects a POI from the list of recommended POIs, andthe CSG tool shows him the POI information (see Fig-ure 5).
These functionalities are available both as desktop applica-tion via a browser and as a mobile tool for Android and

Figure 2: The architecture of the CSG mobile application
iPhone OS. We describe the mobile application in the fol-lowing section.
3.1 CSG Mobile Tool
Figure 3: The CSG mobile application being usedin Madrid, Spain
The mobile tool is a web-based adaption of the desktopCSG tool described in Section 3 and was developed for bothAndroid and iPhone OS. It also includes other additionaland different functionalities which take advantage of theknowledge of GPS position of the user to improve the systemperformance, and its usability. In particular, the mobile ap-plication allows the user to navigate the city while learningabout POIs in situ.
Figure 2 shows the architecture of the application. Whenusers log into the application, the mobile CSG applicationsets the user’s current location as their starting point. Toget the GPS location of the users, we have developed the in-terfaces for two platforms: one for iPhone OS and the otherone for Android. The iPhone interface consists of a webinterface uses an implementation of the Geolocation API(defined by W3C [8]), which is supported by version 4 of theSafari browser. For Android, we developed a Java native in-terface based on the WebChromeClient class of the AndroidAPI v1.5 [1] that makes use of the object LocationManagerto get user’s position. The Android native interface, and theweb interface communicate via a JavaScript channel. Theweb interface is shared for both platforms, and is in chargeof the communication with the web server to deploy the mo-bile CSG functionality.
When the system has the user position, it is also auto-matically and periodically processed by the system. TheGPS location of users allow the mobile application to showthe physical address corresponding to the GPS coordinatesof the user, using the GClientGeocoder API for the reversetranslation [2].
The users can also use the mobile application to find outmore about POIs in the city, or request recommendations.When a user want to get his recommendations, they logonto the mobile CSG application, and press the link “rec-ommend” on the homepage. Once users click on the link,the web interface makes a request using Ajax and REST toa recommendation service deployed on the web server. Therecommendation service which retrieves the information ap-plied for, returns an XML file with the POIS recommendedand with an ordered list of exactly five POIs with scores inthe range from 0-1, which are converted into a number of

stars from 1 to 5 in increments of 0.2. An example snippetof such an XML file is given below.
XML 1 A portion of an XML file for the city of Barcelona.
<place>
<id>20</id>
<woeid>753692</woeid>
<wikipediaid>4443</wikipediaid>
<name>Barcelona, Catalonia, Spain, Catalonia</name>
<wikipediatitle>Barcelona</wikipediatitle>
<longitude>2.170050</longitude>
<latitude>41.385719</latitude>
</place>
<pois>
<poi>
<id>2405</id>
<woeid>-1</woeid>
<wikipediaid>59545</wikipediaid>
<name>Sagrada Famılia</name>
<wikipediatitle>Sagrada Famılia</wikipediatitle>
<longitude>2.17444</longitude>
<latitude>41.4036</latitude>
<score>1</score>
<rank>1</rank>
</poi>
...
</pois>
Finally, the recommended POIs are shown on the CSGmobile application as a list with the number of stars signi-fying the strength of the recommendation, as well as on amap so that the users can see their location relative to otherPOI (see also Figure 4). The scoring of POIs is described inSection 4.3, and was generated with the help of a call to anonline service [10].
4. EXPERIMENTAL SETUPThe goal of this experiment was to see the effect of per-
sonalization on the behavior of participants. We wanted toknow what kind of POI participants ended up seeing, if theywere happy with their recommendations and which placesthey actually ended up visiting. In addition, we were in-terested in an investigation of the comments and behaviorsthat would arise in this type of field study.
4.1 MaterialsNine of the participants were supplied with HTC Android
phones, and seven with iPhones on which they ran the CSGmobile tool. All phones had SIM cards with unlimited dataplans so that they could freely use the browser to view theCSG tool. Two participants completed the experiment withpaper lists of their recommendations, and regular maps, asthere were an insufficient number of phones available. Theyhad access the CSG tool prior to the study (as did the otherparticipants) and conducted the experiment identically inother regards. We ensured that the mobile phones werestarted up and the batteries fully charged before the partic-ipants set out.
Figure 4: The top five recommendations for a givenuser in Barcelona, Spain, and displays their relativeposition on a map.
Figure 5: More information about a particular POI,in this case Casa Batllo, and the user’s location rel-ative to the POI.

4.2 ParticipantsOur participants were 21 members in a joint research
project, and participated as an extension to a common meet-ing. The participants represented 8 countries: Austria, U.K.,Cyprus, Czech Republic, Germany, Greece, Mexico, andPoland. Out of these participants 20 were male and 1 fe-male, with an average age of 31.86 (StD=5.52).
We also surveyed the travel habits of our participants whostated the following reasons for traveling in the past: 28.6%mostly for work or business; 14.3% mostly for tourism orsightseeing; 57.1% a mix of work/business and tourism/sight-seeing in equal measure, but on different trips (none of theparticipants specified that they travel for other reasons, orthat they do not travel that much). The number of inter-national trips made by the participants varied from 1 to 20trips with a mean of 6.00 (StD=4.23).
Thirteen participants had been to Barcelona before, eighthad not. This was reflected in the amount of knowledge theparticipants had about the city (9.5% said they knew abso-lutely nothing about the city; 33.3% said they had heard orread about some of the noteworthy sights; 5.3% said theyhad heard or read about many of them; 38.1 % said they hadvisited some; and 14.3% said that they had visited many ofthe sights. Given the bias in this sample we tried to allocatedparticipants who had been to the city previously equally be-tween the two conditions described below (see also Section6.1).
Participants were aware of the initial questionnaire, theyhad also completed parallel data collection tasks. They werewere not given access to any further detailed information onthe personalization or experimental design. For examplenone of the participants knew if they were viewing the per-sonalized or popularity list, or that there were two conditionsthat differed in this sense.
4.3 Generating POI RecommendationsLists were either personalized or based on popularity, but
both consisted of precisely five POIs given the limited timeavailable for sightseeing. Both lists were based on the 273POIs available for the city of Barcelona on Wikipedia [9].We describe how the lists were constructed in the followingsections.
4.3.1 Recommending PopularityThe “popularity” lists were all consisted of the same top
five POIs. The ranking of these lists are based on facetsas described in [28]. Facets are aspects or characteristics ofPOIs that were extracted by analyzing the relationships be-tween two objects. When analyzing the relationship betweentwo objects in Wikipedia, the authors define the source asthe object to which the facet or feature belongs to, and thetarget as the object that represents the facet, and the typeof facet relation. For example, given the objects “Banga-lore India” and “Cubbon park”, the latter becomes a facet ofthe former, and the facet type is set to “subsumes”. Follow-ing this, facets were ranked for each POI. Ranking of facetsis based on the statistical analysis of query terms (a) andquery sessions (b) that are derived from image search logs.In addition, the tags (c) associated with the public photos inFlickr are used to complement the knowledge derived fromthe search logs. An aggregate ranking is derived based ona linear combination of the three sources (a,b and c). Moreinformation about ranking of facets can be found in [28].
4.3.2 Getting PersonalThe personalized lists were based mainly on replies of a
questionnaire. We asked participants for their gender, ageand nationality. We also inquired how many internationaltrips they have taken in the past year and whether theytraveled more for business or for pleasure. In addition, weasked them about their previous experience and knowledgeabout the city of Barcelona. Finally, we asked participantsto enter at least five keywords that best described what kindof sights they would like to see in the city. The input to thisquestion was the main basis of the personalization, and waspresented as a textbox with an auto-complete function. Oneexample set of such keywords entered by a participant was“museums, cathedrals, parks, gaudı, monuments”.
The words that existed as auto-complete options were ob-tained as follows. First, we got the full list of POIs fromthe CSG tool (to make sure that the personalized lists arebased on the same source as the popularity lists), and theWikipedia categories for these POIs. Next, we removed allPOIs containing the word metro because there are a largenumber of metro stations in Barcelona marked as POIs.While many of the metro stops are named after local land-marks, there is virtually no sightseeing value to any of themunless the tourist is particularly interested in transport sys-tems. Similarly, we considered removing train stations fromthis list, but recognized that these often have architectureand historical value in and of themselves. Neighborhoods ofthe city were kept because these would be more difficult toextract automatically. We tokenized the full list into singlewords, and identified unique tokens. We also ensured thatcommon stop-words such as“in”and“the”were not added tothis list. We did not perform any stemming or other naturallanguage processing.
POIs were then ranked according to the cosine similaritybetween a user’s keyword vector, and the keywords associ-ated to each POI. In some cases ties would arise. For ex-ample, several items may similar to each other in terms ofkeywords, such as several art museums when the user hasincluded the tags “art” and “museum”. These types of tieswere resolved by considering the facet ranking of these items:the score associated to the POI was slightly incremented bythe values derived from the popularity score.
In summary, we used a knowledge-based approach thatleverages existing knowledge on Wikipedia. As such, thepersonalization does not require additional knowledge elici-tation. The approach used here is generalizable and scalable,to the extent that the POIs are already identified and thereare correct Wikipedia categories available for these POIs. Inaddition, the approaches requires very little input from theusers to form the personalization - they only need to inputfive keywords. However, we note that the personalizationis not meant to be the main contribution of the paper, andare well aware that using hybrid approaches may give addi-tional benefits such as increased serendipity or the ability toimprove recommendations over time.
4.4 The “Grand Travel Challenge” Field StudyBefore starting the “Grand Travel Challenge” participants
received a list of recommended points of interest. For halfof these participants, the list was personalized, and for theother half it was not. All lists were static, i.e. the itemson each list remained the same during the full course of thetrip. In a pre-questionnaire all participants were asked to

Personalized PopularTotal number of POI vis-ited
5.33 (1.67) 4 (1.41)
Number recommenda-tions visited
2.08 (1.24) 2.78 (1.56)
Table 1: Number of POI and recommendations vis-ited. Reporting the average (StD) per list, in eachcondition
specify if they had visited any of the POIs previously, andto say how much they think they would like each POI on ascale from 1 to 7 (1=not at all, 7=a lot). They were askedto rank the list as a whole (to consider intra-list factors suchas diversity) (1=horrible, 7=great). They were also encour-aged to elaborate on what they thought of the list and why.
Start and end location were identical for all of the par-ticipants, and these were clearly specified well in advanceas well as reiterated on the day of the Challenge. Partici-pants were told that they were allowed to travel freely forfive hours using a mobile phone. They were also told thatthey were not required to see any particular number of POI.Each participant was explicitly told that these were onlyrecommendations and that they were free to visit whicheverplaces they wanted during this time. In addition, they wereinstructed to travel alone. To increase the likelihood of in-dividual travel participants were dispersed from a centralstarting location at three minute intervals. To their aid,each participant was given a “survival pack” containing amobile phone, a map, a metro card, and some smaller itemssuch as a bottle of water.
To ensure that participants were actively sight-seeing theywere asked to take photos near the landmarks that they vis-ited, and at least one photo at each sight. The instructionswere not to necessarily take the aesthetically appealing, ormost representative of the location, but the most interest-ing.
Participants were asked to present their photos with astory for the actual “Challenge” that took place in the after-noon of the same day. Participants voted for the best photowith one vote per participant, and the winner received aprize.
Finally, post-questionnaires were collect to analyze the ef-fectiveness of, and satisfaction with the recommended POIs.In the post-questionnaire we asked participants to tell uswhich of the recommended POIs they had visited, and howmuch they had enjoyed their visit to each of them. We alsoasked them to list POIs they had visited that were not inthe list. As before, participants were able to rate the overalllist, and elaborate on the reasons behind their ratings.
5. RESULTSIn this section, we report on the different results gathered
from both pre- and post-questionnaires. Given the smallsample sizes we have elected not to conduct any statisticaltests to compare differences between conditions. While it isarguable that non-parametric tests might be used for smallersamples, we believe it prudent to report our results as trends.
5.1 EffectivenessOne of the things we wanted to know was whether the
recommendations were truly effective, i.e. were the recom-
Personalized PopularNumber of popularsights recommended
0.42 (0.51) 5 (0.00)
Number of popularsights visited
1.25 (0.87) 2.78 (1.56)
Popularity score 0.14 (0.23) 0.39 (0.32)
Table 2: Popularity of POIs. Reporting the average(StD) per list, in each condition
Personalized PopularNumber of POI visitedpreviously
0.67 (0.98) 2.33 (2.24)
Novelty for participantsthat have been to thecity previously
0.91 (0.13) 0.64 (0.41)
Table 3: Average novelty for visited POIs per par-ticipant, in each condition
mendations any good? Firstly, we wanted to know if thelists we gave to participants were too short or too long. Wesee in Table 1 that the average number of places visited perparticipant is close to the list size of five for both conditions.Participants on average had time to see five POI, but did notexceed this number greatly. We note however that partici-pants saw more sights overall in the personalized condition.
Given that participants were not bound to the recommen-dations and free to go wherever they pleased, we were alsocurious to see how many of the recommended POI were vis-ited. In the Table we see that the number of recommenda-tions that participants followed is larger for the popular rec-ommendations. This is contrary to our initial expectations,that participants who received personalized recommenda-tions would visit more of the recommended POIs than thosewho received popular recommendations. The discussions inSections 6.2 and 6.1 consider possible reasons for this find-ing.
5.2 PopularityWe saw that although the participants with personalized
lists did not follow all of the recommendations, they didgo see many POIs. The places that participants went to,include those discovered on their own, and were rarely oneof the “top five” recommendations. We were curious howmuch more the visited places were “off the beaten track”.Table 2 summarizes the results. The score of an item rangesfrom 0-1 (inclusive), and is based on a Yahoo! API service[10]. It is worth noting that the score drops very quicklywith only 118 out of 273 items having a non-zero score. Thefirst most popular POI has a score of 1, while the next itemalready drops to 0.52.
We saw that the participants in the popular conditionfollowed more of their recommendations, and that they hadbeen to more of their recommended POIs on a previous visitthan the participants who received personalized recommen-dations (Table 2). So, we wanted to find out if they justcame back to their favorite popular destinations, or if theydiscovered as many novel items as the participants in thepersonalized condition.
We define novelty as the number of new places a partic-ipant visited, over the total number of places visited. Here

Personalized Popular
User rating for visitedand recommended POI
5.00 (1.72) 5.88 (1.36)
User rating visited butnot recommended POI
5.97 (1.00) 6.00 (1.15)
User rating all visitedPOI
5.58 (1.40) 5.97 (1.29)
Mean satisfactionwith overall list (pre-questionnare)
4.25 (1.14) 5.44 (1.33)
Mean satisfactionwith overall list (post-questionnare)
4.42 (1.24) 5.11 (1.62)
Table 4: Satisfaction with the visited POI (after)the challenge, in each condition
Personalized PopularCumulative satisfac-tion
28.92(10.18) 22.33(9.99)
Table 5: Cumulative satisfaction is the sum of re-ported satisfaction on all visited POIs
by “new” we refer to locations participants has never seen inthe past (including recommendations, and self-discoveries).In Table 3 we see that personalized lists indeed led our re-turning tourists to visit more new places than the popularlists.
5.3 SatisfactionWith regard to satisfaction we consider a number of vari-
ations in Table 4. In the Table we see that for the POI thatare both recommended and visited, the average satisfactionis high. The score is slightly lower for the personalized con-dition, but is roughly and comparable between conditions.A similar result is found for POI that participants found ontheir own, as well as the mean satisfaction across all visitedPOI. That is, while people in the personalized condition areviewing more rare POIs, they are still generally happy withthe POIs they visited – and on average rate the recommen-dations as 5 or 6 on a 7 point scale (7 being = “I like it alot”). Interestingly, participants were even happier with thePOIs they discovered on their own in both conditions thanthe recommendation they received.
The score given to the list as a whole is a list-wide metric,and considers items that were not visited as well as addi-tional factors such as e.g. diversity. The overall list scoreis lower for the personalized condition, but the score for thepopular list decreases from the pre- to post-questionnaire.We discuss the change in satisfaction further in Sections 6.1and 6.3.
5.3.1 Cumulative SatisfactionSummary statistics included in Table 5.3 and discussed
above do not capture all possible interpretations of the over-all satisfaction of a tourist on a sightseeing tour. If a touristis on a sightseeing tour with limited time (e.g. one day), thenumber of places visited in that period might have a pos-itive impact on the overall travel experience, beyond whatthe average rating of all visited places is. In particular, notethat the average satisfaction that we report is penalizing ad-
Personalized PopularAverage ∆ 0.21 (1.89) 0.14 (1.39)Average |∆| 0.90 (1.04) 1.29(1.37)
Table 6: ∆ is the difference between the pre-rating(R1) and post-rating (R2): R1-R2. |∆| is the ab-solute value which shows the absolute value of thedifference.
venturous strategies in which you might need to visit severalbelow average POIs before discovering an excellent one.
We therefore define the Cumulative Satisfaction as thesum of the reported ratings for each individual POI visited.Results for both conditions are reported in Table 5. We seethat the value is higher for personalized recommendationsthan for popularity lists. We conclude that although averagesatisfaction might be lower in the personalized case, the factthat we are increasing the number of visited places mightresult in a higher satisfaction on the overall experience.
5.4 Change in opinion
Figure 6: Signed delta for the two conditions.
We also looked at the change in opinion for the items thatpeople had visited. That is, we looked at the difference be-tween the pre-rating (R1) and post-rating (R2): R1-R2 (seeTable 6. A positive value denotes an overestimation, anda negative value an underestimation. We found that thesigned average was similar for the two conditions, but thatthe absolute value was higher for the personalized condition.People get their estimations wrong more often with person-alized recommendations (high StD), but also that these es-timations can be be over and underestimations in similarmeasure (as these seem to cancel each other for the signeddifference).
In Figure 6, we analyze the details by looking at how thedifferences in pre-post opinions are distributed. We see thatvalues are much more spread for users with the personalizedlists. This means that users getting the popular recommen-dations were much more aware of what they would be seeingbefore actually visiting the POI. Of course this could have anegative interpretation if users with personalized lists werealways overestimating how much they would like a place.This is not the case, underestimations are around 40% inthe personalized condition vs. less than 30% in the non-personalized. On the negative side, though, extreme overes-timations of +4 are slightly larger in the personalized case.
We conclude that our personalized recommendations aregreatly increasing serendipity (i.e. chance of visiting a placethat we liked much more than we thought) at the risk ofslightly increasing the possibility of deceiving expectationsfor some recommendations.
6. DISCUSSIONIn this section we discuss our findings and propose expla-
nations for our results.
6.1 Post-hoc analysisAfter our initial analysis we found that the number of par-
ticipants that had been to the city previously was larger inthe personalized condition, as we can see in Table 7. We had

Personalized PopularBeen 8 5Not been 4 4
Table 7: Number of participants who had been tothe city of Barcelona in the two conditions
distributed participants who had been to the city previousequally between the two conditions initially. However, thisbalance was altered by the fact that a few of the intendedparticipants could not use their phones overseas or had notbrought phones to the study as requested. Naturally, thefact that the number of participants that had been to thecity before was unbalanced, could have effected the resultsreported in this paper. For this reason, we reran the anal-ysis looking only at participants who had been in the citybefore. The trends are in the same direction as before withthe following considerations.
The average number of recommended places visited isslightly lower for the popular lists than personalized whenwe are looking only at participants who have been in thecity before. It was higher when we looked at all the data.This suggests that participants do not go back to the pop-ular places again and again. Rather, the participants in thepopular condition that went to the popular places were theones that had not been to the city before. Similarly, theaverage number of popular places visited drops for partici-pants who received the popular list when the analysis onlyconsidered participants that had been in the city before.
There was also a change for the satisfaction with rec-ommendation list as a whole if we only look at return-ing visitors. Satisfaction drops between the pre- and post-questionnaires for both conditions, rather than just for thepopular condition. However, the drop is greater for the pop-ular list.
6.2 EffectivenessWe saw that participants who received the popular list
visited more of their recommendations than those who re-ceived personalized lists. However, we saw in our post-hocanalysis that this trend is reversed if we only look at partic-ipants who had been to the city before.
This suggests that new visitors to the city may have beeninfluenced by factors such as the availability of the popularPOIs - the names of popular sights were easier to recognize.In comparison, first time visitors might not have been ableto recognize many of the POIs in the personalized condi-tion, nor have been able to recall many of the popular sights.These participants might not have trusted the recommenda-tions they were given as much as in the those in the popularcondition. Returning visitors on the other hand, were likelyto be familiar with names, but not be as keen to visit pop-ular sights as they had seen them before. The popular listsare thus more effective, but this seems to be more the casefor first time, rather than returning, visitors.
It is hard to differentiate the effects of low trust and theeffects of effectiveness, which both would lead to fewer fol-lowed recommendations. What is worse, the effects of trustand availability would have influenced the initial satisfactionwith the lists as well. However, satisfaction after visiting thesights offers a complementary evaluation of the effectivenessof the lists that may be more genuine than how many rec-
ommended POI were visited.
6.3 SatisfactionWe give two possible explanations why the overall satis-
faction with the recommendation lists (in both conditions)are lower than the score for the POI that were visited. Ei-ther the participants filtered out the “poor” recommenda-tions from the very beginning, and refrained from visitingthem, or the personalized list was strong, but our partici-pants filtered out options they had not heard of and wereunsure about1. We note however that the cumulative satis-faction, that considers the number of visited POI as well asthe score they received is higher for personalized lists.
6.4 PopularityIt is arguable that the personalized list led to participants
seeing more unpopular items, just as the popular lists ledparticipants to see popular items. However, we argue thatthese lists put participants in the personalized condition in“discovery mode” where they found more rare POI. In sup-port of this argument we recall that the average participantin this condition visited less than half of the POI that wererecommended to them. This suggests that the low popu-larity value for the items seen by participants who receivedthe personalized lists is not only due to the properties ofthese personalized lists, but the properties of all the POIsthat the participants in this condition visited. The fact thatparticipants in the personalized condition saw more POIsoverall also supports the idea that this condition facilitateda “discovery mode”. While our participants were happy withbeing recommended the same popular sights again, theserecommendations lack in novelty: in the long run, a recom-mender system would not be able to recommend the sametop sights over and over again to the same people. The dis-covery mode triggered by the personalized lists, help thesetravelers to discover new places, and maintain their satisfac-tion with the travel experience over time.
6.5 Qualitative commentsWe noticed that participants often noted contextual fac-
tors for not visiting certain POIs. For example some partic-ipants mentioned that they did not visit museums as therewas good weather that day: “since the weather was good Iavoided inside places (e.g. the two museums)”. We noticedthat such explanations were given exclusively for personal-ized recommendation lists. While explanations like these areabsolutely reasonable, and while context such as weather areimportant in making travel recommendations, it is interest-ing to note that there were no such problems for popular rec-ommendations, such as visiting Casa Batllo and Casa Mila,both of which are indoors.
6.6 Lessons learned for mobile field studiesMobile field studies are not without difficulties [17]. While
we had access to a sizable number of tourist participants,the number was not large enough to be able to test moretypes of personalization or exclude participants that did notfulfill certain criteria such as not having visited the city of
1Participants were able to use the CSG tool during theirtrip to look up the POI, but this information was occasion-ally missing for less popular POI. Thus in these cases par-ticipants did not have much information the recommendedPOIs

Barcelona before. Thus, while the method of personalizationis not particularly sophisticated, we aimed to use an ap-proach that is generalizable, replicable and has an acceptedprecedent in the literature. We do not claim to have devel-oped a new method of personalization as such, but merelyevaluate an commonly accepted approach.
Other difficulties are more technical in nature, such as thedrain of GPS on battery life. In our case we had hoped torecord a trace of participants movements via GPS, which theparticipants could choose to include in analysis. Given thedrain on battery life however, some of the traces were incom-plete. The remaining traces were thus rendered unworkablefor analysis. Failing that, we also considered using the geo-tagged photos that participants took during the challengeand were asked to upload to Flickr.com. Also here, we en-countered a number of technical difficulties uploading theimages and ensuring they belong to the same account orgroup, such as the upper quota on free accounts. As suchwe encourage future field studies to always consider backupsolutions when (not if) difficulties occur.
7. CONCLUSIONS AND FUTURE WORKAlthough participants did not follow many of the recom-
mendations in the personalized lists, we found that person-alized recommendations enabled a “discovery mode”. In thismode, participants visited more POIs than in the popularcondition, and these POIs were also more rare than POIsvisited by participants in the popular condition. The levelof satisfaction between the two conditions was comparableand high, suggesting that our participants were almost ashappy with the more rare, “off the beaten track” recom-mendations that they received. If we consider a cumulativemodel for satisfaction, in which the number of visited placesalso contributes positively, we see that this increaseds forpersonalized lists.
We also saw that the number of followed recommenda-tions was comparable between conditions, for participantsthat had been in the city before. It would seem that return-ing visitors that saw the popular lists, go “nowhere much”.They are happy with their recommendations (slightly hap-pier than personalized), but are actually missing out. Re-turning visitors in the popular condition did not discoveras many novel items as the participants in the personalizedcondition. Finally, we have also shown that personalizedrecommendations may increase serendipity, since users aremore likely to discover sites that surpass their a priori assess-ment. The discovery mode that the personalized lists leadto help these travelers to discover new places, and maintaintheir satisfaction with the travel experience over time. Wecaution however that given that many of our participantshad previously been to the city of Barcelona, our reportedtrends are more likely to be applicable to tourists who arealready somewhat familiar with a city.
The practical implications of our findings are the follow-ing. Popular points of interest may be suitable recommen-dations for first time tourists with limited time. However,popular recommendations also limit the serendipity of theoverall experience, and may cause travelers to be less adven-turous. In particular, for returning visitors, more rare POIshelp maintain satisfaction and interest in the place or citythey are visiting over many trips.
In this experiment, participants were asked to travel andnavigate alone. While this happens occasionally in a natural
scenario, traveling is very often a group activity and it is ourintention to consider aiding the group as well as individuals.For example we may imagine that this could influence thescoring of recommendations, as been investigated in otherwork such as e.g. [23]. This work only considers the ini-tial prototype of the CSG application, but we are alreadyworking on a functionality that allows to view the locationof friends.
Other plans for future additions include recommendingitineraries: recommendations will no longer be single pointsof interests, but itineraries with several POIs. As such,itineraries will not only consider the user’s current location,and the user’s interests, but also how much time they haveto spend on sightseeing, and travel times between POI lo-cations given different modalities (e.g. walking or car). Weare currently considering the applicability of such a servicecombined with augmented reality for the Olympics 2012 inLondon, while augmenting the POI to include venues andevents.
8. ACKNOWLEDGMENTSThe research leading to these results has received funding
from the European Community’s Seventh Framework Pro-gramme FP7/2007-2013 under grant agreement no215453 -WeKnowIt. Many thanks to Ana Flores and Manuel Vi-cente for the development of the CSG tool. This paper alsomade use of the SimMetrics Java package[4] developed bySam Chapman.
9. REFERENCES[1] Android location manager. Last retrieved April 2010.
http://developer.android.com/reference/
packages.html/.
[2] Geocoder. Last retrieved April 2010.http://code.google.com/apis/maps/
documentation/services.html.
[3] Reality mining at MIT. Last retrieved April 2010.http://reality.media.mit.edu/.
[4] Simmetrics. Last retrieved April 2010. http://www.dcs.shef.ac.uk/~sam/stringmetrics.html.
[5] Ski-europe. Last retrieved April 2010.http://www.ski-europe.com.
[6] Travel ontology. Last retrieved April 2010.http://www.schemaweb.info/schema/
SchemaDetails.aspx?id=236.
[7] Tripsay. Last retrieved April 2010.http://www.tripsay.com.
[8] W3c geolocation api. Last retrieved April 2010.http://dev.w3.org/geo/api/spec-source.html.
[9] Wikipedia. Last retrieved Dec. 2009.http://en.wikipedia.org/.
[10] Yahoo API for getting POIs. Last retrieved Dec. 2009.http://weknowit.research.yahoo.com/weknowit/
apis/getPOIs.php?id=2405.
[11] G. D. Abowd, C. G. Atkeson, J. Hong, S. Long,R. Kooper, and M. Pinkerton. Cyberguide: A mobilecontext guide. In ACM Wireless Networks, pages421–433, 1997.
[12] C. Anderson. The Long Tail: Why the Future ofBusiness is Selling Less of More. Hyperion, 2006.
[13] L. Ardissono, A. Goy, G. Petrone, M. Segnan, andP. Torasso. Intrigue: Personalized recommendation of

tourist attractions for desktop and handset devices. InApplied Artifical Intelligence, 2003.
[14] M. Bilgic and R. J. Mooney. Explainingrecommendations: Satisfaction vs. promotion. InProceedings of the Workshop Beyond Personalization,in conjunction with the International Conference onIntelligent User Interfaces, pages 13–18, 2005.
[15] F. Bohnert and I. Zukerman. Non-intrusivepersonalisation of the museum experience. In UMAP,pages 197–209, 2009.
[16] M. Braun and A. Scherp. Collaborative poi. Lastretrieved April 2010. http://isweb.uni-koblenz.de/Research/systeme/csxPOI.
[17] K. Cheverest, N. Davies, K. Mitchel, A. Friday, andC. Efstratiou. Developing a context-aware electronictourist guide: Some issues and experiences. In CHILetters, 2000.
[18] K. Church, J. Neumann, M. Cherubin, and N. Oliver.Socialsearchbrowser: A novel mobile search andinformation discovery tool. In In Proceedings of theInternational Conference on Intelligent UserInterfaces (IUI), 2010.
[19] J. Delgado and R. Davidson. Knowledge bases anduser profiling in travel and hospitality recommendersystems. In Proceedings of the ENTER 2002Conference,, pages pp. 1–16, Innsbruck, Austria,January 22-25 2002. Springer Verlag.
[20] A. Felfernig, S. Gordea, D. Jannach, E. Teppan, andM. Zanker. A short survey of recommendationtechnologies in travel and tourism. OGAI Journal,25:17–22, 2007.
[21] D. Jannach and K. Hegelich. A case study on theeffectiveness of recommendations in the mobileinternet. In Conference on Recommender systems,pages 205–208, 2009.
[22] J. A. Konstan, B. N. Miller, D. Maltz, J. L. Herlocker,L. R. Gordon, and J. Riedl. Grouplens: Applyingcollaborative filtering to usenet news. Communicationsof the ACM, 40(3):77–87, Mar. 1997.
[23] J. Masthoff. Group modeling: Selecting a sequence oftelevision items to suit a group of viewers. UserModeling and User Adapted Interaction, 14:37–85,2004.
[24] D. McSherry. Explanation in recommender systems.Artificial Intelligence Review, 24(2):179 – 197, 2005.
[25] M. Perrero, F. Antonelli, and M. Geymonat.Recommendation on tv: What do users want? a userstudy. In Recommender-based Industrial ApplicationsWorkshop in association with the conference onRecommender Systems, 2009.
[26] D. Rowland, M. F. L. Oppermann, J. Marshall, A. C.andBoriana Koleva, S. Benford, and C. Perez.Ubikequitous computing: Designing interactiveexperiences for cyclists. In MobileHCI, 2009.
[27] M. van Setten, S. Pokraev, and J. Koolwaaji.Context-aware recommendations in the mobile touristapplication compass. In Adaptive Hypermedia, pages235–244, 2004.
[28] R. van Zwol and B. Sigurbjornsson. Facetedexploration of image search results. In WWW, 2010.
[29] Waszkiewicz, Cunnigham, and Byrne. Case-based
personal travel agent. In International Conference onUser Modeling, 1999.
[30] C.-N. Ziegler, S. M. McNee, J. A. Konstan, andG. Lausen. Improving recommendation lists throughtopic diversification. In WWW’05, 2005.
APPENDIXA. PERSONALIZATION QUESTIONNAIRE
The personalization questionnaire is available online: http://78.46.87.99/tourist/.
B. PRE-QUESTIONNAIREAn example pre-questionnaire is available online: http:
//78.46.87.99/tourist/preQnaire.doc. This is an exam-ple of a personalized recommendation list for the keywords“architecture, history, botanical, music, archaeological”.
C. POST-QUESTIONNAIREThe post-questionnaire is available online, and corresponds
to the above personalized pre-questionnaire: http://78.46.87.99/tourist/postQnaire.doc.