off-design performance of a liquefied natural gas plant ... · t isentropic stage efficiency (–)...
TRANSCRIPT

Contents lists available at ScienceDirect
Applied Energy
journal homepage: www.elsevier.com/locate/apenergy
Off-design performance of a liquefied natural gas plant with an axial turbineof novel endwall design
Hakim T. Kadhima,b,⁎, Aldo Ronaa
a Department of Engineering, University of Leicester, LE1 7RH, United KingdombAl-Dewaniyah Technical Institute, Al-Furat Al-Awsat Technical University, Iraq
H I G H L I G H T S
• LNG plant performance gains are predicted using power turbines with improved endwalls.
• A novel casing surface is elicited from the natural path of the secondary flows.
• Turbine passage vortex strengths is reduced lowering entropy production at rotor exit.
• The turbine efficiency is improved by 1.13% at design and by 0.97% at off design.
• The C.O.P of LNG plant is improved by 2.923% at design and by 2.05% at off-design.
A R T I C L E I N F O
Keywords:LNG cryogenic plantDesign optimizationCFDContoured endwallAxial turbine
A B S T R A C T
A design optimization workflow for the casing of a 1.5 stage axial turbine is implemented through a novelendwall surface definition, towards improving the turbine efficiency. The new non-axisymmetric casing designcompares favourably to an established diffusion design technique. The workflow uses an axial turbine three-dimensional Reynolds Averaged Navier-Stokes model built in OpenFOAM Extend 3.2 with the −k ω Shear StressTransport turbulence closure. Computer-based optimization of the surface topology using a Kriging surrogatemodel automates the design process. The designs are optimized using the total pressure loss across the full stageas the target function. Axial turbine performance gains are obtained from the workflow, which persist both at thedesign condition and off-design. These gains are used to project the impact of equivalent design improvements tothe power turbine of a representative Natural Gas liquefaction plant cycle. Cycle Coefficient of Performanceenhancements between 2.05% and 2.923% are obtained, at design and at off design conditions. Implementingthese performance improvements has the potential to reduce carbon dioxide emissions by 165.54 tonnes per yearat design and by 108.18 tonnes per year at off design, in a representative Natural Gas liquefaction plant.
1. Introduction
Due to the world’s population growth and increased industrial ac-tivities, the demand for energy is increasing continuously and is pro-jected to grow at a rising rate. A significant portion of energy is cur-rently produced by firing natural gas (NG) that has undergoneliquefaction, so it can be transported long-distance. Advances in thedesign of natural gas liquefaction cycles and of their individual com-ponents are required to improve the performance of the cycle and re-duce the natural gas used for driving the cycle. With increasingly en-vironmental concerns, optimizing the use of natural gas plays afundamental role in reducing CO2 emissions towards meeting theUNFCCC (United Nations Framework Convention on Climate Change)
emissions goals.The liquefaction process significantly increases the NG density as
the liquefied natural gas (LNG) density is about 600 times that of NG[1]. The consequent reduction in volume makes LNG more economic-ally transportable in a closed vessel compared to NG. The boiling pointof NG is typically (−162 °C) at ambient pressure [2]. Therefore, variouscryogenic processes are used for cooling the NG during the liquefactionprocess. The main cycles are the optimized cascade cycle, the mixed-refrigerant cycle, and the turbo-expander cycle. More details on thesescycles are available in [2–8]. The LNG cryogenic cycle used in this workis the optimized cascade cycle. This refrigeration cycle is used to pro-vide a very low-temperature refrigeration that cannot be obtained froma single refrigerant due the wide range of operating temperatures. The
https://doi.org/10.1016/j.apenergy.2018.03.077Received 30 December 2017; Received in revised form 27 February 2018; Accepted 25 March 2018
⁎ Corresponding author.E-mail addresses: [email protected], [email protected] (H.T. Kadhim).
Applied Energy 222 (2018) 830–839
0306-2619/ © 2018 The Authors. Published by Elsevier Ltd. This is an open access article under the CC BY license (http://creativecommons.org/licenses/BY/4.0/).
T

specific optimized cascade cycle that is studied in this paper wasmodified by Conoco-Philips [4].
The coefficient of performance (C.O.P.) of the complete LNG cycledepends mainly on the isentropic efficiency of its turbomachines and onthe effectiveness of its heat exchangers [9]. The performance of thepower turbine in the cycle significantly affects the overall C.O.P. cycleand can contribute towards meeting the UNFCCC emissions goals. Avariety of toolchains is used by power turbine designers, in which theperformance and the cost of the design are significantly affected by theparametrization and by the optimization in the workflow.
Computational Fluid Dynamics (CFD) has grown to become an es-tablished tool in turbomachinery design. In industry, steady ReynoldsAveraged Navier-Stokes equation methods are used in conjunction withmixing planes to provide fast turn-around predictions [10]. This is the
approach also used in this work. The time-dependent interaction be-tween stationary and rotating blade rows in axial turbines can be stu-died by unsteady Reynolds Averaged Navier Stokes equations withsliding meshes [11] or by Large Eddy Simulations [12]. These ap-proaches provide greater information but are still rather expensive forbeing used in an automated design optimization loop.
A review of the literature shows that many different parametrizationprocesses have been proposed for the endwall of power turbines. Turgutand Camci [13] and Harvey et al. [14] adopted beta-spline and Fourierseries based curves in the axial and circumferential directions to definenon-axisymmetric endwall shapes. They demonstrated an increase inthe turbine efficiency and a clear reduction in secondary flows. Praisneret al. [15] used a direct surface modification by control points methodto generate non-axisymmetric endwall shapes. The results showed a
Nomenclature
h enthalpy (J kg−1)p pressure (Pa)R specific gas constant (J kg−1 K−1)Ri casing diffusion control points (m)Tg natural gas temperature (°C)wte groove width at the blade trailing edge (radians)CVf low calorific value of fuel (J kg−1)Cptr stage total pressure loss coefficient (–)x axial coordinate (m)QH heat output (W)mf fuel mass flow rate (kg s−1)k specific turbulent kinetic energy ( −m s2 2)
+y dimensionless wall distance (–)
Greek symbols
α1 stator exit absolute yaw angle (degrees)
ηt isentropic stage efficiency (–)θ pitchwise angular coordinate (radians)θg groove pitchwise angle (radians)ω specific dissipation rate of k ( −m s2 3)ωx axial vorticity ( −s )1
μ maximum groove depth location (–)ϕm mass flow rate (kg s−1)
Acronyms
APOW automated process and optimization workbenchLNG liquefied natural gasNURBS non-uniform rational B-splineNG natural gasUNFCCC United Nations framework convention on climate changeSFC specific fuel consumptionSST shear stress transportPS pressure sideSS suction side
Fig. 1. The LNG cycle using the optimized turbine casing modelled with Cycle – Tempo, at the design point.
H.T. Kadhim, A. Rona Applied Energy 222 (2018) 830–839
831
clear reduction in the raw total pressure loss. The reduction of sec-ondary flow losses is an active research area in turbomachinery, asthese losses represent around 40% to 50% of the estimated total aero-dynamic losses in an axial turbine [16]. Mitigating techniques forendwall secondary flows are reviewed in Kadhim and Rona [17]. Thisreview focused on the non-axisymmetric endwall design as it is themore successful approach for reducing the secondary flows.
Computer-based optimization methods have been used by manyresearchers for enhancing the system performance of the axial and ra-dial turbines [18–21]. This use includes the application of computer-based optimization to design hub and casing endwalls of axial turbines.The computer-based optimization of the shape-defining parameters is akey enabler of non-axisymmetric endwall designs. Tang et al. [22]optimized the endwalls of a one-and-half stage axial turbine using amulti-island genetic algorithm, decreasing the total pressure loss acrossthe upstream stator by 10.7% and increasing the stage efficiency by0.4%. Sun et al. [23] used an aerodynamic optimization techniquebased on combining endwall profiling parametrization and global op-timization, lowering both secondary flow and profile losses.
In this paper, the performance of a cryogenic plant is evaluatedusing a new NG turbine casing design. The new casing design is in-troduced based on a novel surface definition method that draws fromobservations of the typical pattern of secondary flows over the turbinecasing. This is the first application of the current parametric casingdesign to the power turbines of a cryogenic plant. The new casing de-sign technique focuses on manipulating specific flow structures directly.The casing design workflow and the optimization is implemented usingAutomated Process and Optimization Workbench (APOW) software byGeneral Electric (GE). The C.O.P of the LNG plant cycle is investigatedby improving the isentropic efficiency of the axial gas turbines thatdrive the axial compressors in the plant. The improved turbine withoptimized casing is run at design conditions and off-design. The com-mercial software Cycle–Tempo [24] is used to evaluate the change inthe cycle performance from using power turbines with a new contouredcasing. This investigates the improvements in both the natural gasspecific fuel consumption and the reduction in CO2 emissions that canbe achieved by using axial turbines fitted with the optimized non-ax-isymmetric casing in this cryogenic cycle application.
2. Baseline LNG plant
The schematic diagram of the Conoco-Philips optimized cascadeLNG cycle is shown in Fig. 1. The natural gas enters the cascade cyclefrom the inlet 10 at 37 °C, it passes through three stages of refrigerationand exits liquefied from the outlet 18. The three main refrigerationcycles, utilized in this whole process, are the Propane refrigerationcycle, the Ethylene refrigeration cycle, and the Methane refrigerationcycle. The compressor of each refrigeration cycle is driven by a separategas turbine. The coefficient of performance (C.O.P.) of the LNG cycleused in this work is defined as the ratio of the total heat absorbed by thethree refrigerants to the total heat input to the power turbines that drivethe three refrigerant cycles.
3. Improved cycle at design and off-design
In this work, gas turbines modified with an optimized contouredcasing are used to increase the coefficient of performance of theConoco-Philips liquefied natural gas (LNG) cryogenic cycle [4,25]. Themodified gas turbines are labelled as items 23, 32, and 38 in the cycleschematic of Fig. 1, from Cycle-Tempo. The three gas turbines drive acascade of three cooling cycles. Specifically, natural gas flows through asequence of three refrigeration cycles, starting from the Propane cycleat the left end of Fig. 1, which is then followed by the Ethylene cycleand by the Methane cycle at the right end of Fig. 1. The Propane re-frigeration cycle absorbs heat from the Natural Gas (NG), the super-heated Ethylene and the superheated Methane by heat exchangers 6,12, and 13 respectively. The Ethylene refrigeration cycle is used toremove heat from the NG that outflows heat exchanger 6, by heat ex-changer 19, and from the superheated Methane, by the heat exchanger25. The methane refrigeration cycle is the final process of the NG heatremoval by heat exchanger 8 and the output from outlet 18 is LNG at−162 °C. The Natural Gas (NG) is modelled as having the compositionof Table 1 with a low calorific value CVf of 37,999 kJ/kg [24].
To evaluate the C.O.P., two Cycle-Tempo models are built at thedesign and off-design operating conditions for the gas turbines. Themodels evaluate the changes in the flow state of the working fluid in thepower turbines, items 23, 32, and 38 in Fig. 1, by a conventionallumped mass thermodynamic cycle analysis [4] using constant propertyideal gas assumptions through the compressors 14, 30, and 36, andthrough the turbines. Compressor and turbine isentropic efficiencies areused to account for irreversibility effects through these components.The axial compressors at entry of the propane, ethylene, and methanecycles, items 2, 15, and 4, are modelled in a similar way assuming anideal gas working fluid and representative component isentropic effi-ciencies. The heat exchanges in the cycles, items 6, 8, 12, 13, 19, and25, are modelled with adiabatic external walls, using a simple corre-lation between pressure drop and flow rate and a constant heat ex-changer overall heat transfer coefficient [4]. The heat removed throughthe heat exchangers is estimated based on the change in the specificstagnation enthalpy of the working fluids, which includes non-ideal gaswet vapor latent heat effects [4]. The two models predict an increase inthe C.O.P. of the LNG by increasing the turbine stage isentropic effi-ciency.
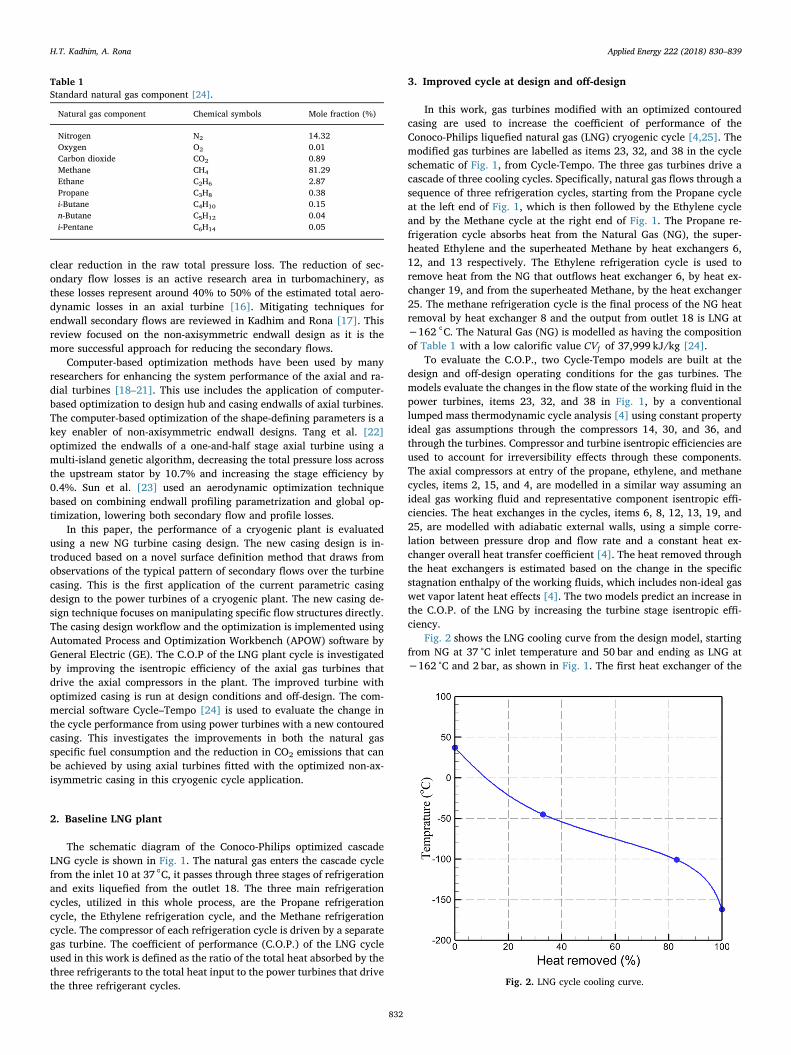
Fig. 2 shows the LNG cooling curve from the design model, startingfrom NG at 37 °C inlet temperature and 50 bar and ending as LNG at−162 °C and 2 bar, as shown in Fig. 1. The first heat exchanger of the
Table 1Standard natural gas component [24].
Natural gas component Chemical symbols Mole fraction (%)
Nitrogen N2 14.32Oxygen O2 0.01Carbon dioxide CO2 0.89Methane CH4 81.29Ethane C2H6 2.87Propane C3H8 0.38i-Butane C4H10 0.15n-Butane C5H12 0.04i-Pentane C6H14 0.05
Fig. 2. LNG cycle cooling curve.
H.T. Kadhim, A. Rona Applied Energy 222 (2018) 830–839
832

Propane cycle removes 33% of heat from the NG and outputs it at −45°C. The second heat exchanger of the Ethylene cycle absorbs about 50%of the heat from the NG and outputs it −101 °C. The third heat ex-changer removes the remaining 22% of heat from the NG by the Me-thane refrigeration cycle.
The turbine casing is contoured by the optimized guide groove ofsection 4.4. The C.O.P. is shown to increase by increasing the turbineefficiency ηt by 2.923% at the design condition and by 2.05% at the off-design condition defined in Section 4.3. These improvements in C.O.P.come from an increase in the mechanical turbine power output thatdrives the LNG cycle for the same natural gas flow rate feed to the gasturbines. This is based on the definition of C.O.P. as the ratio of the heatextracted from the NG to the heat supplied to the turbines that drive thecascade cycle
=∑
××C O P
Qm CV
η. . .
NG
f ft
(1)
where mf is the total fuel mass flow rate and CVf is the low calorificvalue of the fuel. Eq. (1) shows that the C O P. . . is directly proportionalto the turbine efficiency ηt and, therefore, a gain in ηt generates aproportional gain in C O P. . .
It can be also seen from Eq. (1) that increasing the C O P. . . enablesthe extraction of heat from NG at the same rate at a lower fuel flow raterequired to the turbines that drive the cascade cycle. This can reducethe amount of natural gas burnt for driving the cycle, which reduces thecost of producing LNG.
The stage isentropic efficiency is defined as [26]
=−
−
−
( )η
1
1stage
TT
PP
γγ
1
tt
tt
20
20 (2)
where Pt is the average total pressure and Tt is the average total tem-perature across specific axial planes. Subscript 0 denotes the upstreamstator inlet plane and subscript 2 denotes the rotor exit plane. From Eq.(2), a loss in total pressure reduces the ratio P P/t t2 0 that increases themagnitude of the denominator in Eq. (2) and therefore decreases ηstage.Hence, under the conditions of a constant specific work extraction ratefrom the rotor, a total pressure loss reduction leads directly to an in-crease in the stage isentropic efficiency. By improving the isentropicefficiency of the axial turbines within the cycle, the LNG cycle perfor-mance can be improved.
Table 2 summarises the main performance data of the original plantversus that from the improved LNG plant at design conditions and off-design. It confirms the above-stated trends in the context of the Conoco-Philips LNG cycle, which represents a possible real application of thetechnological improvements discussed in the remainder of this paper.
The next section shows a method for improving the cycle powerturbine efficiency, by using a non-axisymmetric turbine stator casingthat reduces the gas turbine secondary flow losses.
4. Improving the cycle power turbine by endwall contouring
4.1. Flow analysis by CFD
A steady three-dimensional RANS k-ω Shear Stress Transport (SST)model is built of the flow through the Aachen Turbine, which represents
a power turbine in the LNG cycle of Fig. 1. The model is implemented inOpenFOAM 3.2 Extend using multi-reference frames (MRF), one for thestator and one for the rotor, and mixing planes at the rotor-stator in-terfaces. Steady flow solutions are obtained using the steadyCom-pressibleMRFFoam solver of OpenFOAM 3.2 Extend. The k-ω SST tur-bulence model was chosen as it provides turbulence closure to theRANS equations at a lower computational cost than a full Reynoldsstress model. RANS simulations of turbomachinery flows have used thismodel extensively, including on flows exhibiting boundary layer se-paration [27]. Wang et al. [28] compared the performance of differentturbulence closure models for predicting secondary flows in turbo-machines and determined that the k-ω SST turbulence model producedresults closest to experiment on the basis of the predicted topologicalstructure, the flow evolution process, and the extent of the secondaryflows. This led to the selection of the k-ω SST model for this work,which requires evaluating the effect of endwall contouring on the sec-ondary flows of an axial turbine. The flow domain of each blade row isassumed n-periodic in the circumferential direction, where n is thenumber of blades. Therefore, the computational domain is limited toone blade pitch, as shown in Fig. 6.
A simple H-mesh topology is applied to the passages of the first andsecond stator and an O-mesh topology is applied to the rotor bladepassage and to the rotor tip gap flow passage, which is labelled as “Tipclearance block” in Fig. 6. Constant ratio mesh clustering is appliednear all solid walls to get a near-wall resolution ≈+y 1. Fig. 3 shows theaverage value of +y obtained by clustering the mesh cells over thecasing, for 11 variations of the casing geometry. These include theoptimized casing modelled at design and at off design conditions and anumber of intermediate casing geometries used in the casing optimi-zation cycle, shown by filled circles. By clustering the mesh close to thewall, Fig. 3 shows that a near-wall resolution of ≈+y 1 is achieved andmaintained through the optimization process, at design conditions andoff-design.
At the computational domain inflow, dry air with a specific heatratio γ = 1.4 and with a specific gas constant =R 287 J kg−1 K−1 issupplied. The airflow is modelled as an ideal gas with constant specificheats. Sutherland’s law is used to evaluate the air viscosity. The inflowover the casing features a fully developed compressible boundary layer,generated by the EDDYBL program of Wilcox [29]. At the outflow, aradial profile of static pressure is imposed, determined by radial equi-librium. Further details on the flow modelling, the test case, the com-putaional mesh, and the boundary conditions are given in Kadhim et al.[30,31].
Fig. 4 shows by near-surface limiting streamlines the flow over theaxisymmetric casing of the upstream stator, as predicted by CFD. TheCFD model is shown to produce the typical flow structures that developover the casing of an axial turbine [32]. The casing inflow boundarylayer grows over the 143mm long passage leading edge. As this ap-proaches the blade leading edge, it forms a saddle point where it bi-furcates, as indicated by the streamlines inside the small circle inFig. 4(a). Under the influence of the adverse pressure gradient from theblade potential pressure field, the oncoming boundary layer rolls-up,forming a horeseshoe vortex that wraps around the blade leading edge.Fig. 4(b) shows by ribbons the horseshoe vortex left and right armswrapping around the blade, respectively on the pressure and suctionsides. Fig. 4(b) shows that the bundle of ribbons labelled Vph crossesover to the suction side, under the influence of a pitchwise pressure
Table 2Performance parameters of the LNG cycle at design and at off design conditions.
Operating conditions Baseline casing ηt Optimized contoured casingηt
LNG C.O.P.increase
CO2 reduction CO2 reduction in tonnes/year
Specific fuel consumptionreduction
Design condition 82.5% 83.6% 2.9% 1.8% 165.5 1.5%Off-design condition 80.5% 81.5% 2.0% 1.1% 108.2 0.5%
H.T. Kadhim, A. Rona Applied Energy 222 (2018) 830–839
833

gradient, where it tangles with the bundle of ribbons labelled Vsh atapproximately 0.55 axial chords from the leading edge. This interactiongenerates a larger vortex structure, called the passage vortex [32]. It isof interest to determine a non-axisymmetric design for the casing thatdelays this interaction and consequently reduces the adverse effects ofthese secondary flows. This is explored in Section 4.3.
4.2. Model validation
A mesh dependency study has been performed to investigate theeffect of the spatial discretization on the flow predictions through theupstream stator. For this purpose, the grid convergence index (GCI)using Richardson’s extrapolation, described by Roache [33], was used.Three computational meshes were built to discretize the upstreamstator with a constant refinement factor rm =2. These are a 1.75M cellscoarse mesh, a 3.5M cells intermediate mesh, and a 7M cells fine mesh.In this work, two GCI are considered according to Wilcox [34], basedrespectively on the averaged total pressure loss coefficient and on theaveraged yaw angle. The averaged total pressure loss coefficient pre-dicted by each mesh is 0.0561, 0.0570, and 0.0573. The correspondingvalues of the averaged yaw angle are 72.3°, 71.6°, and 71.3°. Table 3shows that the GCI computed from the averaged total pressure loss
coefficient predicted with the coarse mesh and that with the inter-mediate mesh is 0.987. This is higher than the GCI computed from theaveraged total pressure loss coefficient predicted with the intermediatemesh and that with the fine mesh, which is 0.327. A similar reduction inGCI is obtained for the GCI based on the averaged yaw angle. This in-dicates a reduction in the mesh dependence in the simulations that usethe intermediate mesh and the fine mesh. The spatial discretizationnumerical error used in the GCI computation is based on the differencebetween the predicted value ϕi using the ith mesh and the one obtainedfrom Richardson’s extrapolation as ∊ = −−ϕ ϕ 1i i R
1 .Based on this mesh dependency study, the flow through the 1.5-
stage turbine is modelled using 5,699,688 cells, which has about thesame spatial resolution at that of the upstream stator intermediatemesh.
The validation of the baseline flow prediction with an axisymmetriccasing cascade passage is obtained by comparison against measure-ments from RWTH Aachen [35]. To enable the direct comparison be-tween experimental measurements and CFD predictions, the flow stateis extracted from the CFD predictions at the same locations as where itis measured in the experiment. Fig. 5 shows the comparison betweenmeasured and computed flow Mach number distributions 8.8 mm be-hind the upstream stator, Fig. 5(a), and 8.8mm behind the rotor,Fig. 5(b). These radial profiles have been pitch averaged using a simpleaverage. The predicted radial profiles of Mach number in Fig. 5(a) andin Fig. 5(b) appear to follow closely the measured Mach number profilesin experiment, as shown by the lines substantially overlapping thesymbols across the full span. The Mach number distribution down-stream of the rotor just above the hub, up to 10% of the blade span, isslightly under-predicted. The main trends in the experimental profilesappear to be well reproduced by the numerical model. This indicatesthat the CFD model is likely to be adequate for guiding the endwallcasing design, which is the main purpose of this study, even if somediscrepancies are acknowledged close to the rotor hub.
4.3. Non-axisymmetric upstream stator casing design
The Automated Process and Optimization Workbench (APOW)
Fig. 3. Average value of +y over the casing, for different contoured casingparameter values.
(a) (b)
SS
Casing
Saddle point PS
SS VphVsh
Fig. 4. (a) Flow visualization over the axisymmetric casing of the upstream stator showing the separation of the oncoming casing boundary layer (saddle point) bystreamlines. (b) The same surface showing by ribbons the pressure side horseshoe vortex interacting with its suction side branch.
Table 3Grid Convergence Index with percentage error based on Richardson’s extra-polation.
ϕ rm GCI21 GCI23 ∊1 (%) ∊2 (%) ∊3 (%)
Cpt 2 0.987 0.327 2.35 0.78 0.26α1 2 0.916 0.394 1.72 0.73 0.31
H.T. Kadhim, A. Rona Applied Energy 222 (2018) 830–839
834

software is used to design and test by CFD the performance of a non-axisymmetric casing for the upstream stator. This workflow is auto-mated within APOW and it is the activity labelled as “CFD evaluation”in the optimization workflow of Fig. 8. In this process, a contoured
casing surface is generated in MATLAB and imported as non-uniformrational B-splines (NURBS) in ANSYS ICEM CFD where the computa-tional domain is discretized. This is done while maintaining similarmeshing parameters to obtain the same mesh quality as for the vali-dation test case in Section 4.2. The ANSYS ICEM CFD unstructuredmesh is converted to OpenFOAM by the Fluent3DMeshToFoam pre-processor of OpenFOAM.
A guide groove is applied to the casing wall while the hub is leftaxisymmetric. The non-axisymmetric turbine upstream stator casing isparametrized on two main variables: The location of the maximumgroove depth μ x θ( , )g along its path and the pitchwise width w x θ( , )te g ofthe groove at the blade trailing edge. The groove starts narrow at thestator leading edge and widens up to the stator exit. Fig. 6 shows anexample of the new casing design imported in ANSYS ICEM CFD.
The diffusion surface design reported in Sun et al. [23] is used tocompare the performance of the new endwall design to the literature.This design uses a cosinusoidal curve of half period in the circumfer-ential direction to create a zone of flow diffusion near the blade suctionside, to increase the pressure locally and thereby reduce the cir-cumferential pressure gradient over the casing. A streamwise curvedefines the amplitude of the cosinusoidal curve on different axialplanes. This streamwise curve is defined as a non-uniform B-Spline withseven control points at specific axial positions. The first and the last
Fig. 5. Comparison of pitchwise averaged predictions with measurements from RWTH Aachen. (a) Radial profiles of Mach number 8.8 mm downstream of the statorexit. (b) Radial profiles of Mach number 8.8 mm downstream of the rotor exit.
Tip clearance block
Fig. 6. Non-asymmetric casing NURBS imported in ANSYS ICEM CFD.
Fig. 7. Optimization of the new casing design using the initial and adaptive sampling procedure, based on the stage total pressure loss coefficient.
H.T. Kadhim, A. Rona Applied Energy 222 (2018) 830–839
835

points are fixed at the leading and trailing edge while the radial co-ordinate of two selected points, shown as R( )3 and R( )5 in [23], are usedin the current optimization process.
The non-axisymmetric casing designs, optimized at the AachenTurbine design point, are tested numerically at off-design by reducingthe rotor speed from its design value of 3500 r.p.m. to 2510 r.p.m.,which is known to cause a reduction in the turbine isentropic efficiencydue to higher secondary flow losses [36].
4.4. Contoured casing endwall optimization
The small set of parameters used in Section 4.3 to define the casingcontour shapes renders the APOW optimization process more treatablethan alternative optimization methods that use a larger parameter set.The computer aided optimization workflow used in this study is shownin Fig. 8. The stage total pressure loss coefficient Cptr is used as theobjective function. The design space is sampled by the Optimal LatinHypercube design technique in APOW. Kriging is used to generate asurrogate model of the pressure loss coefficient, from the Cptr de-termined by CFD at the design space sampled points. The percentagedifference between the optimal total pressure loss prediction fromKriging and that from CFD is used as the criterion for implementing anadaptive sampling procedure as shown in the workflow of Fig. 8. Theadaptive sampling technique involves using the same set of initialsampling points (10 points) within the region of 10% of the minimumtotal pressure loss contour in Fig. 7. This places more sampling pointsaround the initial optimized point, which leads to more accurate pre-dictions from the Kriging model in this region. Fig. 7 shows the re-sponse function of the optimization method, for the new design, statedin terms of the stage total pressure loss coefficient using the initial andadaptive sampling procedure. The minimum value of Cptr shown inFig. 7 identifies the optimum values of the design variables w x θ( , )te andμ x θ( , ).
The validated CFD model of the Aachen Turbine provides thebaseline for assessing the effectiveness of implementing the optimizednon-axisymmetric casing. Fig. 9(a and b) show the mid-span to casingradial distributions of the yaw angle α1 8.8 mm downstream of theupstream stator exit and of the pitch-averaged total pressure losscoefficient Cptr 8.8mm downstream of the rotor exit. α1 and Cptr arecompared between the baseline, the casing with the optimized newcontour, and the casing with the optimized diffusion contour. The yawangle distribution in Fig. 9 (a) shows over-turning above the design yawangle of 70° near the casing. The optimized new contour for the casingmitigates this over-turning. Fig. 9(b) shows that, as this overturning isreduced, the pitch mass-averaged total pressure loss is reduced near thecasing, at the expense of a small additional loss further outbound. Thepeak contribution to the total pressure loss coefficient is higher by thediffusion design and the new design is shown to be significantly moreeffective than the diffusion design in reducing the flow over-turningclose to the casing, resulting in a more spanwise uniform yaw angle.
A further insight into the through-flow at off-design conditions isprovided by Fig. 10, which shows contours of axial vorticity at 8.8mm
Lower Upper
Fig. 8. Optimization workflow, implemented in APOW.
Fig. 9. Radial distributions of predicted pitch-averaged (a) yaw angle 8.8 mm downstream of the upstream stator exit plane and (b) stage total pressure losscoefficient 8.8 mm downstream of the rotor exit plane.
H.T. Kadhim, A. Rona Applied Energy 222 (2018) 830–839
836

behind the first stator, fitted with either axisymmetric or contouredcasings. It is noticeable that both the diffusion design and the optimizedgroove casing design lower the positive axial vorticity magnitude(+ωx) over the casing wall. The lower ωx at y =−0.045m andz =0.295m in Fig. 10(b and c) compared to Fig. 10(a) indicates alower strain rate in the casing boundary layer. This may come from areduced passage cross-flow, from less flow moving from the pressureside to the suction side. The axial vorticity (−ωx) minimum associatedto the casing passage vortex, which is located at y =−0.0165m andz =0.2885m in Fig. 10(a), seems to be mitigated by the use of theoptimized grooved casing design, while a slight decrease in (−ωx) canbe seen using the diffusion design. By the diffusion casing design, thesize and peak magnitude of an area of (+ω )x centered at y =−0.013
and z =0.295 is shown in Fig. 10(b) to reduce compared to the base-line axisymmetric casing predictions of Fig. 10(a). The groove con-toured casing design appears to be less effective at improving this flowarea, as Fig. 10(c) shows a lower peak magnitude (+ω )x but not a re-duced size of this region of high ωx .
The three-dimensional flow field inside the rotor passage is char-acterized by a tip leakage vortex from the unshrouded rotor blade andby the interaction of the upstream stator secondary flow with the pas-sage vortex, as also assessed independently by experiment in [37].Fig. 11 visualizes the evolution of the secondary flows over the rotorcasing towards the exit of the passage, which is where the passagevortex forms and grows. The local flow is visualized by the entropydistribution at different axial planes. Fig. 11(a) shows the predictedpattern through a rotor that is preceded by a stator with the baselineaxisymmetric casing. Fig. 11(b) shows instead the predicted pattern forthe case in which the rotor is preceded by a stator with the optimizedcontoured casing of Fig. 6. It can be seen that the entropy production‘core’ caused by the tip leakage vortex that forms near the blade suctionside tip reduces in peak value and in cross-section in Fig. 11(b) com-pared to Fig. 11(a). This is likely to indicate a reduction in the tipleakage vortex strength. The tip leakage reduction is likely to be drivenby the reduction in the stator exit angle at the casing shown in Fig. 9that off-loads the rotor tip. This reduces the pressure difference betweenthe rotor tip suction side and the rotor tip pressure side, which is themain driving force for the rotor tip leakage. This visualization confirmsthat a more spanwise homogeneous stator outflow obtained by con-touring the stator casing has a beneficial effect on the passage flowthrough the rotor.
5. Predicted potential for reducing CO2 emissions
Assuming a constant heat extraction rate from the LNG cycle, C.O.P.predictions are obtained from the Cycle-Tempo model of Section 3 witha variable natural gas fuel mass flow rate. The fuel mass flow rate ischanged to maintain the same turbine mechanical power output value,as the turbine stage isentropic efficiency is changed by the applicationof the casing end-wall design detailed in Section 4.3.
The LNG cycle performance can be improved by improving the stageisentropic efficiency of the axial turbines. The C.O.P. is increased by2.923% at the design condition and by 2.05% off-design. This results inreducing the cost of producing liquefied natural gas, based on the inletcondition of NG at 50 bar inlet pressure and 37 °C inlet temperature,and the outlet conditions of LNG at 2 bar outlet pressure and −162 °Coutlet temperature. At the cycle outlet, LNG is ready for storage andshipping in cryogenic tanks. A reduction in the cost of liquefaction ofnatural gas can therefore be achieved by reducing the amount of NGthat is consumed by the gas turbines in the cycle.
The evaluation of the environmental impact of retro-fitting turbineswith the optimized new casing design to the Conoco-Philips LNG cycleare evaluated using the stoichiometric chemistry species balance de-tailed in Boyce [38]. One kmol of fuel generates 0.0324 kmol of CO2
according to the following molar chemical balance:
+ + + +
+ + + +
+ + → +
+ +
Y
0.0005C H 0.0004C H 0.0015C H 0.0038C H 0.0287C H
0.8129CH 0.0089CO 0.0001O 0.1432N
[0.79N 0.21O ] 0.0324CO 0.072H O
0.1364O 0.7496N
6 14 5 12 4 10 3 8 2 6
4 2 2 2
2 2 2 2
2 2 (3)
The molar weights of NG and the CO2 are 18.5978 kg/kmol and44.0 kg/kmol respectively. Therefore, based on Eq. (3), the completecombustion of 1 kg of NG generates 0.076654 kg of CO2 at design point.Given that the LNG cycle in Fig. 1 utilizes 3.777 kg/s of fuel [39], itemits 0.096508 kg/s of CO2, which is equivalent to 3043.466 tonnes ofCO2/year. By reducing the fuel consumption by 1.509%, the corre-sponding reduction in CO2 is 165.545 tonnes of CO2/year.
This measures the direct environmental advantage of utilizing the
Fig. 10. Contours of axial vorticity at 8.8 mm behind the upstream stator. (a)axisymmetric casing, (b) diffusion casing, and (c) optimized groove casing.
H.T. Kadhim, A. Rona Applied Energy 222 (2018) 830–839
837

new casing design technique of Section 4.3 in a representative cryo-genic application. Further indirect advantages will emerge from savingsin the processing and in the transportation costs of the fuel consumedby the gas turbine cycles as well as savings in the treatment of theexhaust gasses before these are discharged to the atmosphere.
6. Conclusion
A newly designed casing endwall with a guide groove was tested byCFD to improve the aerodynamic performance of a 1.5 stage axialturbine. The endwall is predicted to improve the off-design stageisentropic efficiency by 0.97% compared to a 0.087% improvement bya more conventional diffusion-based endwall design. Numerical flowvisualizations appear to support the underlying principle of the non-axisymmetric casing design, namely that the groove guides the pres-sure-side horseshoe vortex branch, delaying the passage vortex forma-tion. The outcome is the suppression of low-energy flow close to thecasing, which is replaced by flow of greater streamwise momentum thatturns closer to the stator design outflow angle. This decreases the rotortip loading on the subsequent blade row, reducing adverse rotor tipleakage effects. An indication of a suppressed rotor tip leakage vortexthrough the turbine with the contoured casing is given by a reducedentropy distribution at the rotor tip outlet, which potentially benefitsany subsequent downstream blade row. The ensuing performance gainstherefore appear to be well-grounded in beneficial flow mechanismstaking place through the turbine. Four positive implications can beconcluded based on the use of the new casing design:
• The new design and its automated optimization workflow wereshown to have the potential for improving the isentropic efficiencyof a 1.5 stage axial turbine, which could be used as a power turbinefor the production of liquefied natural gas (LNG). Based on thepredicted stage isentropic efficiency increment, the coefficient ofperformance of the LNG cycle modelled by Cycle-Tempo softwarewas estimated to increase by 2.923% at design and by 2.05% off-design.
• The LNG cycle that uses the new casing design reduced the gasturbine specific fuel consumption and therefore the amount of burntnatural gas that is required for the gas turbine to produce the samework output. The specific fuel consumption decreased by 1.5% atdesign and by 0.55% off-design.
• A projection of the reductions in CO2 emissions from the cycle thatuses the modified gas turbine was obtained. The industry-wideadoption of this technology would have significant economic andenvironmental impacts.
• Finally, a reduction in the LNG production cost is achievable as theamount of natural gas burnt per LNG output is reduced.
Acknowledgements
This work was undertaken under the auspices of the GE – Universityof Leicester framework agreement. Advice from Dr. N. Z. Ince and Dr.M. Willetts, GE, is gratefully acknowledged. Funding by the HigherCommittee for Education Development in Iraq (HCED), is acknowl-edged. This research used the ALICE high performance computing fa-cility at the University of Leicester. Graphical rendering software li-censes were originally acquired with EPSRC support on Grant GR/N23745/01. The supply of experimental data for the 1.5 stage axialflow turbine “Aachen Turbine” under license by RWTH Aachen isgratefully acknowledged.
References
[1] Kumar S, Kwon H-T, Choi K-H, Lim W, Cho JH, Tak K, et al. LNG: an eco-friendlycryogenic fuel for sustainable development. Appl Energy 2011;88(12):4264–73.
[2] Zhang G, Zheng J, Yang Y, Liu W. A novel LNG cryogenic energy utilization methodfor inlet air cooling to improve the performance of combined cycle. Appl Energy2016;179:638–49.
[3] Ancona M, Bianchi M, Branchini L, De Pascale A, Melino F, Mormile M, et al.Investigation on small-scale low pressure LNG production process. Appl Energy2017.
[4] Mokhatab S, Mak JY, Valappil JV, Wood DA. Handbook of liquefied natural gas.Gulf Professional Publishing; 2013.
[5] Feier X, Yu C, Yonglin J. A review of cryogenic power generation cycles with li-quefied natural gas cold energy utilization. Front Energy 2016;10(3):363–74.
[6] Remeljej C, Hoadley A. An exergy analysis of small-scale liquefied natural gas (LNG)liquefaction processes. Energy 2006;31(12):2005–19.
[7] Lim W, Choi K, Moon I. Current status and perspectives of liquefied natural gas(LNG) plant design. Ind Eng Chem Res 2013;52(9):3065–88.
[8] Lim W, Lee I, Tak K, Cho JH, Ko D, Moon I. Efficient configuration of a natural gasliquefaction process for energy recovery. Ind Eng Chem Res 2014;53(5):1973–85.
[9] Meher-Homji C, Messersmith D, Hattenbach T, Rockwell J, Weyermann H, MasaniK. Aeroderivative gas turbines for LNG liquefaction plants: Part 1—the importanceof thermal efficiency. In: ASME Turbo Expo 2008: power for land, sea, and air,2008, ASME Paper GT2008-50839.
[10] Du P, Ning F. Validation of a novel mixing-plane method for multistage turbo-machinery steady flow analysis. Chin J Aeronaut 2016;29(6):1563–74.
[11] Gao J, Zheng Q, Jia X. Performance improvement of shrouded turbines with themanagement of casing endwall interaction flows. Energy 2014;75:430–42.
[12] Wang G, Duchaine F, Papadogiannis D, Duran I, Moreau S, Gicquel LY. An oversetgrid method for large eddy simulation of turbomachinery stages. J Comput Phys2014;274:333–55.
[13] Turgut ÖH, Camci C. A nonaxisymmetric endwall design approach and its com-putational assessment in the NGV of an HP turbine stage. Aerospace Sci Technol2015;47:456–66.
[14] Harvey N, Brennan G, Newman D, Rose M. Improving turbine efficiency using non-axisymmetric end walls: validation in the multi-row environment and with lowaspect ratio blading. In: ASME Turbo Expo 2002: power for land, sea, and air, 2002,ASME Paper GT2002-30337.
[15] Praisner TJ, Allen-Bradley E, Grover EA, Knezevici DC, Sjolander SA. Application ofnonaxisymmetric endwall contouring to conventional and high-lift turbine airfoils.J Turbomach 2013;135(6):061006–8.
[16] Schobeiri M. Turbomachinery flow physics and dynamic performance. Germany:Springer; 2005.
[17] Kadhim HT, Rona A. Perspectives on the treatment of secondary flows in axial
)b()a(
Inflow Inflow
Fig. 11. Entropy distributions at different axial planes through the rotor passage at off-design conditions: (a) axisymmetric casing, (b) contoured casing.
H.T. Kadhim, A. Rona Applied Energy 222 (2018) 830–839
838

turbines. Energy Proced 2017;142:1179–84.[18] Meroni A, Andreasen JG, Persico G, Haglind F. Optimization of organic Rankine
cycle power systems considering multistage axial turbine design. Appl Energy2018;209:339–54.
[19] Da Lio L, Manente G, Lazzaretto A. Predicting the optimum design of single stageaxial expanders in ORC systems: Is there a single efficiency map for differentworking fluids? Appl Energy 2016;167:44–58.
[20] Song Y, Sun X, Huang D. Preliminary design and performance analysis of a cen-trifugal turbine for Organic Rankine Cycle (ORC) applications. Energy2017;140:1239–51.
[21] Da Lio L, Manente G, Lazzaretto A. A mean-line model to predict the design effi-ciency of radial inflow turbines in organic Rankine cycle (ORC) systems. ApplEnergy 2017;205:187–209.
[22] Tang H, Liu S, Luo H. Design optimization of profiled endwall in a high work tur-bine. In: ASME Turbo Expo 2014: turbine technical conference and exposition,2014, ASME Paper GT2014-26190.
[23] Sun H, Li J, Song L, Feng Z. Non-axisymmetric turbine endwall aerodynamic op-timization design: Part I-Turbine cascade design and experimental validations. In:ASME Turbo Expo 2014: turbine technical conference and exposition, 2014, ASMEPaper GT2014-25362.
[24] Woudstra N, Van der Stelt T. Cycle-Tempo: a program for the thermodynamicanalysis and optimization of systems for the production of electricity, heat andrefrigeration. Energy Technology Section. Delft University of Technology; 2002.
[25] Obaida HMB. Cryogenic cycle power turbines optimised by hub contouring PhDthesis UK: University of Leicester; 2017.
[26] Turton RK. Principles of turbomachinery. London: Springer Science & BusinessMedia; 2012.
[27] Taremi F. Endwall flows in transonic turbine cascades PhD thesis Ottawa: CarletonUniversity; 2013.
[28] Wang S-S, Sun H, Di J, Mao J-R, Li J, Cai L-X. High-resolution measurement and
analysis of the transient secondary flow field in a turbine cascade. Proc Inst MechEng, Part A: J Power Energy 2014;228(7):799–812.
[29] Wilcox DC. Companion software: turbulence modeling for CFD, DCW IndustriesInc., 3rd ed. California; 2006.
[30] Kadhim HT, Rona A, Obaida HMB, Gostelow JP. Numerical study of the flow past anaxial turbine stator casing and perspectives for its management. In: ASME TurboExpo 2017: turbine technical conference and exposition, 2017, ASME PaperGT2107-63055.
[31] Kadhim HT, Rona A, Leschke K, Gostelow JP. Mitigating secondary flows in a 1½stage axial turbine by design a guide groove casing. In: 23rd ISABE conference,International Society of Air-breathing Engines, ISABE Paper 21351, 2017.
[32] Langston L. Secondary flows in axial turbines—a review. Ann New York Acad Sci2001;934(1):11–26.
[33] Roache PJ. Perspective: A method for uniform reporting of grid refinement studies.J Fluids Eng 1994;116(3):405–13.
[34] Wilcox DC. Turbulence modeling for CFD, DCW Industries Inc., 3rd ed. California;2006.
[35] Walraevens RE, Gallus HE. European research community on flow turbulence andcombustion; ERCOFTAC SIG on 3D turbomachinary flow preditions; Test Case 6: 1-1/2 stage axial flow turbine. In: Seminar and Workshop on 3D Turbomachinaryflow prediction; 1997.
[36] Gallus HE, Zeschky J. Secondary flow and losses in a turbine rotor at off-designconditions. In: Cieplne Maszyny Przepływowe (CMP); 1992.
[37] Restemeier M, Jeschke P, Guendogdu Y, Gier J. Numerical and experimental ana-lysis of the effect of variable blade row spacing in a subsonic axial turbine. JTurbomach 2013;135(2):021031–9.
[38] Boyce MP. Gas turbine engineering handbook. USA: Elsevier; 2011.[39] Meher-Homji CB, Zachary J, Bromley AF. Gas turbine fuels-system design, com-
bustion and operability. In: Proceedings of the 39th turbomachinery symposium,George R. Brown Convention Center, Houston, Texas; 2010. p. 4–7.
H.T. Kadhim, A. Rona Applied Energy 222 (2018) 830–839
839