of the northeastern united states section of ecology and
TRANSCRIPT
HYDROGEN ION SPECIATION IN THE ACID PRECIPITATION OF THE NORTHEASTERN UNITED STATES
JAMES N. GALLOWAY, GENE E. LIWNS, AND ERIC S. EDGERTON, Section of Ecology and Systematics, Cornell University, Ithaca, New York 14853.
ABSTRACT
The acidity of precipitation in rural, forested areas of the northeastern United States is dominated by the strong mineral acids, sulfuric and nitric. Weak acids have a negligible effect on the measured acidity (pH) of precipitation. These conclusions are based on total acidity titrations and detailed analysis of organic and inorganic components in precipitation.
INTRODUCTION
Precipitation in the northeastern U.S. has a mean pH of about 4 (Likens and Bormann 1974, Cogbill and Likens 1974). This phenomenon of high acidity is not unique to the U.S.; large areas of Scandinavia downwind of dense industrial complexes receive precipitation with a pH of 4 or lower (0d6n 1968, Granat 1972). Atmospheric C02 in equili- brium with precipitation would not be expected to produce a pH < 5.6 (Barrett and Brodin 1955). Thus it has been hypothesized that SO2 and NOX from the combustion of fossil fuels are precursors to strong acids in precipitation (Likens and Bormann 1974, Cogbill and Likens 1974, Od6n 196g, Granat 1972). This investigation, using detailed chemical analysis, describes the relative contribution of strong, weak and Bransted acids to the acidity of precipitation.
Acids are ions or molecules that can donate protons to a water system. The strength of their donating power determines the strength of the acid. A strong acid, such as HNO3, donates all of its protons to
'A contribution to the Hubbard Brook Ecosystem Study. Financial support was provided by the National Oceanic and Atmospheric Administra- tion and by the National Science Foundation. The Hubbard Brook Experimental Forest is operated by the U.S.D.A., Forest Service, Upper Darby, Pennsylvania.
solution. Therefore, when HN03 is added to water, it completely dis- sociates and there are only H+ and NO? ions present. The dissociation constant (Ka) of strong acids is much greater than one.
+ - - [H'I [NO;] HNO -> H + NO
3 <- 3 Ka - IHNO~I >> 1
At a pH value less than 5, many weak acids, such as H CO do not donate 3 3' all of their protons to a water system. Instead of dissociating com- pletely, as strong acids do, weak acids may only partially dissociate. Thus, in addition to dissociation products, weak acids also may have appreciable quantities of the undissociated acid in solution. As an example, the reactions for carbonic acid are as follows.
Note that the equilibrium constants are < 1, indicating that a large proportion of undissociated acid is present in solution.
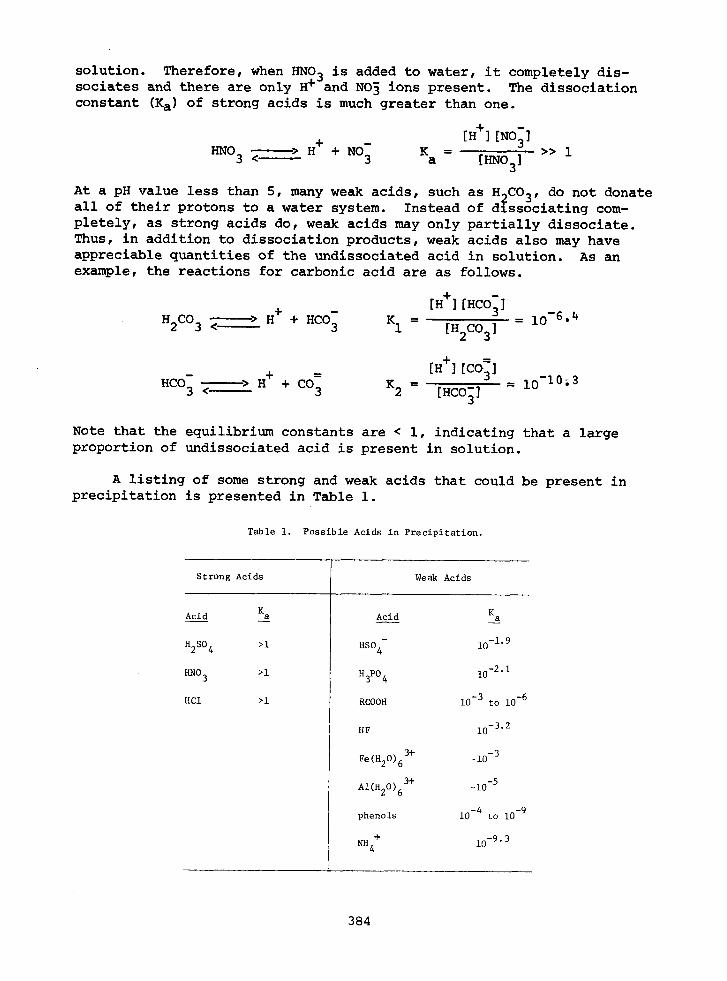
A listing of some strong and weak acids that could be present in precipitation is presented in Table 1.
Table 1. P o s s i b l e Acids i n P r e c i p i t a t i o n .
3+ Fe(H20)6
3+ A1(H20)6
phenols to
S t r o n g Acids
Acid - Ka
H2 4 > 1
m03 > 1
H C 1 > 1
Weak Acids
Acid K a -
- HS04 lo-l. 9
H3P04 10-2. 1
RCOOH to
H F 10-3. 2
In any water sample there are two types of acidity that can be measured, free and total. Free acidity (HF) is a measure of the con- centration of protons in solution, regardless of source. They could have originated from the dissociation of a strong or weak acid. Free acidity is determined by an electrode; the negative log of the proton concentration is termed pH. Total acidity is a measure of the total concentration of protons, both those in solution and those still undis- sociated. Total acidity (H~) is determined by titration, which is the quantitative addition of a strong base to a water system. The strong base is neutralized in direct proportion to the total amount of free and undissociated protons in the system. In a solution that has only strong acids in it, HF = HT. But in a system with strong and weak acids or just weak acids, HF < HT. A concept crucial to the understanding of the sources of free acidity in precipitation is that if HF < HTf it does not mean that the pH of precipitation is dominated by weak acids (Likens et al. 1976). The dissociation of weak acids is pH dependent, i.e. at lower pH's less of the weak acid dissociates (donates protons to a solution). As will be illustrated in this report, acid precipitation (pH < 5.6) is a mixture of strong and weak acids, but 1) because all the weak acids are in low concentration, 2) because all their dissociation constants are much less than unity (very weak acids) and 3) because most are only slightly dissociatedatpH < 5.6, they contribute primarily to the total acidity and negligibly to the free acidity.
ANALYTICAL METHODS
++ ++ + + The analyses for Ca , Mg , K and Na were performed on a Perkin-
Elmer Model 403 atomic absorption spectrophotometer. Appropriate amounts of lanthanum and HC1 were added to subsamples to avoid inter- ferences with the ~a++ and ~ g + + determinations. Standard procedures adapted and automated for use with a Technicon Autoanalyzer were used for analysis of NH$, NO:, SO^, POZ, ~ 1 - and dissolved silica. Ammonium was determined by an alkaline phenolhypochlorite method (Solorzano 19691, nitrate by hydrazine reduction (Kamphake et al. 1967), sulfate by color- metric measurement of a barium-thymol blue complex (Lazrus et al. 1968), chloride by the liberation of thiocyonate ion from mercuric thiocyonate in the presence of ferric iron (O'Brien 1962) and dissolved silica by reduction of silicomolybdate to heteropoly blue with aminonaphtholsul- fonic acid (Arner. Public Health Assoc. 1965). Phosphate was determined from a molybdenum blue complex after reduction with ascorbic acid in the presence of a small amount of antimony (Murphy and Riley 1962). Iron, aluminum and manganese were determined with a Perkin-Elmer 403 atomic absorption spectrophotometer, equipped with a HGA 2100 graphite furnace.
A modified method of Bulen et al. (1952) was used to assay organic acids in precipitation. The samples were heat concentrated to 1.0 ml, fixed onto 2 g of silicic acid, added to a column of 5.0 g silicic acid

and then eluted (in 5.0 ml fractions) according to the following chloroform-butanol schedule:
50 ml: 100% CHC13
75 ml: 98% CHC13
50 ml: 95% CHC13
75 ml: 85% CHC13
80 ml: 65% CHC13
60 ml: 55% CHC13
A standard chromatogram was generated with successive runs of known amounts of acids; the recoveries were quantitative, and the peak frac- tions between different runs varied by no more than f 1 fraction. One liter double-distilled water blanks were run identically to determine any laboratory background; no acids were found. Some of the acids that may be determined by this procedure are given in Table 2.
Table 2 . Organic Acid S tandards .
Monoprotic
b u t y r i c
p r o p i o n i c
a c e t i c
fo rmic
g l y c o l i c
l a c t i c
g l y c e r i c
c r o t o n i c
t r i c h l o r o a c e t i c
c h l o r o a c e t i c
c y a n o a c e t i c
p,m-hydroxy b e n z o i c
benzo ic
s a l i c y l i c
D i p r o t i c T r i p r o t i c
o x n l i c a c o n i t i c
malonic c i t r i c
s u c c i n i c i s o - c i t r i c
g l u t a r i c t r i m e s i c
a d i p i c
s e b a c i c
m a l i c
t a r t a r i c
c i t r a c o n i c
€ u r i c
male ic
i t a c o n i c
p h t h a l i c
mandel ic
g a l l i c

COLLECTION PROCEDURES FOR PReCIPITATION
Precipitation samples were collected in acid-washed containers, plastic for inorganic analysis and glass for organic analysis. Both bulk precipitation (wet and dry) and wet only precipitation were col- lected to determine the effect of dry deposition on the free and total acidity of precipitation. Samples were stored at 4 C until analyzed, usually less than one week for the inorganic constituents. Organic acids were analyzed immediately after individual storms. As shown by Galloway and Likens (1976) there is no significant change in the inor- ganic composition of precipitation samples when stored at 4 C if the pH of the sample is about 4.
Determination of free acidity (ambient pH) and total acidity (titrations to pH 9.0) were performed on a Sargent Welch PBL pH meter, equipped with a combination electrode. The measurement of pH with this system is accurate to 20.03 pH units, which introduces a 6-7% error in the determination of hydrogen ion concentration. Therefore, at pH 4.00 the hydrogen ion concentration would be 100 + 7 veq/L.
A three-port round bottom flask was used for the titrations. One port held the pH electrode, one held an aerator through which nitrogen flowed and the other was left open to add the titrant (NaOH). At all times a positive pressure of nitrogen in the flask excluded carbonic acid (H2C03) from the sample. This was done because all the precipita- tion samples that we have collected in the northeastern United States have been below pH 5.0. Since H2C03 does not contribute to the free acidity below pH 5, we excluded it so as not to mask other possible contributors. In addition, at pH's < 5.0, the dissolved H2C03 concen- tration is only 20 veq/R, but at the higher pH values encountered during a titration the total concentration of H CO increases by several orders
2. of magnitude if the sample is in equilibrium with the atmosphere. These relationships are illustrated in Figure 1, which shows the result of a titration of two aliquots of the same sample. The first aliquot (solid dots) was titrated without removing H2C03 from the system; the second aliquot (open circles) was titrated identically, but with all of the H2C03 removed by bubbling nitrogen through the sample prior to and during the titration. Thus the influence of H2C03 on the sample is removed, and the effect on the free acidity can be determined. The numerical values on Figure 1 give free acidity (HF, measured acidity) and total acidity (HTI titratable acidity) for the aliquots. The results of this experiment are summarized below:
1) Carbonic acid has no influence on the measured pH of this sample, and indeed has no effect on the measured pH of any aqueous sample below pH 5 that is in equilibrium with the atmosphere (Stumm and Morgan 1970).
2) The removal of H2C03 from the system, while having no effect on the free acidity, has a potentially large effect on the total titratable acidity when titrated to pH's > 5.0. This effect is variable due to the
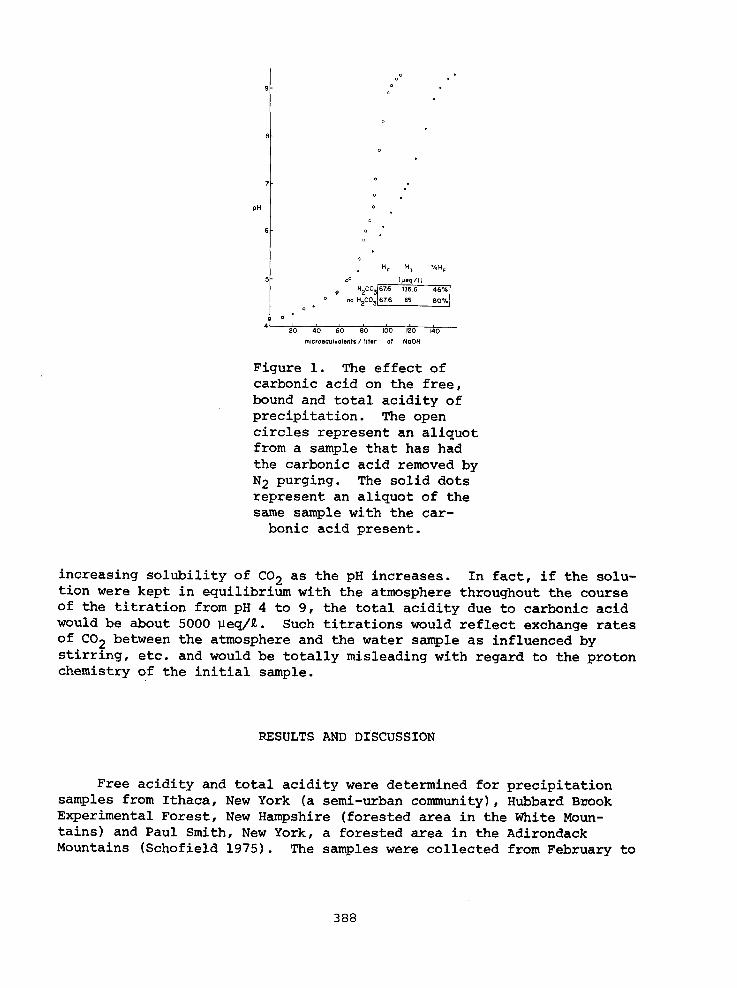
Figure 1. The effect of carbonic acid on the free, bound and total acidity of precipitation. The open circles represent an aliquot from a sample that has had the carbonic acid removed by N2 purging. The solid dots represent an aliquot of the same sample with the car- bonic acid present.
increasing solubility of C02 as the pH increases. In fact, if the solu- tion were kept in equilibrium with the atmosphere throughout the course of the titration from pH 4 to 9, the total acidity due to carbonic acid would be about 5000 veq/R. Such titrations would reflect exchange rates of C'02 between the atmosphere and the water sample as influenced by stirring, etc. and would be totally misleading with regard to the proton chemistry of the initial sample.
RESULTS AND DISCUSSION
Free acidity and total acidity were determined for precipitation samples from Ithaca, New York (a semi-urban community), Hubbard Bnook Experimental Forest, New Hampshire (forested area in the White Moun- tains) and Paul Smith, New York, a forested area in the Adirondack Mountains (Schofield 1975). The samples were collected from February to
May, 1975. From the results presented in Table 2, the following points are evident:
1) While the range of free acidities is similar in the rural areas and the semi-urban area, the amount of weak acids is significantly higher in the urban samples. Low pH's in both urban and rural areas characterize the regional phenomenon of acid precipitation, but the urban areas have additional amounts of materials (Fe, Al, particulates, organics) in their atmospheres that contribute to the total acidity, but not significantly to the free acidity. This is substantiated when the total and free acidities of bulk precipitation versus wet precipitation are compared from the same precipitation event. Dry precipitation con- tributes substantially to the weak acid concentration and therefore to the total acidity in four sets of bulk samples from the Ithaca area (Table 2). Moreover, in two of the cases, the dry precipitation neu- tralizes the free acidity that is found in wet precipitation.
2) It appears that once the influence of the urban atmosphere is removed, the concentration of weak acids in precipitation decreases sig- nificantly as shown in the Hubbard Brook and the Adirondack Mountain samples where the free acidity can be approximately equal to the total acidity.
3) Even with the carbonic acid removed, the semi-urban Ithaca samples have appreciable amounts of weak acids. It is important to determine whether these weak acids are contributing to the pH, or if they are completely undissociated at the pH of ambient precipitation and thus influence only the total acidity and not the free acidity. For this reason, we have analyzed for a series of weak acids in our precipi- tation samples (Table 3).
CARBONIC ACID
As shown in Table 3, this weak acid contributes to the total acidity but it has no influence on the free acidity of precipitation if the pH is below 5, as is the case in most of the precipitation events in the northeastern United States, especially in rural areas.
PARTICULATES
The influence of particulates on the acidity of precipitation is variable due to the large number of minerals that could be present. The particles that would have the greatest effect would be the clays because of their large cation exchange capacity.
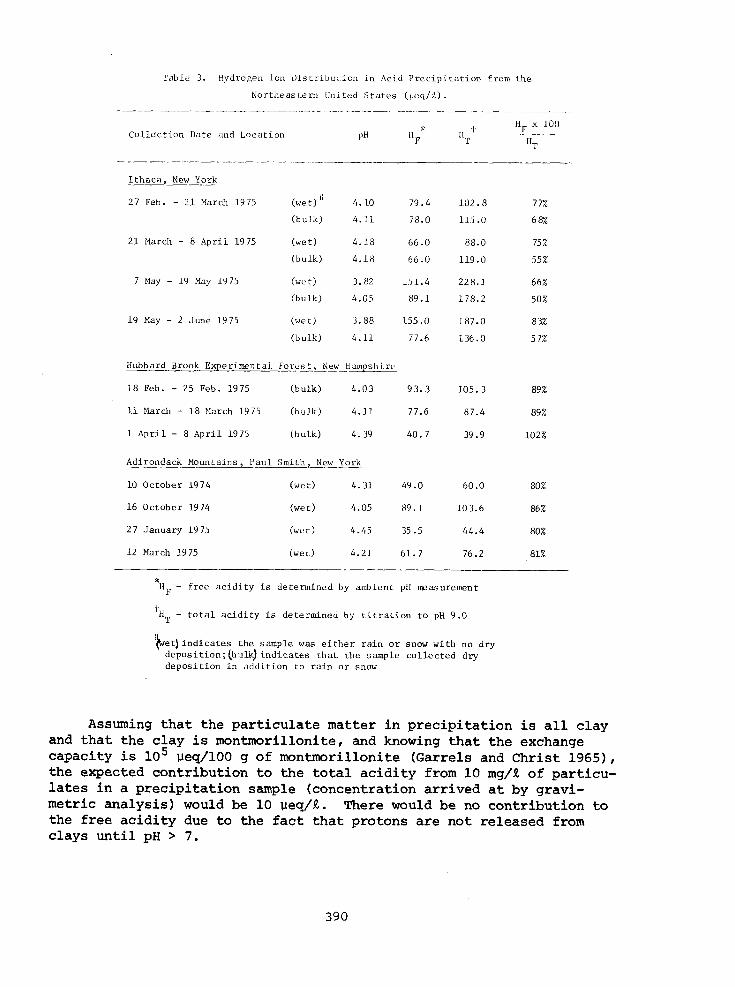
Tdble 3. Hydrogen 1011 D i s t r i b u t i o n i n Acid P r e c i p i t a t i o n from t h e
N o r t h e a s t e r n United S t a t e s (ueq /&) .
HF X 100 C o l l e c t i o n Date and Loca t ion pH x T t
H~
I t h a c a , New York
27 Feb. - 2 1 March 1975 ( w e t ) li 4.10 79.4 102 .8 7 7%
( b u l k ) 4.11 78.0 115.0 6 8%
2 1 March - 8 A p r i l 1975 (wet) 4 .18 66.0 88.0 75 %
(bu lk ) 4 . 1 8 66.0 119.0 55%
7 May - 19 May 1975 (wet) 3.82 151.4 228 .1 66%
(bu lk ) 4.05 89.1 178.2 50%
19 May - 2 June 1975 (wet) 3.88 155.0 187.0 8 3%
(bu lk ) 4.11 77.6 136 .0 5 7%
Hubbard Brook Exper imenta l F o r e s t , N e w Hampshis
1 8 Feb. - 25 Feb. 1975 (bu lk ) 4 .03 93 .3 105 .3 89 %
11 March - 1 8 March 1975 (bu lk ) 4.11 77.6 87.4 89%
1 A p r i l - 8 A p r i l 1975 (hu lk ) 4.39 40.7 39.9 102%
Adirondack Mountains , P a u l Smith, New York
10 Oc tober 1974 (wet) 4.31 49.0 60 .O 80%;
16 Oc tober 1974 (wet ) 4.05 89 .1 103.6 86 %
27 January 1975 (wet ) 4.45 35.5 44.4 80%
12 March 1975 (wet) 4.21 61.7 76.2 81%
* HF - f r e e a c i d i t y i s de te rmined by ambient pH measurement
'-H - t o t a l a c i d i t y i s de te rmined by t i t r a t i o n t o pH 9.0 T
b t ) i n d i c a t e s t h e sample was e i t h e r r a i n o r snow w i t h no dry d e p o s i t i o n ; (hulk) i n d i c a t e s t h a t t h e sample c o l l e c t e d d ry d e p o s i t i o n i n a d d i t i o n t o r a i n o r snow
Assuming that the particulate matter in precipitation is all clay and that the clay is montmorillonite, and knowing that the exchange capacity is lo5 veq/100 g of montmorillonite (Garrels and Christ 19651, the expected contribution to the total acidity from 10 mg/R of particu- lates in a precipitation sample (concentration arrived at by gravi- metric analysis) would be 10 peq/R. There would be no contribution to the free acidity due to the fact that protons are not released from clays until pH > 7.

+ AMMONIUM (NH4 )
In a titration to pH 9 the following reaction will occur above pH 8:
+ Approximately 30 to 50 percent of the ammonium (NH4) will become ammonia (NH3) by pH 9. If the titration were performed with nitrogen purging, then the reaction may go to completion, depending on the rate of ammonia stripping by the nitrogen stream. Therefore, if the original concentra- tion of ammonium in the sample is 30 peq/R, there will be a contribution of 10-30 peq/R to the total acidity. However, since ammonium does not begin to release protons until above pH 8, ammonium will have no effect on the free acidity.
ALUMINUM (A1 )
The concentration of dissolved aluminum in precipitation can vary from 1-4 pmoles/R. Because of the aquatic chemistry of aluminum, in a titration between pH 4-9, it has the capability to "consume" three times its molar concentrations of hydroxide ions. At pH 4 it exists primarily as ~l+++r and at pH 9 it exists as the A1(OHI3 soluble complex. Therefore, if the initial concentration was 2 pmoles/R, then the poten- tial contribution to the total acidity is 6 peq/R. As in the case of ammonium, although there is an influence on the total acidity, there is no influence on the free acidity.
IRON (Fe)
The aqueous chemistry of iron in a titration is similar to that of aluminum with the exception that iron will "consume" two equivalent amounts of hydroxide because at pH 4 it exists as the Fe(OH)++ complex, and at pH 9 it is present as the Fe(OHI3 soluble complex. Therefore, since the concentration of iron is about 1 pmole/R in precipitation, the possible contribution to the total acidity is only 2 peq/R, and there would be no contribution to the measured, free acidity.
MANGANESE (Mn)
Again, manganese is similar to the previous two metals in that it contributes a small amount to the total acidity and nothing to the free acidity. The concentration of manganese in precipitation is about 0.1 peq/R, and hence even its contribution to the total acidity is an order of magnitude less than that of iron.
SILICA (Si04)
As in the case of manganese the concentration of dissolved silica in precipitation (0.4 peq/R) is too low to have any noticeable effect on the total acidity and it will have none at all on the free acidity.
ORGANIC ACIDS (RCOOH)
We have investigated the influence of 45 organic acids (Table 2) on the free and total acidity of precipitation. On the samples analyzed to date (April 1975, winter and spring storms) we have found only organic acid (iso-citric) in precipitation and at a concentration so low as to contribute at most only 15% to the free acidity, depending on the con- centrations of other compounds (NH4, Al, etc.).
Using column chromatography, we have identified iso-citric acid in two precipitation samples. The concentration and identification of this acid was accomplished by comparing peak heights and retention times for known amounts of organic acids. Iso-citric acid is a triprotic acid with pK values estimated at 3.2, 4.7 and 5.5. Because pK values are not available in the literature, the above pK values were estimated from published values for citric acid, which differ from iso-citric acid in the placement of the hydroxy group, and tricarballylic acid which has the same number of carbons as citric and isocitric but has no hydroxy groups. These estimated Ka values are probably within a factor of two of the true values. Since we are only using the pK to determine ,which of the acid groups will be protonated below pH 5, the estimated values are adequate for that purpose.
Iso-citric acid was found in samples collected from 7 February to 27 February 1975 (17 peq/R was detected) and in the sample collected from 27 February to 10 March 1975 (37 peq/R).
The contribution to the free acidity of the sample by iso-citric acid (ICH3) can be calculated by solving the following equations.
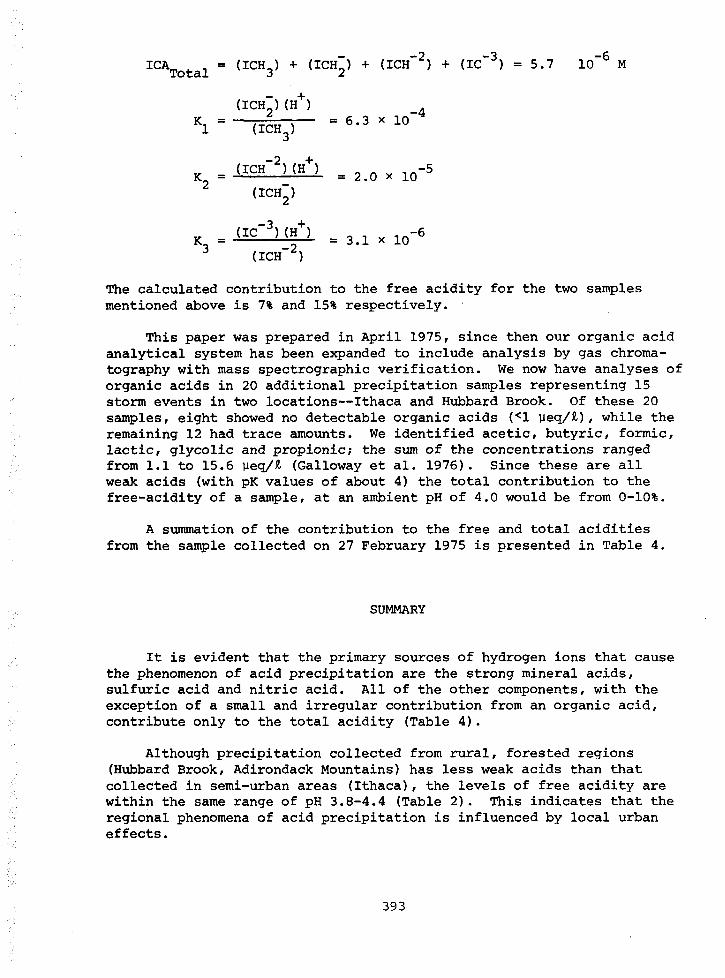
The calculated contribution to the free acidity for the two samples mentioned above is 7% and 15% respectively. .
This paper was prepared in April 1975, since then our organic acid analytical system has been expanded to include analysis by gas chroma- tography with mass spectrographic verification. We now have analyses of organic acids in 20 additional precipitation samples representing 15 storm events in two locations--1thaca and Hubbard Brook. Of these 20 samples, eight showed no detectable organic acids (<1 ~eq/R), while the remaining 12 had trace amounts. We identified acetic, butyric, formic, lactic, glycolic and propionic; the sum of the concentrations ranged from 1.1 to 15.6 peq/R (Galloway et al. 1976). Since these are all weak acids (with pK values of about 4) the total contribution to the free-acidity of a sample, at an ambient pH of 4.0 would be from 0-10%.
A summation of the contribution to the free and total acidities from the sample collected on 27 February 1975 is presented in Table 4.
SUMMARY
It is evident that the primary sources of hydrogen ions that cause the phenomenon of acid precipitation are the strong mineral acids, sulfuric acid and nitric acid. All of the other components, with the exception of a small and irregular contribution from an organic acid, contribute only to the total acidity (Table 4).
Although precipitation collected from rural, forested regions (Hubbard Brook, Adirondack Mountains) has less weak acids than that collected in semi-urban areas (Ithaca), the levels of free acidity are within the same range of pH 3.8-4.4 (Table 2) . This indicates that the regional phenomena of acid precipitation is influenced by local urban effects .

* Table 4. Sources of Acid i ty i n Acid P r e c i p i t a t i o n i n t h e
Nor theas te rn United S t a t e s
Concentrat ion i n Cont r ibu t ion t o Cont r ibu t ion t o P r e c i p i t a t i o n Free Acid i ty a t T o t a l Acid i ty i n
(mg/t) ** PH 4.19 (ueq/L) a T i t r a t i o n t o pH 9.0 (ueq/L)
H2C03 Clay
NH4 Al
Fe
Mn
RCOOH
TOTAL 64
* Sample c o l l e c t e d 27 February 1975 a t I t h a c a , New York.
** The t o t a l chemical composition is a s fol lows: H, 65 peq/L; Ca, 7.4 ueq/R;
Mg, 1.6 ueq/L; K , 0 .3 ueq/ i ; Na, 2 .1 ueq/L; NHq, 10.8 ueq1.C; Al, 4.0 peq/R; Fe, 2.6 peq/L; Mn, 0 . 1 u e q l t ; Sob, 58.2 ueq1.t; NO3, 36.4 peq/R; C1, 5.6 peq/L; PO4, 0.2 ueq/ i ; and d i s s o c i a t e d o r g a n i c a c i d , 5 ueq/ i . The i o n ba lance agrees w i t h i n lo%, which is t h e e q u i v a l e n t of 0.04 pH u n i t s .
*** H2CO-j was removed from system by N2 purging. I f t h e H2C03 was n o t removed and
t h e system was a t e q u i l i b r i u m w i t h the atmosphere, t h e r e would have been 5000 ueq/ i c o n t r i b u t i o n t o t o t a l a c i d i t y and no c o n t r i b u t i o n t o f r e e a c i d i t y i n a t i t r a t i o n t o pH 9.
his assumes t h a t a l l of t h e p a r t i c u l a t e is montmor i l lon i te ; most l i k e l y t h e c o n t r i b u t i o n t o t o t a l a c i d i t y is an o r d e r of magnitude l e s s than 5 ueq/ll because of minera l s o t h e r than montmor i l lon i te w i t h much lower exchange c a p a c i t i e s .
t'This assumes t h a t a l l of t h e N H ~ is converted t o NH3 which is subsequent ly removed by t h e N2 purge. The most l i k e l y va lue is between 4 and 11 peq/L.
tttThe c o n t r i b u t i o n t o t h e f r e e a c i d i t y is determined by a s t o i c h i o m e t r i c formation process i n which a s e a s a l t a n i o n i c component i s s u b t r a c t e d from t h e t o t a l anions (Cogbi l l and Likens 1974).
' ~ t pH 4.0, 1.5% of t h e t o t a l s u l f a t e is p r e s e n t as H S O ~ - ; thus t o t a l a c i d i t y f o r s u l f a t e is g r e a t e r than t h e f r e e a c i d i t y .
The inclusion of dry deposition in a precipitation sample can partially neutralize the free acidity and add substantial amounts of weak acids (Table 3).
REFERENCES
American Public Health Association et al. 1965. STANDARD METHODS FOR THE EXAMINATION OF WATER AND WASTE WATER. 12th ed. Amer. Public Health AssOC., Inc., New York. 626 pp.
Barrett, E. and G. Brodin. 1955. The acidity of Scandinavian precipi- tation. TELLUS 1, - 251-255.
Bulen, W. A., J. E. Varner and R. C. Burrell. 1952. Separation of organic acids from plant tissues. ANAL. CHEM. 24(1):187-190. -
Cogbill, C. V. and G. E. Likens. 1974. Acid precipitation in the northeastern United States. WATER RESOUR. RES. =(6):1133-1137.
Galloway, J. N. and G. E. Likens. 1976. Calibration of collection procedures for determination of precipitation chemistry. PROC. FIRST INTERNAT. SYMP. ON ACID PRECIPITATION AND THE FOREST ECOSYSTEM, May 1975, Columbus, Ohio. (In Press.)
Galloway, J. N., G. E. Likens and E. S. Edgerton. 1976. Acid precipi- tation in the northeastern United States: pH and acidity. SCIENCE. (In Press.)
Garrels, R. M. and C. L. Christ. 1965. Solutions, minerals and equilibria. HARPERS & ROW, New York. p. 271.
Granat, L. 1972. On the relation between pH and the chemical composi- tion in atmospheric precipitation. TELLUS a, 550-560.
Kamphake, L. J., S. A. Hannak and J. M. Cohen. 1967. Automated analyses for nitrate by hydrazine reduction. WATER RESEARCH - 1: 206-211.
Lazrus, A., E. Lorange and J. P. Lodge, Jr. 1968. New automated micro analyses for total inorganic fixed nitrogen and sulfate ion in water. ADV. CHEM. SER. 73, - Amer. Chem. Soc.
Likens, G. E. and F. H. Bormann. 1974. Acid rain: A serious regional environmental problem. SCIENCE m(4142) - :1176-1179.
Likens, G. E., N. M. Johnson, J. N. Galloway and F. H. Bormann. 1976. Acid precipitation: strong and weak acids. SCIENCE. (In Press.)
Murphy, J. and J. P. Riley. 1962. A modified single solution method for the determination of phosphate in natural waters. ANAL. CHEM. ACTA 27: - 30.
O'Brien, G. E. 1962. Automated analysis of chlorides in sewage. WASTE ENGR. a:670-672.
Oden, S. 1968. Nederbbrdens och Luftens Fbrsurning-dess Orsaker, Farlopp och Verkan I Olika ~iljijer. STATENS NATURVETENSKAPLIGA FORSKNINGS~D STOCKHOLM BULL. , A, 1-86.
Schofield, C. 1975. The precipitation samples from the Adirondack Mountains were collected and analyzed by Dr. Carl Schofield, Natural Resources Department, Cornell University, Ithaca, New York.
Solorzano, L. 1969. Determination of ammonia in natural waters by the phenolhypochlorite method. LIMNOL. OCEANOGR. u:799-801.
Stumm, W. and J. J. Morgan. 1970. Aquatic Chemistry. WILEY- INTERSCIENCE, p. 127.