of side friction in horizontal curve design: a margin of ... · pdf file1 use of side friction...
TRANSCRIPT

UseofSideFrictioninHorizontalCurveDesign:AMarginofSafety1
Assessment2
3
4 EricDonnell,Ph.D.,P.E.5 AssociateProfessor6 DepartmentofCivilandEnvironmentalEngineering7 ThePennsylvaniaStateUniversity8 231SackettBuilding9 UniversityPark,PA1680210 Phone:(814)863‐705311 E‐mail:[email protected] 13 JonathanWood14 Ph.D.Candidate15 DepartmentofCivilandEnvironmentalEngineering16 ThePennsylvaniaStateUniversity17 212SackettBuilding18 UniversityPark,PA1680219 Phone:(435)760‐278120 E‐mail:[email protected] 22 ScottHimes,Ph.D.23 TransportationAnalyst24 VanasseHangenBrustlin,Inc.(VHB)25 4000WestChaseBoulevard26 Suite53027 Raleigh,NC2760728 Phone:(919)334‐560829 E‐mail:[email protected] 31 DarrenTorbic,Ph.D.32 PrincipalTrafficEngineer33 MRIGlobal34 2332RavenHollowRoad35 StateCollege,PA1680136 Phone:(814)237‐883137 E‐mail:[email protected]
39
Numberofwordsinabstract:24740
Numberofwordsinnarrativeofpaper:4,70341
Numberoffiguresandtables:942
Numberofreferences:2143
44
Submittedforconsiderationto5thInternationalSymposiumonHighwayGeometricDesign45
Vancouver,BritishColumbia,Canada46
Re‐submittedonMarch20,201547
48
Abstract1
2
Currentengineeringpracticeusesapoint‐massmodeltodesignhorizontalcurveson3
highwaysandstreets.Inthismodel,amaximumsidefrictionfactorisused,incombination4
withtheselecteddesignspeedandmaximumrateofsuperelevation,todeterminethe5
minimumradiusofcurveforanalignment.Thelimitingvalueforsidefrictionusedin6
designwasestablishedinthe1940’sandisbasedondrivercomfortthresholds.Thelateral7
frictionavailableatthetire‐roadwayinterfaceisameasureoffrictionsupplyandis8
dependentonthepavementsurfacetypeandcondition,vehicleoperatingspeedand9
decelerationcharacteristics,vehiclelaneposition,andtiretype.Driversselectindividual10
operatingspeedsonaroadway,whichresultsinasidefrictiondemandwhentraversinga11
horizontalcurve.Thepurposeofthispaperisthreefold.First,keysidefrictionconceptsin12
horizontalcurvedesignaredescribed.Thisincludesdefinitionsof,andthefundamental13
principlesassociatedwiththeapplicationofsidefrictionfactorsinhorizontalcurvedesign14
policy.Thesecondpartofthepaperprovidesananalysisofthemarginofsafetythatexists15
inhorizontalcurvedesignpolicy.Thisanalysisconsidersvariousvehicletypes,pavement16
surfacetypes,andoperatingspeeddistributions.Comparisonsbetweenfrictionsupply,17
demand,anddesignsidefrictionfactorsaremadeinthissectionofthepaper.Thefinal18
objectiveofthepaperistodescribeaframeworktomoreeffectivelyconsiderthecurrent19
vehiclefleet,rangeofpavementconditions,andvehiclespeeddistributioninhorizontal20
curvedesignpolicy.21

1
INTRODUCTION1
2
GeometricdesignpolicyintheUnitedStates(U.S.)issetbytheAmericanAssociationof3
StateHighwayandTransportationOfficials’(AASHTO)APolicyonGeometricDesignof4
HighwaysandStreets,hereinreferredtoastheGreenBook.Thephysicsofuniformcircular5
motionwereusedtodevelophorizontalcurvedesign,whereavehicleisassumedto6
operateasapointmass.Asavehicletravelsahorizontalcurve,itundergoescentripetal7
accelerationequaltothesquareofthevehiclespeeddividedbytheradiusofthecurved8
path.Thisaccelerationisbalancedbyacombinationofsuperelevationandthefriction9
betweentheroadsurfaceandtiresofthevehicle.10
11
HorizontalcurvesdesignedinaccordancewithGreenBookcriteriahavebeengenerally12
showntoprovidesubstantialmarginsofsafetywithrespecttovehicleskiddingand13
rollover,forbothpassengercarsandtrucks(Harwoodetal.,1989;HarwoodandMason,14
1994;Harwoodetal.,2003).Previousresearch,however,hasconsideredfrictiondata15
measuredinthe1930’sand1940’s,whichwereusedtodeveloplimitingvaluesoffriction16
usedinhorizontalcurvedesignpolicy.Sincethen,thevehiclefleethaschanged17
considerably,ashastiredesign,pavementdesign,andfrictionmeasurementmethods.18
19
Tworecentresearchstudieswerecompletedthataffordedtheopportunitytocollect20
asphaltpavementsurfacefrictiondataontwo‐laneandmulti‐laneruralhighwaysinthe21
easternU.S.Thesestudiesalsoincludedprovisionstocollectpassengercarandtruck22
operatingspeeddataatthelocationswherefrictionmeasurementswererecorded.This23
paperpresentstire‐pavementfrictionplotsandcomparesthemtofrictiondemandderived24
fromtheoperatingspeeddataandpoint‐massmodel.Themarginsofsafetyagainst25
skiddingandrolloverforpassengercarsandtrucksarecomputedatvariousspeedswithin26
theoperatingspeeddistribution.27
28
Theremainderofthispaperisorganizedintofivesections.Thefirstprovidesbackground29
informationonthepoint‐massmodelanddefinesseveralkeytermsusedthroughoutthe30
manuscript.Thenextsectionprovidesbackgroundliteraturerelatedtofrictionconcepts,31
whichwasusedtoinformthedatacollectionmethodology.Then,thedatacollectioneffort32
andsitecharacteristicsaredescribedinthethirdsection.Thefourthsectiondescribesthe33
resultsofthefrictionsupplyanddemandcomparisons.Finally,thepaperconcludeswitha34
frameworktoreconsiderthehorizontalcurvedesignpolicyusedintheGreenBook.35
36
KEYTERMSANDHORIZONTALCURVEDESIGNCONCEPTS37
38
Thefollowingarealistofkeytermsanddefinitionsusedthroughoutthispaper:39
40
CentripetalAcceleration(ar):anobjectthatmovesinacircularpath(i.e.,horizontal41
curve)withaconstantspeedfollowsapathtangenttothecurve.Becausethevelocity42
vectorundergoesachangeindirection,theobject(i.e.,vehicle)undergoesanacceleration43
perpendiculartothepathandtowardthecenterofthehorizontalcurve.Thecentripetal44
2
accelerationisequaltothesquareofthevehiclespeeddividedbytheradiusofthecircular1
path.2
3
LateralAcceleration:atermusedbyhighwayengineersthatisequivalenttocentripetal4
accelerationforthepurposesofhorizontalcurvedesign.5
6
SideFrictionSupply(ftire‐pavement):frictionavailablebetweenthepavementsurfaceand7
vehicletirestopreventskiddingonahorizontalcurve,alsoreferredtoasthecoefficientof8
friction.Themaximumsidefrictionsupplyisutilizedwhenavehicleisatthepointof9
impendingskid.10
11
SideFrictionFactor(f):theunbalancedportionoflateralaccelerationortheportionof12
lateralaccelerationthatisnotbalancedbysuperelevation.Thesidefrictionfactor13
representsdemandsidefriction,andisalsoreferredtoasnetlateralaccelerationinthe14
point‐massmodel.15
16
RolloverThreshold(frollover):maximumlateralaccelerationthatavehiclecanexperience17
withoutoverturning.18
19
MaximumSideFriction(fmax):themaximumsidefrictiondemandsetforthinthe20
AASHTOGreenBookforuseinhorizontalcurvedesign.Themaximumsidefrictionisbased21
ondrivercomfortlevels(i.e.,toleranceforlateralacceleration),andisalsoreferredtoas22
thelimitingsidefrictionfactor.23
24
LateralFrictionMargin:thedifferencebetweentheavailabletire‐pavementfrictionand25
thefrictiondemandofthevehicleasittracksthecurve[i.e.,sidefrictionsupply(ftire‐26
pavement)–sidefrictionfactor(f)].Thisfrictionmarginrepresentstheadditionallateral27
accelerationthatavehiclecouldundergowithoutskidding.Apositivemarginindicatesa28
vehiclecanundergoadditionallateralaccelerationwithoutskidding,whileanegative29
marginindicatesthevehicletireswillskidgiventheleveloffrictionsuppliedbetweenthe30
tireandpavementfortheconditioninquestion.31 32
FromthebasiclawsofNewtonianphysics,considerapoint‐masstravelingalongacurved33
roadwaywithaconstantradius(R)andaconstantvelocity(V),asshowninFigure1.The34
pointmassundergoesacentripetalacceleration,whichactstowardsthecenterof35
curvature.Thecentripetalaccelerationis:36
37
(1)38
2
raV
R
3
1
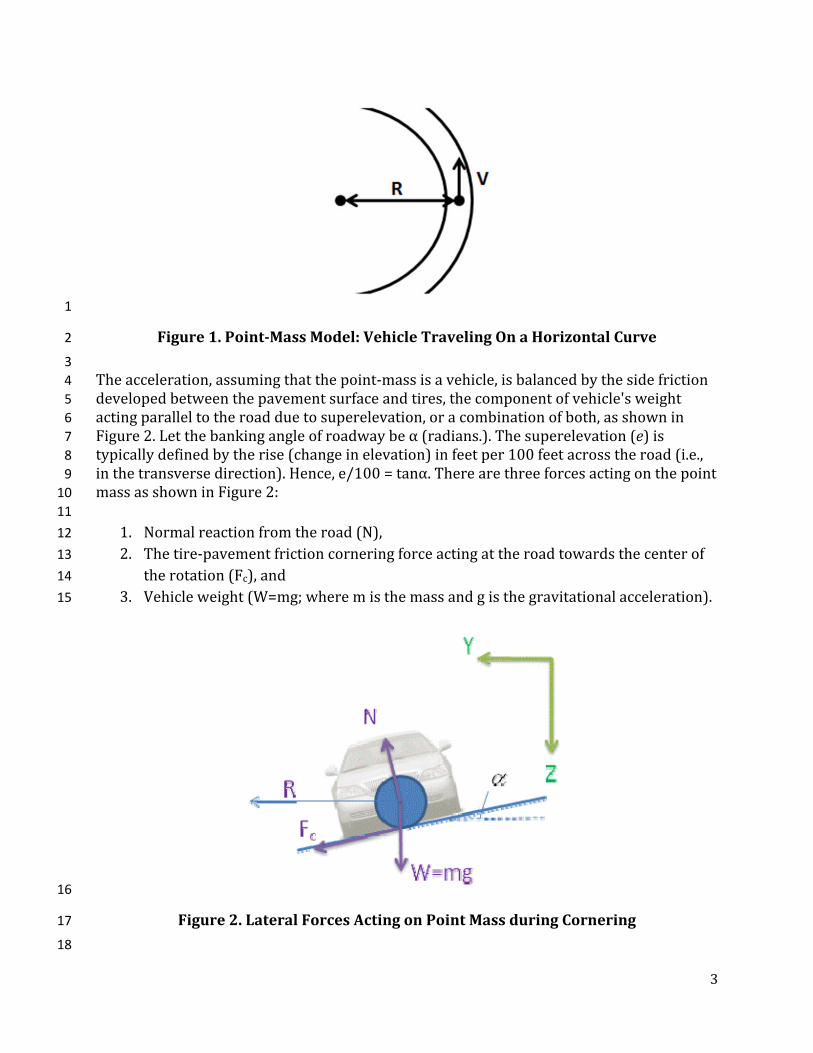
Figure1.Point‐MassModel:VehicleTravelingOnaHorizontalCurve2
3
Theacceleration,assumingthatthepoint‐massisavehicle,isbalancedbythesidefriction4
developedbetweenthepavementsurfaceandtires,thecomponentofvehicle'sweight5
actingparalleltotheroadduetosuperelevation,oracombinationofboth,asshownin6
Figure2.Letthebankingangleofroadwaybeα(radians.).Thesuperelevation(e)is7
typicallydefinedbytherise(changeinelevation)infeetper100feetacrosstheroad(i.e.,8
inthetransversedirection).Hence,e/100=tanα.Therearethreeforcesactingonthepoint9
massasshowninFigure2:10
11
1. Normalreactionfromtheroad(N),12
2. Thetire‐pavementfrictioncorneringforceactingattheroadtowardsthecenterof13
therotation(Fc),and14
3. Vehicleweight(W=mg;wheremisthemassandgisthegravitationalacceleration).15
16
Figure2.LateralForcesActingonPointMassduringCornering17
18
4
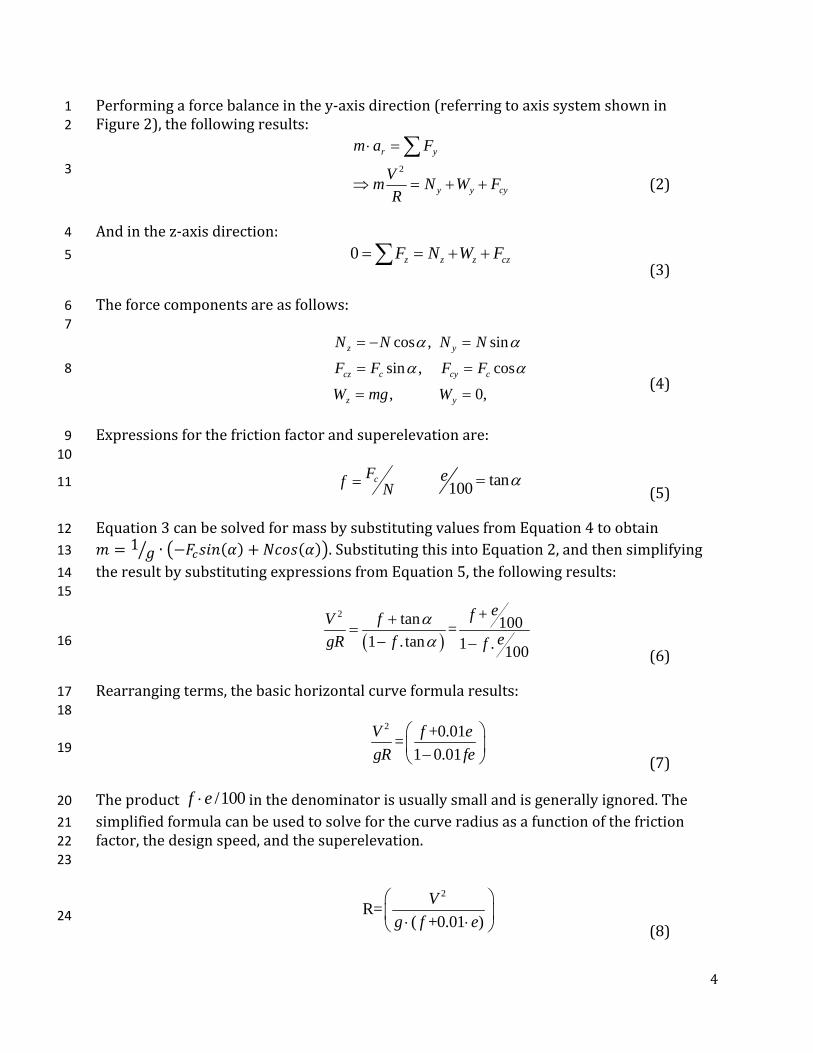
Performingaforcebalanceinthey‐axisdirection(referringtoaxissystemshownin1
Figure2),thefollowingresults:2
(2)3
Andinthez‐axisdirection:4
(3)5
Theforcecomponentsareasfollows:6
7
(4)8
Expressionsforthefrictionfactorandsuperelevationare:9
10
(5)11
Equation3canbesolvedformassbysubstitutingvaluesfromEquation4toobtain12 1 ∙ .SubstitutingthisintoEquation2,andthensimplifying13
theresultbysubstitutingexpressionsfromEquation5,thefollowingresults:14
15
(6)16
Rearrangingterms,thebasichorizontalcurveformularesults:17
18
(7)19
Theproduct inthedenominatorisusuallysmallandisgenerallyignored.The20
simplifiedformulacanbeusedtosolveforthecurveradiusasafunctionofthefriction21
factor,thedesignspeed,andthesuperelevation.22
23
(8)24
cyyy
yr
FWNR
Vm
Fam
2
czzzz FWNF0
,0,
cos,sin
sin,cos
yz
ccyccz
yz
WmgW
FFFF
NNNN
NFf c tan100
e
2 +tan 100=
1 . tan 1 . 100
efV fegR f f
2 +0.01=
1 0.01
V f e
gR fe
/100f e
2
R= ( +0.01 )
V
g f e

5
Thelimitingfactorforroaddesignisthesidefrictionfactorf.Also,thesuperelevationrate1
foracurvewillnotexceedamaximumvalueselectedbythedesigner,whichisoftenbased2
onregionalclimate(i.e.,locationsexperiencingregularsnoworicyconditionsinthewinter3
monthswilloftenhavelowermaximumratesofsuperelevationthanlocationsthathavea4
warmerclimate).Hence,foragivendesignspeedofaroadway,practicallowerlimitson5
theradiusofcurvature,Rmin,aregivenby:6
7
(9)8
Here,fmaxisthemaximumdemandsidefrictionfactorusedinhorizontalcurvedesign,and9
emaxisthemaximumsuperelevationrateforagivendesignspeed,VDS.AASHTOuses10
Equation9fordeterminingtheminimumradiusofcurvature.Thisusageisgenerally11
justifiedsinceitprovidesamoreconservativedesignthanEquation8.12
13
ThebasicsidefrictionformulacanbeobtainedbyrearrangingtermsinEquation8as14
follows:15
16
(10)17
InAASHTOpolicy,fiscalledthe“sidefrictionfactor”whichrepresentstheportionof18
lateralaccelerationthatisnotbalancedbysuperelevation.Thetermfrepresentsafriction19
“demand”whichmustberesistedbytheavailable“supply”offrictiongeneratedatthetire‐20
pavementinterface.Inaddition,theunbalancedlateralaccelerationcreatesanoverturning21
momentonthevehiclethatmustberesistedbythevehicle’srollstability,whichdepends22
onvehicledesign,loading,andsuspensioncharacteristics.Theterm“sidefrictionfactor,”as23
usedintheGreenBook,representsfrictiondemand,notfrictionsupply.24
25
AASHTOdesignpolicyforhorizontalcurvesisbasedontheassumptionthatthevalueoff26
canbedeterminedasafunctionofvehiclespeed,curveradius,andsuperelevation.An27
inherentassumptionisthatvehiclesfollowthecurvedpathexactly,yetthereisresearchto28
suggestthatdriverswillelongateahorizontalcurvewhileothersmaydriveasmaller29
radiusthantheactualcurveradius(WongandNicholson1992).30
31
Thetire‐pavementinterfacecansupplyfriction(ftire‐pavement)toresistthetendencyofthe32
vehicletoskidduetolateralaccelerationasthevehicletraversesacurvedpath.The33
pavementfrictiongeneratedatthetire‐pavementinterfaceisproportionaltothenormal34
loadtransmittedtothetirethroughthevehiclesuspensionwhichdependsontireand35
pavementproperties.Fromtheviewpointofapoint‐massmodel,thevehiclewillskidiff>36
ftire‐pavement,whereftire‐pavementrepresentsthemaximumamountoffrictionthatcanbe37
generatedatthetire‐pavementinterfacetocounteractlateralaccelerationandprevent38
skidding.39
40
maxmax
2
min 01.0 efg
VR DS
eRg
Vf DS
01.0
2

6
Similarly,fromtheviewpointofapoint‐massmodel,thevehiclewilloverturniff>frollover,1
wherefrolloverrepresentsthemaximumlateralaccelerationthatavehiclecanexperience2
withoutoverturning.frolloverisreferredtoasthe“rolloverthreshold”ofthevehicle.Rollover3
thresholdsareacharacteristicofvehicledesignandloadingthatcanbeestimatedfrom4
statictests,butarebestdeterminedfromdynamictests.5
6
TheGreenBookdesigncriteriaforhorizontalcurvesarenotbasedonanyformal7
assumptionsaboutthemagnitudesofftire‐pavementandfrollover.Rather,horizontalcurve8
designisbasedonlimitingthevalueofftobelessthanorequaltoaspecifiedvalue,fmax,9
whichhasbeenselectedbasedondrivercomfortlevels(i.e.,drivertoleranceforlateral10
acceleration).Afurtherassumption,statedbutnotexplicitlydemonstratedinAASHTO11
policy,isthatthevaluesoffmaxusedindesignhavebeenselectedsuchthatfmax<ftire‐pavement12
andfmax<frollover.Thefirstcriterion,fmax<ftire‐pavement,isaddressedinGreenBookFigures3‐13
4and3‐5,whichshowsthatthevaluesoffmaxusedindesignarelessthanthevaluesofftire‐14
pavement.Thesecondcriterion,fmax<frollover,isassertedbutnotdemonstratedintheGreen15
Book.Researchbyothers,includingHarwoodetal.(1989)andHarwoodetal.(2003)have16
shownthattheassumptionsoffmax<ftire‐pavementandfmax<frolloverdoappeartobegenerally17
applicabletobothpassengervehiclesandtrucksforhorizontalcurvesdesignedin18
accordancewithAASHTOpolicy.19
20
LITERATUREREVIEW21
22
Theliteraturereviewisorganizedintotwosections–thefirstdescribestire‐pavement23
frictionstudiesandthesecondsectiondescribesdrivercomfortthresholdstudies.24
25
FrictionStudies26
27
Thebasicsidefrictionformula(Equation10)providesanestimateofthesidefrictionfora28
vehiclemaneuveronahorizontalcurve.Oneoftheearlieststudiesonmeasuringthe29
coefficientoffriction(ftire‐pavement)atthepointofimpendingskidonaroadwaywasdoneby30
Moyer(1934).Theauthorfoundthat,ondryconcretesurfaces,theskiddingside(lateral)31
frictionlimitsrangedfrom1.01at5mphto0.89at30mphondryconcretepavements.On32
wetconcretesurfaces,thelimitsofsideskiddingfrictionrangedfrom0.78at5mphto0.6433
at30mph.34
35
Fancheretal.(1986)developedvaluesforthecoefficientofroadadhesion(ftire‐pavement)for36
differenttrucktiresondryandwetconcretepavementsat40mphspeeds.Theaverage37
skiddingfrictionwas0.54ondrysurfacesand0.47onwetsurfaces.Theaveragepeak38
frictiononadryconcretepavementwas0.76,whiletheaveragepeakfrictiononawet39
concretepavementwas0.64.40
41
Ithasalsobeenobservedthatfordrypavementsthereisnosignificantchangeinthetire‐42
pavementfrictionasspeedsincrease.Butthereisanoticeablechangeinfrictiononwet43

7
surfaces.Onwetpavements,themaximumandslidingfrictionhasbeenshown(Wong,1
2008)todecreaseby30percentormorebetween20and60mphforworntires.2
3
Finally,Lammetal.(1999)reportedthatlateralfrictionatthetire‐pavementinterfaceis4
about7.5percentsmallerthanthelongitudinalfriction.Thisinterrelationshipbetween5
lateralandlongitudinalforcesisreferredtoasthefrictionellipse,whichisdescribedin6
detailbyGillespie(1992).7
8
ComfortThresholds9
10
AkeyconsiderationinAASHTO'spolicyinselectingmaximumsidefrictionfactors(fmax)for11
useindesignistheleveloflateralaccelerationsufficienttocausedriverstoexperiencea12
feelingofdiscomfortandtoreactinstinctivelytoavoidhigherspeeds.Itisassumedthatat13
lowspeeds,driversaremoretoleranttodiscomfortandhencehighervaluesofsidefriction14
aresought.ThisassumptionisbasedonresearchconductedbyBarnett(1936),who15
definedthesafespeedas“...theminimumspeed,atwhichthecentrifugalforce,createdby16
themovementofthevehiclearoundthecurve,causesthedriverorpassengertofeelaside17
pitchoutward.”Inthiswork,900roadtestreportswerestudiedandthesidefriction18
factorwasobservedtolieinthe0.10‐0.20range.Barnettassumedatrendoftheside19
frictionfactorof0.16forspeedsof60mphandless,anda0.01decreaseforeach5mph20
furtherincreaseinthespeed.21
22
Theballbankindicatoristypicallyusedtomeasurelateralaccelerationstosetthedesign23
speedsonthecurvesthatwillavoiddiscomfort.Oneoftheearliestball‐bankindicator24
studieswasdonebyMoyerandBerry(1940).Theyrecommendedmaximumdesignside25
frictionfactorsof0.21forspeedsof20mphorlower,0.18forspeedsof25and30mph,26
and0.15forspeedsequaltoorgreaterthan35mph.27
28
29
Meyer(1949)recommendedthatagreatermarginofsafetyshouldbeusedathigher30
speedsthansuggestedbycomfortconsiderationsalone,recommendinganexponential31
curvetypevariationforsidefrictionvs.speeddata.StonexandNoble(1940)performed32
highspeedtestsonthePennsylvaniaTurnpike,recruitingskilleddriverstodetermineside33
frictionvaluesforuseindesign.Theauthors’recommendedamaximumsidefriction34
factorof0.10forhorizontaldesign.35
36
ItisunclearwhichofthestudieswereusedtodevelopfmaxvaluesintheGreenBook.The37
trendofsidefrictionfactor(f)vs.designspeed(V)showninFigure3‐6ofthemostcurrent38
policy(AASHTO,2011)indicatesthat,forspeedsabove45mph,themaximumdesignside39
frictionfactorisdecreasedataconstantrate,byavalueof0.01foreachadditional5mph40
asrecommendedbystudiesfromthe1940’s.Also,thecurvepassesthroughavalueof0.1041
at70mphasrecommendedbyStonexandNoble(1940).Forlow‐speeddesign(45mphor42
less),theAASHTOGreenBookmaximumsidefrictionfactors(fmax)usedindesignare43
basedonintersectioncurvefrictionconceptsdevelopedinthe1940’sand1950’s44
(Cysewski,1949;George,1952),whichindicatethatdrivercomfortthresholdsare45
8
significantlyhigheratlowspeedswhencomparedtohightravelspeeds.Wheneachof1
thesestudiesisconsideredinaggregate,itislikelythattheyhavecollectivelyshapedGreen2
Bookmaximumsidefrictionfactorsusedinhorizontalcurvedesign.3
4
DATACOLLECTIONANDANALYSISMETHODOLOGY5
6
Thissectionofthepaperdescribesthedatacollectionandanalysismethodsusedto7
developcomparisonsbetweenfrictionsupply(ftire‐pavement)andfrictiondemandorthe8
lateralfrictionfactor(f),whichwasderivedfromvehicleoperatingspeeddata.9
10
DataCollection11
12
FrictionMeasurements13
14
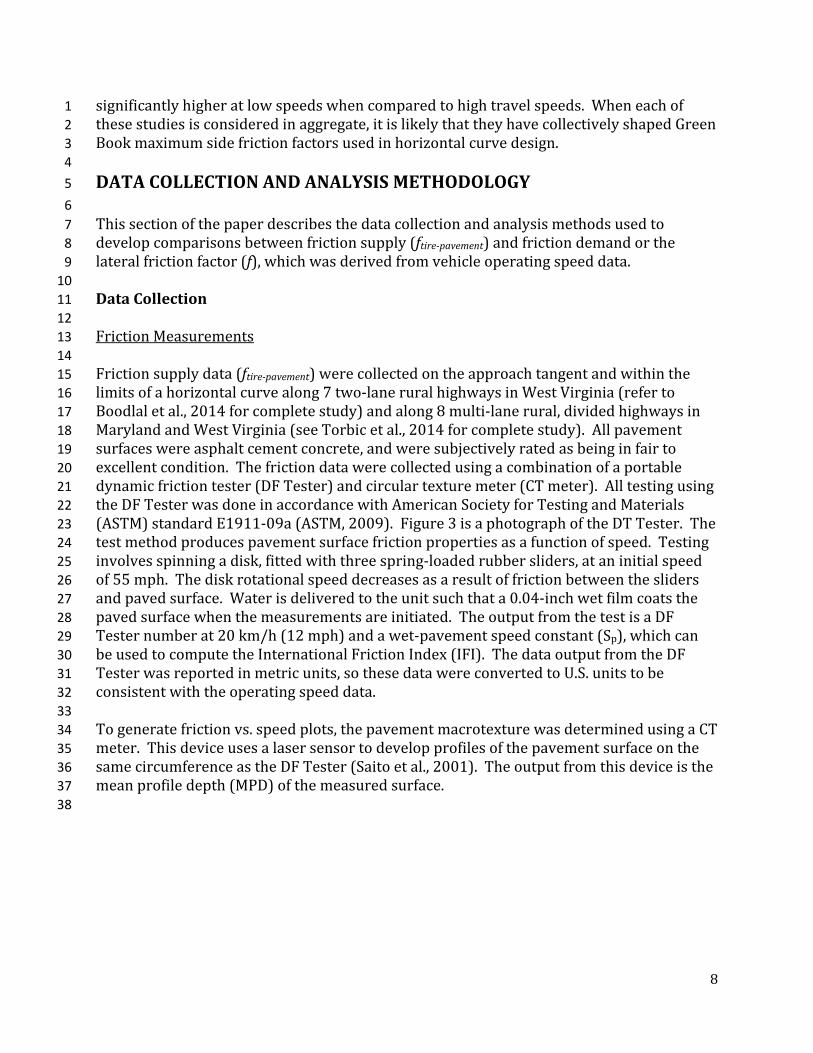
Frictionsupplydata(ftire‐pavement)werecollectedontheapproachtangentandwithinthe15
limitsofahorizontalcurvealong7two‐laneruralhighwaysinWestVirginia(referto16
Boodlaletal.,2014forcompletestudy)andalong8multi‐lanerural,dividedhighwaysin17
MarylandandWestVirginia(seeTorbicetal.,2014forcompletestudy).Allpavement18
surfaceswereasphaltcementconcrete,andweresubjectivelyratedasbeinginfairto19
excellentcondition.Thefrictiondatawerecollectedusingacombinationofaportable20
dynamicfrictiontester(DFTester)andcirculartexturemeter(CTmeter).Alltestingusing21
theDFTesterwasdoneinaccordancewithAmericanSocietyforTestingandMaterials22
(ASTM)standardE1911‐09a(ASTM,2009).Figure3isaphotographoftheDTTester.The23
testmethodproducespavementsurfacefrictionpropertiesasafunctionofspeed.Testing24
involvesspinningadisk,fittedwiththreespring‐loadedrubbersliders,ataninitialspeed25
of55mph.Thediskrotationalspeeddecreasesasaresultoffrictionbetweenthesliders26
andpavedsurface.Waterisdeliveredtotheunitsuchthata0.04‐inchwetfilmcoatsthe27
pavedsurfacewhenthemeasurementsareinitiated.TheoutputfromthetestisaDF28
Testernumberat20km/h(12mph)andawet‐pavementspeedconstant(Sp),whichcan29
beusedtocomputetheInternationalFrictionIndex(IFI).ThedataoutputfromtheDF30
Testerwasreportedinmetricunits,sothesedatawereconvertedtoU.S.unitstobe31
consistentwiththeoperatingspeeddata.32
33
Togeneratefrictionvs.speedplots,thepavementmacrotexturewasdeterminedusingaCT34
meter.Thisdeviceusesalasersensortodevelopprofilesofthepavementsurfaceonthe35
samecircumferenceastheDFTester(Saitoetal.,2001).Theoutputfromthisdeviceisthe36
meanprofiledepth(MPD)ofthemeasuredsurface.37
38

9
1
Figure3.DynamicFrictionTester2
3
Collectively,theDFTesterandCTMeterdatawereusedtodeterminethewetpavement4
frictionforall15datacollectionlocations.ASTME1960‐07(ASTM2011)recommendsthe5
followingstandardpracticetocalculateIFIofapavementsurface:6
7
MPDS p 7.892.14 (11)8
9
)/40exp(732.0081.060 20 pSDFTF (12)10
11
]/)60exp[(60 pSSFFS (13)12
13
where: Sp=speedconstantofwetpavementfriction14
MPD=meanprofiledepth(mm)15
F60=calibratedwetfrictionat60km/h16
DFT20=DFTnumberat20km/hperASTME191117
FS=frictionatanotherslipspeedS18
19
Thefrictionformulainequations(11)through(13)applytospeedsuptoapproximately20
50mph,thusvaluescomputedabovethisareextrapolationsabovethetypicalbounds.All21
frictionmeasurementswerecollectedatalocationthatcorrespondedtotheoutsidetire22
pathonhorizontalcurves.Thislocationisgenerallyconsideredtobewherethepavement23
ismostpolishedand,therefore,willsupplylessfrictionthantheinsidewheelpath.A24
typicalfrictionmeasurementprotocolisshowninFigure4.Onmulti‐lane,divided25
highways,theapproachtangenttothecurveincludedthreemeasurementlocations,while26
thecurveitselfincludedfourmeasurementlocations(PC,one‐thirdcurvelength,two‐27
thirdscurvelength,andPT).Threemeasurementswererecordedateachlocation,soa28
totalof12frictionmeasurementswererecordedwithinthecurvelimitsonmulti‐lanerural29
highways.Nofrictiondatacollectedontheapproachtangentwereusedinthisstudy.30
31
Ontwo‐laneruralhighways,thesamefrictionmeasurementprotocolwasused,onlytwo32
measurementswererecordedateachlocation.Assuch,therewereatotalof8friction33
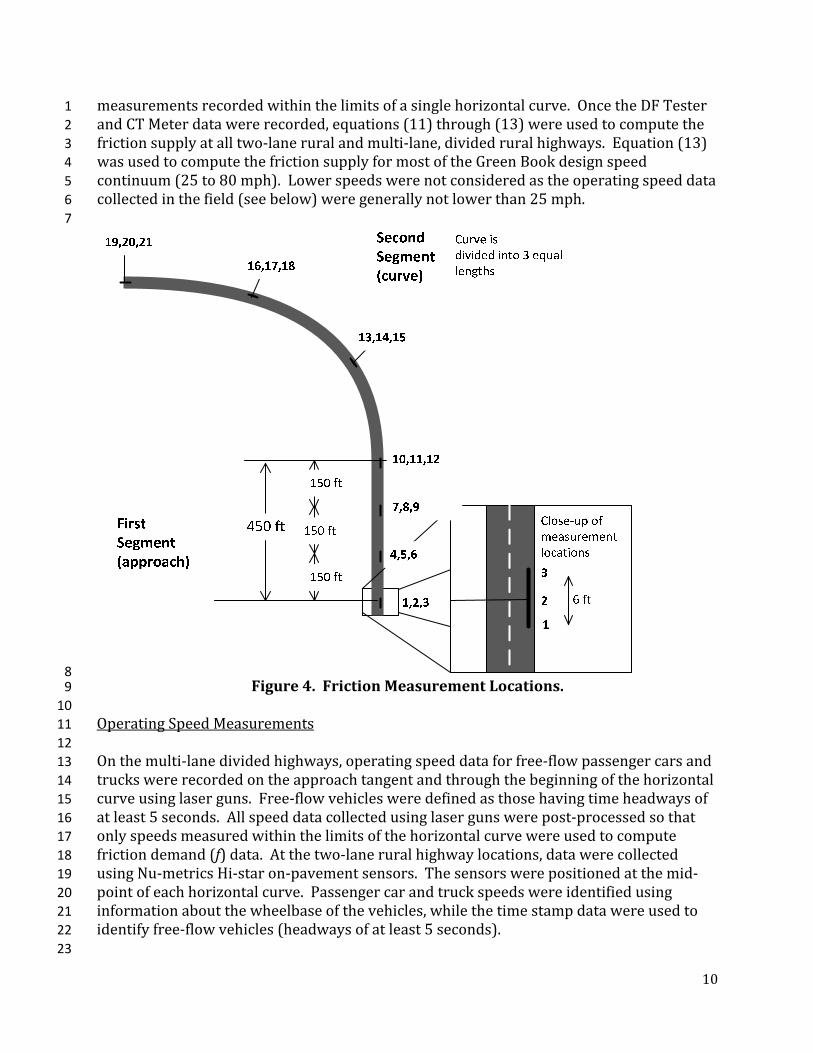
10
measurementsrecordedwithinthelimitsofasinglehorizontalcurve.OncetheDFTester1
andCTMeterdatawererecorded,equations(11)through(13)wereusedtocomputethe2
frictionsupplyatalltwo‐laneruralandmulti‐lane,dividedruralhighways.Equation(13)3
wasusedtocomputethefrictionsupplyformostoftheGreenBookdesignspeed4
continuum(25to80mph).Lowerspeedswerenotconsideredastheoperatingspeeddata5
collectedinthefield(seebelow)weregenerallynotlowerthan25mph.6
7
8 Figure4.FrictionMeasurementLocations.9
10
OperatingSpeedMeasurements11
12
Onthemulti‐lanedividedhighways,operatingspeeddataforfree‐flowpassengercarsand13
truckswererecordedontheapproachtangentandthroughthebeginningofthehorizontal14
curveusinglaserguns.Free‐flowvehiclesweredefinedasthosehavingtimeheadwaysof15
atleast5seconds.Allspeeddatacollectedusinglasergunswerepost‐processedsothat16
onlyspeedsmeasuredwithinthelimitsofthehorizontalcurvewereusedtocompute17
frictiondemand(f)data.Atthetwo‐laneruralhighwaylocations,datawerecollected18
usingNu‐metricsHi‐staron‐pavementsensors.Thesensorswerepositionedatthemid‐19
pointofeachhorizontalcurve.Passengercarandtruckspeedswereidentifiedusing20
informationaboutthewheelbaseofthevehicles,whilethetimestampdatawereusedto21
identifyfree‐flowvehicles(headwaysofatleast5seconds).22
23
11
SiteCharacteristicData1
2
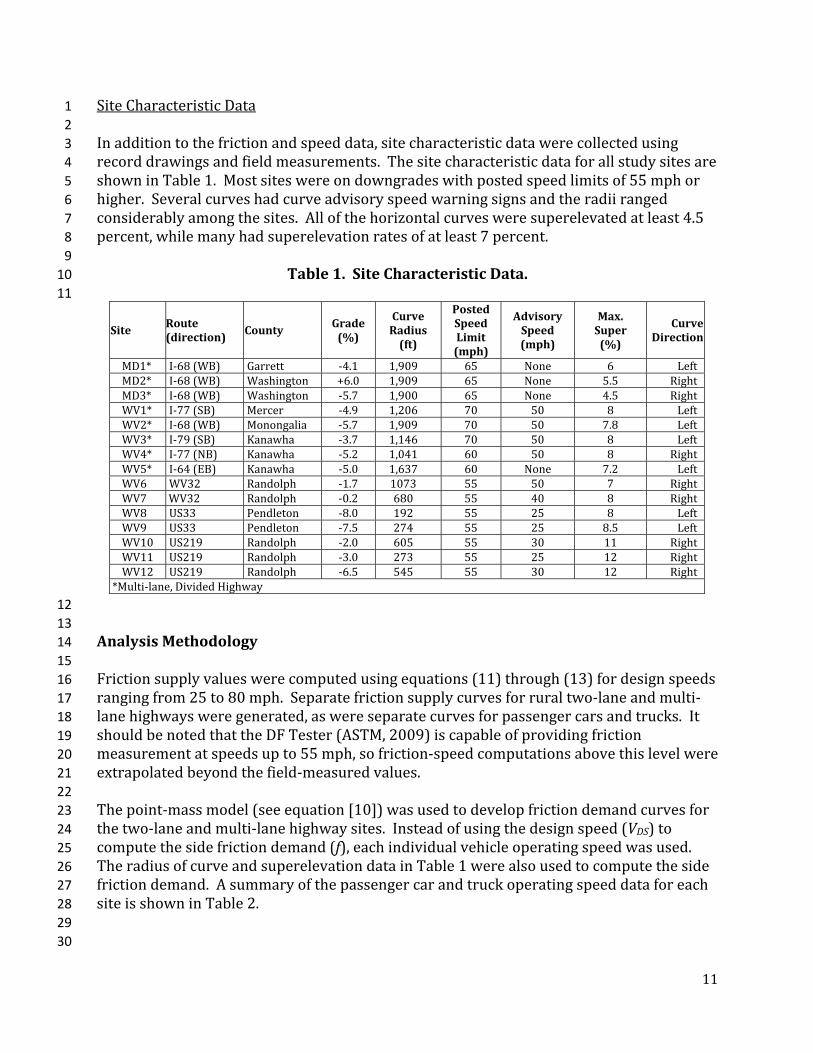
Inadditiontothefrictionandspeeddata,sitecharacteristicdatawerecollectedusing3
recorddrawingsandfieldmeasurements.Thesitecharacteristicdataforallstudysitesare4
showninTable1.Mostsiteswereondowngradeswithpostedspeedlimitsof55mphor5
higher.Severalcurveshadcurveadvisoryspeedwarningsignsandtheradiiranged6
considerablyamongthesites.Allofthehorizontalcurvesweresuperelevatedatleast4.57
percent,whilemanyhadsuperelevationratesofatleast7percent.8
9
Table1.SiteCharacteristicData.10
11
SiteRoute(direction)
CountyGrade(%)
CurveRadius(ft)
PostedSpeedLimit(mph)
AdvisorySpeed(mph)
Max.Super(%)
CurveDirection
MD1* I‐68(WB) Garrett ‐4.1 1,909 65 None 6 LeftMD2* I‐68(WB) Washington +6.0 1,909 65 None 5.5 RightMD3* I‐68(WB) Washington ‐5.7 1,900 65 None 4.5 RightWV1* I‐77(SB) Mercer ‐4.9 1,206 70 50 8 LeftWV2* I‐68(WB) Monongalia ‐5.7 1,909 70 50 7.8 LeftWV3* I‐79(SB) Kanawha ‐3.7 1,146 70 50 8 LeftWV4* I‐77(NB) Kanawha ‐5.2 1,041 60 50 8 RightWV5* I‐64(EB) Kanawha ‐5.0 1,637 60 None 7.2 LeftWV6 WV32 Randolph ‐1.7 1073 55 50 7 RightWV7 WV32 Randolph ‐0.2 680 55 40 8 RightWV8 US33 Pendleton ‐8.0 192 55 25 8 LeftWV9 US33 Pendleton ‐7.5 274 55 25 8.5 LeftWV10 US219 Randolph ‐2.0 605 55 30 11 RightWV11 US219 Randolph ‐3.0 273 55 25 12 RightWV12 US219 Randolph ‐6.5 545 55 30 12 Right
*Multi‐lane,DividedHighway
12
13
AnalysisMethodology14
15
Frictionsupplyvalueswerecomputedusingequations(11)through(13)fordesignspeeds16
rangingfrom25to80mph.Separatefrictionsupplycurvesforruraltwo‐laneandmulti‐17
lanehighwaysweregenerated,aswereseparatecurvesforpassengercarsandtrucks.It18
shouldbenotedthattheDFTester(ASTM,2009)iscapableofprovidingfriction19
measurementatspeedsupto55mph,sofriction‐speedcomputationsabovethislevelwere20
extrapolatedbeyondthefield‐measuredvalues.21
22
Thepoint‐massmodel(seeequation[10])wasusedtodevelopfrictiondemandcurvesfor23
thetwo‐laneandmulti‐lanehighwaysites.Insteadofusingthedesignspeed(VDS)to24
computethesidefrictiondemand(f),eachindividualvehicleoperatingspeedwasused.25
TheradiusofcurveandsuperelevationdatainTable1werealsousedtocomputetheside26
frictiondemand.Asummaryofthepassengercarandtruckoperatingspeeddataforeach27
siteisshowninTable2.28
29
30
12
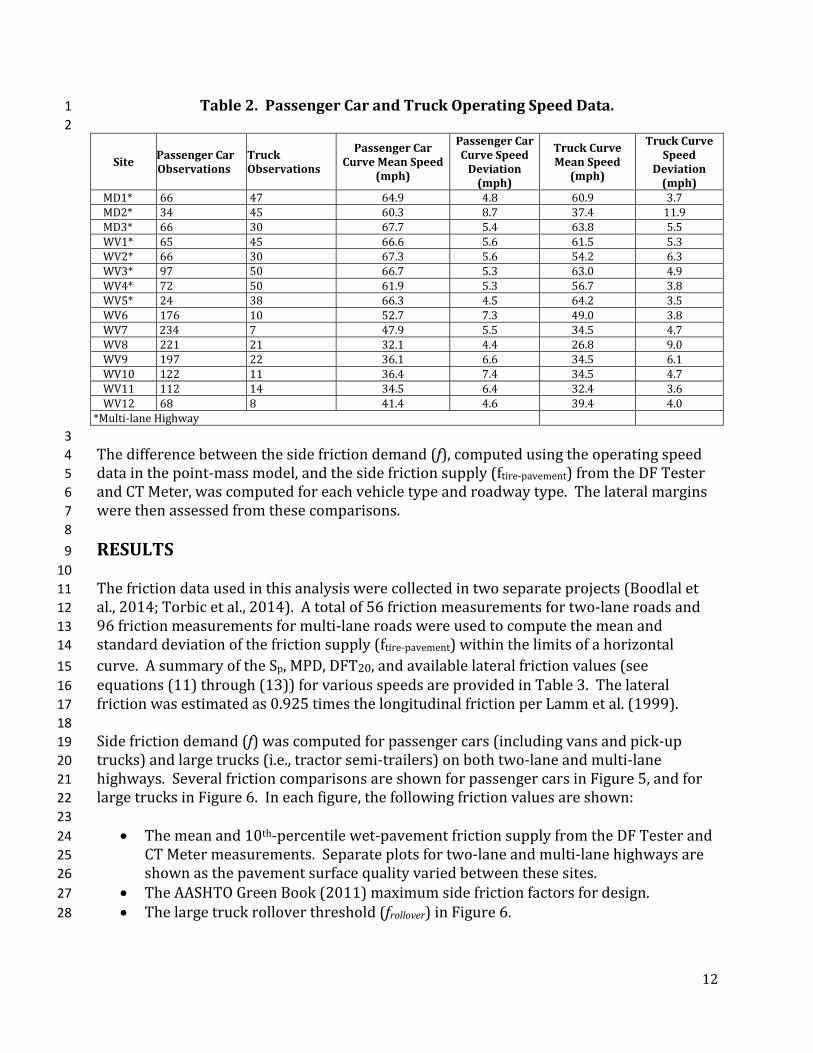
Table2.PassengerCarandTruckOperatingSpeedData.1
2
SitePassengerCarObservations
TruckObservations
PassengerCarCurveMeanSpeed
(mph)
PassengerCarCurveSpeedDeviation(mph)
TruckCurveMeanSpeed(mph)
TruckCurveSpeed
Deviation(mph)
MD1* 66 47 64.9 4.8 60.9 3.7MD2* 34 45 60.3 8.7 37.4 11.9MD3* 66 30 67.7 5.4 63.8 5.5WV1* 65 45 66.6 5.6 61.5 5.3WV2* 66 30 67.3 5.6 54.2 6.3WV3* 97 50 66.7 5.3 63.0 4.9WV4* 72 50 61.9 5.3 56.7 3.8WV5* 24 38 66.3 4.5 64.2 3.5WV6 176 10 52.7 7.3 49.0 3.8WV7 234 7 47.9 5.5 34.5 4.7WV8 221 21 32.1 4.4 26.8 9.0WV9 197 22 36.1 6.6 34.5 6.1WV10 122 11 36.4 7.4 34.5 4.7WV11 112 14 34.5 6.4 32.4 3.6WV12 68 8 41.4 4.6 39.4 4.0
*Multi‐laneHighway
3
Thedifferencebetweenthesidefrictiondemand(f),computedusingtheoperatingspeed4
datainthepoint‐massmodel,andthesidefrictionsupply(ftire‐pavement)fromtheDFTester5
andCTMeter,wascomputedforeachvehicletypeandroadwaytype.Thelateralmargins6
werethenassessedfromthesecomparisons.7
8
RESULTS9
10
Thefrictiondatausedinthisanalysiswerecollectedintwoseparateprojects(Boodlalet11
al.,2014;Torbicetal.,2014).Atotalof56frictionmeasurementsfortwo‐laneroadsand12
96frictionmeasurementsformulti‐laneroadswereusedtocomputethemeanand13
standarddeviationofthefrictionsupply(ftire‐pavement)withinthelimitsofahorizontal14
curve.AsummaryoftheSp,MPD,DFT20,andavailablelateralfrictionvalues(see15
equations(11)through(13))forvariousspeedsareprovidedinTable3.Thelateral16
frictionwasestimatedas0.925timesthelongitudinalfrictionperLammetal.(1999).17
18
Sidefrictiondemand(f)wascomputedforpassengercars(includingvansandpick‐up19
trucks)andlargetrucks(i.e.,tractorsemi‐trailers)onbothtwo‐laneandmulti‐lane20
highways.SeveralfrictioncomparisonsareshownforpassengercarsinFigure5,andfor21
largetrucksinFigure6.Ineachfigure,thefollowingfrictionvaluesareshown:22
23
Themeanand10th‐percentilewet‐pavementfrictionsupplyfromtheDFTesterand24
CTMetermeasurements.Separateplotsfortwo‐laneandmulti‐lanehighwaysare25
shownasthepavementsurfacequalityvariedbetweenthesesites.26
TheAASHTOGreenBook(2011)maximumsidefrictionfactorsfordesign.27
Thelargetruckrolloverthreshold(frollover)inFigure6.28
13
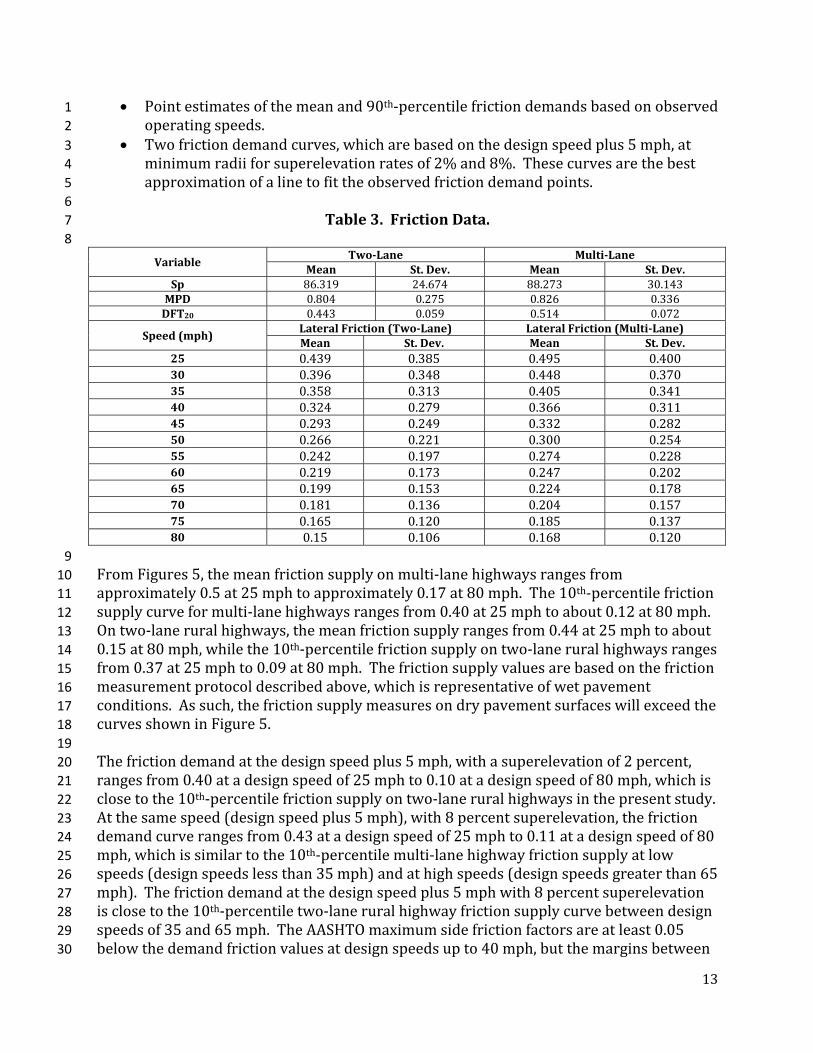
Pointestimatesofthemeanand90th‐percentilefrictiondemandsbasedonobserved1
operatingspeeds.2
Twofrictiondemandcurves,whicharebasedonthedesignspeedplus5mph,at3
minimumradiiforsuperelevationratesof2%and8%.Thesecurvesarethebest4
approximationofalinetofittheobservedfrictiondemandpoints.5
6
Table3.FrictionData.7
8
VariableTwo‐Lane Multi‐Lane
Mean St.Dev. Mean St.Dev.Sp 86.319 24.674 88.273 30.143MPD 0.804 0.275 0.826 0.336DFT20 0.443 0.059 0.514 0.072
Speed(mph)LateralFriction(Two‐Lane) LateralFriction(Multi‐Lane)Mean St.Dev. Mean St.Dev.
25 0.439 0.385 0.495 0.40030 0.396 0.348 0.448 0.37035 0.358 0.313 0.405 0.34140 0.324 0.279 0.366 0.31145 0.293 0.249 0.332 0.28250 0.266 0.221 0.300 0.25455 0.242 0.197 0.274 0.22860 0.219 0.173 0.247 0.20265 0.199 0.153 0.224 0.17870 0.181 0.136 0.204 0.15775 0.165 0.120 0.185 0.13780 0.15 0.106 0.168 0.120
9
FromFigures5,themeanfrictionsupplyonmulti‐lanehighwaysrangesfrom10
approximately0.5at25mphtoapproximately0.17at80mph.The10th‐percentilefriction11
supplycurveformulti‐lanehighwaysrangesfrom0.40at25mphtoabout0.12at80mph.12
Ontwo‐laneruralhighways,themeanfrictionsupplyrangesfrom0.44at25mphtoabout13
0.15at80mph,whilethe10th‐percentilefrictionsupplyontwo‐laneruralhighwaysranges14
from0.37at25mphto0.09at80mph.Thefrictionsupplyvaluesarebasedonthefriction15
measurementprotocoldescribedabove,whichisrepresentativeofwetpavement16
conditions.Assuch,thefrictionsupplymeasuresondrypavementsurfaceswillexceedthe17
curvesshowninFigure5.18
19
Thefrictiondemandatthedesignspeedplus5mph,withasuperelevationof2percent,20
rangesfrom0.40atadesignspeedof25mphto0.10atadesignspeedof80mph,whichis21
closetothe10th‐percentilefrictionsupplyontwo‐laneruralhighwaysinthepresentstudy.22
Atthesamespeed(designspeedplus5mph),with8percentsuperelevation,thefriction23
demandcurverangesfrom0.43atadesignspeedof25mphto0.11atadesignspeedof8024
mph,whichissimilartothe10th‐percentilemulti‐lanehighwayfrictionsupplyatlow25
speeds(designspeedslessthan35mph)andathighspeeds(designspeedsgreaterthan6526
mph).Thefrictiondemandatthedesignspeedplus5mphwith8percentsuperelevation27
isclosetothe10th‐percentiletwo‐laneruralhighwayfrictionsupplycurvebetweendesign28
speedsof35and65mph.TheAASHTOmaximumsidefrictionfactorsareatleast0.0529
belowthedemandfrictionvaluesatdesignspeedsupto40mph,butthemarginsbetween30

14
theAASHTOmaximumsidefrictionanddemandfrictioninthepresentstudyarenear1
equalatthehighestspeedsshowninFigure5.Thissuggeststhatpassengercardrivers2
travelnearthecomfortthresholdsusedintheAASHTOGreenBookhorizontalcurvedesign3
policyathigherdesignspeeds,butexceedcomfortthresholdsatlowerspeeds.4
5
ThetruckfrictionsupplyanddemandcurvesshowninFigure6aresimilartothosefor6
passengercarsinFigure5.Fordesignspeedslessthan45mph,therolloverthresholdfor7
largetrucksislowerthanthemeanfrictionsupplycurves,butexceedsthe10th‐percentile8
frictionsupplycurvesontwo‐laneandmulti‐lanehighways.Thefrictiondemandatthe9
designspeedplus5mph,witheightpercentsuperelevation,exceedsthelargetruck10
rolloverthresholdatdesignspeedslessthan30mph.Thefrictiondemandatthedesign11
speedplus5mph,with2percentsuperelevation,isnearlyequaltothelargetruckrollover12
thresholdatdesignspeedslessthan30mph.TheAASHTOmaximumsidefrictionfactors13
fordesignareslightlylowerthanthedemandfrictionvaluesathighspeeds,butare14
significantlylowerthanthedemandfrictionvaluesatlowerspeeds.15
16
Themeanfrictionsupplyonmulti‐lanehighwaysshowninFigure6exceedsthetruck17
rolloveratdesignspeedsequaltoorlowerthan35mph.Ontwo‐laneruralhighways,the18
meanfrictionsupplyexceedsthetruckrolloverthresholdatdesignspeedsof30mphor19
lower.The10th‐percentilefrictionsupplyontwo‐andmulti‐lanehighwaysisbelowthe20
truckrolloverthresholdatalldesignspeedsshowninFigure6.Thelateralmargins21
againstrolloverforlargetrucksrangefromapproximately0.10at35mphto22
approximately0.25at65mph,whencomparingthefrictiondemand(f)curvestothe23
rolloverthreshold.24
25
26

15
1 Figure5.FrictionSupplyandDemandforPassengerCars.2
0
0.05
0.1
0.15
0.2
0.25
0.3
0.35
0.4
0.45
0.5
25 35 45 55 65 75
Side Friction
Design Speed
Passenger Cars
Observed Mean Demand
Observed 90th Percentile Demand
Two‐Lane Friction Supply (Mean)
Two‐Lane Friction Supply (10th Percentile)
Multi‐Lane Friction Supply (Mean)
Multi‐Lane Friction Supply (10th Percentile)
AASHTO Maximum Friction
Demand @ Design Speed + 5 mph with 2% Superelevation
Demand @ Design Speed + 5 mph with 8% Superelevation

16
1 Figure6.FrictionSupplyandDemandforLargeTrucks.2
3
4
0
0.05
0.1
0.15
0.2
0.25
0.3
0.35
0.4
0.45
0.5
25 35 45 55 65 75
Side Friction
Design Speed
Large Trucks
Observed Mean Demand
Observed 90th Percentile Demand
Two‐Lane Friction Supply (Mean)
Two‐Lane Friction Supply (10th Percentile)
Multi‐Lane Friction Supply (Mean)
Multi‐Lane Friction Supply (10th Percentile)
Large Truck Rollover Threshold
AASHTO Maximum Friction
Demand @ Design Speed + 5 mph with 2% Superelevation
Demand @ Design Speed + 5 mph with 8% Superelevation
17
CONCLUSIONSANDRECOMMENDATIONSFORFUTUREWORK1
2
Conclusions3
4
Thispaperdescribesvariousfrictionconceptsusedinhorizontalcurvedesign,and5
comparesthelateralfrictionmarginsforvariousvehicletypesandoperatingspeedsto6
frictionsupplycurvesdevelopedbasedonfieldmeasurementsontwo‐laneandmulti‐lane7
ruralhighways.Itwasfoundthatdriverstravelatspeedsthatnearlyapproximate8
AASHTOmaximumsidefrictionfactorsonruralhighwayswithhighdesignspeeds(i.e.,9
greaterthan45mph).Atlowerdesignspeeds,however,theobservedfrictiondemandof10
driversinthepresentstudyoftenexceededtheAASHTOmaximumsidefrictionfactors11
usedinhorizontalcurvedesign.Itwasfoundthattheobservedfrictiondemand,which12
werebasedonspeedscollectedondrypavementconditions,wasgenerallyatleast0.0513
belowmeanfrictionsupplycurves(basedonwetpavementconditions)forpassengercars14
ontwo‐laneandmulti‐lanehighwaysincludedinthepresentstudy,exceptatlowdesign15
speeds,whentheobserved90th‐percentiledemandfrictionvaluesinsomecaseswere16
coincidentwithmeanfrictionsupplyvalues.Observeddemandfrictionvalueswerealmost17
alwaysatleast0.05belowmeanfrictionsupplycurvesatalldesignspeedsforlargetrucks18
ontwo‐andmulti‐lanehighwaysinthepresentstudy.Atlowdesignspeeds(35mphor19
less),itappearsthatlargetrucksaremorelikelytorolloverthanskidwhenfriction20
demandexceedsfrictionsupply.21
22
Thefrictionsupplylevelsmeasuredinthefieldindicatethatfrictionvariesbetweenrural23
two‐laneandmulti‐lanehighways.Itisassumedthatthisvariabilityistheresultof24
pavementsurfacedifferences.Passengercarsaremorelikelytoskidbeforerollingoveron25
horizontalcurves,whilelargetrucksaremorelikelytorolloveronhorizontalcurvebefore26
skiddingonlow‐speedroads.27
28
RecommendationsforFutureWork29
30
Thereareseverallimitationsofthepoint‐massmodelinhorizontalcurvedesign.These31
include:32
33
themodeldoesnotaccountfordifferencesinvehicledynamicsbetweenpassenger34
vehiclesandtrucks,andthemodelignorestireforcedifferencesbetweenthe35
front/rearorleft/righttiresofavehicle(i.e.,theforcesactingonalltiresare36
assumedtobethesame).37
themodelignoresthecombinedcharacteristicsofthehighwayalignmentsuchthat38
thehorizontalalignmentisdesignedinisolationwithoutaccountingforthe39
overlappingverticalalignment.40
thepoint‐massmodelassumesthatvehiclestraversecurvesfollowingapathof41
constantradiusequaltotheradiusofthecurve;however,itisunlikelythatvehicles42
willsteerthecurveinaconstantradius.43
thepoint‐massmodelassumesvehiclestraversethecurveataconstantspeedand44
doesnotconsiderspeedchanges.45

18
1
Futureresearchshouldconsiderhowthelateralmarginsofsafetyagainstskiddingand2
rolloverchangewhenconsideringmodelsthatconsiderthelimitationsofthepoint‐mass3
model.Examplesofalternativehorizontalcurvedesignmodelsincludethemodifiedpoint‐4
mass,whichconsidersverticalgrades;bicyclemodel(treatseachaxleofavehicle5
separately);or,amulti‐bodymodel(treatseachtireseparately).Futureresearchisalso6
recommendedtodeveloppavement‐frictionperformancecurves.Amethodologyto7
comparefrictiondemandtotheavailablesupplyisanalternativemethodtoassessthe8
lateralmarginsagainstskiddingandrollover.Finally,thelateralmarginsforpassenger9
carsandlargetrucksaresmallatlowdesignspeeds,thusfutureworkisneededto10
determineifrevisedgeometricdesigncriteriaforhorizontalcurvesareneededtolimitthe11
probabilityofskiddingorrolloveronsmallradiicurves.Thefrictiondemandobservedat12
highdesignspeedsapproximatelymatchedAASHTOmaximumsidefrictionfactors.Thus,13
thecomfortthresholdsusedtoestablishhigh‐speedhorizontalcurvedesigncriteriaappear14
tocloselyapproximatedriverspeedchoice.Futurefrictionassessmentsshouldseekto15
considerthedifferencesbetweenpassengercarandtrucktires,aswellaswetversusdry16
pavementdemandandsupplyconditions. 17

19
REFERENCES1
2
AmericanAssociationofStateHighwayandTransportationOfficials.APolicyonGeometric3
DesignofHighwaysandStreets,Washington,D.C.,2011.4
5
American Society for Testing andMaterials. StandardTestMethod forMeasuringPaved6
SurfaceFrictionalPropertiesUsingtheDynamicFrictionTester.ASTMInternationalE1911‐7
09a,WestConshohocken,PA,2009.8
9
AmericanSocietyforTestingandMaterials.StandardPracticeforCalculatingInternational10
FrictionIndexofaPavementSurface. ASTMInternationalE1960‐07,WestConshohocken,11
PA,2011.12
13
Barnett, J. SafeSideFrictionFactorsandSuperelevationDesign.HighwayResearchBoard14
16,Washington,D.C.,1936.15
16
Boodlal,L.,E.T.Donnell,R.J.Porter,D.Garimella,T.Le,K.Croshaw,S.Himes,P.Kulis,17
andJ.Wood.FactorsAffectingSpeedandSafetyonRuralandSuburbanRoads.Report18
No. KLS‐14‐001, Federal Highway Administration, McLean, VA, July 2014, 359 pp.19
(reportinpress)20
21
Cysewski,G.R. Urban IntersectionalRightTurningMovements. TrafficEngineering,Vol.22
20,No.1,October1949,pp.22‐37.23
24
Fancher, P.S., R.D. Ervin, C.B.Winkler, and T.D. Gillespie. AFactBook of theMechanical25
PropertiesoftheComponentsforSingle‐UnitandArticulatedHeavyTrucks.ReportNo.DOT26
HS 807 125, National Highway Traffic Safety Administration, U.S. Department of27
Transportation,Washington,D.C.,1986.28
29
Gillespie,T.FundamentalsofVehicleDynamics. SAE InternationalPress,Warrendale,PA,30
1992.31
32
George,L.E. CharacteristicsofLeft‐turningPassengerVehicles. HighwayResearchBoard33
31,Washington,D.C.,1952,pp.374‐385.34
35
Harwood,D.W.andJ.M.Mason.HorizontalCurveDesignforPassengerCarsandTrucks.36
TransportationResearchRecord 1445, Transportation Research Board,Washington, D.C.,37
1994.38
39
Harwood, D. W., J. M. Mason, W. D. Glauz, B. T. Kulakowski, and K.Fitzpatrick, Truck40
Characteristics for Use inHighway Design and Operation, Vol.I. Research Report. FHWA41
ReportFHWA‐RD‐89‐226,Washington,D.C.,1989.42
43
20
Harwood,D.W.,D.J.Torbic,K.R.Richard,W.D.Glauz,andL.Elefteriadou,NCHRPReport1
505:ReviewofTruckCharacteristicsasFactorsinRoadwayDesign.TransportationResearch2
Board,Washington,D.C.,2003.3
4
Lamm,R.,B.Psarianos,andT.Mailaender.HighwayDesignandTrafficSafetyEngineering5
Handbook.McGrawHillHandbooks,NewYork,NY,1999.6
7
Meyer,C.F.RouteSurveying,FirstEdition.InternationalTextbookCo.,Scranton,PA,1949.8
9
Moyer, R.A. Skidding Characteristics of Automobile Tires on Roadway Surfaces and Their10
Relation toHighway Safety. Bulletin No. 120, Ames, Iowa, Iowa Engineering Experiment11
Station,1934.12
13
Moyer,R.A.andD.S.Berry.MarkingHighwayCurveswithSafeSpeedIndicators.Highway14
ResearchBoard20,Washington,D.C.,1940.15
16
Saito,K.,A.Tamai,S.Kameyama,andS.Nisiyama.DevelopmentofTestersforMeasuring17
SkidResistanceandTextureofPavedSurfaces,andtheirApplicationforDeterminationof18
theInternationalFrictionIndex(IFI).JournaloftheEasternAsiaSocietyforTransportation19
Studies,Vol.4,No.1,October2001,pp.397‐411.20
21
Stonex,K.A.andC.A.Noble.CurveDesignandTestsonthePennsylvaniaTurnpike.Highway22
ResearchBoard20,HighwayResearchBoard,Washington,D.C.,1940.23
24
Torbic,D.J.,M.K.O’Laughlin,D.W.Harwood,K.M.Bauer,C.M.Bokenkroger,L.M.25
Lucas,J.R.Ronchetto,S.N.Brennan,E.T.Donnell,A.Brown,andT.Varunjikar.26
NCHRPReport774:SuperelevationCriteriaforSharpHorizontalCurvesonSteep27
Grades.NationalCooperativeHighwayResearchProgram,Washington,DC,2014.28
29
Wong,J.Y.,TheoryofGroundVehicles,JohnWileyandSons,Inc.2008.30
31
Wong,Y.andA.Nicholson.DriverBehavioratHorizontalCurves:RiskCompensationand32
theMarginofSafety.AccidentAnalysisandPrevention,Vol.24,No.4,1992,pp.425‐436.33