of sa349/2 flight test data with a comprehensive rotorcraft model … · flight test data with a...
TRANSCRIPT

- ' A
NASA Technical Memorandum 88351 - U
Correlation of SA349/2 Helicopter Flight Test Data with a Comprehensive Rotorcraft Model Gloria K. Yamauchi, Ruth M. Heffernan, and Michel Gaubert
(NASA-TH-8835 1) COBRELATICN C€ SA349/2 NB 3- 17692 h E L I C C P I E B FLIGHT-TESI X A T A Wllh A CCBPBEHENSIVE RCSOPCRAfl H C D E I (BASIL) 55 p
CSCL 01c Unclas G3/05 43359
February 1987
National Aeronautics and Space Administration
https://ntrs.nasa.gov/search.jsp?R=19870008259 2018-10-09T12:42:43+00:00Z
NASA Technical Memorandum 88351
Correlation of SA34912 Helicopter Flight Test Data with a Comprehensive Rotorcraft Model Gloria K. Yamauchi, Ruth M. Heffernan, Ames Research Center, Moffett Field, California Michel Gaubert, Aerospatiale-Division Helicopters, Marignane, France
February 1987
National Aeronautics and Space Administration
Ames Research Center Moffett Field, California 94035

Note - This report is a modified version of the paper (same title)
presented at the Twelfth European Rotorcraft Forum, September 22-25, 1986, Garmisch-Partenkirchen, Federal Republic of Germany. Errors in the blade section radius of gyration distribution used by the analysis have been corrected. Also, corrections to the measured pressure data have been made.
i i i

CORRELATION OF SA349/2 HELICOPTER FLIGHT-TEST DATA WITH A COMPREHENSIVE ROTORCRAFT MODEL
Gloria K. Ym,auchi and Ruth M. Heffernan NASA Ames Research Center
Moffett Field, California, U.S.A.
and
Michel Gaubert Aerospatiale - Division Helicopteres
Marignane, France
Abstract
A comprehensive rotorcraft analysis model was used to predict blade aerodynamic and structural loads for comparison with flight test data. The data were obtained from an SA349/2 helicopter with an advanced geometry rotor. Sensitivity of the correlation to wake geom- etry, blade dynamics, and blade aerodynamic effects was investigated. Blade chordwise pressure coefficients were predicted for the blade transonic regimes using the model coupled with two finite-difference codes.
c.g. center of gravity
C, blade section lift coefficient
blade section normal force coefficient Cn
blade chordwise surface pressure coefficient cP CT/u ratio of rotor thrust coefficient to solidity
r blade radial station
R rotor radius
rc/c ratio of tip vortex core size to blade chord
a blade angle of attack
0 tine derivative of blade arigie of attack
?J advance ratio
J, rotor blade azimuth station
1
1 . INTRODUCTION
A joint rotorcraft research program has been established between the National Aeronautics and Space Administration (NASA) and the French Ministry of Defense. The purpose of the program is to correlate the NASA prediction code Comprehensive Analytical Model of Rotorcraft Aero- dynamics and Dynamics (CAMRAD) with flight test data from the French SA349/2 Helicopter and an advanced geometry rotor system.
Structural and aerodynamic loads and performance were measured for several thrust levels and advance ratios. From the flight envelope, 16 flight conditions were selected by NASA and Aerospatiale for documen- tation. chosen for detailed correlation with CAMRAD. These conditions provided an opportunity to exercise various modeling features within CAMRAD.
In addition, data from three of these flight conditions were
The pressure data from this flight test are a valuable addition to the limited data base of helicopter rotor blade pressures in forward flight, especially in the transonic regime. Predictions of shock forma- tions near blade tips using CAMRAD coupled with a finite-difference code have been restricted to comparisons with several model rotor data sets using rigid blades (described in Ref. 1). Chordwise pressure compari- sons presented here aid in further validating the coupling procedure.
The flight test, the comprehensive model, the assumptions and approximations in modeling the aircraft and rotor in CAMRAD, and the resulting theoretical predictions compared with the data are described in this paper. Finally, recommendations for improving the correlation are given.
2. AIRCRAFT DESCRIPTION
The flight tests were performed on an Aerospatiale Gazelle SA349/2 helicopter (Fig. 1) dedicated to experimental research. The SA349/2 belongs to the Gazelle family of helicopters, but differs some- what from the 342 line of aircraft. The SA349/2 includes a comprehen- sive on-board data acquisition system. Table 1 provides general char- acteristics of the helicopter. For this flight test program, the aircraft was fitted with the Aerospatiale advanced geometry rotor. The rotor includes the classical articulated Non Articule en Trainee (NAT) hub (Fig. 2) and three research Grande Vitesse (GV) blades. The NAT hub, which is the standard Gazelle hub, is fully articulated and has a lag damper with nonlinear characteristics (stiffness and damping).
The CV blades were developed to achieve a better understanding of rotor aerodynamics and dynamics. OA209 advanced airfoils (9% thickness), a removable tip, and an adjust- able blade section c.g. location. For this flight test, a rectangular tip and a blade c.g. location of 24.7% chord were used. airfoil is discussed in Ref. 2. The twist distribution (Fig. 3b) is
Features of the blades are (Fig. 3)
The OA209
2

constant at the tip, linear on the main part of the blade, and varies 11.5 degrees from the root to the first airfoiled section.
The tail rotor for the SA349/2 is a Fenestron. The Fenestron is a shrouded 13-bladed rotor with one control input (collective pitch control).
Detailed technical data on the aircraft and rotors are available from Ref. 3.
3. FLIGHT TEST INSTRUMENTATION
The rotating frame instrumentation included both blade pressure transducers and strain gages. loads and flap and lag angle were also available.
Strain gages for measuring pitch-link
The blade pressure data analyzed in this paper were obtained from
Three groups of 20 chordwise transducers (upper and lower 51 pressure transducers distributed between two blades, as shown in Fig. 4. surface) were located at 75%, 88%, and 97% radial stations. The number of functional transducers were 18, 15, and 18 for 75$, 885, and 97% radial station, respectively.
The blade structural data in this paper were obtained from 15 strain gages, also shown in Fig. 4. The gages (four flap-bending, seven lag-bending, and four torsion gages) are located at eight radial sta- tions on two blades. Data from additional blade strain gage instrumenta- tion installed on these two blades were not recorded because of slip- ring limitations.
Instrumentation in the fixed frame included strain gages on the primary rotor control system servos and main gear box struts. copilot seat vertical acceleration were also measured. flight condition parameters were recorded: ture, altitude, velocity, static temperature (in flight), static pres- sure (in flight), collective pitch stick position, lateral and longi- tudinal cyclic pitch stick position, load factor, rotor speed, sideslip angle, aircraft pitch, roll and yaw speed, engine power and fuel consumption.
Pilot and
ground pressure and tempera- The following
4. DATA REDUCTION
A total of 18 consecutive rotor revolutions were required to obtain all of the blade pressure data. Data from each of the three groups of 20 pressure transducers were acquired as time-histories over a period of six consecutive rotor revolutions (starting from 0 degrees azimuth). 180 samples/rotor revolution. cal units and transformed into aerodynamic coefficients. The strain gage signals were obtained as harmonic analysis coefficients (10 harmon- ics) calculated for one rotor revolution.
The pressure signals were digitized at a frequency of The data were then converted into physi-
The blade strain gage data
3
were acquired during one of the 18 revolutions of pressure data acquisi- tion. The blade strain gage data were next transformed into blade- bending and torsional moments after accounting for the blade weight contribution and flap/lag/torsion interaction components. Figure 5 illustrates the data reduction procedure.
5. FLIGHT CONDITIONS
Various operating conditions were included in the orignal flight test envelope: ( 1 ) hover out-of-ground-effect; (2) level flights at 305 m, 1524 m, and 3048 m ( 1000 ft, 5000 ft, and 10000 ft) with speeds from 100 km/hr to 300 km/hr; ( 3 ) steady turns at 305 m, 1524 m, and 3048 m (1000 ft, 5000 ft, and 10000 ft) corresponding to a range of load factor from 1.4 to 2.0; ( 4 ) autorotation at 200 km/hr; and ( 5 ) high speed dive at 350 km/hr.
From this flight envelope, 16 flight points were chosen for docu- mentation purposes. advance ratios (0.13 < u < 0.36) and thrust-to-solidity ratios (0.062 < CT/a < 0.1331, as shown in Fig. 6. The data are documented in Ref. 3; in addition, further details of the flight test instrumentation and data reduction process are explained in Ref. 3.
The selected points provide a large range of
6. DESCRIPTION OF THE COMPREHENSIVE ROTORCRAFT MODEL
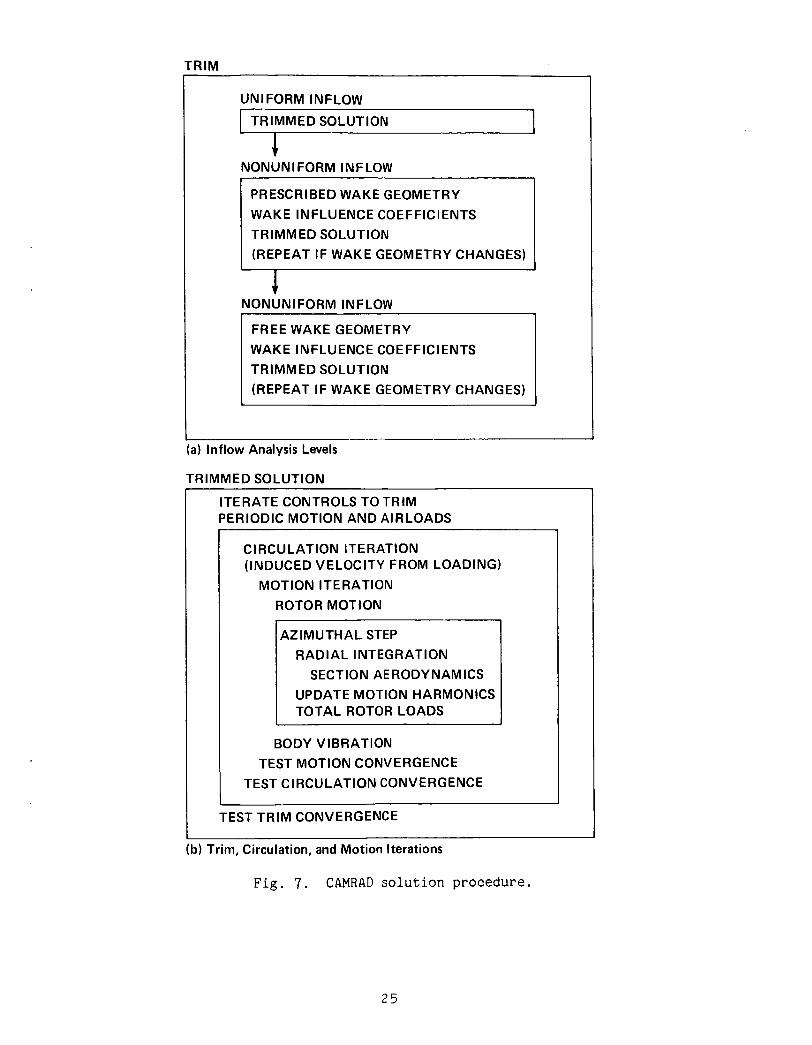
CAMRAD is an analysis designed to calculate rotor performance, aerodynamic and structural loads, aircraft vibration and gust response, flight dynamics and handling qualities, and aeroelastic stability. The analysis development is discussed in Refs. 4-6. Summaries of the vari- ous structural and aerodynamic models used in CAMRAD are described in Ref. 7. A general two-rotor aircraft with either articulated, hinge- less, gimballed, or teetering rotors can be modeled using CAMRAD. The rotor structural model is based on engineering beam theory for rotating wings with large pitch and pretwist. The rotor aerodynamic model is based on lifting-line theory, and uses two-dimensional airfoil charac- teristics and a vortex wake. in CAMRAD: uniform inflow (linear variation of inflow over the rotor disk), nonuniform inflow with prescribed-wake geometry, and nonuniform inflow with a free-wake geometry. Figure 7 outlines the aircraft trim solution procedure in CAMRAD.
Three levels of aerodynamic analysis exist
7. APPROACH
The strategy for the correlation effort was to first develop a baseline model of the SA349/2 aircraft and rotor for CAMRAD. Much time and effort was spent obtaining detailed information about the GV blades, NAT hub, and aircraft geometry. Also, definitions, sign conventions, and reference systems for the data and theory were constantly checked for consistency.
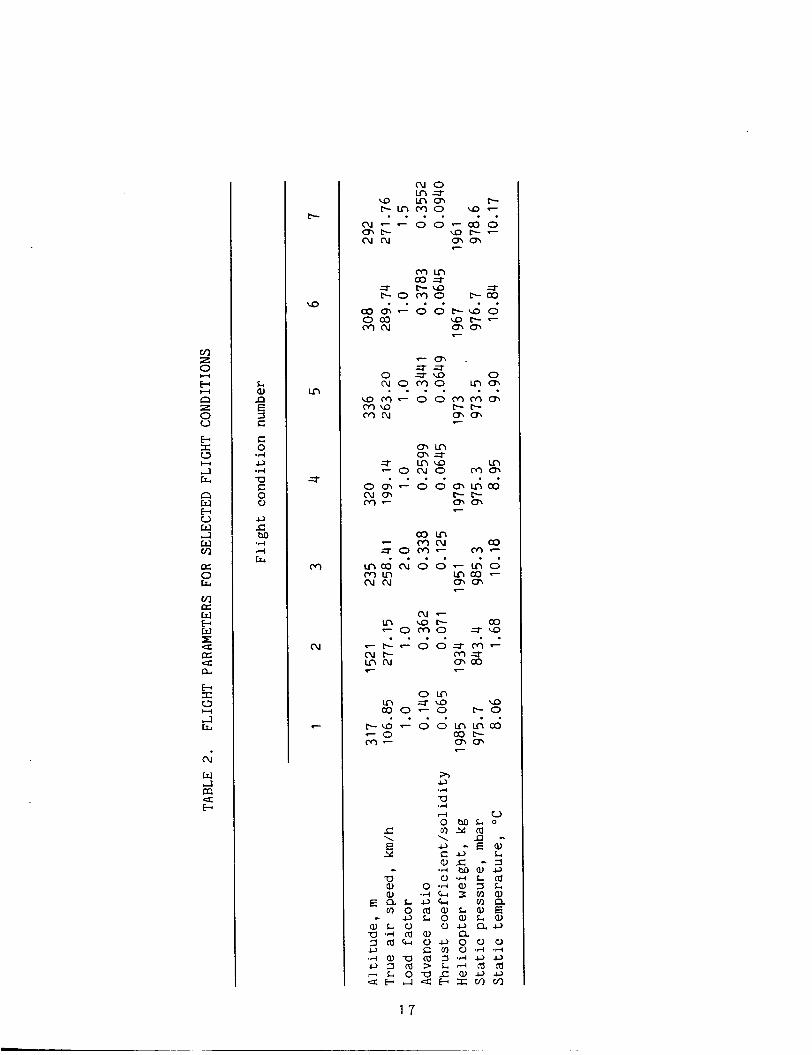
Preliminary comparisons of theory with data were then per- formed. the flight parameters for these conditions are shown in Table 2. Oetaiied resuits for the first three of the seven conditions will be presented here. extremes: low speed, low thrust; high speed, low thrust; and high speed, high thrust. several approximations and assumptions about both theory and data were necessary. following:
CAMRAD predictions were performed for seven flight conditions;
These three flight points represent forward flight
As a result of the preliminary CAMRAD calculations,
The results presented in this paper are qualified by the
1. Measured mean values of blade loads proved to be unrealistic; therefore, all strain gage time-history data presented in. this paper have the mean value removed.
2. Measured blade flap and lag angles are not presented since their accuracy is suspect, especially at high forward speed.
3 . Measured lift coefficient is actually the normal force coef- ficient angle of attack, the difference between For flight conditions where the blade experiences large angles of inci- dence, the error that is caused by the difference between will be a small part of the overall error in predicting Large angles of incidence occur when the blade experiences dynamic stall, and as will be shown, this phenomenon is not well-predicted.
Cn (the force perpendicular to the chord line). At small blade C, and Cn is insignificant.
C, and Cn C,.
4. Measured blade moment coefficient values are unreliable, probably because of an insufficient number of chordwise pressure mea- surements.
5. The steadiness of Condition 3 data is questionable. Varia- tions in the flight parameters were noticed during a period of 18 rotor revolutions of static data acquisition.
6. Fuselage aerodynamic characteristics used in CAMRAD were obtained from a wind tunnel test of a one-seventh-scale model of the SA349/2 fuselage.
7. The same aircraft c.g. location was used for all flight conditions.
8. CAMRAD normally calculates the blade-bending loads at a given radial station, r, by computing the difference between the total aerody- namic and inertial moments on the blade surface outboard of r. Using this method for the advanced-geometry rotor, the flapwise bending moments were found to be very sensitive to the blade mass distribu- tion. This sensitivity is numerical, not physical. The blade-bending moments were, therefore, calculated directly from the blade curvature and stiffness. This method significantly improved the correlation of the blade loads; however, this method is not accurate where discontinui- kies in the blade stiffness distribution occur because of the modal
5
structural model in CAMRAD. For the GV blades, jumps in the flapwise
correlation for bending moments near these radial stations is therefore expected.
a.,u - - A n A n n r . r i - n bubb"au.+ U Y . . L * . . - - I c t i f f n o c c nooiir ----- near t.he 10% and 90% radial stzt-~ns. peer
9. The measured control inputs were used as initial control settings in the free-flight trim analysis in CAMRAD. In the trim itera- tion, the control settings were adjusted until force and moment equilib- rium on the aircraft were achieved. For Condition 3 , however, the aircraft was also trimmed to the measured power (descent). When trim- ming Condition 3 to force and moment equilibrium alone (level flight), the trimmed power level was unrealistically high.
Baseline modeling conditions were next developed for the seven flight conditions. Modeling parameters in CAMRAD were then varied to assess the sensitivity on the correlation; these parameters included: number of blade-bending and torsion modes; wake geometry; tip-vortex core size; lifting-surface correction; and blade stall model.
Table 3 provides baseline values used in CAMRAD.
8. RESULTS
Prediction of Control Inputs and Power Required
Figure 8a presents predicted collective pitch as a function of advance ratio. Except for the turning flight conditions (Conditions 3 and 7 ) , the collective is overpredicted by approximately 0.5 degrees for all conditions. The nearly constant offset in collective results from a tension-torsion coupling caused by the jump in blade twist at the inboard radial station (Fig. 3 ) . This steep jump in twist was discov- ered to be the source of a steady, nose-down blade pitch. lates a pitch increment from the tension-torsion coupling associated with the pretwist. negative twist inherent over most of the CV blade, and a large negative pitch increment results from the large positive pitch change at the root. The net elastic pitch change is negative and occurs at the blade root. The pitch increment is also steady because the change is produced by the centrifugal force. equilibrium flight, the primary effect is on the main rotor collective pitch.
CAMRAD calcu-
A small positive pitch increment results from the
Since the analysis trims the helicopter to
CAMRAD models this tension-torsion coupling similar to Ref. 8. Reference 9 presents a more general theory to account for this effect. Because of lack of mean torsion moment and pitch link load data, the predicted elastic pitch increment could not be checked directly. Fig- ure 8a indicates that the magnitude of the elastic pitch increment is slightly overestimated. Calculations incorporating the general theory of Ref. 9 were performed by introducing an effective blade section radius of gyration parameter into CAMRAD. These calculations are also shown in Fig. 8a. The overall effect of implementing the general theory is to reduce the influence of the blade pretwist in the calculation of
6

the collective pitch. blade shear modulus and the useful load-bearing, cross-sectional area of the blade, which are used to compute the effective radius of gyration parameter. mation used for the shear modulus was very rough.
The magnitude of the influence depends on the
Because the GV blade is a composite structure, the approxi-
Figure 8b and 8c present lateral and longitudinal cyclic pitch, respectively, as a function of advance ratio. is overpredicted by an average of less than 0.5 degrees. longitudinal pitch is predicted to within 2 degrees (excluding Condi- tion 7).
The lateral cyclic pitch The calculated
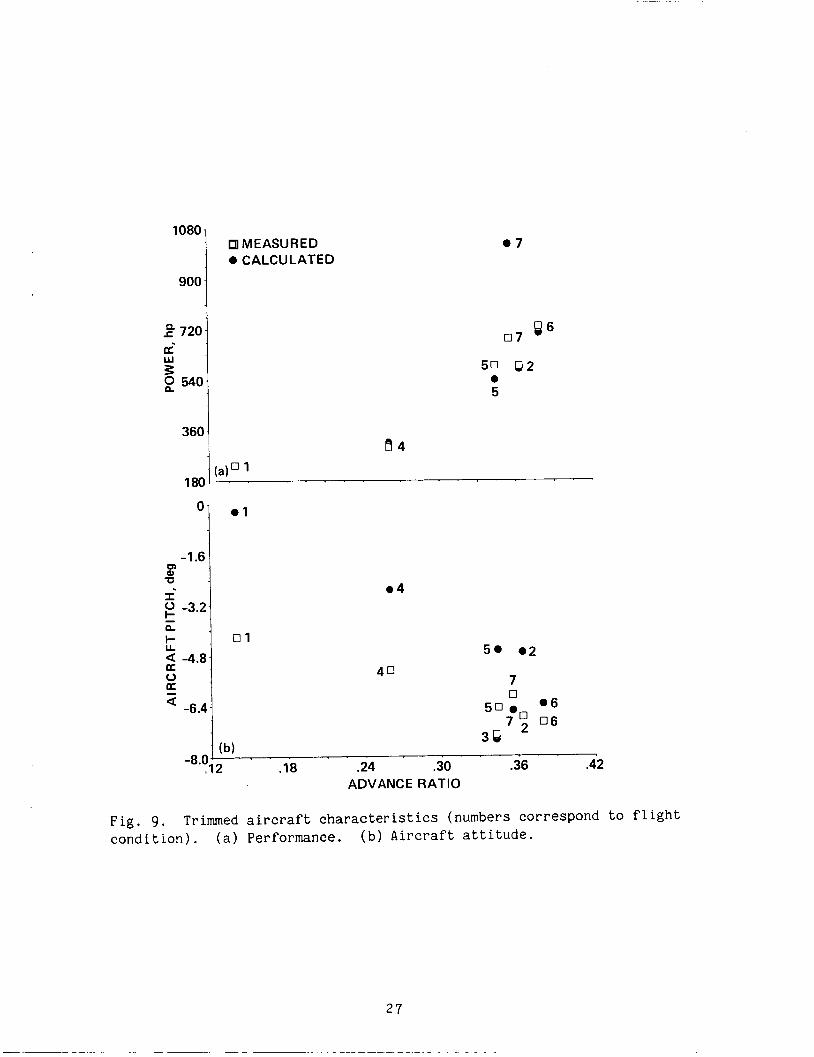
The prediction of total power required is shown in Fig. 9a. Condition 3 is not shown since measured power was used to trim the aircraft. Except for Condition 7, predictions for the remaining condi- tions are within an average of 5% of measured values. Aircraft attitude is not well-predicted for most of the flight conditions (Fig. gb), probably because of an inaccurate representation of the fuselage aerodynamics.
8.2 Condition 1: low speed, low thrust ( p 0.14, CT/u = 0.065)
At low forward speed, the rotor wake tends to remain in the vicinity of the blades and strongly influences the blade aerodynamic environment. A detailed wake geometry is needed therefore for good aerodynamic load correlation.
Figure 10 presents C, as a function of azimuth for r/R = 0.75, 0.88 , and 0.97. the lift variation. The prescribed wake results are better, but still do not predict the details of the distribution. The free-wake geometry, however, is able to predict the trend and magnitude of the lift. At this low speed, the rotor wake is slowly convected away from the rotor allowing time for interaction between the blade and shed tip-vortices. This interaction is evident in Fig. 10 for r/R 0.97 on the retreating side of the rotor disk (note sharp peaks in 270 degrees azimuth). Figure 1 1 shows the effect of varying tip-vortex core size on C,. found to be optimum. The core size used in CAMRAD includes other effects of blade/vortex interaction which are not modeled by the theory; therefore, the core size in CAMRAD is larger than the physical tip- vortex core size.
Uniform inflow is not able to predict the details of
C, near
A ratio of core size to blade chord of 0.525 was
For cases where the blade passes close to a tip-vortex (as in Condition l ) , lifting-line theory usually cannot predict blade loads accurately, especially at the tip. A lifting-surface solution is required for these cases. CAMRAD uses a correction based on a linear, lifting-surface theory to adjust the solution for the vortex-induced loading on the blade which is calculated by lifting-line theory. Because of computation time constraints, this correction is only applied when the blade and vortex are a specified distance apart. Figure 12
7

shows C, predictions using the lifting-surface theory correction. WIIIZII uaiiig ~1115: C U K . I X C L L U I I , 2 iii~re i-eaiisiic Lip-vortex core size is allowed (rc/c = 0.10 was used for this figure). tion, the calculated correction to lifting-line theory is small. The effect of tip-vortex core size is greater than the effect of the lifting-surface correction on C,.
,?I--- ..-_I_ L L 2 -
For this flight condi-
The flapwise bending moment is well-predicted at the 54% radial station, but not at the 20% and 808 stations (Fig. 13). free-wake geometry results are a significant improvement over the uni- form inflow results, the free wake provides only a small improvement in the predictions as compared to the prescribed wake results. The edge- wise bending moment is predicted both in magnitude and trend for r/R = 0.20, predicted in trend for r/R 0.54, and not well-predicted for r/R = 0.80 (Fig. 14). The difference between wake geometries becomes more significant near the blade outboard regions. The torsional moments are not well-predicted for any radial station, as shown in Fig. 15. If the one-half peak-to-peak values for data and theory were compared, however, the correlation would be quite reasonable. The data show a 5/rev - 6/rev influence that is not accounted for by the theory. CAMRAD calculates the first torsion frequency to be 3.9/rev.
Although the
The predicted pitch-link loads show a large l/rev influence for both uniform and nonuniform inflow, whereas the data do not (Fig. 16). A possible explanation is the value used for the control system stiff- ness in CAMRAD (a very large value was used). A better estimation of the stiffness may improve the correlation.
8.3 Condition 2: high speed, low thrust (u = 0.36, CT/u = 0.071)
At high forward speed, the rotor wake is rapidly convected down- stream, and so wake effects on blade loading are smaller. Figure 17 shows that the nonuniform inflow predictions of lift are slightly better than are the uniform inflow predictions. However, the difference between the free-wake and the prescribed-wake geometry results are insignificant. Henceforth, predictions for this flight condition are based on nonuniform inflow with a prescribed wake geometry.
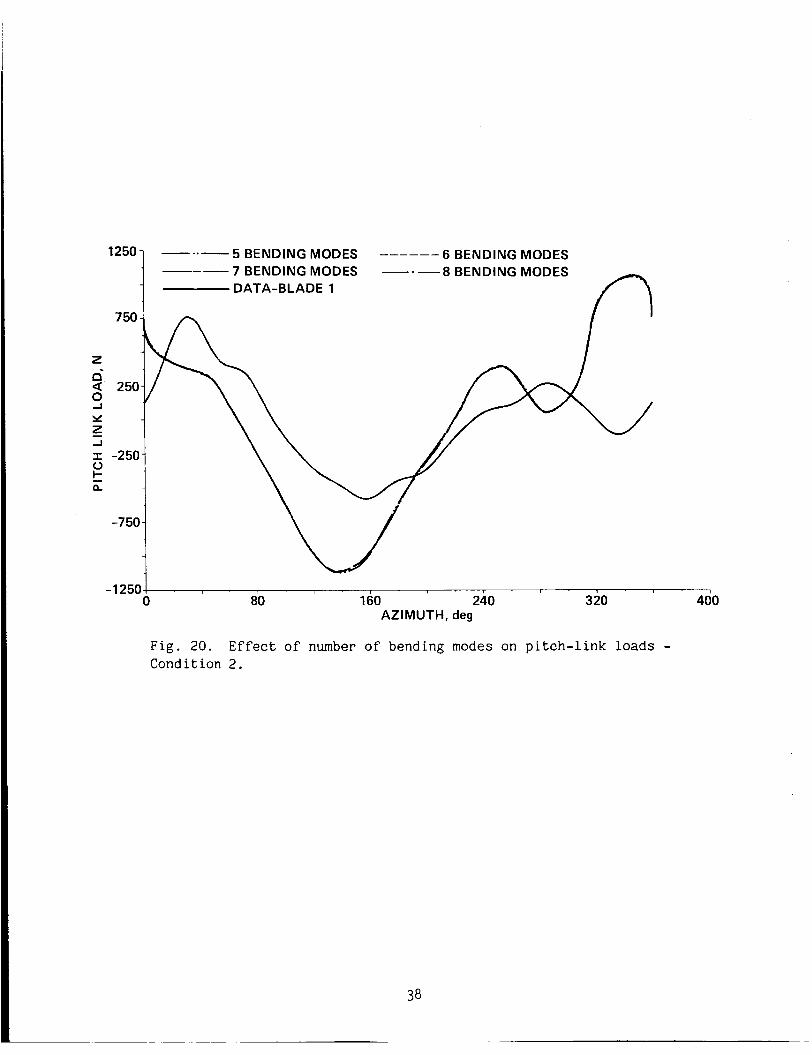
The flapwise bending moments are reasonably well-predicted; better correlation is achieved at the outboard radial stations than at the inboard radial stations (Fig. 18). Using six blade-bending modes provides better predictions at the outboard radial stations than using five blade modes. The difference between using five and six blade modes is noticeable; however, there is no difference in results from using six, seven, or eight bending modes. The seventh and eighth bending modes are dominated by edgewise motion; therefore the flapwise moment predictions are not affected by these modes. not well-predicted on the advancing side of the rotor disk (Fig. 191, probably reflecting compressibility effects for this high-speed case. For the retreating side of the disk, the moments are better predicted at the inboard radial stations. Using five o r six blade modes appears to
The edgewise moments are
8
c

provide the closest correlation. Figure 20 shows that pitch-link loads are badly predicted. the correlation.
Varying the number of blade modes does not improve
Reasonable correlation is obtained for torsional moments at 20% and 54% radial stations (Fig. 21). Increasing the number of torsion modes from two to four does not improve the predictions. The 5/rev - 6/rev influence present in Condition 1 is absent here.
8.4 CAMRAD/Finite-difference predictions of surface pressures
With an advancing tip Mach number of 0.87, chordwise surface pressure data for this flight condition reveal shocks forming near the blade tip. Reference 10 describes a method for predicting transonic flows on rotors in forward flight. The predictions are made via a loose coupling (file transfer) between CAMRAD and a small-disturbance, finite- difference code (FDR). Recently, comparisons were made of results from FDR and several other finite-difference codes coupled with CAMRAD (Ref. 1) . Results obtained by using one of these codes, a full- potential rotor code (FPR), in addition to results from FDR, will be presented here. FPR is described fully in Ref. 11. The code solves a three-dimensional, conservative, full-potential equation to calculate unsteady rotor flows.
As explained in Ref. 10, CAMRAD first computes the blade partial angle of attack for the advancing side of the disk. difference code then computes the blade lift ( fo r advancing side of the disk. first iteration. The C,'s computed by the finite-difference code are then used by CAMRAD to compute new blade angles, which are used by the finite-difference code to compute a new iteration). The iteration continues until the difference between the C,
The finite- r/R s 0.5) for the
This is defined here as the end of the
C, distribution (end of second
calculated by CAMRAD and the finite-difference code becomes small.
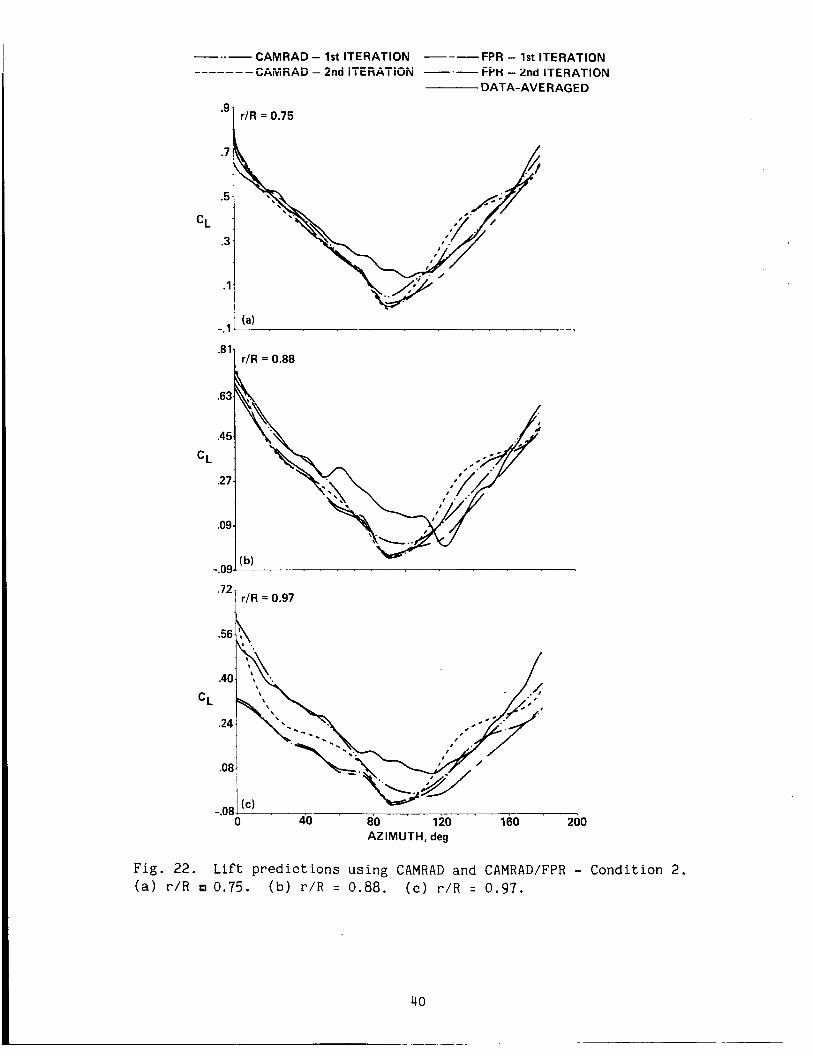
Results from Ref. 1 are for rigid blade motion. As shown in Table 3, six bending modes and two torsion modes were used for the calculations presented here in Figs. 22 to 25.
Figures 22 and 23 present lift coefficient predictions for the advancing side of the rotor disk for FPR and FDR, respectively, for Condition 2. As stated earlier, blade lift information is passed from the finite-difference code t.0 CAMRAD for the advancing side of the disk only. For the retreating side of the disk, lift information from the previous CAMRAD iteration is used. The step change in lift at 0 and 180 degrees azimuth can excite unwanted blade motion, especially for an elastic blade. In Fig. 22 and 23, the second iteration predictions are slightly oscillatory in nature. To avoid this problem, the step change in lift at 0 and 180 degrees azimuth should be made small. inflow and lift information for the entire rotor disk should be exchanged between CAMRAD and the finite-difference code.
Ideally,
9

Figures 22 and 23 show that using the coupling procedure between
In fact, the lift is underpredicted CAMRAD and either finite-difference code does not improve the prediction of C1 ( f o r this flight condition). at all locations, except in the region of 6 = 120 to 160 degrees azimuth for FPR and in the region 6 = 100 to 140 degrees azimuth for FDR. lift. near 0 degrees and 180 degrees azimuth for all three radial stations. In general, lifting-line theory does an adequate job of predicting the section lift. The reason for underpredicting the lift in Figs. 22-23 with both finite-difference codes is difficult to determine without a tip-path-plane angle-of-attack measurement.
In these two regions, the second iteration results overpredict the Figure 23 shows that FDR significantly underpredicts the lift
Figure 24 and 25 show chordwise surface pressure coefficient (Cp) predictions for the three radial stations at three azimuth locations for FPR and FDR, respectively. The pressure predictions are again for Condition 2. As shown in Fig. 24, the shape of the Cp distribution predicted by FPR compares well with the data for all locations. The upper surface pressure peak is consistently underpredicted (because the calculated lift is too low). There is little difference between the first and second iteration results except at 6 = 150 degrees (reflecting the trend in lift shown in Fig. 22) . At 6 = 150 degrees, the upper surface pressure peak is closely matched using the second iteration results (although the lower peak is better predicted using the first iteration results). Figure 25 shows similar results for the FDR predictions. not as well predicted as compared to the FPR results. In particular, FPR predicts the lower surface pressure peak better than FDR. As in Fig. 24, differences between the first and second iteration results are small. r/R = 0.88 and 0.97 at 6 = 150 degrees (Fig. 24 b) and c)). FDR, however, does not predict these shock locations (Fig. 25 b) and c)).
The shape and magnitude of the pressure distributions are
FPR reasonably predicts the shock locations for
8.5 Condition 3: high speed, high thrust (P = 0.34, CT/U = 0.125)
Although not shown here, there is little difference between the prescribed- and free-wake results for this condition. Since the prescribed-wake analysis is computationally less expensive than the free-wake analysis, calculations were performed using the prescribed- wake geometry. The high thrust level of this flight condition leads to stall on the retreating side of the rotor disk (especially near the blade inboard region). The rapid blade pitch motion causes a delay in the occurrence of separated flow. Once the blade has reached stall, a vortex is shed from the leading edge resulting in large transient blade loads. Therefore, a dynamic stall model is used in the calculations for this flight condition. Several models of dynamic stall are available in CAMRAD. In the model used here (based on Refs. 12-14), a correction that is proportional to a is applied to a before the blade section lift, the drag, and the moment coefficients are evaluated. This model accounts for the hysteresis of dynamic stall, but not for the leading- edge vortex effects.
' 0

For the 75% radial station, Fig. 26 shows that the static stall model is not able to predict the complex side of the rotor disk. prediction in this region of the disk. The difference between the two stall model predictions on the retreating side of the disk becomes less significant for the outer radial stations since the blade becomes less stalled near the blade tip. As an additional comparison, one revolution of unaveraged data is included. Attempts were made to improve the predictions by varying the correction term to the blade angle of attack; however, significant improvements were not obtained. A more sophisti- cated stall model will be necessary to predict the detailed behavior
C, behavior on the retreating The dynamic stall model provides a better
of c,.
Figure 27 shows that the flapwise moments are reasonably well- predicted. No significant improvement is gained by using the dynamic stall model instead of the static stall model. On the other hand, the edgewise moment at 20% radial station is better predicted by the dynamic stall model on the retreating side of the disk (Fig. 28a), where the blade is most stalled. The edgewise moments at the outer radial sta- tions are not well-predicted by either stall model. For all three radial stations shown in Fig. 29, the torsional moments are not well- predicted on the retreating side of the disk by either model. Figure 30 again shows the poor correlation of pitch-link loads. Using the dynamic stall model does not improve the correlation.
9. RECOMMENDATIONS FOR CORRELATION IMPROVEMENT
1. Since the one-seventh-scale data does not represent the full- scale fuselage aerodynamic characteristics exactly, additional calcula- tions were performed to assess the sensitivity of the correlation to fuselage drag. nounced effect on the trimmed control inputs, power required, and blade loads. The predictions were also somewhat sensitive to the fuselage moment characteristics. For future correlations with this data set, using full-scale fuselage aerodynamic characteristics would improve the accuracy of the predictions.
For Condition 2, changing the fuselage drag had a pro-
2. Since the blade flap angle measurements were suspect, the rotor position relative to the fuselage was unknown. If CAMRAD were trimmed to the measured tip-path-plane angle, the resulting predictions could improve.
3. Incorporating a more sophisticated dynamic stall model into for stalled regions of the CAMRAD may improve the predictions of
blade. C,
A summary of the correlation results for aircraft performance and trim and the three flight conditions are listed below.

10.1 Aircraft performance and Trim
1. CAMRAD is able to predict aircraft performance to within an average of 55 for the level flight (low thrust) cases; performance for the turning flight (high thrust) cases is not well-predicted.
2. The collective pitch is consistently overpredicted by about 0.5 degrees. This overprediction is caused by the steep jump in twist at the blade inboard section which produces a steady, nose-down blade pitch increment. gyration parameter reduces the effect of the pretwist on the calculated collective.
Introducing an effective blade section radius of
3 . Lateral cyclic pitch is overpredicted by roughly 0.5 degrees and longitudinal cyclic pitch is predicted to within 2 degrees (both excluding Condition 7). Aircraft attitude is not well-predicted.
10.2 Condition 1 ( u = 0.14. C d a = 0.065)
1. Blade tip-vortex interactions dominate the wake effects on blade loads. predictions.
Tip-vortex core size has pronounced effects on the C,
2. The free-wake geometry is able to model the blade tip-vortex interactions.
3 . Use of a lifting-surface theory correction has little effect on the C, prediction.
4. Nonuniform inflow is required to predict blade structural loads. The free wake is not important in predicting flapwise moments, but is required for calculating edgewise bending moments at outer radial stations. Torsional moments and pitch-link loads are not well- predicted.
10.3 Condition 2 (11 = 0.36, CT/u = 0.071)
1. Nonuniform inflow is required for reasonable predictions of blade aerodynamic and structural loads; however, there is little or no difference between the free- and prescribed-wake results.
2. Use of five or six blade-bending modes provide the best
Edgewise moments are not well-predicted on the predictions of bending moments. for all radial stations. advancing side of the rotor disk; better correlation is achieved on the retreating side of the disk at inboard stations.
Flapwise moments were well-predicted
3 . Variation of the number of blade-bending modes had no effect on the poor prediction of pitch-link loads.
4. radial station. effect on the predictions.
Torsional moments were reasonably predicted at the inboard Increasing the number of torsional modes had a small

5. Coupling CAMRAD with either FPR or FDR did not provide a better prediction of blade lift as compared to lifting-line theory predictions.
6. surface pressures than the FDR code. butions were well-predicted by FPR. dicted the magnitude of the upper surface pressures.
In general, the FPR code provided better predictions of blade
However, both FPR and FDR underpre- The shape of the pressure distri-
7. Shock locations were reasonably well-predicted by FPR.
10.4 Condition 3 ( v = 0.34, CT/u = 0.125)
1. The difference between prescribed-wake and free-wake results is small.
2. A dynamic stall model provides a better prediction of C, on the retreating side of the rotor disk for the blade inboard sections than a static stall model. The detailed behavior of not well-predicted by using the dynamic stall model.
C,, however, is
3. The flapwise moments are reasonably well-predicted, although the dynamic stall model does not offer significant improvements over the static model results. The edgewise moments at the inboard radial sta- tions are more sensitive to the stall model used; the edgewise moments at the outboard radial stations are not well-predicted.
4. Torsional moments on the retreating side of the disk and pitch-link loads are not well-predicted by either stall model.
11. VALUE OF PERFORMING CORRELATION STUDIES
The benefits of performing extensive correlations, such as pre- sented here, can be assessed in several ways.
1. The theoretical model is checked for validity over a wide range of flight conditions.
2. Limitations of the analysis are identified.
3. The data set is validated somewhat by the analysis. Data reliability can be verified by rechecking instrumentation, data acquisi- tion systems, and data reduction processes; however, gross errors in the data are easily identified by performing correlations with analyses. Errors made consistently throughout the data reduction process can also be identified by thorough correlation with a validated analysis.

Acknowledgements
The authors would like to thank Dr. Wayne Johnson for his invalu- able guidance throughout this joint project. thank Dr. Chee Tung of the U.S. Army Aeroflightdynamics Directorate for his assistance with the finite-difference codes and useful discus- sions. Ames and Mr. Olivier Lambert of the French Ministry of Defense who are the technical representatives for this project; their continued efforts have made this project possible.
We would also like to
Finally, we would like to thank Dr. William Warmbrodt of NASA
REFERENCES
1. F. Caradonna, C. Tung A Review of Current Finite Difference Rotor Flow Methods. Forty-Second Annual National Forum of the American Helicopter Society. Washington, D.C. (June 1986)
2. J. J. Thibert A New Airfoil Family for Rotor Blades. European Rotorcraft and Powered Lift Forum. Aix-en-Provence, France (September 1977)
3. R. Heffernan, M. Gaubert Structural and Aerodynamic Loads and Performance Measurements of an SA349/2 Helicopter with an Advanced Geometry Rotor. NASA TM-88370 (November 1986)
4. W. Johnson
5. W. Johnson
6. W. Johnson
7. W. Johnson
A Comprehensive Analytical Model of Rotorcraft Aerodynamics and Dynamics, Part I: Analysis Development. NASA TM-81182 (June 1980)
Development of a Comprehensive Analysis for Rotorcraft - I, Rotor Model and Wake Analysis. Vertica (1981) 5 (2)
Development of a Comprehensive Analysis for Rotorcraft - 11, Aircraft Model, Solution Procedure and Applications. Vertica (1981) 5 (3)
Assessment of Aerodynamic Models in a Comprehensive Analysis for Rotorcraft. NASA TM-86835 (October 1985)
14
8. J. Houbolt, G. Brooks Differential Equations of Motion for Com- bined Flapwise Bending, Chordwise Bending, and Torsion of Twisted Nonuniform Rotor Blades * NACA Report 1346 (1958)
9. D. Hodges Torsion of Pretwisted Beams Due to Axial Loading . J. Appl. Mech. (1980) 47 ( 2 ) . See also Discussion, J. Appl. Mech. (1981) 48 (3 )
10. C. Tung, F. X. Caradonna, The Prediction of Transonic Flows on D. A. Boxwell, Advancing Rotors. W. Johnson Fortieth Annual National Forum of the
American Helicopter Society. Arlington, VA (May 1984)
11. R. Strawn, F. Caradonna
Numerical Modeling of Rotor Flows with a Conservative Form of the Full-Potential Equations. AIAA 24th Aerospace Sciences Meeting, Reno, Nevada, January 6-9, 1986, AIAA Paper No. 86-0079.
12. F. Harris, F. Tarzanin, Rotor High Speed Performance, Theory vs. R. Fisher Test.
J. American Helicopter SOC. (1970) 15 ( 3 )
13. F. Tarzanin
14. R. Cormont
Prediction of Control Loads due to Blade Stall. J. American Helicopter SOC. (1972) 17 (2)
A Mathematical Model of Unsteady Aerodynamics and Radial Flow for Application to Helicopter Rotors. USAAVLABS TR 72-67 (May 1973)
15

TABLE 1. SA349/2 AIRCRAFT CHARACTERISTICS
Aircraft gross weight 2000 kg
Main rotor number of blades rad i u s blade chord sol id i ty rotational speed
3 5.25 m 0.35 m 0.0637
387 rpm
Tail rotor rotational speed 5919 rpm
Engine type Astazou XIV H rated at 550 kw
L a,
3 c
m m co=r 3 c - W =r b O M O t-co . . . . . .
a3 m - 0 0 c-a 0 at-- m m oco m(Y
. . . . . . a m - o o m m m mu3 + E - mru s r m
mLn m=r ~ o c u o m a m m In . . . . . .
0 m - 0 0 m L n a t -E- m m 7
% ?
c o m mz . . . . . . m c o c u o o - m o MLn m c o - c u r u m m
cu- \DE- co
$0030 =ru3 . . . . . .
. . . . . . t -a- O O L n L n c o - 0 cot- m - m m
7
1 7

TABLE 3. BASELINE CAMRAD CONDITIONS
Wake Tip vortex Number of Number of Stall model, Condition core s i z e , bending torsion MR/TR geometry rc/c modes modes
1 0.525 6 2 s t a t i d s t a t i c free 2 0.525 6 2 s t a t i d s t a t i c prescribed
0.525 6 2 dynamidnone prescribed 4 0.525 6 2 s t a t i d s t a t i c prescribed 5 0.525 6 2 s t a t i d s t a t i c prescribed 6 0.525 6 2 s t a t i d s t a t i c prescribed 7 0.525 6 2 dynamichone prescribed
3a
aTrimmed to measured power leve l .

ORIGIPIAL F?.GZ tS OF POOR QUALITY
Fig . 1. SA349/2 Helicopter.
1 9
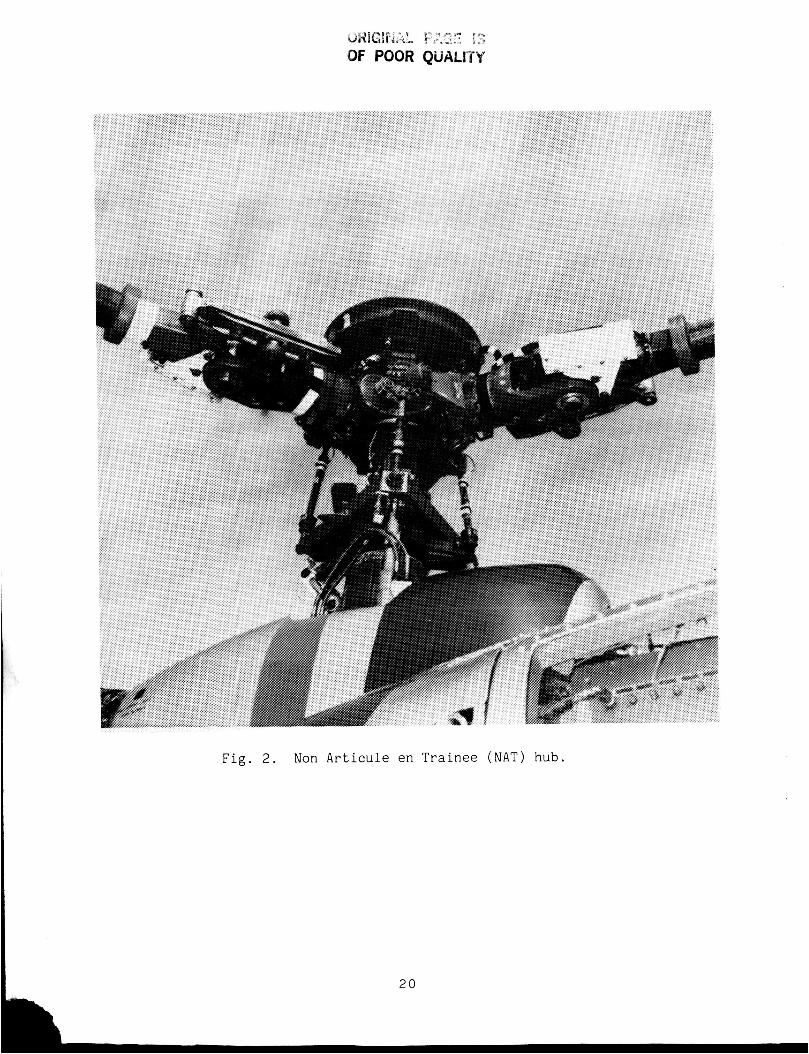
Fig. 2. Non Articule en Trainee (NAT) hub.

v) v) w 2 Y O 0
-
- .I I I I I I I 1 1 I I I 0 .2 .4 .6 .8 1 .o
CHORD (a)
I I - - -
I 0.35
v) 0 m t r
&
REMOVABLE TIP
0.545
RADIAL LOCATIONS, m / I I
Fig. 3. Grande Vitesse (GV) b l a d e characteristics. (a) OA209 airfoil profile. (b) Blade twist distribution.
21

F: FLAP BENDING L: LAG BENDING T: TORSION
BLADE NO.
P R ESSU RE
I I 1 1 1 1 1 1 1 I I *
0 .1 .2 .3 .4 .5 .6 .7 .8 .9 1 .o r/ R
F i g . 4 . Blade pressure transducer and s t r a in gage locations.
2 2

I I 1 1
n I
a + a a
N a
+ 0 W
z 0 K 0
0
W u z x w c a 3
w N
0
:z a a
a rn r n w w n
n +
n
n
W n a oc"
% a z x a
1
a, 0 0 L a c 0 .rl c, 0 3 -0 W L W c, (d n
M 4 Lrr
2 3

.I3
.I2
.I 1
.10 6 \ I- o
.09
.08
.07
.06
1 I I I
CALCULATIONS PERFORMED FOR THESE FLIGHT CONDITIONS I
I I I THRUST
SWEEP I \I 7
I .
I
o I 0
VELOCITY SWEEP
/ 0
I I l 2 I . O
I I I I 1
.I5 .20 .25 .30 .35 .40 .IO ADVANCE RATIO
Fig. 6. Thrust and speed range of flight conditions.
2 4
TRIM
UNIFORM INFLOW
I TRIMMED SOLUTION I t
NONUNIFORM INFLOW
PRESCRIBED WAKE GEOMETRY WAKE INFLUENCE COEFFICIENTS TRIMMED SOLUTION (REPEAT IF WAKE GEOMETRY CHANGES)
J. NONUNIFORM INFLOW
FREE WAKE GEOMETRY WAKE IN FLU ENCE COE FF IC I ENTS TRIMMED SOLUTION (REPEAT IF WAKE GEOMETRY CHANGES)
(a) Inflow Analysis Levels
TRIMMED SOLUTION
ITERATE CONTROLS TO TRIM PERIODIC MOTION AND AIRLOADS
CIRCULATION ITERATION (INDUCED VELOCITY FROM LOADING)
MOTION ITERATION ROTOR MOTION
AZIMUTHAL STEP RADIAL INTEGRATION
SECTION AERODY NAM ICs UPDATE MOTION HARMONICS TOTAL ROTOR LOADS
BODY VIBRATION TEST MOTION CONVERGENCE
TEST CIRCULATION CONVERGENCE
TEST TRIM CONVERGENCE ~~
I ) Trim, Circulation, and Motion Iterations
Fig. 7. CAMRAD solution procedure.
2 5

17.6
15.4
B
6 13.2 !=
0
Q w L 11.0-
A A
00 8.8 -
6.6
0 MEASURED 0 CALCULATED A CALCULATED (BASED ON REF. 9)
0
0 4 A
0 (a) 6 1
1
e A 7
5 -2.6- 0 5
3: 0
7. t12
b6
3 0 8 5
A a -5.2. z n 3 k -7.8- (3 z
2.25
cn 4 1.95 I' u k
1.65 - A 0 > 0 1.35 A
M w a + 1.05 4
.7E
0 MEASURED 0 CALCULATED
0 1
(b)
5 0 u k Q
0 6
0 2 0
70 06
5 3: , a 2
0 4 30
2.6 1
01
4 0 0
30 0 7
3 Q 5 0 5 a206 0 7 06 . .
.42 -10.4 J .I2 .I 8 .24 .30 .36
ADVANCE RATIO
Fig. 8. Trimmed control inputs (numbers correspond to flight condition). (a) Collective. ( b ) Lateral cyclic. (c) Longitudinal cyclic.
2 6 ~~
1080
900
2 720 rr' Lu
MEASURED 0 CALCULATED
0 7 9 6
50 8 2 0 5
0
-1.6 m Q) '0
I' -3.2 -
n
t a -4.8 a 0 a -
-6.4
-8.C
. I
e 4
0 1
4 0 5 . 0 2
7 0
0 6 7 * 0 6
5 0 OO
3 8 (b) 2 .I8 .24 .30 .36 .42
ADVANCE RATIO
Fig. 9. condition). (a) Performance. ( b ) Aircraft attitude.
Trimmed aircraft characteristics (numbers correspond to flight

-.- UNIFORM INFLOW --- - -- NON-UNIFORM INFLOW: FREE WAKE - DATA-AVERAGED
NON-UNIFORM INFLOW: PRESCRIBED WAKE
r/R = 0.75
. .” *77 1 r/R = 0.88
‘661 5 4
r/R = 0.97
.42. n
1 (c) \” 80 160 240 320 400
.06
AZIMUTH, deg
Fig. 10. Effect of wake geometry on lift - Condition 1. (a) r/R = 0.75 . (b) r/R = 0.88. ( c ) r/R = 0.97.
28

-...- rc/C = 0.225 rC/c = 0.525
----- rc/c = 0.375 rc/c = 0.675
- ._ - rc/c= 0.825 - DATA- AV E RAG ED
"'1 r/R = 0.75 .. .4
'"- r/R = 0.88
.81-
-70] r/R = 0.97 1
0 80 160 240 320 400 AZIMUTH, deg
Fig . 1 1 . E f f e c t on l i f t of varying t i p vo r t ex c o r e s i z e - Condi- t i o n 1 . ( a ) r/R = 0 . 7 5 . (b) r/R = 0.88. ( c ) r/R = 0.97.
2 9

LIFTING SURFACE, r,/c = 0.10 --__ LIFTING LINE, rc/c = 0.10 --- LIFTING LINE, rc/c = 0.525
DATA-AVERAGED
1*50] I/R = 0.75
1’201 I/R = 0.88
.90 -
3 (b) -.30
*721 r/R = 0.97
AZIMUTH, deg
F i g . 12. E f fec t of l i f t i n g s u r f a c e c o r r e c t i o n on l i f t - Condi t ion 1 . ( a ) r/R 0.75. (b) r/R = 0.88. ( c ) r/R = 0.97.
30

F i g . 13. t i o n 1 .
-.- UNIFORM INFLOW _ _ _ - NON-UNIFORM INFLOW: PRESCRIBED WAKE -_- NON-UNIFORM INFLOW: FREE WAKE
DATA
100 r/R =0.80 I
(4 LL
160 240 320 400 AZIMUTH, deg
80 -1 50
0
Effect of wake geometry on f l a p w i s e bending moment - Condi- ( a ) r/R = 0.20. (b ) r/R = 0.54. ( c ) r/R = 0.80.
31

UNIFORM INFLOW ----- NON-UNIFORM INFLOW: PRESCRIBED WAKE
NON-UNIFORM INFLOW: FREE WAKE --- DATA
V
-200
1251
L. (4 w -125
0 80 160 240 320 400 AZIMUTH, deg
Fig. 14. tion 1. (a ) r/R = 0.20. (b) r/R = 0.54. (c) r/R = 0.80.
Effect of wake geometry on edgewise bending moment - Condi-

UNIFORM INFLOW -.- -_-_ NON-UNIFORM INFLOW: PRESCRIBED WAKE --_ NON-UNIFORM INFLOW: FREE WAKE
DATA
451 r/R = 0.20
35] r/R = 0.54
421 r/R = 0.87
z 28 h
V
-28 0 80 160 240 320 400
AZIMUTH, deg
Fig. 15. (a) r/R = 0.20.
Effect of wake geometry on torsional moment - Condition 1. (b) r/R = 0.54. ( c ) r/R = 0.87.
33

1000
600
-600
-1000
-.- UNIFORM INFLOW ---___ NON-UNIFORM INFLOW: PRESCRIBED WAKE
NON-UNIFORM INFLOW: FREE WAKE / ' \ ---
80 160 240 320 400 AZIMUTH, deg
Fig. 16. Effect of wake geometry on pitch-link loads - Condition 1.
3 4

UNIFORM INFLOW -.- NON-UNIFORM: PRESCRIBED WAKE NON-UNIFORM: FREE WAKE DATA-AVE RAGED
----- ---
1'50\ r/R = 0.75
1.35] r/R = 0.88
'.17] r/R = 0.97
AZIMUTH, deg
Fig. 17. Effect of wake geometry on lift - Condition 2. ( a ) r / R = 0.75. ( b ) r / R = 0.88. (c) r / R = 0.97.
35

6 BENDING MODES 8 BENDING MODES
- .. - 5 BENDING MODES _-- - - - 7 BENDING MODES - . -
r DATA F z g-90 W I 0 E 30 0 z n 5 -30 m 2
a
W
2 -90
A U
-1 50
125 1 r/R = 0.54
80 1 rIR = 0.80
I-- 40 z W B 0 E O
W v, 2 -80 a U
-120 0 80 160 240 320 400
AZIMUTH, deg
Fig. 18. Condition 2. (a) r/R = 0.20. ( b ) r/R = 0.54. (c) r/R = 0.80.
Effect of number of bending modes on flapwise bending moment -
36

5 BENDING MODES ------ 6 BENDING MODES 8 BENDING MODES 7 BENDING MODES ---
DATA
~ “‘1 r /R=0 .20
z
-..-
AZIMUTH, deg
Fig. 19. Effect of number of bending modes on edgewise bending moment - Condition 2. (a) r/R = 0.20. ( b ) . r / R = 0.54. ( c ) r/R = 0.80.
37
5 BENDING MODES 7 BENDING MODES
------ 6 BENDING MODES -e- 8 BENDING MODES
- ..- ---
DATA-BLADE l
z
1 750b% 2 50
Y 4 \ \
u n r- \\ -250-
I
-12504 I
0 80 160 240 3 20 400 AZIMUTH, deg
Fig. 20. Effect of number of bending modes on pitch-link loads - Condition 2.
38

125-
f 75- z I - - -
$ 25- 0 E 3 -25- -I
0 v) K p -75-
-125.
451 r/R = 0.87
- .- 2 TORSION MODES --- - 3 TORSION MODES -- 4 TORSION MODES
r/R = 0.20
f 27 2
-45 0 80 160 240 320 400
AZIMUTH, deg
Fig. 21. Effect of number of t o r s ion modes on torsional moment - Condition 2. (a) r/R 0.20. (b) r/R = 0.54. ( c ) r/R = 0.87.
39
-. 1
'811 r/R = 0.88
AZIMUTH, deg
.72 r/R = 0.97
Fig. 22. (a) r/R 0.75. (b) r/R = 0.88. (c) r/R = 0.97.
Lift predictions using CAMRAD and CAMRAD/FPR - Condition 2.
40

--.- CAMRAD - 1st ITERATION T-- FDR - 1st ITERATION ------- CAMRAD - 2nd ITERATION --- FDR - 2nd ITERATION
DATA-AV E RAG ED *801 r/R = 0.75
*811 r/R = 0.88
.63 h
AZIMUTH, deg
Fig. 23. (a) r/R = 0.75. (b) r/R = 0.88. ( c ) r/R = 0.97.
Lift predictions using CAMRAD and CAMRAD/FDR - Condition 2.
41
la8 r/R = 0.75
1.41 -/j ----- 1st ITERATION - FPR
2nd ITERATION - FPR 0-0 DATA
$ = 90"
1.81 l~ = 150"
-.b J 0 .2 .4 .6 .8 1 .o
X I C
(a) r/R = 0.75: azimuth = 30, 90, 150 degrees.
Fig. 24. FPR surface pressure coefficient predictions - Condition 2.
42

1.8
1.4
1 .o
-cP .6
.2
-.2
-.6
1.4.
rIR = 0.88
$ = 90"
P 4 - - - - - - - 1st ITERATION - FPR
2nd ITERATION - FPR DATA
---
$= 30" \ i t 4
A $ = 150"
._ 0 .2 .4 .6 .8 1.0
X I C
(b) r/R 0.88: azimuth = 30, 90, 150 degrees.
Fig. 24. Continued.
43
1.8 r/R = 0.97 1
1.4-
1st ITERATION - FPR - - - - -- - 2nd ITERATION - FPR ---
0-Q DATA
$ = 90"
$= 30"
1.8
1.4
1 .a -cP
.6
.2
-.2
$ = 150"
-.6 0 .2 .4 .6 .8 1.0
x/c
(c) r/R 0.97: azimuth - 30, 90, 150 degrees.
Fig. 24. Concluded.
44
l m 8 ] r/R = 0.753 - - - - - - - 1st ITERATION - FDR --- 2nd ITERATION - FDR 0-0 DATA
$ = 30"
-cP
IL = 150" 1.8-
c
-.2- F -.6
0 .2 .4 .6 .8 1 .o x/c
(a) r/R 0.753: azimuth = 30, 90, 150 degrees.
Fig. 25. FDR surface pressure coefficient predictions - Condition 2.

-cr
1.81 r/R = 0.878
P 1.4
1st ITERATION - FDR 2nd ITERATION - FDR
----___ --- - DATA
J, = 30" I.UI / \
l.81 1.41 $2 = 90"
1.81 $2 = 150"
0 0 [\ \
1.4.
1.0. p
0 .2 .4 .6 .8 1 .o -.6 1
X I C
(b) r/R = 0.878: azimuth = 30, 90, 150 degrees.
Fig. 25. Continued.
46

1.81 r/R = 0.97
1.4-
1st ITERATION - FDR 2nd ITERATION - FDR
------ --- - DATA
$ = 30"
..
-cP
$ = 90"
.- .
1.4 J, = 150"
-.41 0 .2 .4 .6 .8 1 .o
X I C
( c ) r/R = 0.97: azimuth = 30, 90, 150 degrees.
Fig. 25. Concluded.
47

2.5 - - - STATIC STALL MODEL - ---- DYNAMIC STALL MODEL .
2.0- UNAVERAGEDDATA DATA-AVERAGED .
---
I .5
CL 1 .o
.5
2.0 i r/R = o.88 1.6 1 I s
1.2
CL .8
.4
0 80 160 240 320 400 AZIMUTH, deg
Fig. 26. Effect of stall model on lift - Condition 3 . (a) r/R 0.75. (b) r/R 0.88. ( c ) r/R = 0.97.
48

- -- STATIC STALL MODEL - -_- - DYNAMIC STALL MODEL
*O0 1 r/R = 0.54
E 0 E 40
w I? 2 -120
4 L
-200
0 80 160 240 320 400 AZIMUTH, deg
F i g . 27. t i o n 3 . ( a ) r/R = 0.20. (b) r/R = 0.54. ( c ) r/R = 0.80.
Effect o f s t a l l model on f l a p w i s e bending moment - Condi-
49

3ijfiij -- -STATIC STALL MODEL - - - - - DYNAMIC STALL MODEL 1 DATA
E i
2000 1 r/R = 0.20 w
8 z n w o z
. 24001 r /R=0*54
E z
0
(b) w
-1600
1250 e z +- 5 750
E 3
250 z n
rn -250
v, s 0 -750
z w
w
w
t3 -1 250
r/R = 0.80 I
0 80 160 240 820 400 AZIMUTH, deg
F i g . 28. t i o n 3 . (a) r/R = 0.20. ( b ) r/R = 0.54. ( c ) r/R = 0.80.
Effect of s t a l l model on edgewise bending moment - Condi-
50

450
E 270 1 +- z w I 90 0 I
2 -90 0 a e -270
v)
-450
250
E 150 z G- z w 5 a I 0 I
z v) a I-
a -50
2 o -150
-2 50
--- STATIC STALL MODEL - - - - - DYNAMIC STALL MODEL
I\ DATA ,/R = 0.20
r /R = 0.54
150 1 r/R = 0.87
AZIMUTH, deg
Fig. 29. (a) r/R = 0.20. ( b ) r/R = 0.54. ( c ) r/R = 0.87.
Effect of s ta l l model on tors ional moment - Condition 3 .
51

STATIC STALL MODEL ------ DYNAMIC STALL MODEL
gOOO\ DATA
AZIMUTH, deg
Fig. 30. Effect of stall model on pitch link loads - Condition 3.

, 1. Report No.
NASA TM-88351
CORRELATION OF SA3'+91/2 HELICOPTER TEST DATA WITH A COMPRESHENSIVE ROTORCRAFT MODEL
2. Government Accession No. 3. Recipient's Catalog No.
February 1987 6. Performing Organization Code
4. Title and Subtitle 5. Report Date
Ames Research Center Moffett Field, CA 94035
7. Author(s1 Gloria K. Yamauchi, Ruth M. Heffernan, and Michel Gaubert (Aerospatiale-Division Helicopters, Marignane, France) ,
9. Performing Organization Name and Address
11. Contract or Grant No. I
8. Performing Organization Report No. A-86385
10. Work Unit No.
13. Type of Report and Period Covered
Technical Memorandum 12. Sponsoring Agency Name and Address
National Aeronautics and Space Administration Washington, DC 20546
14. Sponsoring Agency Code 505-60-3 1
I
15 Supplementary Notes Point of Contact: Gloria K. Yamauchi, Ames Research Center, M/S TR-032
Moffett Field, CA 94035 (415) 694-6719 o r FTS 464-6719
17. Key Words (Suggested by Author(sJ)
Correlation Aerodynamics Structural loads
16. Abstract
18. Dist-ihution Statement
Unclassified - Unlimited
Subject Category - 65
A comprehensive rotorcraft analysis model was used to predict blade aerodynamic and structural loads for comparison with flight test data. The data were obtained from an SA349/2 helicopter with an advanced geometry rotor. Sensitivity of the correlation to wake geometry, blade dynamics, and blade aerodynamic effects was investigated. coefficients were predicted for the blade transonic regimes using the model coupled with two finite-difference codes.
Blade chordwise pressure
19. Security Classif. (of this report)
Unclassified 20. Security Classif. (of this page) 21. NO. of pager 22. Rice.
Unclassified 5 4
'For sale by the National Technical information Service, Springfield, Virginia 22161