of radon and lung cancer - new jersey case-control study of radon and lung cancer among mew jersey...
TRANSCRIPT

A CASE-CONTROL STUDY
OF RADON AND LUNG CANCER
AMONG MEW JERSEY WOMEN
Technical Report - Phase I
August, 1989
NEW' JERSEY
DEPARTMENT
OF
HEALTH
A BETTER STATE OF HEALTH
NEW JERSEY STATE DEPARTMENT OF HEALTH
Division of Epidemiology and Disease Control Division of Occupational and Environmental Health
Thomas H. Kean Governor
Molly Joel Coye, MD, MPH Commissioner of Health

A CASE-CONTROL STUDY OF RADON AND LUNG CANCER
AMONG NEW JERSEY WOMEN
TECHNICAL REPORT - PHASE I
AUGUST, 1989
NEW JERSEY STATE DEPARTMENT OF HEALTH
Division of Epidemiology and Disease Control
Division of Occupational and Environmental Health
A CASE-CONTROL STUDY OF RADON AND LUNG CANCER
AMONG NEW JERSEY WOMEN
TECHNICAL REPORT - PHASE I
AUGUST, 1989
TABLE OF CONTENTS
Executive summary iv
Introduction 1
Methods 9
Original subjects: selection and data collection 9
Subjects and residences for radon substudy 10
Radon exposure data collection 11
Statistical methods 13
Phase II of data collection 14
Results 15
Inclusion in the radon study 15
Type of measurement results 16
Analyses of radon concentrations by case-control status 18
Analyses of cumulative radon exposures 23
Relative risk coefficients 25
Discussion 26
Evaluation of, causality 27
Strengths and weaknesses of the study 30
Risk per unit of exposure 37
Smoking interaction, histology, age and gender interaction 40
Implications of exposure findings 44
Policy implications 46
Future analyses 50
Conclusions 53
References 55
Tables 59
Appendices:
A. Comparison of units of measurement for radon and cumulative
radon exposure.
B. Summary of original New Jersey female lung cancer case-control study (contd)

11
TABLE OF CONTENTS (contd)
Appendices (contd)
C. Detailed comparison of characteristics of women included vs.
not included in the radon substudy
D. Considerations with respect to changes in house construction.
E. Detailed information on radon measurements methods, including
quality control aspects and relationships between different radon
measurements.
F. Validation of residential histories
G. Comparison with results of statewide radon survey conducted
for New Jersey State Department of Environmental Protection
H. Considerations with respect to the house floor on which radon
measurements were made.
J. Estimates of year-round living area radon concentrations.
K. Analyses excluding estimates of year-round living area radon
concentrations.
Ill
EXECUTIVE SUMMARY
The New Jersey State Department of Health (NJDOH) has been conducting an
epidemiologic study of radon and lung cancer in New Jersey women. This study focuses
on the questions of whether and to what extent radon in homes is associated with
increased lung cancer risk. The importance of this question arose from the 1985 finding
of very high levels of radon, a known cause of lung cancer among underground miners,
in some Eastern Pennsylvania residences.
The New Jersey research reported here is the first large-scale epidemiological
study of radon and lung cancer based on actual measurements in homes and detailed
smoking histories for individual subjects. It is an extension of a case-control study of
lung cancer which previously had been conducted among New Jersey women. The cases
in that study were women newly diagnosed with lung cancer from August 1982 through
September 1983, while the controls were women without lung cancer but similar in age
and race to the cases. Information on smoking, residential, occupational and dietary
histories was collected for 994 cases and 995 controls.
The radon substudy initially focused on those New Jersey dwellings which met a
residence criterion, i.e., where subjects had lived the longest and for at least 10 years
during the period from 10-30 years prior to lung cancer diagnosis or control selection.
Both long-term and short-term radon measurements were made in these houses. Radon
exposures for subjects were estimated by year-long alpha track detector measurements
in the living areas. Four-day measurements of radon were made using charcoal
canisters in basements to provide quick screening measurements for current residents, in
case radon levels were so high that immediate remediation was needed, and to provide
back-up data in case year-long measurements of radon were not completed.
This report is based on radon exposure data from 433 cases and 402 controls.
Some of the original cases and controls were not included in the radon substudy
because address-specific information could not be collected, because no house met the

IV
residence criterion, or because radon tests could not be conducted at a house which did
meet this criterion.
The overall distribution of radon exposure was generally low: only 24 cases (5.6%)
and 12 controls (3.0%) had year-round living area radon concentrations of 2 pCi/L or
greater. After smoking, age and occupation were taken into account, the estimated lung
cancer risk for those exposed to the highest radon category (2-11 pCi/L) was 80%
greater than the risk for those at the lowest exposure level (less than 1.0 pCi/L).
Because the number of subjects in the higher exposure category was small, however, the
relative risk estimate was not statistically significant. In contrast, the trend for
increasing risk with increasing radon exposure was statistically significant; the
probability that this trend was due to chance alone was only 4%.
When duration of exposure was also taken into account, similar patterns of
increasing risk with increasing cumulative radon exposure were seen. The estimated
lung cancer risk for those exposed to the highest cumulative radon category (50-155
pCi/L-years) was 40% greater than the risk for those at the lowest exposure level (less
than 25 pCi/L-years). Furthermore, the increase in lung cancer risk over background
risk per unit of cumulative exposure was consistent with that generally found in the
studies of underground miners.
Study analyses also showed that lung cancer risk for women who smoked about
one pack a day was 1,000% • greater than risk for lifetime nonsmokers. This again
confirmed that smoking is the major cause of lung cancer.
Some of the results of this study must be interpreted cautiously because of the
small number of subjects in the highest radon exposure categories. Extensive data
analyses and discussion throughout the technical report and its appendices are designed
to consider the extent of any possible biases introduced by reduction of the potential
study population to those with actual radon exposure estimates.
V
Nevertheless, the study suggests that the findings of radon-related lung cancer in
miners can be applied to the residential setting. Excess radon exposures typical of
homes may increase risk of lung cancer; extremely high residential exposures would be
associated with very serious lung cancer risks. These results support the
comprehensive interdepartmental radon-related effort initiated in 1985 by the NJDOH
and the New Jersey Department of Environmental Protection, including provision of
technical information and services, citizen education, and research activities. The study
also confirms that smoking avoidance education should be strongly emphasized along
with radon reduction activities.
The exposure data yielded by this study also suggest that the relationship between
screening measurements and year-round living area measurements need better
characterization for public policy purposes and clearer understanding by the public
before remediation decisions are made. In addition, building code modification to
prevent radon entry may be an effective means for reducing overall population risks
from radon exposure.
Further data analyses may refine the results of this study. A second, still ongoing
phase of data collection will add more subjects to the substudy, and will result in more
complete exposure histories from additional houses for those subjects already included.
The findings of this study also need to be corroborated by other residential radon
studies currently underway worldwide. In the meantime, existing actions to reduce radon
exposure to the lowest feasible levels should be maintained. Remedial action should be
taken in residences when follow-up testing indicates that typical exposures of occupants
are above 4 pCi/L. This recommendation is not based upon the absence of any risk
below 4 pCi/L; rather, it is based upon the limited feasibility of remediating residences
below that level.
VI
A CASE-CONTROL STUDY OF RADON AND LUNG CANCER
AMONG NEW JERSEY WOMEN
TECHNICAL REPORT, PHASE I - AUGUST, 1989
ACKNOWLEDGEMENTS
This report on the New Jersey Radon-Female Lung Cancer Case-Control Study was
written by Janet Schoenberg (NJDOH, Division of Epidemiology and Disease Control) and
by Judith Klotz (NJDOH, Division of Occupational and Environmental Health). Other
persons who made important contributions to this study include Homer Wilcox, Maria
Gil-del-Real, and Annette Stemhagen (NJDOH, Division of Epidemiology and Disease
Control), Gerald Nicholls and Mary Cahill (NJDEP), Zdenek Hrubec (National Cancer
Institute, Radiation Epidemiology Branch), and Thomas Mason (National Cancer Institute,
Environmental Epidemiology Branch).
In addition, acknowledgements are due the following individuals: Lawrence
Meinert, Diana Kiel, William Parkin, Rebecca Zagraniski and Thomas Burke (NJDOH),
for administrative support, and for their review of several drafts of this technical
report and the summary report; the expert review panel: Victor Archer (University of
Utah), Olav Axelson (University of Linkoping, Sweden), and Jonathan Samet (University
of New Mexico), for their critiques of this technical report; John Boice, Jay Lubin, and
Michael Alavanja (NCI), for their comments on and discussion of this technical report;
Karen Tuccillo and other NJDEP radon project and laboratory staff, and Asora Carpenter
and other NJDOH field staff for assistance with data collection; Paul Hurwitz and other
staff of Westat, Inc., for assistance with data collection, coding and keypunching;
Joanne Bill and the other NJDOH field staff for their work on case ascertainment and
for conducting the interviews in the original female lung cancer study; Joanne Felton
and other NJDOH clerical staff for clerical- support; Sue Morrow and the customer
service staff of Terradex, Inc., for assistance with alpha-track detector results; Ronald
Altman, for administrative support during the original female lung cancer study and
during the initiation of the radon study; New Jersey pathologists and hospital staff for
assistance with rapid case ascertainment for the original female lung cancer study; and
all the women and their family members, as well as the current residents of study
houses, who gave their time and cooperation to this project.
This study was funded in part by a special NJ Legislative appropriation, and in
part by Contract NO1-CP-61031 and Grant RO1-CA-37744 from the NCI.
INTRODUCTION
In early 1985, the New Jersey State Department of Health (NJDOH) and the New
Jersey State Department of Environmental Protection (NJDEP) considered public policy
implications of the extremely high concentrations of radon * in homes on the Reading
Prong in Pennsylvania. The Reading Prong geologic region was known to extend into
New Jersey. Moreoever, gamma radiation surveys by aerial overflights suggested that the
radon problem in New Jersey might extend beyond the Reading Prong. Subsequently,
elevated radon levels were measured in homes in other regions of the state. Some New
Jersey homes were identified for which the lifetime cumulative exposures of residents
would exceed those for most uranium miners.
Among the initial decisions, and prior to any systematic testing of homes in New
Jersey, was the commitment to extend a recently-conducted statewide female lung cancer
study by including data on radon exposures. The collaborators in this study extension
included staff and managers of the Division of Epidemiology and Disease Control and
the Division of Occupational and Environmental Health of the NJDOH, the Division of
Environmental Quality of the NJDEP, and both the Radiation Epidemiology Branch and
the Environmental Epidemiology Branch of the National Cancer Institute.
The evidence that lung cancer is caused primarily by cigarette smoking is
voluminous and incontrovertible (USDHEW, 1979, 1980). Evidence is also strong
regarding other risk factors, including various occupations (Fraumeni, 1975) and diet
(Ziegler et al., 1986). The roles of environmental pollution, urban-rural differences
independent of smoking, and other potential risk factors are not as clear (Fraumeni and
Blot, 1982).
1 For the rest of this report, "radon" refers to both the gas itself and its short lived particulate decay products. Two principal types of units appear in this report,
those that denote radon or radon progeny concentrations (pCi/L, WL, Bq/m^, Bq/m^ EER), and those which denote cumulative exposure to residents or mine workers (pCi/L-
years, WLM, Bq/m^ a, Bq/m^ EER a, J hr/m-3). See Appendix A for equivalences.
2
Epidemiologic studies of miners have shown a strong and consistent dose-
response relationship between lung cancer mortality and radon exposure (NCRP, 1984;
NRC, 1988). The miner studies upon which the NCRP and NRC reviews and analyses
were based spanned many years and many countries, including the United States,
Canada, Sweden, and Czechoslovakia. They involved diverse types of underground mines
including iron, tin, and fluorspar as well as uranium. Most of the study designs were
"historical cohort," meaning that the population studied was classified according to past
exposure history and followed forward in time for observation of health outcomes.
Rates of specific causes of death were the health outcomes observed. The lung cancer
rates of the mining groups were compared to those of the general male populations in
their respective countries. Analogous case-control studies of miners were also conducted
(Samet et al., 1984, 1989).
While these studies probably had reasonable accuracy regarding vital status and
cause of death of subjects, exposure estimates were often less precise. Since radon
concentrations in mines usually had been measured not for epidemiological purposes but
for industrial hygiene and regulation purposes, overestimates or underestimates of typical
exposures may have resulted. Smoking data on individuals were collected in some but
not all of these studies. However, other possible causes of lung cancer, e.g., arsenic
and other toxic exposures, have not been shown to be explanatory of the excess
associated with radon. Mining cumulative radon exposures ranged from those
representative of lifetime residential exposures to two orders of magnitude higher in
some members of the US and Czech mining groups. Despite the wide range of
cumulative exposures, a remarkable degree of consistency in specific dose-response has
been observed in this body of research.
Furthermore, predictive models for the radiation dose to the lung under various
scenarios suggest similar doses per unit of radon exposure in homes as in mines (NRC,
1988). Extrapolation of the miner data to the levels of exposure found in houses
3
suggests a substantial risk for residents of some homes (NRC, 1988; Harley, 1984;
Radford, 1985; Klotz, 1986; Jacobi et al, 1987). However, there are some uncertainties in
this extrapolation. This includes questions on the applicability of findings in working
age men to women and to children. There also are questions regarding the extent of
excess risk at the lower radon concentrations typically encountered in homes.
Clarification of the degree of lung cancer risk from indoor radon has far-reaching
economic and public health policy implications because of the vast public and private
resources needed in order to identify and remediate residences with elevated radon
concentrations. Therefore, estimates of risk from elevated radon exposures are required
specifically for the residential setting.
Direct information on residential risk from radon has been very limited to date.
Most reports involve only correlation or "ecological" studies, i.e., those comparing lung
cancer rates and mean radon exposure or exposure potential in different geographical
areas but without including any specific information on individuals (Hess et al, 1983;
Letourneau et al, 1983; Stranden et al, 1987; Archer et al., 1987; Cohen et al., 1988).
Because the results of such studies are sensitive to confounders such as smoking and to
biases due to migration, strong conclusions cannot be drawn from those reports alone,
particularly since their results have been conflicting.
Individual-based epidemiologic studies, especially case-control studies (because of
their feasibility), are the design of choice for addressing public health policy questions.
Case-control studies of residential radon and lung cancer.
A number of small case-control studies have examined the association between lung
cancer and housing construction, or between lung cancer and residential radon exposure.
Six of these studies are summarized in Table 1, and are reviewed in detail below
(Axelson et al., 1979; Edling et al., 1984; Svensson et al., 1987; Axelson et al., 1988;
Svensson et al., 1989; Lees et al, 1987). Other studies, including some not yet

4
published, have been reviewed by Borak and Johnson (1989). In the review below, the
exposure units used by the respective papers are quoted, although conversion to
alternate units are also shown. (See Appendix A for brief descriptions, comparisons,
and conversions of the various types of units used for radon exposure.)
(a) Axelson and his colleagues first conducted a case-control study which examined
the association between housing type and lung cancer risk among rural residents age 40
and over in the Swedish counties of Ostergotland and Orebro (Axelson et al., 1979).
Rural residents were presumed to have few significant industrial exposures and to have
lived in the same houses for long periods of time. The study included 37 lung cancer
deaths recorded from 1965 to 1977, and 178 controls selected from the death registers,
excluding any cancer diagnoses.
The subjects' registered addresses were classified into three housing categories:
wooden house without basements; brick, concrete, or granite houses with basements; and
a mixed category. The age-and-sex-adjusted rate ratios were 1.7 for the mixed houses,
and 4.8 for the stone houses with basements, relative to 1.0 for wooden houses without
basements, showing a statistically significant trend.
Neither the actual lengths of residence in the houses nor the smoking habits of
the subjects were known. Based on earlier Swedish studies which compared
measurements of radon according to housing type, it was assumed that stone houses
with basements had higher radon levels, but no measurements of radon actually were
conducted in this study.
(b) Another Swedish study by Edling et al. (1984) was based on the primarily-rural
population of Oeland, an island with a narrow strip of alum shale-containing ' ground
which was associated with locally high levels of gamma radiation. The 23 cases
included all registered lung cancer deaths age 40 and over from 1960 - 1979, who had
lived in the same house for at least 30 years just prior to death. Apartment dwellers
were excluded. The 202 controls were a random sample of all non-cancer deaths in the
5
same years, applying the same age and residence criteria. Smoking data were collected
for all cases and for most of the controls.
The houses were classified according to three criteria: building material, (stone,
brick, or plaster vs. wood); presence or absence of a basement; and whether or not the
house was built on alum shale ground. The eight combinations based on these criteria
were then grouped into three categories, the lowest being wooden houses without a
basement on normal ground (see footnote b, Table 1). The .age, sex, and smoking
adjusted odds ratios were 1.2 for the middle category and 3.5 for the highest, relative
to 1.0 for the lowest, again showing a significant trend in risk with housing type.
Radon measurements were conducted in 86% of the houses, which were then
classified as <50 Becquerels per meter cubed (Bq/m3) equilibrium equivalent radon (EER)
[<0.0135 WL], 50-150 Bq/m3 [0.0135-0.04 WL], and >150 Bq/m3 [>0.04 WL]. The age, sex
and smoking adjusted odds ratio for the middle exposure group was 2.3, and for the
highest, 5.1, relative to the lowest exposure group (1.0), again showing a significant
trend in risk.
(c) A third Swedish study (Svensson et al., 1987) included 292 female long-term
residents of Stockholm who had been diagnosed from 1972-1980 with lung cancer,
specifically the histologic subgroup "unspecified epithelial" (primarily small cell
undifferentiated and large cell cancers). The 584 controls were long-term residents
who were selected from the population registry at random, and matched to the cases by
year of birth. No data on smoking habits of these subjects were obtained.
All of the addresses where subjects had lived up to 5 years prior to diagnosis of
the case were classified as positive if they were located on the radon-emitting ground
types2 and if they were single family detached houses or multi-family houses in which
L In Stockholm, ground types with increased likelihood of high radon emanation have been extensively mapped.
6
the subjects lived on the ground floor. Twenty-two of the case houses (7.5%) were
positive, compared to 21 of the controls houses (3.6%), giving an odds ratio of 2.2.
To validate the exposure classification, all positive houses and a sample (n=110) of
negative houses were selected for single grab sample measurements of radon daughters.
Case addresses which had been classified as positive had the highest measurements, but
these were not significantly higher than those for negative case addresses or for control
addresses.
(d) An incident lung cancer case-control study of women in Stockholm county was
conducted by Svensson et al (1989). For the 210 cases, two series of matched controls
were used, one population-based (n=209), the other hospital-based (n=191). The latter
were drawn from the same clinical department as the cases, but were found not to have
lung cancer. Details on individual smoking histories (active and passive), diet (foods
rich in vitamins A and C), and occupation were collected by interviewing the subjects.
As with some of the other studies, the exposure index was constructed by
characterizing former residences by soil and house type and by testing a sample of
those residences. The measurements were of a two-week duration and were conducted
during the heating season.
Relative risks were calculated on the basis of cumulative exposure estimates, using
years of occupancy and estimated radon concentration for each former residence
occupied for two or more years. For subjects with estimated cumulative exposures over
4,500 Bq/m3-years [24.3 WLM, or 121.5 pCi/L-years], the relative risk for all lung
cancer was 1.8. The trend was strongest for women over 70 years old and for small
cell carcinoma. The authors found a greater than additive lung cancer risk associated
with radon exposure in combination with smoking.
(e) Axelson et al (1988) also studied 177 population-based cases who had died of
lung cancer between 1960 and 1981 and 673 non-cancer deaths. Each subject had lived
at only one address for the last thirty years prior to death. Exposure classification was

7
based on house-type (construction material, presence or absence of a basement, and
underlying ground-types) and on measurements of a stratified sample of the residences.
Individual smoking data were collected from next of kin.
A positive trend for lung cancer and radon was found for the rural but not for the
urban subjects. Male and female subjects showed similar trends, with males having a
slightly stronger association between lung cancer and radon. Among the rural subjects,
"occasional" and passive smokers showed a stronger association than "regular" smokers.
(f) Another case-control study was conducted in Port Hope, Ontario, where
many of the houses constructed since 1933 have been built on waste materials from a
radium and uranium processing plant (Lees et al, 1987). The 27 cases with lung cancer,
all diagnosed or deceased from 1969-1979, were Port Hope residents for at least seven
years prior to diagnosis, and did not work in the uranium plant. The 49 birth-date and
sex-matched controls were selected with similar residence and occupation restrictions
from non-respiratory cancer registry files and from physicians' records. Smoking,
occupational, and residential histories were collected.
Radon measurements of all residences in the town had been made in 1975.
Comparing subjects with "non-zero" cumulative background-corrected exposures to those
with background or "zero" values gave a non-significant smoking adjusted odds ratio of
2.4. A statistically significant relationship resulted from analyses of exposures on a
continuous log scale, but the authors stated that the measurement precision may have
only justified the classification by high vs. low exposure.
Cohort studies of indoor radon and lung cancer.
A retrospective cohort mortality study of radon exposure among residents of
radium-contaminated neighborhoods in New Jersey was conducted recently by the NJDOH
(NJDOH, 1988; Klotz et al, 1989). Although the numbers of residents (752) in the index
houses limited the statistical power of the study design, a relative risk of 1.7 (95%
8
confidence interval, 0.83, 3.2), based on 10 lung cancer deaths, was observed among
white males when compared to expected rates derived from the New Jersey general
population. Females showed no excess, but only one case was found, while 1.5 was
expected. Possible confounding by smoking and occupation could not be assessed. A
cumulative exposure index in WLM was utilized; however, no dose-response gradient
was observed.
In summary, all six of the case-control studies as well as the cohort study are
suggestive of an association between residential radon exposures and lung cancer risk.
However, most of the studies did not include actual measurements of radon in the
houses of all subjects. Four of the case-control studies took smoking into account, but
two used only a crude adjustment. It was clear to the NJDOH and to the other
collaborating agencies that a large case-control study could address many limitations of
the former reports. By extending a prior New Jersey-based female lung cancer study, it
would be possible to include extensive data which had already been collected on
smoking, diet, and occupation, all of which were potentially important influences on
lung cancer risk. Thus, it was intended that the New Jersey radon study could help to
resolve the vital questions for public health policy as to whether the findings for
underground miners could be extrapolated to residential exposure settings.
Consequently, the study could help guide public agencies and citizens on radon testing
and remediation decisions.

NEW JERSEY RADON STUDY - METHODS
This radon study is an extension of a statewide population-based incident case-
control interview study of lung cancer previously conducted among New Jersey women
(Schoenberg et al., 1989; see Appendix B).
Original subjects: selection and data collection.
The original study cases included all female New Jersey residents who were newly
diagnosed with histologically confirmed primary cancer of the lung from August 1982
through September 1983. For cases who were interviewed themselves, controls
(frequency matched to cases by 5-year age groups and race) were selected during the
same time period from New Jersey drivers' license files (age <65) and from Health Care
Financing Administration files of persons enrolled for Medicare (age 65+). For cases
with next of kin interviews, individually matched controls were selected from state
death certificate files.
During the original study, personal interviews were completed for 994 (76.1%) of
the 1,306 cases identified and for 995 (68.7%) of the 1,449 controls identified. Details on
the reasons for nonresponse are summarized in Appendix' B. Fifty-three percent of the
interviews were conducted with the subjects themselves. The remaining interviews were
conducted with the spouse (17%) or with other next of kin (30%), mainly daughters, sons
and sisters.
The questionnaire included a lifetime brand-specific smoking history, information on
smoking habits of other household members, lifetime residential arid occupational
histories, and a history of consumption of foods containing vitamin A. These data
have been analysed in some detail, specifically with respect to lung cancer risk
associated with active and passive smoking, occupational exposure, and diet (vegetable
consumption), after adjusting for age, race, respondent type, education, and county of

10
residence. The distribution of all cases and controls with respect to these variables, as
well as odds ratios estimated from these data, are also summarized in Appendix B.
Subjects and residences for radon substudv.
In order to collect data on radon exposures, the original female lung cancer study
was extended, beginning in 1985. Based on the literature available at that time, a
minimum 10 year period was initially assumed between relevant exposure to radon and
diagnosis of lung cancer (see below, p. 14, for updates regarding this assumption). To
allow for sufficient duration of exposure, and to remain within available budgetary
resources for radon measurements, the extension study identified one New Jersey address
at which each subject had lived the longest and for at least 10 years during the
twenty-year period 10-30 years prior to case diagnosis or control selection
(approximately 1953-1972).
The residential information which had been collected previously specified only the
towns in which each subject had lived. Therefore, the subjects or their next of kin
were recontacted in the extended study to collect information on exact street addresses
during the period 1953-1982 and to identify an "index residence" which met the above
residence criterion (10+ years, approximately 1953-1972). Interviewers were not aware
whether the subjects were cases or controls.
For each index residence, the current occupant was identified and requested to
participate in the measurement portion of the radon study. Sometimes the current
occupant was the original study subject or a relative; frequently, however, the current
occupant was a person who was not related to the study subject.
A comparison of those subjects from the original study who were included in the
radon substudy and those not included is given in Appendix C.

11
Radon exposure data collection.
Radon study data collection at the index residences started in October 1986. At
each residence, information was collected on the house construction and ventilation,
including questions regarding any changes in construction which had occurred since the
current occupant or his/her family had lived in the house (see Appendix D). These
changes in construction have not yet been taken into account in the analyses presented
in this preliminary report.
Four-day screening measurements of radon were made using charcoal canisters
provided by and analyzed by the NJDEP (Parsa, 1986; EPA, 1987). More details on the
charcoal canister methodology are presented in Appendix E. The charcoal canister
measurements served two purposes: first, • to provide a relatively quick screening
measurement of radon for current residents, in case some had dangerously high levels
which necessitated immediate remediation; second, to provide some back-up data, in
case long-term measurements of radon (see below) were not completed.
Two charcoal canisters were installed in each index house by trained field staff
between October 1986 and April 1987. One canister was usually placed in the basement
or lowest living level of the house, the other usually in the master bedroom. The
residents were asked to maintain "closed house conditions" (windows closed, outside
doors closed when not in use). After four days of sampling, the residents closed and
sealed the exposed canisters and mailed them to the laboratory for analysis. The
laboratory staff were not aware of the case-control status of the houses. Standard
quality control procedures for analysis of the canisters were used (see Appendix E).
The principal exposure measurements for this study were year-long measurements
of radon using alpha track detectors (Type SF, Terradex Radon Detection Products,
Glenwood, IL) (Alter & Fleischer, 1981). More detail on the alpha track detectors is
also presented in Appendix E. Two alpha track detectors were installed in each house,
generally in the same locations as the charcoal canisters. For about 15% of the

12
addresses, a third alpha track detector was paired with one of the first two as a
quality control check on the measurement precision (See Appendix £). Alpha track
detectors were retrieved from the houses after about one year, except at a small
number of houses (29 out of 719, or 4.0%; see Appendix E for details) where a change
in ownership necessitated retrieval of the detectors before 11 months of exposure.
The detectors were shipped to Terradex for processing in 12 batches beginning in
September 1987. Most batches also included some quality control detectors which had
been exposed to known concentrations of radon gas at the Environmental Measurements
Laboratory (US Department of Energy, New York City), as well as some blank detectors
which had not been exposed at all (see Appendix E, Quality Control). Terradex was not
informed of the presence of the quality control detectors, which were prepared in such
a way as to resemble the other detectors submitted with each batch. All alpha track
detector results returned from the laboratory were reviewed carefully to verify that the
correct exposure dates had been used in the calculation of radon concentrations. Two
basement alpha track detector results were suspected as being artifacts because the high
reported concentrations were completely inconsistent with the charcoal canister results
and the living area alpha track results. All measurements at these two houses were
repeated (the alpha track measurements only for three months); the earlier basement
results were not replicated, and were deleted from the data set.
It was assumed that living area (non-basement) alpha track measurements would
provide the best estimate of the year-round radon concentrations to which the subjects
had been exposed when they were living in these houses. Therefore, the charcoal
canister measurements were not used for analyses except to estimate the year-round
living area radon concentration when no alpha track measurements were available.
Residents were informed of their charcoal canister results approximately 6-8 weeks
after the measurements were conducted. To our knowledge, remediation efforts were
undertaken at only one house as a result of these screening measurements (this was
13
taken into account by placement of two sets of alpha-track detectors for intervals of
three months before and nine months after the change). All residents were contacted
six to nine months after canister placement to determine if any significant changes in
construction or remediation had occurred. Residents with screening results between 4
and 20 pCi/L had been advised to wait for the results of the alpha-track detectors
before undertaking any remediation, in accordance with NJDEP guidelines at that time.
Duration of exposure to the radon concentration measured in the index house was
estimated from the dates provided by the respondent (original subject or next of kin) in
the residential history. Tax office records were used, whenever possible, to validate the
residential histories provided by the respondents (See Appendix F).
Statistical methods.
Because of concern regarding the precision of the radon measurements, particularly
at the low concentrations found in this study (see Appendix E), the distribution of
radon measurements was considered as a categorical variable. Results were expressed as
<1, 1-1.9, 2-3.9, and 4.0+ pCi/L. These cutpoints provide reasonably grouped frequencies
for a log-normal distribution (Nero, 1985), and also conform to the exposure groups
generally reported by the NJDEP. There were too few living area alpha track results
above 8.0 pCi/L to separate this group. Some analyses were also conducted considering
radon exposure as a continuous variable.
Standard non-parametric statistical procedures were utilized for comparison of the
distributions of cases and controls (Snedecor and Cochran, 1967; Fleiss, 1981). All
analyses ignore the age, race and respondent type matching in the original data;
therefore, adjustments were made for these variables in the analyses. Odds ratios (OR:
estimates of the lung cancer risk associated with radon exposure, after adjusting for
other factors) and 90% confidence intervals (CI) (equivalent to one-sided 95% CI) were
calculated using multiple logistic regression analysis (Breslow & Day, 1980), with the
14
microcomputer-based LOGRESS program (McGee, 1985). Log-linear trends in risk with
increasing exposure were also calculated using logistic regression techniques, for a
weighted categorical exposure variable or for a continuous exposure variable. The
significance of trends in risk was evaluated using the model Z statistic for the trend
term, with a one-sided p value of <_ 0.05. The difference in the likelihood ratio
statistics between successive models, evaluated as a Chi-square statistic, allowed for
determination of the goodness of fit of the models (Breslow and Day, 1980).
Parallel categorical analyses were conducted to estimate Mantel-Haenszel OR and
90% Cl (Mantel & Haenszel, 1959) and the Mantel Chi-trend statistic (Mantel, 1963).
Because these results were essentially similar to the logistic regression results, only
the latter will be presented.
Phase II of data collection.
A second phase of data collection is currently underway. Two factors led to this
second phase. One was the publication, since 1985, of data from miner studies
indicating a shorter period (five years) between relevant radon exposure and lung cancer
than had been assumed previously (Howe, 1986; NRC, 1988). The other factor was an
additional appropriation in 1988 by the NJ State Legislature providing funds for testing
of additional residences of the original subjects.
To date, as part of Phase II, approximately 200 additional houses have had canister
measurements and installation of alpha track detectors. These measurements will result
in more complete exposure histories for some subjects already included in Phase I of the
radon study, as well as the inclusion of additional subjects not in Phase I. The results
of these Phase II measurements are not included in the analyses in this report.
The criteria for houses being measured in Phase II, and examples of they will
affect inclusion in the study, are shown in Table 2.

15
RESULTS
Inclusion in the radon study.
The status of the original 994 female lung cancer cases and 995 controls in the
current radon substudy was examined (Table 3) in order to determine the extent of any
possible bias in the composition of the radon substudy population relative to the
original study population. Cases and controls did not differ significantly with respect to
their status in the substudy. However, slightly more controls did not have
measurements at the index residences, particularly due to refusal by the current
occupant to participate. More often than for cases, original control subjects were still
the occupants of the index residences. Some of these controls, who had already spent
considerable time being interviewed, did not want any further involvement with the
study.
Analyses in this radon study include the 411 cases and 385 controls whose index
residence was successfully tested for radon with alpha track detectors and/or charcoal
canisters. In addition, most analyses also include the 22 cases and 17 controls whose
index residence was an apartment above the second floor or a trailer, for whom radon
exposures were estimated (see Appendix J). Therefore, a total of 835 subjects (433
cases, 402 controls) are included in the radon study.
Table 4 shows the distribution of these subjects by age, respondent type and race,
and by active smoking (lifetime average number of cigarettes per day, total years
smoked, years since smoking cessation, tar content of cigarettes smoked from 1973-
1982), vegetable consumption, occupation, education, county of residence at diagnosis,
and passive smoking (for non-smokers only: exposure to spouse tobacco smoke). These
variables were considered as possible confounders in the analysis of any association
between radon exposure and lung cancer. Odds ratios which were estimated for these
variables in the original female lung cancer study are summarized in Appendix B. These

16
analyses confirm the importance of smoking as the most significant risk factor for
female lung cancer (particularly, number of cigarettes per day and years since smoking
cessation). In addition, age, occupation, vegetable consumption, and respondent type
(i.e., differences in smoking-related odds ratios by respondent type) also contribute
signficantly to the observed lung cancer risk.
More detailed analyses on the characteristics of those women included in the radon
substudy, compared to those women not included, are presented in Appendix C. Overall,
controlling for all the potential confounders, there was significantly greater
participation for cases from the original study than for controls. Moreoever, radon
study subjects were more often older, whites, either nonsmokers, light smokers, or ex-
smokers, residents of counties with higher radon levels, and more highly educated.
However, there were relatively few significant case-control differences between those
included and not included, except among heavy smokers, who showed some unusual risk
factor distributions (Appendix C).
Type of measurement results.
One or more alpha track measurements were completed for 719 (90%) of the 796
index residences tested in the radon study. One or more charcoal canister
measurements were obtained for 788 (99%) addresses. The canister measurements were
not used for analyses, except to estimate the year-round living area radon concentration
when no alpha track measurements were completed (see below, p. 17).
The charcoal canister results were also used to determine how the sample of
houses included in this study compared to other New Jersey houses. In Appendix G, the
distribution of basement or lower floor charcoal canister measurements from the 788
houses tested in this study has been compared, by county, to the distribution of
basement or lower floor charcoal canister measurements obtained in a statewide survey
of 5,727 homes conducted for the NJDEP. There was relatively good agreement
17
between the NJDEP survey and the case-control study, once the results were
population-weighted. However, the case-control study had significantly fewer houses
with lower floor charcoal canister measurements at 20+ pCi/L. This difference is at
least partially attributable to differences in sampling between the two studies (the
population based case-control study included more urban residents) and differences in
the ages of the houses tested (the case-control study houses were all at least 22 years
old). See Appendix G for further discussion of these issues.
A more detailed description of the type of radon measurements completed is shown
in Table 5. There were no differences in the distribution of measurement types
between cases and controls. Living area (non-basement) alpha track measurements were
completed for 664 of the index houses. This included 347 addresses with first floor
measurements and 317 addresses with second floor measurements. There were no
significant differences in the distribution of radon results between those houses with
first floor measurements and those with second floor measurements (see Apppendix H).
Living area alpha track measurements were not obtained for 171 of the index
residences. For 55 residences, only basement alpha track measurements were
completed. For 77 residences, only charcoal canister measurements (usually, both
basement and living area) were completed. No radon measurements were conducted at
the 39 addresses which were apartments above the second floor.
Living area radon concentrations for these 171 residences were estimated. The
procedures used for this estimation are described in Appendix J. The resulting estimates
were less than 1 pCi/L for 159 residences (including all 39 in the apartment 3+
category) and 1-1.9 pCi/L for 12 residences. The living area radon concentrations werre
not estimated as 2 pCi/L or higher at any of the 171 residences. Most analyses have
been carried out using the complete data set, including the estimates. However, some
analyses have been repeated on a data set which excludes the houses without actual
alpha track measurements of living area radon concentration (see Appendix K).
18
Analyses of radon concentrations bv case-control status.
Table 6 shows the distribution of year-round living area radon concentrations
(measurements and estimates) for the 433 cases and 402 controls. Radon levels were
less than 1 pCi/L for 666 of the subjects (79.0% of cases, 80.6% of controls), 1-1.9
pCi/L for 133 subjects (15.5% of cases, 16.4% of controls), 2-3.9 pCi/L for 28 subjects
(4.2% of cases, 2.5% of controls), and 4+ pCi/L for only 8 subjects (1.4% of cases, 0.5%
of controls). The total unadjusted odds ratios showed an increase in risk with
increasing radon exposure.
Table 6 also shows the data within each of four smoking categories according to
lifetime average daily cigarette consumption. The reference group for these odds ratios
is lifetime nonsmokers exposed to radon at less than 1 pCi/L. The unadjusted odds
ratios increased with radon exposure more for the light smokers (less than 15
cigarettes/day) and, to a lesser extent, for the moderate smokers (15-24 cigarettes/day).
Paradoxically, the heavy smokers showed a pattern of decreasing odds ratios with
increasing radon exposure. (Some possible selection biases and other factors related to
this observation are discussed below on p. 42). For the lifetime nonsmokers, the pattern
was inconsistent.
The right-hand column in Table 6 summarizes the unadjusted odds ratios for
smoking in this subset of the original study. The odds ratios show a strong increase
with increasing amount smoked. Smokers of about one pack a day had a greater than
nine-fold increase in risk relative to lifetime nonsmokers.
Odds ratios adjusted bv smoking. Table 7 again shows the unadjusted odds ratios for
the association of lung cancer with radon in all subjects, as well as the odds ratio after
adjustment for smoking (lifetime average number of cigarettes per day). There was
some confounding by smoking, i.e., the adjusted odds ratios were different from the
unadjusted odds ratios. The odds ratio estimated for 2-3.9 pCi/L decreased with
adjustment, while the odds ratio estimated for 4+ pCi/L increased. Because of the

19
small numbers of subjects with radon levels in each of the upper two categories, the
odds ratio was also estimated for the combined 2+ pCi/L category; this also decreased
after adjustment. The smoking adjusted odds ratios for all subjects, for all radon
exposure categories, were not statistically significant (i.e., the 90% confidence intervals
included 1.0). However, the trend statistics still showed a pattern of increasing risk with
increasing radon concentration at a borderline significance level (for weighted
categorical analysis, p = 0.068; for continuous analyses, p = 0.089).
The heavy smokers showed a pattern of decreasing odds ratios with increasing
radon exposure, which was opposite to the pattern shown by the light and moderate
smokers. When the difference in the slopes was evaluated (Rothman and Boice, 1982),
including all four smoking groups in the analysis showed significant heterogeneity (p =
0.035). Exclusion of the heavy smokers reduced the heterogeneity statistic to
nonsignificance (p=0.36). Therefore, analyses were also conducted for all subjects except
heavy smokers. The unadjusted and smoking adjusted odds ratios for these subjects are
also shown in Table 7. The adjusted odds ratio for 4+ pCi/L and for 2+ pCi/L in all
but heavy smokers were statistically significant. Moreover, there was a highly
significant increasing trend with increasing radon concentration (for weighted
categorical analysis, p = 0.008; for continuous analysis, p = 0.017).
Adjustment for other variables in addition to smoking. The odds ratios in Table 7 are
adjusted only for the lifetime average number of cigarettes smoked per day. There are
many other factors which contribute to lung cancer risk among New Jersey women
(Table 4, see also Appendix B), as well as other subject characteristics which should be
also be taken into account in the analyses. Table 8 shows the results of analyses in aH.
subjects adjusting not only for the lifetime average number of cigarettes smoked per
day, but also for that factor together with one or more of eleven additional factors
[age, respondent type, race, vegetable consumption, high risk occupation, education,
county of residence, number of years of cigarette smoking, numbers of years since
20
smoking cessation, and average tar content of the cigarettes smoked from 1973-1982,
plus the interaction between respondent type and numbers of cigarettes per day (see
Appendix B)]. In Table 8, the models are ranked by decreasing improvement in the fit
of the model, as evaluated by the difference in the likelihood ratio statistics; the
significance level for the improvement in fit is also shown in Table 8. Adjusting for
occupation, years since smoking cessation, or average cigarette tar content had the
greatest effect on the odds ratios and trend statistic; in these three models, the
categorical trend statistic passed below the p=0.05 significance level.
Multiple risk factor adjustment. Given the small number of subjects at the higher
concentrations of radon, it was considered inappropriate to adjust for all factors
simultaneously. The logistic model which took into account the number of years since
smoking cessation gave a much better overall fit to the data (improvement in the
likelihood ratio statistic) than the model which considered duration of smoking, and
gave a slightly better fit than the model which considered cigarette tar content.
Therefore, in further stepwise logistic regression modeling, only the smoking cessation
variable was used (along with lifetime average number of cigarettes per day). Adding
the age and occupation variables to those two smoking variables gave further,
significant improvement to the fit of the model. The odds ratios (90% CI), trend
statistics, and likelihood ratio statistics for this model are shown in Table 9.
A further model which added respondent type and the interaction between
respondent type and cigarettes smoked per day also gave significant improvement in fit,
and is also shown in Table 9. A final model which added vegetable consumption,
respondent type and race, but excluded the respondent type interaction terms is also
shown. There is no further improvement in fit for this model. For all three of these
models, the overall results were similar: There was a pattern of increasing odds ratios
with increasing radon level which was statistically significant (considering the
categorical trend variable) or marginally significant (considering the continuous trend
21
variable). The odds ratios at the 4+ pCi/L level was statistically significant for two of
the three models (the lower 90% confidence limit was 1.0 or greater).
Some multivariate analyses were also conducted examining the contribution of
additional interaction terms (respondent type*radon, radon*smoking, respondent
type*radon*smoking) to the fit of the model. Inclusion of the radon*smoking terms
gave a significant improvement in fit; however, this has already been considered by
conducting some analyses excluding heavy smokers. Additional interaction terms gave no
further improvement in the fit of the models.
Analyses excluding heavy smokers. Similar analyses were conducted excluding heavy
smokers and are summarized in Table 10. The logistic model which took into account
cigarettes per day, number of years since smoking cessation, age, and occupation gave a
significant improvement to the fit of the model (compare to Table 7). Addition of the
respondent type and respondent type*smoking interaction terms gave a marginal
improvement in the fit of the model. The model which added vegetable consumption
and race but excluded the interaction terms gave a slightly greater improvement in fit.
For all three of these models, the overall results were essentially the same: In the
subgroup excluding heavy smokers, there was a pattern of increasing odds ratios with
increasing radon level which was highly significant. In addition, the odds ratios at
both the 4+ pCi/L level and the 2+ pCi/L level were statistically significant (the lower
90% confidence limit was 1.0 or greater).
Analyses for heavy smokers onlv. A few analyses were conducted for heavy smokers
alone, in order to determine the magnitude of the negative trend in risk observed. The
2-sided p value for the negative categorical trend term in the unadjusted analysis was
0.120. Adjusting for age, occupation, respondent type, education, time since smoking
cessation, and vegetable consumption reduced the magnitude of the negative trend so
that the 2-sided p value was 0.360.

22
Analyses using a logarithmic continuous exposure variable. The categorical analyses
group the exposure variable as on a logarithmic scale, whereas the continuous variable
analyses have utilized an untransformed variable. A few analyses were also conducted
using a logarithmic transformation for the continuous exposure variable. Analyses were
conducted for all subjects, adjusting for cigarettes smoked per day, time since cessation,
age, occupation, respondent type, and the respondent type*smoking interaction
(comparable to the second model in Table 9). The Z statistic for the logarithmic trend
term was 0.50, with a one-sided p value of 0.309. For all subjects excluding heavy
smokers, a similar analysis (comparable to the second model in Table 10) yielded a Z
statistic of 1.04, with a one-sided p value of 0.149.
Histologic type. Analyses were also conducted according to the histologic type of the
case. Table 11 shows the distribution of all cases by. histologic type (and controls) by
year-round living area radon concentrations. Of the six cases with radon levels at 4+
pCi/L, three were small cell carcinomas; the remaining three included one squamous cell
carcinoma, one adenocarcinoma, and one other histologic type. Of the 24 cases with
radon levels at 2+ pCi/L, seven were small cell carcinomas and eight were
adenocarcinomas; the remaining nine included three squamous cell carcinomas, three
large cell carcinomas, and three other histologic types. All histologic types except
squamous cell carcinoma had a greater percentage of cases with elevated radon
exposures (2+ pCi/L) than did the controls.
Table 12 shows the adjusted odds ratios for the association of each histologic type
of lung cancer with radon. The pattern of increasing odds ratios with increasing radon
level was found for all histologic types, with the possible exception of squamous cell
carcinoma. Only large cell carcinoma showed a statistically significant trend in odds
ratios for the weighted categorical analysis (p = 0.027) but there were no cases exposed
at the 4+ pCi/L level. The odds ratios was significant for small cell carcinoma at 4+
pCi/L (OR=13.2; 90% CI = 1.5, 118.2). The odds ratios was also significantly high for
23
"other histologic types" at 1-1.9 pCi/L (OR=2.1, 90% CI = 1.2, 3.8), but insignificant at
higher radon levels.
Passive smoking. Analyses were also conducted taking into account passive smoking
exposure by lifetime nonsmokers (see Appendix B for background from the orginal case
control study). Table 13 shows the distribution of the 274 nonsmokers (61 cases, 213
controls) by year-round living area radon concentrations, as well as by exposure to
spouse tobacco smoke (no exposure, exposure to spouse cigarette smoke, exposure to
spouse tobacco smoke only from pipes and cigars). Adjusting for exposure to spouse
tobacco smoke had very little effect on the odds ratios estimated for radon exposure
among nonsmokers, or on the trend statistic in this subgroup.
Similar analyses (not shown) were also conducted considering exposure to tobacco
smoke from any household member, not just the spouse. Adjusting for any household
tobacco exposure had no effect on the odds ratios estimated for radon among
nonsmokers. Therefore, neither of the nonsmoker-passive smoking exposure variables
were considered in the overall model for all subjects.
Analyses of cumulative radon exposures.
All of the analyses described above have considered only the radon concentration
measured in the living area of the index residence. The number of years of residence
at the index address had not yet been taken into account. A cumulative exposure index
multiplies the radon concentration by years of residence. In the development of the
cumulative exposure index used in these anslyses below, several assumptions have been
made:
(1) A minimum period of five years since relevant radon exposure has been
assumed, rather than ten years, making the exposure period of interest the years from
5-30 years prior to case diagnosis or control selection. This assumption is based on the

publication, since 1985, of data from miner studies indicating a shorter time period
between radon exposure and lung cancer incidence (Howe, 1986; NRC, 1988).
(2) Based on the median radon concentration for control subjects in this study, a
minimum exposure of 0.6 pCi/L has been assumed for each year during the index period
when a subject lived in a house other than the index residence, because these other
houses were not tested for radon in Phase I.
The resulting cumulative exposure distribution has been divided into subgroups of
<25, 25-49, 50-99, and 100+ pCi/L- years, corresponding to <5, 5-9, 10-19, and 20+ WLM
(assuming 50% equilibrium and 80% occupancy). Each level represents the equivalent of
25 years of exposure at <1, 1-1.9, 2-3.9, or 4+ pCi/L, respectively.
Table 14 shows the distribution of cumulative radon exposures for the 433 cases
and 402 controls. Cumulative exposures were less than 25 pCi/L-years for 701 of the
subjects (83.4% of cases, 84.6% of controls), 25-49 pCi/L years for 108 subjects (12.9% of
both cases and controls), . 50-99 pCi/L years for 21 subjects (2.8% of cases, 2.2% of
controls), and 100+ pCi/L years for only 5 subjects (0.9% of cases, 0.2% of controls).
The unadjusted odds ratios showed an increase with increasing cumulative radon
exposure, with the greatest increase for the small numbers of subjects with 100+ pCi/L-
year exposure.
Table 14 also shows the distribution of the cases and controls within each of the
four smoking categories according to lifetime average daily cigarette consumption, and
the odds ratios relative to nonsmokers with <25 pCi/L-years exposure. The pattern of
increasing odds ratios with increasing cumulative radon exposure was strongest for light
smokers and, to a lesser extent, for moderate smokers. The pattern was inconsistent
for both lifetime nonsmokers and heavy smokers.
Table 15 shows the odds ratios among all subjects after adjustment only for
smoking (lifetime average daily cigarette consumption) or after adjustment for lifetime
average daily cigarette consumption, years since smoking cessation, age, occupation,

25
respondent type, and the respondent type*smoking interaction. Odds ratios were
statistically significant for exposures of 100+ pCi/L-years. The categorical trend
statistic showed a marginal pattern of increasing odds ratios with increasing cumulative
exposure (p = 0.090).
Table 15 also shows the adjusted odds ratios among all subjects excluding heavy
smokers. None of the cumulative radon exposure categories had odds ratios which were
statistically significant. However, the trend statistics showed patterns of increasing
odds ratios with increasing cumulative exposure which were statistically significant (p =
0.029, 0.030).
Histologic tvoe. Analyses were also conducted according to the histologic type of the
case. Table 16 shows the distribution of all cases by histologic type (and controls) by
cumulative. radon exposure. Of the four cases with cumulative radon exposures at 100+
pCi/L, two were small cell carcinoma, one squamous cell carcinoma, and one
adenocarcinoma. Of the 16 cases with cumulative radon exposures at 50+ pCi/L, six
were small cell carcinoma, two squamous cell, four adenocarcinoma, two large cell, and
two other histologic types.
Table 17 shows the adjusted odds ratios for the association of each histologic type
of lung cancer with cumulative radon. A pattern of increasing odds ratios with
increasing cumulative radon exposure was found to varying extents for all histologic
types except for squamous cell carcinoma. The pattern was strongest and most
consistent for the undifferentiated histologic types, including small cell, large cell, and
other types. Only the odds ratio for small cell carcinoma at 100+ pCi/L-years and for
other histologic types at 25-49 pCi/L-years were statistically significant.
Relative risk coefficients.
In order to compare the results of this study with those of others, particularly
among miners, the continuous cumulative exposure analyses were used to calculate the

26
increase in risk per pCi/L-year, and the corresponding increase in risk per WLM. This
result is usually called the "relative risk coefficient" and is expressed as a percentage
increase in risk per unit of exposure. The results of these calculations are shown in
Table 18. For comparability with other studies, results are shown not only for all
subjects but also for all smokers and all nonsmokers. The relative risk coefficient for
all subjects was 3.4% (90% CI: 0%, 8.0%). Only the relative risk coefficient for all
subjects excluding heavy smokers was statistically significant (5.9%; 90% CI, 0.7%, 11.2%).
Table 18 also shows the calculated relative risk coefficients for all subjects by
histologic type, which range from a low of 0% for squamous cell carcinoma to a high of
6.7% (0, 17.4%) for large cell carcinoma.
DISCUSSION
In this section, the results of the first phase of this case-control study of radon
and lung cancer among New Jersey women are discussed with regard to inferences about
causality which can be drawn, contributions to the body of knowledge about indoor
radon and lung cancer, and public health policy implications.
As described previously, the study was undertaken to test the hypothesis that
higher indoor radon and radon decay product exposures are associated with excess lung
cancer risk. Validation or rejection of this hypothesis is important to citizens and
public policy makers because of the considerable effort and resources which are being
devoted to testing and remediating elevated indoor radon concentrations. Although the
cause-effect link between radon and lung cancer is incontrovertible for the high
concentrations which have been seen in the occupational setting, many have questioned
the extrapolation of that link to lower radon concentrations usually seen in residences.
This study supports a radon-lung cancer link in residences, but some of its results
must be interpreted cautiously for reasons which are described below.

27
Evaluation of causality: Guides to drawing inferences from epidemioloeic data.
First, the results are considered in the context of how epidemiologists interpret
statistical associations between an exposure and a health outcome and draw conclusions
about a cause-effect relationship (Rothman, 1986).
Consistency with previous findings. In a specific study, an association between
exposures and health effects supports the inference that the association may be causal
if it is consistent with other research and if similar findings have been previously
reported in other populations. As described in the Introduction, there is a vast body of
evidence indicating that decay products of radon cause lung cancer. Our results are
consistent with those of uranium and other hard-rock miners and with those of
residential case-control studies already reported from other countries (See Table 1).
Biological plausibility and coherence. When there is an internally consistent. body of
knowledge which provides a biologically plausible basis for relating an exposure and
hypothetical effect, there is more support for such an association to be interpreted as
representing causation. There is ample information from human and animal observations
and from radiation biology to predict a priori (that is, independently) that the alpha and
other radiation emitted by radon and its decay products would be carcinogenic to the
respiratory system when inhaled. These predictions are based on: (a) the highly
damaging quality of alpha radiation, (b) the behavior of radon decay product particles in
the respiratory system, and (c) the experimental and predicted radiation dose to the
lungs resulting from typical and high radon concentrations in indoor air. All previous
modeling, based on animal and human data, predicts that the radiation dose to the living
cells of the lung lining from radon inhalation far exceeds the radiation dose to all
other organs combined. The estimated dose to the human lung, even from typical
indoor radon concentrations, is more than twice the dose typically absorbed by people
outside of medical, unusual occupational or accidental circumstances (NCRP, 1984).
Dosimetry models (NRC, 1988) suggest that radiation dose to dwelling occupants are

28
similar to those of miners for similar cumulative radon exposures, even accounting for
differences of breathing patterns and particle characteristics between mines and homes.
Dose-response issues. Causality is supported when an exposure-effect relationship
increases in strength with increasing exposure. Our study found that overall relative
risks increased directly with exposure (Tables 7,9,10,15), whether intensity or cumulative
exposure was considered. Statistical tests for trend were used to quantify strength of
this dose-response relationship. The trend in our study was found to be strongest among
light and moderate smoking subgroups (Tables 6,7,10) and, depending upon the exposure
index used, for the undifferentiated histologic types, predominantly "small cell" and
"large cell" (Tables 12,17). However, there were variations in dose-response among
smoking groups, as discussed below.
Strength of association between health outcomes and exposure indices. In interpreting
epidemiological data on the effects of exposure to an agent, a greater rate of disease or
degree of biological response is interpreted as indicating a higher likelihood that an
observed association is causal. The method we used to assess strength of association,
or degree of risk, is the "relative risk" (RR) as estimated by the "odds ratio" (OR). The
relative risk (the risk of lung cancer in the radon-exposed subjects divided by the lung
cancer risk in the "unexposed") must be adjusted for numerous other variables,
especially smoking and age, which are in themselves important predictors of lung cancer
probability. A relative risk (or odds ratio) greater than 2.0 is often interpreted as
indicating a strong association, and above 5.0, one that is extremely strong.
In the current study, relative risks for women in the groups with higher exposure
intensity (2+ pCi/L) were 1.6 to 1.8, depending upon the number of variables included in
the adjustment used (Tables 7-9). That is, when controlling for other variables, the
risks of lung cancer were 60% to 80% greater for women exposed to the range of 2.0
pCi/L to 11.3 pCi/L (on an annual basis in the living area) compared to the risks for
background indoor concentrations of less than 1.0 pCi/L. Similarly, after making

29
conservative assumptions about the years not measured, the relative risks for women
who accumulated over 50 pCi/L-years during the twenty-five-year exposure period
under study were 1.3 - 1.4. That is, when controlling for other variables, the lung
cancer risks were 30-40% greater for women exposed to the range of 50-155 pCi/L-years
than women who accumulated the typical 25 pCi/L years (see Table 15). For the
occasional household in New Jersey with extreme radon levels, such as 200 pCi/L, lung
cancer risks are probably much higher, although not necessarily proportionally higher.
Specificity. A classic cause-effect relationship in communicable disease depends upon a
unique microbe's association with a particular clinical syndrome. In environmental health,
it is rare to find a disease caused by only one agent and lung cancer is no exception.
Lung cancer in modern society is, of course, primarily due to cigarette smoking.
However, occupation and diet are also important factors. For these reasons, the effects
of smoking and other factors were carefully controlled in the analyses (See Tables
7-9,15).
Sequence (order of occurrence) of exposure and health effect. The long latency (that
is, time between exposure and initial diagnosable effect) of lung cancer after its
initiation is one of the factors which makes epidemiologic research on its causality so
difficult. In contrast with correlation studies (see Introduction), the design of this study
specifically addressed the estimated exposures of each individual subject from five to
thirty years prior to diagnosis of the cases.
Internal consistency of results among subgroups. Causality is supported when all
subgroups or strata of important variables which could confound the study show similar
results. Therefore, the difference among smoking subgroups in our findings weakens our
causal inferences. However, it should be noted that the subgroup of heavy smokers is
particularly prone to other competing causes of death and may also be subject to
certain selection biases (see below, pp. 30-32 and Appendix C).

30
Other considerations. The observed association between lung cancer and radon became
stronger with more rigorous adjustment (Tables 7-9) and this fact strengthens the causal
inference. However, when duration of exposure as well as intensity (i.e. cumulative
exposure) was considered, the strength of the association decreased, thereby weakening
the causal interpretation (Table 15).
Strengths and weaknesses of the study.
The issues in this section affect the validity of application of this study's findings
to the general population of women in New Jersey, and, by implication, to people in
other locations.
Health outcome data. Among the strong features of this study are the objectivity,
validation, and systematic nature of the lung cancer data. As discussed earlier and in
Appendix B, the original cases and controls were drawn systematically from the entire
New Jersey population, and the cases were all validated through review of pathology
reports and other medical records. Thus, health outcome misclassification should be
infrequent or absent. As discussed below, however, the designation of specific
histologic type was nat independently validated, so that analyses by cell type may be
somewhat affected by misclassification.
Possible selection biases. Although the cases and controls in the prior statewide
female lung cancer study were- population based, the residence criteria and the need to
have the cooperation of both subjects and current occupants of former residences
resulted in a reduction of the original study subjects by about 60% and could have
introduced some biases into the current study. Such biases could have resulted in
observing either a greater or lesser radon-lung cancer association. As described more
fully in Appendix C, the women included in the radon study extension were not
completely representative,with respect to certain factors, of those in the original lung
cancer study.

31
(a) In general, more cases than controls were included in the study extension,
particularly because control subjects who were still the current residents of the index
houses tended to have higher refusal rates. This may have biased the results if the
missing controls tended to have higher radon exposures. Future analyses using New
Jersey geographic data on radon potentials as a surrogate for missing years may help to
indicate the magnitude of any possible bias (see pp. 51-52).
(b) Both the cases and controls who were included in the study extension were
older than those from the original study who were not included because of the
residency criterion of at least 10 years in one house. Since many people tend to move
more frequently at younger ages, this shift in age was expected. If the risks due to
radon exposure are proportionally greater in older age groups, as has been suggested by
some occupational studies (NRC, 1988; NCRP, 1984), our findings may be slightly
exaggerated. Conversely, if radon-induced lung cancer is proportionally more prominent
in younger women, the findings might slightly underrepresent the true hazard to the
general population.
(c) For both cases and controls, the subjects in the study extension were less
likely to have had respondents who were next-of-kin other than spouses (see Appendix
C). For most variables, it is not known whether any bias in the findings could have
resulted from differences in accuracy or completeness of data supplied by a relative
other than a spouse. For smoking, a detailed discussion of potential biases is given on
P. 42).
(d) The statistically significant underrepresentation of non-whites from the
original study in the radon extension was also a function of the residence criterion.
However, since a similar pattern resulted for both cases and controls, and since race
was not an important predictive variable in either the multivariate analyses on the
original data set (see Appendix B, Table B3) or the radon extension (see Appendix C2,
C3), we do not believe that major bias was thus introduced.
32
(e) With regard to educational level, the representation of cases and controls
included from the original study did differ. The cases included fewer women with less
than eight years of school. Again from Tables B3, C2 and C3, that variable was not
seen to have an important effect on lung cancer outcome when considered together with
smoking and radon exposure, and was not included in the final models (Tables 9,10,15).
However, the striking underrepresentation of cases with less years of schooling among
the heavy smokers suggests that this subgroup may be particularly biased. This
possibility is reinforced by an underrepresentation of controls with high vegetable
consumption among the heavy smokers.
(f) With respect to residence at diagnosis the nonsmokers in the original study
showed a significant risk associated with residence in the "low radon" counties, while
heavy smokers showed a marginally significant risk associated with residence in the
moderately low radon counties (see Appendix C). These observations, together with
selective underrepresentation of "low radon" county controls among the heavy smokers,
suggest that other as yet undetermined geographically associated risk factors might be
operating to mask any slight radon effect in nonsmokers or heavy smokers.
(g). The design of the study did not allow the evaluation of effects of residence
mobility per se on the likelihood of high radon exposure or lung cancer. Since
relatively low mobility during the thirty years prior to diagnosis was a criterion for
inclusion, any independent relation of lung cancer or radon concentration to mobility
could have increased or decreased the observed association. Future analyses (see later
section in this Discussion) will treat the issue of mobility with regard to other
variables.
Exposure data. In contrast to most other studies of this type reported previously,
actual radon measurements were made in each and every index house except for
apartments above the second floor. The technicians who placed the detectors and the
laboratory technicians who assayed them did not know the case or control status of any

33
detector. Residential duplicates, "spiked" samples, and blanks were used for quality
assurance (See Appendix E).
Another strength of the study is the use of year-long measurements in living
areas as the exposure index and the use of short-term measurements for screening,
consistency checks, and as contingency measurements. Short term measurements under
"worst case conditions" are generally used by citizens to screen their homes and by
agencies to rapidly assess radon exposure potential and needs for service. "Worst case"
conditions are: heating season, "closed-house", and floor closest to the underlying soil.
Such screening conditions are appropriate for initiating decisions on whether further
testing isneeded, but they are, by definition and intent, exaggerations of the radon
concentrations inhaled by occupants of a dwelling on a year-round basis (see Appendix
E). When "worst case" exposures are used to make quantitative risk assessments, the
resulting risk assessment tends to underestimate the hazard per unit of exposure, and
subsequent application of these unit risks to true annual average measurements result in
risk assessments which are unrealistically low.
Further, year-long measurements have the advantage of smoothing over the daily
and seasonal radon fluctuations due to meteorological variations, varying proportions of
time spent at home, and varying amounts of time spent on each floor of the house.
As discussed above (also see Appendix J), certain index houses did not have long-
term living area measurements completed. The relationships generated between the set
of contingency samples (short-term canister measurements) and long-term alpha tracks,
on both lowest and upper floors, appeared stable enough (see Appendix E,Tables E4a,
E4b) to enable us to confidently assign an exposure interval for missing measurements.
When analyses were conducted without the estimated values, the results agreed with
those which included the estimates although there were inevitable losses in statistical
power (Appendix K., Tables Kl-4).

34
Because residency data were collected from respondents and validated through tax
records, a cumulative radon exposure index could be constructed. The cumulative index
was utilized in addition to the radon intensity concentration as an exposure variable. A
cumulative exposure index has generaly been used in mining studies (NRC, 1988; Howe et
al., 1986) and has been seen to vary directly with risk in a dose-response gradient.
A necessary weakness of any retrospective study of this type is the collection of
exposure data in the present time when the exposure of interest actually occurred in
the past. The factors which cause daily and seasonal radon fluctuations are not likely
to have significantly affected the measurements we made, but there is a possibility that
changes in house construction, heating, ventilation, occupants1 activity, and hours per
week of occupancy could cause major inaccuracies in the exposure estimates.
Equally important are the "missing years" of observation. The distribution of
years not accounted for by the measurements leaves the possibility that high or low
radon exposure in the unaccounted years could have caused significant exposure
misclassification for some subjects. This is especially true for those subjects (10.0% of
cases and 10.9% of controls) for which less than half of the 5-30 year index residence
period was accounted. "Phase II" measurements currently in progress are expected to
address this issue.
Remaining lifetime years (beyond the 25-year index residence period) may also
contribute radon exposure which are important to lung cancer risk. Analyses including
all available data on the time window 5-40 years and 5+ years did not appreciably alter
the relative risk coefficients. However, relatively few subjects had complete
measurements for these longer time periods.
House occupancy pattern (rooms in which subjects spent most time) is a factor
which could not be addressed in this study; the proportion of time spent at home per
year may be addressed by later analyses of time and place of occupation (see pp. 52-53).
35
Radon measurements in the lower ranges, such as were found in this study, have
a greater probability of random misclassification. Random exposure misclassification
tends to bias results so as to reduce the observed difference between groups. Since a
significant dose relationship was, in fact, found for the main study hypothesis, an
erroneous conclusion probably did not result from any random exposure misclassification
caused by the above factors. We have no reason to believe that there was any
systematic exposure misclassification, especially between cases and controls.
Furthermore, the distribution of measurement results are overall in excellent agreement
with those of NJDEP after adjusting for population distributions (see Appendix G).
The quality control results described in Appendix E suggest that the precision of
the measurements may not be sufficient to analyze all of the data on a continuous
scale, particularly given the low levels of exposure prevalent in this study. Therefore,
categorical analyses (<1, 1-1.9, 2-3.9, 4+ pCi/L) were used predominantly and the
continuous variable analyses of exposure should be interpreted very cautiously. On the
other hand, cumulative exposure, which includes the additional component of residence
duration, may be less sensitive to the imprecision of the measurement, and the
continuous cumulative exposure analyses may be more reliable. This is the justification
for presenting results of both continuous and categorical analyses in this report.
Potential confounders. Confounders are factors which can selectively influence both
exposure observations and health effect observations. They may thereby distort an
observed association between the exposure effect of interest.
The effect of smoking, by far the most important determinant of lung cancer, is
distinguished from the effect of radon in this study by stratifying in some analyses by
smoking and by controlling for smoking in multivariate analyses using logistic regression.
Smoking is important when evaluating radon as a lung carcinogen in women as shown in
this study by the differences between the relative risks for smoking-adjusted versus
non-adjusted analyses. These observations also underscore the importance of
36
individual-based study designs such as case-control, in contrast to "ecological" or
correlation studies (see the Introduction). Ecological studies are unable to examine and
control for smoking differences among individuals and geographical areas. Differences
in the radon-related risks by smoking, combined with the overwhelming risk of smoking
itself, may mask any overall radon effect in the general population. (A more detailed
discussion of the smoking-radon interactions we found, and their possible interpretation
appear later in this Discussion).
Among the strengths of this study were the detailed dietary and occupational
histories and complete data on various demographic characteristics such as educational
level. As can be seen from Table 7, demographic and socio-economic factors such as
race and educational level were not important in modifying the effect of radon on lung
cancer after smoking was taken into account. Occupation, dietary factors and
respondent type were included in the final multivariate models along with smoking
parameters and age.
Numbers of subjects and measurements: Statistical power. The small number of
residences which had high annual exposure measurements (especially the very few above
4 pCi/L) limit the inferences which can be drawn because of the statistical instability in
those categories. Therefore, our results must be interpreted cautiously. However, the
total number of subjects for whom residential measurements were made exceeds most
previous individual-based residential studies and is a major strength of the study.
It should be noted that this study was not designed on the basis of prior
statistical power calculations. This usual practice was not followed because of the
particular history of the study as an extension of a prior one (see Methods and
Appendices B and C). The statistical power to find an association of lung cancer and
radon was extremely limited. Considering the annual upstairs radon distribution found
in the controls of 3% above 2 pCi/L (Table 6), we would have predicted that this study
could only detect a risk of 2.3 or greater with 80% statistical power using a "one-tailed"

37
test for statistical significance at the 0.1 probability level. This latter probability
denotes the frequency of accepting a radon effect when, in fact, the observed
difference arose by chance and sampling error only (Schlesselman, 1974). Nevertheless,
a relationship has been supported by the data, although the possibility cannot be ruled
out that confounders which could not be controlled for are producing the observed
association. Extra caution should be used in interpreting all findings on subgroups of the
study population such as smoking categories and histological. types, since multiple
statistical tests on subgroups increase the probability of artifacts of "statistical
significance" due to chance alone.
Risk per unit of exposure.
In comparing miner studies and especially in deriving from them predictions about
the degree of hazard from indoor radon exposure under various scenarios, the concept
of excess risk per unit exposure of radon decay product has been a convenient method
for assessing the potency of radon as a carcinogen.
Risk models: Absolute (attributable) and relative risk. Incremental risks from radon
exposure can be understood and expressed in two different ways:
(1) as the additional (absolute) increment, or number of cases beyond those that
would have occurred in a given population without the extra exposure. This is
"attributable risk".
(2) as the proportional (percent) increase in the underlying lung cancer risk.
This is called "relative risk". Its calculation requires knowledge of the baseline risk.
The former expression is generally easier to describe and understand; however, it
cannot be estimated directly from case-control studies. The current scientific consensus
is that in radon carcinogenesis a relative risk model is appropriate, especially with
regards to age. It has also been suggested that both relative and attributable risk
models may be appropriate for different populations, depending upon age and smoking

38
status (Archer, 1988). The roles of gender and smoking in risk from radon have yet to
be resolved. The effect of a pure relative risk process would be to produce the largest
number of excess cases in smokers, in people between 55 and 65 years old, and in
males. So far, all of these patterns have been generally observed where such
comparisons were possible (NRC, 1988).
Estimates of risk per unit of exposure from miner studies. Excess risk per unit dose
has historically been expressed in one of two ways using "working level month" (WLM)
as a unit for cumulative exposure. Most unit risk estimates from the miner studies
assume a linear dose-effect relationship at lower radon intervals and fall between these
intervals:
Attributable (absolute) risks:
a) 5-50 excess lung cancer cases
million people per year per WLM exposure
b) 100-800 excess lung cancer cases
million lifetimes per WLM exposure
Relative (proportional) risks:
a) 1% - 4% increase in lung cancer
WLM exposure
b) "Doubling dose" between 25 WLM and 100 WLM (i.e., cumulative exposure
of 25-100 WLM would result in doubling of baseline risk.
The National Research Council's "BEIR IV" report (NRC, 1988) analyzed a
compilation of underground miner data and calculated a relative risk of about two
percent per WLM, when considering certain additional factors such as time interval
since exposure. It should be noted that the above estimates were all derived from
males only.
Limits of extrapolation using risk per unit of exposure. A simple proportionality of
excess risk per unit of radon dose cannot be realistically applied without some bound.
Without some modification, over 100% risk could be calculated for some of the
extremely high occupational or residential exposures which have been documented,
39
clearly an absurdity. In fact, groups of miners who had accumulated in excess of about
1,000 WLM did not show as steep an increase in lung cancer risk per unit of exposure
as did their counterparts with lower cumulative exposures, indicating some plateauing of
effects (NCRP, 1984). In the current study, however, and in the overwhelming majority
of residences, such huge exposures are not seen. There is also evidence from the miner
studies that low dose rates are associated with greater risks per unit of dose (Sevc et
al., 1988).
Risk per unit of exposure from previous residential studies. Previous residential study
estimates have been quite consistent with the occupational estimates (Edling et al., 1986;
Svensson et al., 1989; Axelson et al., 1988). However, as reviewed in the Introduction,
most former residential studies did not include enough measurements to generate unit
risk estimates.
Risk per unit of exposure yielded bv the current study. The coefficients which were
derived from this study are relative risks per unit of radon exposure. They are
calculated directly from the odds ratios found in Table 18 for the trends of lung cancer
risk in relation to cumulative radon exposure using the continuous exposure variable.
The slope of the excess relative risk (RR - 1.0) per pCi/L-yr. was used to calculate the
equivalent percentage increase in risk per WLM (using the equivalents in Appendix A).
In Table 18, the estimates of the percentage increase of relative risk of lung
cancer per WLM are given for various smoking categories, in order to permit
comparison with former studies. The relative risk per unit dose for the entire study
population combined was 3.4% (0.034) per WLM (90% C.I. 0%,8.0%), somewhat in excess
of the BEIR IV coefficient, but definitely within the range of underground miner studies
generally, especially considering the sampling variability of our estimates. The
coefficient for all smokers combined had about the same magnitude. Non-smokers had
the smallest risk coefficient, 2.0% (90% C.I. = 0%, 10.2%). The coefficient for all
40
subjects excluding heavy smokers was 5.9% (0.7%., 11.2%) and was statistically
significant.
Attributable or "absolute risk" coefficients were then derived from the unit relative
risks when applied to typical lung cancer incidence rates. For women, current annual
lung cancer incidence in New Jersey is approximately 300 per million, and for men, 900
per million. Therefore, an attributable risk coefficient per WLM - person year derived
from this study is about 3.4% x 300, or about ten excess cases per million person years
per WLM for women. If the same coefficient were applied to males, about 30 excess
cases per million person-years per WLM would be estimated. These attributable risk
coefficients are also within the ranges previously found in mining studies.
Issues of smoking interaction, histology, age, and gender interaction.
Previous epidemiologic studies of radon exposure in miners, and residents and
experimental studies in animals have produced differing findings with regard to the
interaction of smoking and radon (Cross et al., 1982; Axelson and Sundell, 1978;
Whittemore and McMillan, .1983; Damber and Larsson, 1982; Samet et al., 1989). The
interactions suggested by those reports have ranged from less than additive to
multiplicative. It is possible that the roles of age and radon dose (intensity and rate)
may be responsible for the different observations (Archer, 1988).
Given the small number of nonsmokers among the cases, the generally low radon
exposures, and the prior estimates of the risk per unit of radon exposure, we would not
have expected to observe a large radon effect on lung cancer in this subgroup.
Therefore, we do not interpret the absence of an observable trend in the nonsmokers as
inconsistent with former studies. Consequently, it is prudent and consistent with all
other available evidence to continue to advise nonsmokers to avoid unnecessary radon
exposure.

41
Since cigarette smoke contains a mixture of potent carcinogens and is believed to
act as both an initiator" and a promoter of cancer (Van Duuren, 1976), it is plausible
that a combination of both radon and cigarette exposure might produce a carcinogenic
effect in excess of either exposure's single effect. However, the net result of the
complex changes which cigarette smoke exerts on the respiratory tract could plausibly
increase and/or decrease the alpha radiation dose to the lung lining cells (Axelson and
Sundell, 1978; NRC, 1988).
In former radon studies, characterization of smoking history has rarely been
conducted with the detail we used in the current investigation (See Appendix B). Most
prior distinctions have been between smokers, vs nonsmokers and exsmokers, regular vs
"occasional" smokers, or between those who smoked more or less than ten cigarettes per
day (Svensson et al., 1989).
Some evidence from animal and occupational investigations are not inconsistent
with a less than additive effect of radon in combination with heavy smoking.
Experiments with beagles which suggested protective effects of tobacco smoke for
radon-induced lung cancer used very high tobacco doses (Cross et al, 1982). There is
also circumstantial evidence that many miners who smoked would have been classified as
light or moderate smokers. According to Archer et al. (1973), most lung cancer cases
among their cohort smoked a pack per day or less, and the authors state that only a
49% increase in lung cancer was attributable to smoking among this cohort (compared to
approximately 80-90% in the general population). In addition, it is plausible that there
would be a selection against heavy smokers continuing to work as miners and/or to
survive until the ages at which lung cancers usually appear (sixth to seventh decades);
other lung diseases and heart diseases tend to decrease fitness for mining and to
increase early death.
In our study, the small number of nonsmokers hampered the ability to analyze the
effect of active smoking or passive smoking on radon risk. In addition, as described in
42
Appendix C, there could have been misclassification of smoking by non-spouse
next-of-kin or a selection bias with regard to geography for heavy smokers or for
nonsmokers. Because of the loss of subjects due to the residence criterion and to and
other reasons, the radon study was no longer strictly population-based as was the prior
lung cancer study.
It is important to consider that our own sample of heavy smokers might be biased
in some ways, particularly with respect to education and diet (see Appendix C). Heavy
smokers were the most under-represented subgroup of the prior lung cancer study in the
radon study extension. We surmise that smokers tend to have smoking spouses.
Women who were heavy smokers would therefore be more likely to be widowed than
women who were nonsmokers, and might tend to relocate after becoming widowed.
Also, smokers themselves are more likely to die of smoking-related disease other than
lung cancer. All these phenomena would tend to reduce the proportion of heavy
smokers in our prior study who met the residence criteria for radon measurements or
might make it more difficult for us to find the appropriate former residence and gain
access to it. In addition, we have already observed differences in smoking-related risk
by respondent type which are possibly related to misclassification of smoking by
next-of-kin respondents (Schoenberg et al, 1989; see Appendix B). The possibility of a
case response bias, and resultant misclassification even by subject respondents is purely
speculative but cannot be ruled out. Possible misclassification of smoking must be taken
into account before accepting the smoking-related differences in radon risk suggested by
these results.
It is therefore unclear what phenomena are responsible for specific patterns seen
in this study, i.e., an apparent multiplicative interaction of radon with light smoking, an
apparently negative interaction with heavy smoking, and an inconsistent effect in
nonsmokers (no trend). It is important for public health practice that we resolve this
issue, and it is hoped that our own ongoing work, as well as forthcoming reports from

43
other states and from other countries, will eventually clarify the interpretation of the
results presented here.
It is also essential to emphasize that smoking is by far the most serious risk
factor for lung cancer, and, in particular, that smoking about one pack per day
increases the risks fourteen-fold in women who currently smoke (Appendix C;
Schoenberg et al., 1989) compared to the overall less than two-fold risk of radon found
in this study.
Histology. Particular cell or histological types of lung cancer which are differentially
associated with radon exposure could have medical significance for early diagnosis and
treatment. In early analyses, underground miner studies suggested that small cell lung
cancer was the major histologic type induced by radon (U.S.D.O.E., 1988, NCRP, 1984)
. Later analyses, however, indicated that squamous cancer (also called epidermoid) was
also found in excess in uranium and other miners, and that even other histologies, such
as adenocarcinoma and large cell cancer, were elevated, although less dramatically
(NCRP, 1984; NRC, 1988; U.S.D.O.E., 1988).
One mining study (Sevc et al., 1988) found that small cell excesses predominated
at lower cumulative radon exposures while the increase in squamous cancers continued
beyond 500 WLM. It is possible that the much lower concentrations in dwellings would
produce, a histology pattern at variance with that seen in male workers exposed to much
higher levels. Since females tend to have a somewhat different distribution of lung
cancer cell types, it is of particular interest to observe the histological findings of the
present study. Smoking is a stronger risk factor for squamous and small cell carcinoma,
but it also causes adenocarcinoma and large cell lung cancer.
The cumulative exposure results (Table 17) suggest that the undifferentiated-
histologic types including small cell and large cell lung cancer are most closely
associated with radon exposure while squamous cell cancer is least affected. However,
analyses of these subgroups are unstable due to the small numbers at the higher radon
44
exposures. Furthermore, histologic type was not validated by independent pathology
review in this study, so that misclassification of histology is possible (Schoenberg et al.,
1989). Our findings need to be corroborated by forthcoming residential studies before
they are judged to be definitive.
Ase and gender comparisons. Since underground miner research was conducted on
working age males, only residential studies can address radon-related risk comparisons
of adults vs children, as well as males vs females. The design of this study did not
permit the consideration of effects of exposure during childhood, but our focus on
females, for reasons given earlier, permits tentative gender comparisons on degree of
risk, smoking interaction, and histological types, among other issues.
Males have greater baseline lung cancer risks than females. In extrapolating from
male-based mining studies to females, our initial hypothesis was that we would find
similar proportional lung cancer risks but lower absolute (attributable) risks in females
compared to males. This prior expectation is based on the studies on A-bomb survivors
(NRC, 1988) former residential radon case control studies (Edling et al., 1984; Axelson et
al., 1988;) and our own former (not statistically significant) observations (NJDOH, 1988).
Application of the present type of design to both sexes in future studies will be needed
to evaluate the degree to which the current findings can be extrapolated to males.
Implications of exposure findings.
The annual exposures found in the study group were lower than had been expected
on the basis of a statewide survey (NJDEP, 1989) which included primarily screening
measurements. Several factors contribute to this difference:
1) The ratio of annual average exposures (using alpha track detectors in living
areas) to "worst case" screening concentrations (using charcoal canisters in basements in
winter under "closed house" conditions) decreased as the screening concentrations
increased (see Appendix E).

45
2) Previous estimates of the "annual average" radon concentrations (see data
summarized by Nero et al, 1986) have often been calculated as the average of two
screening measurements, one in the winter and one in the summer. This may
overestimate the true annual average concentration.
3) The houses in this study also tended to have lower screening measurements;
only one house had a basement screening measurement of 20+ pCi/L. The houses may
not have been typical of all New Jersey houses, e.g., they were at least 25 years old
due to the residence criterion (dwellings occupied by our cases and controls at least 20
years prior to 1982-1983 when the subjects were identified). It is possible that new
houses tend to be "tighter" and tend to have higher radon concentrations because of
less ventilation and to be built in areas of New Jersey with higher radon potential (see
Appendix G). Additional study subjects and index houses which are being added in
Phase II of the study may be newer and "tighter" and may have higher radon levels.
4) The geographically-based screening study conducted for NJDEP (1989) was not
population-weighted (see Appendix G). That is, dwellings in rural areas were more
likely to be tested than dwellings in more urban areas with higher population densities.
In contrast, the original cases and controls in our study were derived from a
population-based sample with higher proportions of subjects from low radon counties.
The exposures in urban areas in New Jersey are likely to be lower, partially due to a
greater probability of residence in high-rise apartments. In addition, even detached
houses in urban areas have lower radon levels than detached houses in suburban or rural
ares (see Appendix G). This may be related to differences in the underlying geology of
the areas which happen to be urban in New Jersey. Consequently, the exposure
distribution of this study is likely to be much lower than that based on a
geographically-stratified sample.

46
There are several important implications of these exposure findings:
(a) The results support the use of follow-up tests rather than screening tests
when making remediation decisions. Such procedures are already advised by the USEPA,
NJDEP, and NJDOH, but are not necessarily understood by the public.
(b) If our findings concerning the ratio of average annual to worst case radon
concentrations are confirmed by other studies, remediation may not be necessary for as
many dwellings in the state (and the nation) as previously had been believed based on
the distribution of measurements.
Population attributable risk. Estimates of average exposure as well as risk per unit
dose are used to calculate total population attributable risks from radon. It should be
noted that the relative risk coefficients (excess risk per unit of exposure) yielded by
this study are slightly higher than those extrapolated from most occupational studies.
However, if the differences between screening measurements and the actual annual
exposures in the living areas are corroborated, estimates of the number of excess lung
cancer cases due to radon in the state and in the nation may decrease. Testing and
remediation recommendations to individuals and agencies located in areas with high
radon potential would not be modified by such results.
Policy implications.
The results of this study have important implications with respect to the policies
which have been followed concerning radon-related issues.
Degree of health concern about radon exposure. The results of this study, in
combination with previous data, suggest that radon is a carcinogen in the residential
setting. From our data, the excess lung cancer risk per unit of radon exposure appears
to be consistent with underground mining studies. These findings also suggest that even
the relatively low exposures typical of dwellings may increase risk of lung cancer and

47
that high exposures would be associated with very serious lung cancer risks. If our
results are corroborated, there does not appear to be an exposure limit for radon which
can be used to totally avoid risks; instead, reduction of excess lung cancer risk must be
based on avoidance of unnecessary exposure.
Governmental radon programs. The observation of probable lung cancer risk at even
moderately elevated radon exposures supports governmental actions to educate citizens,
provide technical information and services, and conduct research on health effects,
testing, and remediation. Furthermore, smoking avoidance education should be included
and strongly emphasized in all governmental radon risk education activities. The
distinction between radon screening and annual average tests should be emphasized.
Remedial action level recommendations. Given that radon appears to be a lung
carcinogen even at low, unavoidable exposures, the recommended action levels must be
based on feasibility of remediation. The current guidance remains:
1) Follow-up testing should be conducted when a screening test under worst case
conditions (heating season, ground level closed house) exceeds 4 pCi/L, in order to
characterize the annual exposures to occupants of the dwelling. The length of the
follow-up testing should depend upon the screening result: over about 20 pCi/L,
follow-up tests should be short term; below 20 pCi/L, long-term measurements are
better, but short-term testing may also be useful under certain circumstances.
2) Remedial action should be taken when follow-up testing indicates that typical
exposures of occupants are elevated and when remediation is feasible, i.e., when typical
exposures are greater than 4 pCi/L.
The above action levels are not based only on acceptability of risks, because a
true health-based guideline for a carcinogen such as radiation would be associated with
zero exposure or with extremely small calculated risks such as less than one per million.
However, even outdoor radon levels (about 0.1 - 0.2 pCi/L) and baseline indoor levels
(0.2 - 1.0 pCi/L) are predicted to result in considerably more lung cancer than one in a

48
million on the assumption of no "threshold" exposure and linearity of risk for lung
cancer risk for radon. The forseeable future does not appear to hold any promise for
changing this unavoidable exposure or the associated risks.
There are two types of practical limitations to reduction of radon exposure:
a) Remediation efficacy: As the indoor concentrations approach the baseline,
there are diminishing returns in radon concentration reduction as a result of remedial
action. For any house, at some point of radon concentration further actions are
increasingly expensive and decreasingly effective. (This phenomenon is true of
pollution abatement generally).
b) Validation of remediation: As the indoor radon concentrations are reduced
closer to background, normal daily/weekly/seasonal fluctuations due to weather
ventilation, etc., can easily mask any improvements in radon gas levels which result
from further remediation. In order to be sure whether any action has succeeded,
testing must be increasingly long in duration and sophisticated in sensitivity. It
therefore becomes even more difficult to reduce radon concentrations below a certain
point because the results of such actions cannot be easily verified.
There- has been consensus from national radon technology experts that 4 pCi/L is
currently an achievable goal for most dwellings. There is also intensive research
underway throughout the world to increase the effectiveness of both new construction
and remediation techniques for citizens. It is hoped that these efforts will contribute
to the long-range goals of limiting indoor radon to outdoor (background) concentrations.
Meanwhile, it has been the policy of the NJDOH and NJDEP to urge attainment
of the lowest radon exposure which is currently feasible for citizens, to support a
decrease in the officially-recommended exposure limit as soon as such technology is
considered practical, and to support the implementation of building construction codes so
that radon entry resistant dwellings will be built in areas with high exposure potential.
The findings of this case-control study on lung cancer and radon in New Jersey women
49
support these policies, since they are consistent with the belief that even radon
concentrations at or below the current guidance levels probably cause small increases in
the chances of lung cancer. However, it is important that public health agencies
periodically review new data on health risk, monitoring and remediation, and that policy
recommendations to citizens are updated whenever necessary.
Recommendations on specific geographic areas. This study did not address potential
radon exposures in various counties or municipalities. The ongoing data collection and
updated guidance in this regard by the NJDEP continues to be the best guide to citizen
testing.
Policies addressing maximum individual risks vs population risks. Indoor radon is an
example of a public health hazard in which some individuals are subject to much higher
exposures than most others. It is appropriate for public health policy to address
reduction of risk both to the most highly exposed individuals (maximum individual risk)
and to the public as a whole (population attributable risk).
Extensive media attention and resources by NJDEP have been devoted to the
discovery of houses with extremely high radon levels (e.g. over 200 pCi/L). Some
occupants of such houses are exposed to higher concentrations than those typical of
some uranium miners and may have lung cancer risks approaching or even exceeding
those of cigarette smokers. While identification and remediation of such houses do not
make a large impact on population-attributable risks, they may have a dramatic effect
on reducing the lung cancer risks for the specific occupants.
The excess risks to individual occupants of houses with low radon exposures are
quite modest compared to other causes of lung cancer to which members of the public
are subject, specifically, smoking and certain occupational exposures. However, in the
population as a whole, most of the lung cancer risk due to radon is a result of
relatively low exposures. Locating and assuring reduction of moderately elevated
indoor radon concentrations is not likely to make a large impact on rates of lung

50
cancer unless conducted on an extremely wide scale. Despite massive publicity and
educational activities of public agencies and the media, it is believed (G. Nicholls,
personal communication) that considerably less than half of New Jersey dwellings in the
areas with the highest radon potential have been tested to date. There is little
information regarding the proportion of houses screened which have had follow-up
testing and even less data on the population of houses with annual averages over the
current guideline 4 pCi/L, which have been remediated.
Moreover, because remediation is not yet feasible at levels less than 4 pCi/L,
revised building codes designed to render new dwellings more resistant to radon entry
may have a far-reaching effect on overall population risks. To be effective such codes
need to be widely implemented, especially in areas with high radon potential.
Considering these issues of population and individual risks also help to
underscore the importance of public policies and resources devoted to avoidance and
cessation of smoking in addressing lung cancer hazards. There has been a fallacious
historical distinction between the involuntary assumption of risks due to exposure such
as radon, and the voluntary assumption of risks due to smoking. However, the
overwhelming majority of smokers began as children, and by the time they reached
adulthood were addicted. The allocation of public health resources should reflect the
magnitude of the relative and population attributable risks, regardless of any presumed
voluntary nature of smoking exposures.
Future analyses.
This report is neither a final point in the data collection nor of data analyses
for this study. Nonetheless, we consider it important to share with the New Jersey
public and the scientific community the findings to date because of their important
implications in validating the activities conducted and recommended so far by the

51
NJDOH and the NJDEP. Several important additions to the study are planned for the
near future.
"Phase II" houses. As described in the text above, the original study design and
resources limited radon assessment to only one residence per subject. Phase II residence
measurements are currently under way and are intended to add more years of radon
measurements to those included in this report as well as more subjects from the
previous lung cancer study to the radon extension. The accuracy of cumulative radon
exposure estimates and the statistical power of the study will be increased, and
exposure misclassification may be decreased in this manner. All additional data analyses
described below will include the Phase II residence data.
Time analysis of radon exposure. The 1988 "BEIR IV" report of the National Research
Council proposed a model linking radon exposure and lung cancer in underground miners
which included a factor called "time since exposure" (NRC, 1988). In particular, the
NRC concluded that exposures during the time interval 5-15 years before diagnosis or
death from lung cancer produced twice the risk increment as exposures before that time.
Further analyses of the data in this report combined with Phase II residences will be
used to test the hypothesis that the BEIR IV model applies to residences in that
respect.
Quantitative modeling of smoking interaction. Further statistical analysis of the
interaction of smoking and radon will be conducted. The BEIR IV and other models
proposed by other research reports will be explored. As described above, ages and rates
at which exposure to radon and smoking occur may be important in determining degree
of risk.
New Jersey geographic data on radon potential as a surrogate for missing years. As
described earlier and in Appendix G, the NJDEP has conducted a statewide stratified
sampling of about 6,000 residences and other buildings. As a result, they have
generated municipality-based and county-based estimates of average radon exposure.
52
As illustrated in Appendix G, there is generally good agreement between the results of
the NJDEP study and the distribution of the radon concentrations from our own study
set taking into account differences in sampling between the two studies and the house
age restrictions in the case-control study.
In a subsequent analysis, we will use municipality-specific or county-specific
radon data from the DEP study to estimate the remaining missing years (among the
25-year exposure window) for New Jersey houses in our study (after Phase II houses
have been added). A comparison of the dimensions and significance of risk estimates
and trends of the data will then be made with and without use of these surrogates. We
hypothesize that the use of the geographically-based surrogates will improve the
predictive value of radon exposure for lung cancer risk in our data (i.e., the
significance of dose-response trends will increase).
Urban-rural gradient. There have been several indications that the urban or rural
character of a dwelling locality may predict radon exposure or the observable
association of radon with lung cancer. For example, the results of Axelson et al. (1988)
found a significant radon-lung cancer association in rural but not urban areas of
Stockholm county. Therefore, in a subsequent analysis, population density, our subjects'
own characterization of the urban-rural nature of their residence, and other factors will,
be used to explore the effect of an urban-rural factor on the multivariate model for
lung cancer risk. The distribution pattern of radon in New Jersey, i.e. the highest
radon is generally found in rural areas, particularly suggest this analysis.
House construction changes. We will explore whether data from the house construction
characteristics and changes described in Appendix D can be useful. That is, we will
consider whether using modifications of radon concentration indices on the basis of such
data can increase the predictive value of the radon exposure for lung cancer risk.
Use of occupational data to improve exposure estimates. In a future analysis, details on
time and place of occupation for these women subjects will be used to improve
53
estimates of number of hours per week spent at home. Modest improvement in both
cumulative radon exposure estimates and the trends for cumulative exposure and lung
cancer are expected.
Relocation frequency. In a future analysis, the relative frequency with which subject
subgroups moved their residence will be observed in order to further consider factors
which could have influenced our results because of the residency requirement in our
design.
CONCLUSIONS
Radon exposure is universal; everyone is exposed to radon to some degree. This
interim report is intended to contribute to decisions by public agencies and individuals
regarding the importance of limiting radon exposure, wherever it is feasible to do so.
The findings of the first phase of the New Jersey epidemiologic study of radon and
lung cancer in women are consistent with recommendations to reduce exposure which
have been made by the New Jersey Department of Health, New Jersey Department of
Environmental Protection, U.S. Environmental Protection Agency, and other federal
agencies. These recommendations have been in effect since the widespread problem of
elevated radon exposure from naturally-occurring sources became known in the
mid-1980's.
This study found statistically significant or marginally significant trends in lung
cancer risk with increasing radon exposure. However, the number of subjects in this
study with annual exposures above 4 pCi/L was very small; therefore, the results should
be interpreted very cautiously. The degree of excess risk per unit of radon exposure
which were found are in good agreement with the few previous individual-based
residential studies and with the many occupational studies of underground miners.

54
Forthcoming analyses of additional measurement data may improve the confidence of the
risk estimates from this study.
The exposure data yielded by the study suggest that a relatively small percentage
of houses in New Jersey which are more than 25 years old have annual averages above
4 pCi/L, although in certain geographic areas, the proportion is larger. Moreover, the
relationship of screening to annual average exposures may need better characterization
for public policy purposes and clearer understanding by the public before remediation
decisions are made.
One potentially important finding was that the strongest effects of radon exposure
were seen in light and moderate smokers. However, the possible contribution of
misclassification of smoking and selective underrepresentation of heavy smokers cannot
be ruled out. It is clear that cigarette smoking, even at the level of one pack per day,
remains by far the most important risk factor for lung cancer in most women and men.

55
REFERENCES
Alter HW and Fleischer RL. Passive integrating radon monitor for environmental monitoring. Health Physics 40:693-702 (1981).
Archer VE. Association of lung cancer mortality with precambrian granite. Arch Environ Health 42:87-91 (1987).
Archer VE. Lung cancer risks of underground miners: Cohort and case control studies Yale J Biol Med 61: 183-193 (1988).
Archer VE, Gillam JD, and James LA. Radiation, smoking and height, relationship to lung
cancer in uranium mines. HE Nieburg, ed, Prevention and Detection of Cancer Part 1. Vol. 2. New York: Marcel Dekker, Inc. 1689-1712 (1978).
Archer VE, Wagoner JK, Hyg SD, and Lundin FE. Uranium mining and cigarette
smoking effects on man. J Occup Med 15:204-211 (1973).
Axelson O, Anderson K, Desai G, et al. Indoor radon exposure and active and passive
smoking in relation to the occurrence of lung cancer. Scand J Work Environ Health 14:286- 292 (1988).
Axelson O, Edling C and Kling, H. Lung cancer and residency - A case referent study
on the possible impact of exposure to radon and its daughters in dwellings. Scand J
Work Environ Health 5: 10-15 (1979).
Axelson O and Sundell L. Mining, lung cancer and smoking, Scand J Work Environ
Health 4:46-52 (1978).
Borak TB and Johnson JA. Estimating the risk of lung cancer from inhalation of radon
daughters indoors: review and evaluation. U.S.E.P.A. 600/6-88-008 (1988).
Breslow NE and Day NE. The Analysis of Case-Control Studies. IARC Scientific
Publication No. 32. IARC, Lyon (1980).
Cohen BL. Correlation between mean radon levels and lung cancer rates in U.S.
counties: "A test of the linear no-threshold theory." Proceedings of the Symposium on
Radon and Radon Technology. Denver (1988).
Cross FT, Palmer RF, Filipy RE et al. Carcinogenic effects of radon daughters, uranium ore dust and cigarette smoke in beagle dogs. Health Physics 42:33-52 (1982).
Damber L, and Larsson L-G. Combined effects of mining and smoking in the causation
of lung carcinoma. Acta Radiologica Oncology 21:305-313 (1982).
Edling C and Axelson O. Quantitative aspects of radon daughter exposure and lung cancer in underground miners. Brit J Indust Med 40:182-187 (1983).
Edling C, Kling H and Axelson O. Radon in homes - A possible cause of lung cancer Scand J Work Environ Health 10:25-34 (1984).
Fleiss JL Statistical Methods for Rates and Proportions. New York: John Wiley & Sons 1981.

56
Fraumeni JF Jr. Guest Editorial: Respiratory carcinogenesis: An epidemiological appraisal.
J Natl Cancer Inst 55: 1039-1046 (1975).
Fraumeni JF Jr, Blot W. Lung and Pleura. In: Schottenfeld D, Fraumeni JF Jr, eds,
Cancer Epidemiology and Prevention. Philadelphia: Saunders, 1982, pp564-582.
Harley N. Radon and lung cancer in mines and homes. New Engl J Med 310:1525-1526
(1984).
Hess CT, Weiffenbach CV and Norton SA. Environmental radon and cancer correlations
in Maine. Health Physics 45:339-348 (1983).
Howe GR, Nair RC and Newcomb HB. Lung cancer mortality (1950-80) in relation to
radon daughter exposure in a cohort of workers at the Eldorado Beaverlodge uranium
mine. J Natl Cancer Inst 77:357-362 (1986).
Jacobi W, Lafuma J and Land CE. Lung cancer risk from indoor exposures to radon
daughters. A report of a Task Group of The International Commission on Radiological
Protection.
Klotz JB. Estimating lung cancer risks of indoor radon: applications for prevention. In:
Indoor Radon - APCA Specialty Conference Proceedings, Air Pollution Control
Association, Pittsburgh (1986).
Klotz JB, Petix JR and Zagraniski RT. Mortality of a residential cohort exposed to radon
from industrially- contaminated soil. Am J Epidemiol 129:1179-1186 (1989).
Lees RE, Steele R and Roberts JH. A case-control study of lung cancer relative to
domestic radon exposure. Int J Epidemiol 16: 7-12 (1987).
Letourneau EG, Mao Y, McGregor RG et al. Lung cancer mortality and indoor radon
concentrations in 18 Canadian cities. In Proc. 16th Midyear Topical Meeting of the
Health Physics Society, Albuquerque, (1983).
Lubin JH and Blot WJ. Assessment of lung cancer risk factors by histologic category. J Natl Cancer Inst 73: 383-389 (1984).
Lundin FE, Lloyd W, Smith EM, et al. Mortality of uranium miners in relation to
radiation exposure, hard- rock mining and cigarette smoking - 1950 through September
1967. Health Physics 16:671-578 (1969).
Mantel N and Haenszel W. Statistical aspects of the analysis of data from retrospective
studies of disease. J Natl Cancer Inst 22:719-748 (1959).
Mantel N. Chi square tests with one degree of freedom: Extension of the Mantel-
Haenszel procedure. J Amer Stat Assoc 58:690-700 (1963).
McGee D. A program for logistis regression on the IBM PC. Am J Epidemiol 124: 702-5 (1986).
NCRP Report No. 78: Evaluation of occupation and environmental exposures to radon
and radon daughters in the United States. National Council on Radiation Protection and Measurements, Bethesda (1984).
57
NRC: BEIR IV: Health Risks of Radon and Other Internally-Deposited Alpha-Emitters.
Committee on Biological Effects of Ionizing Radiation. National Research Council.
National Academy Press, Washington (1988).
New Jersey Department of Environmental Protection. Statewide scientific study of radon
(1989).
New Jersey Department of Health. Mortality experience of residents exposed to elevated
indoor levels of radon from an industrial source (1988).
Nero AV, Schwehr MB, Nazaroff WW and Revzan KL. Distribution of airborne Radon -
222 concentrations in U.S. Homes. Science 234:992-997 (1986).
Parsa B. Measurement of radon-222 concentration in indoor air. New Jersey Department
of Environmental Protection (1986).
Radford EP. Potential health effects of indoor radon exposure. Environ Health Perspec
62: 281-287 (1985).
Rothman K.J. Modern Epidemiology. Boston: Little, Brown and Co. (1986).
Rothman KJ and Boice J. Epidemiologic Analysis with a Programmable Calculator.
Boston: Epidemiology Resources, Inc. (1982).
Rundo J and Toohey RE. Radon in homes and other technologically enhanced
radioactivity. In: NCRP Proceedings No.5: Environmental Radioactivity. National
Council on Radiation Protection and Measurements, Bethesda (1983).
Saccomano G, Yale C, Dixon W, et al. Analysis of the relationship between exposure to
Rn progeny; smoking, and bronchogenic carcinoma in the U-mining population of the
Colorado Plateau - 1960-1980. Health Physics 50: 605-619 (1986).
Samet JM. Radon and lung cancer. J Natl Cancer Inst 81:745-757 (1989).
Samet JM, Kutvirt DM, Waxweiler RJ and Rey CR. Uranium mining and lung cancer in
Navajo men. New Engl J Med 310:1481-1484 (1984).
Samet JM, Pathak DR, Morgan MV, et al. Radon progeny exposure and lung cancer risk
in New Mexico U miners: A case control study. Health Physics 56:415-421 (1989).
Schlesselman JJ. Case-Control Studies: Design. Conduct. Analysis. New York: Oxford
University Press (1974).
Schoenberg JB, Wilcox HB, Mason TJ, et al. Variation in smoking-related lung cancer
risk among New Jersey women. Am J Epidemiol (in press, 1989).
Sevc J, Kunz E, Tomasek L et al. Cancer in man after exposure to Rn daughters. Health Physics 54:27- 46 (1988).
Simpson SG and Comstock GW. Lung cancer and housing characteristics. Arch Environ Health 38:248-251 (1983).

58
Snedecor GW and Cochran WG. Statistical Methods. Ames: Iowa State University Press (1967).
Stranden, E. Radon 222 in Norwegion Dwellings. In P.K. Hopke, ed, Radon and its
Decay Products. ACS Symposium Series. Washington, DC. 70-83 (1987).
Svensson C, Eklund G and Pershagen G. Indoor exposure to radon from the ground and
bronchial cancer in women. Int Arch Occup Environ Health 59: 123-131 (1987).
Svensson C, Pershagen G, and Klominek J. Lung cancer in women and type of dwelling
in relation to radon exposure. Cancer Res 49:1861-1865 (1989).
Van Duuren BL. Tumor-promoting and co-carcinogenic agents in chemical
carcinogenesis. In Searle CE, ed, Chemical Carcinogens. Washington, DC: Amer Chem
Soc 24-51 (1976).
Whittemore AS and McMillan A. Lung cancer mortality among U.S. uranium miners: A
reappraisal. J Natl Cancer Inst 71:489-499 (1983).
Wu AH, Henderson BE, Thomas DC, et al. Secular trends in histologic types of lung
cancer. J Natl Cancer Inst 77: 53-56 (1986).
U.S.D.O.E. Radon Epidemiology: A guide to the literature. U.S. Department of Energy.
(1988).
U.S. Department of Health, Education, and Welfare. Smoking and health: A report
of the Surgeon General. Rockville, MD: USDHEW, PHS, Office on Smoking and Health,
1979 (DHEW Publication No. (PHS) 79-50066).
U.S. Department of Health, Education, and Welfare. The health consequences of
smoking for women: A report of the Surgeon General. Rockville, MD: USDHEW, PHS,
Office on Smoking and Health, 1980.
U.S.E.P.A. Interim indoor radon and radon decay product measurement protocols. United
States Environmental Protection Agency, EPA 52/1-86-04 (1986).
Ziegler RG, Mason TJ, Stemhagen A, et al. Carotenoid intake, vegetables, and the risk
of lung cancer among white men in New Jersey. Am J Epidemiol 123:1080-1093 (1986).
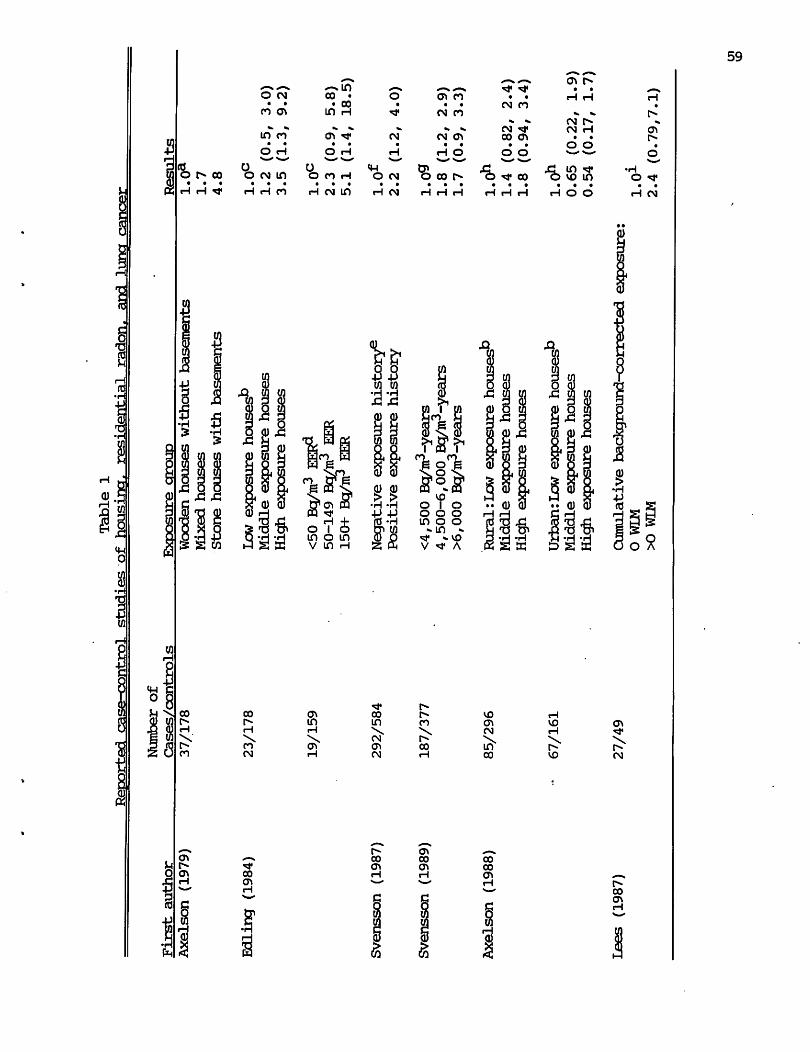
Reoorted case-control
Table 1
studies of housincr. residential radon, and Inner cancer*
First author
Number of
Cases/controls
Exposure group
Results
Axelson (1979)
Edling (1984)
Svensson (1987)
Svensson (1989)
Axelson (1988)
Lees (1987)
37/178
23/178
19/159
292/584
187/377
85/296
67/161
27/49
Wooden houses without basements
Mixed houses
Stone houses with basements
Low exposure houses0
Middle exposure houses
High exposure houses
<50 Bp/m3 EER?
50-149 Bq/m3 EER
150+ Bg
/iir
EER
Negative exposure history6
Positive exposure history
<4,500 Bg/m3-years
4,500-6,000 Bg/in3-years
>6,000 Bg/m3-years
RuralrLow exposure houses0
Middle exposure houses
High exposure houses
Urban: Low exposure houses0
Middle exposure houses
High exposure houses
Cumulative bacdcground-corrected exposure:
0 WIM
XD WIM
Ul
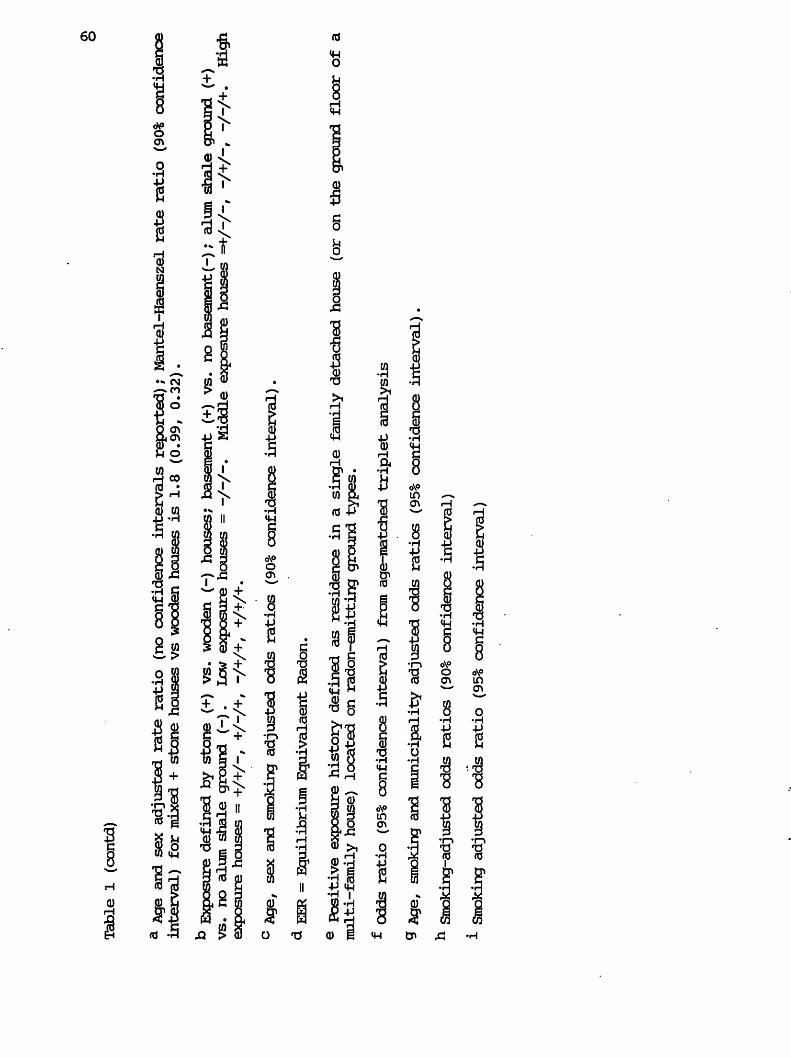
o
Table 1 (contd)
a Age and sex adjusted rate ratio (no confidence intervals reported); Mantel-Haenszel rate ratio (90% confidence
interval) for mixed + stone houses vs wooden houses is 1.8 (0.99r 0.32).
b Expos
ure defined by stone (+
) vs
. wooden (-
) ho
uses
; basement (+)
vs.
no bas
emen
t(-)
; alum shale gro
und
(+)
vs. no alum shale ground (-).
Low exposure houses = -/-/-•
Middle exposure houses =+■/-/-, "/+/"/ "/"/+•
High
exposure houses = +/+/-, +/-/+, -/+/+, +/+/+•
° Age, sex and smoking adjusted odds ratios (90% confidence interval).
<* EER = Equilibrium Equivalaent Radon.
e Positive exposure history defined as residence in a single family detached house (or on the ground floor of a
multi-family house) located on radon-emitting ground types.
f Odds ratio (9
5% confidence in
terv
al)
from age-matched triplet analysis
9 Age, smoking and municipality adjusted odds ratios (95% confidence interval).
h Smoking-adjusted od
ds ratios (9
0% confidence in
terv
al)
1 Smoking adjusted odds ratio (95% confidence interval)

61
TABLE 2
Criteria for inclusion of houses in Ehase II of data collection,
New Jersey radjon—feipale lung cancer case-control study , 1982—1988
CRITERIA FOR HOUSE
INCLUDED IN PHASE H
OF RADON SUBS1UDY
RESIDENCE TIMES
FOR SUBJECTS ALREADY
INCEIIDED IN RADON
STUDY UNDER PHASE I
WITH FURTHER RESULTS
UNDER PHASE II
RESIDENCE TIMES
FOR NEW SUBJECTS
TO BE INdDDED
IN RADON STUDY
UNDER EHASE II
1. residence of original subject
for at least 10 years in the
25 year period from 5-30 years
prior to diagnosis
2. residence of original subject
which would add at least 7 years
in the 25 year period to the
already collected exposure
history
3. residences of original subject,
each for at least 7 years in the 25
year period, which would result in
a total lmown exposure history of
at least 14 years
4. residence of original subject
in six counties with high radon
potentiala which would add at least 4 years in the 25 year period
to the already collected exposure
history
5. residences of original subject
in six counties with high radon
potential3, each for at least 4 years in the 25 year period, which would
result in a total known exposure
history of at least 14 years.
10-14 years
(Phase I) +
10-14 YEARS
(PHASE H)
10-17 years
(Phase I) +
7-9 YEARS
(EHASE H)
HH- YEARS
(IHASE H)
10-21 years
(Phase I) ■
4-6 YEARS
(IHASE H)
7-9 YEARS
(IHASE H)
7-9 YEARS
(IHASE H)
4-6 YEARS
(IHASE H) +
4-6 YEARS
(EHASE H) +
4-6 YEARS
(IHASE H)
a Warren, Hunterdon, Sussex, Morris, Somerset, and Mercer counties
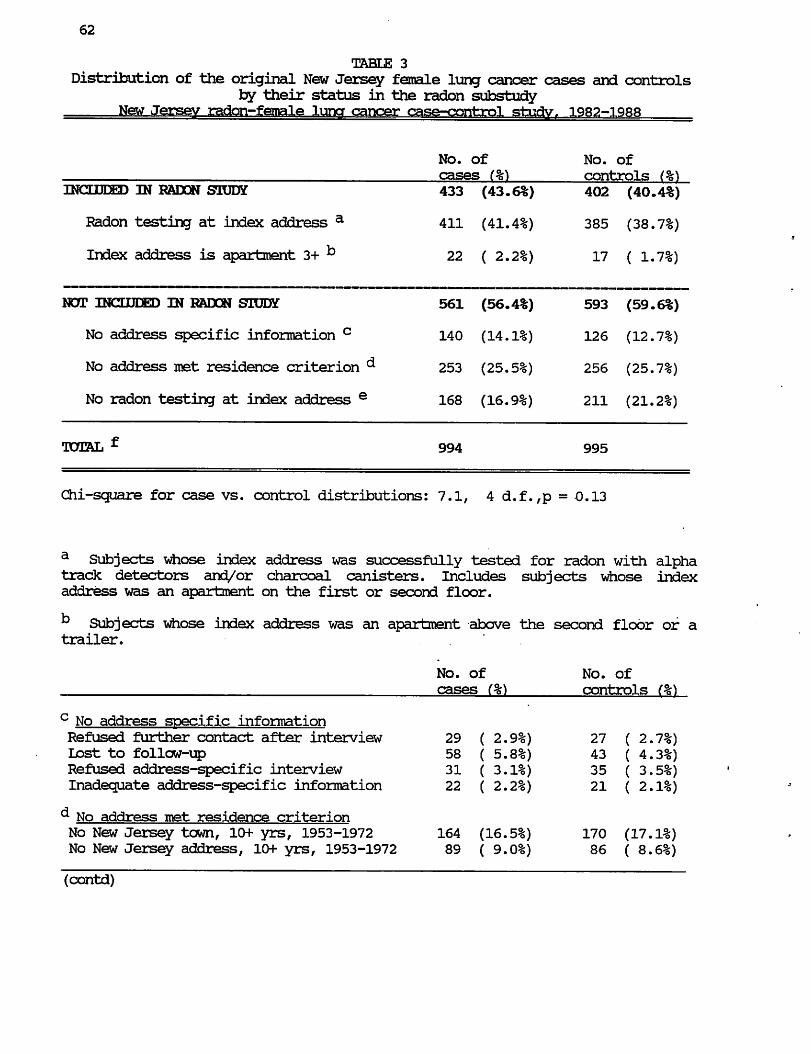
62
TABLE 3
Distribution of the original New Jersey female lung cancer cases and controls by their status in the radon substudy
New Jersey radon-female luna cancer case-control study. 1982-1988
No. of
cases (%)
No. of
controls
INCXDEED IN RADON STUDY
Radon testing at index address a
Index address is apartment 3+ ^
433 (43.6%)
411 (41.4%)
22 ( 2.2%)
402 (40.4%)
385 (38.7%)
17 ( 1.7%)
NOT INCLUDED IN RADON STUDY
No address specific information c
No address met residence criterion
No radon testing at index address e
561 (56.4%)
140 (14.1%)
253 (25.5%)
168 (16.9%)
593 (59.6%)
126 (12.7%)
256 (25.7%)
211 (21.2%)
994 995
Chi-square for case vs. control distributions: 7.1, 4 d.f. ,p = 0.13
a Subjects whose index address was successfully tested for radon with alpha track detectors and/or charcoal canisters. Includes subjects whose index
address was an apartment on the first or second floor.
b Subjects whose index address was an apartment above the second floor of a trailer.
c No address specific information
Refused further contact after interview
Lost to follow-up
Refused address-specific interview
Inadequate address-specific information
^ No address met residence criterion No New Jersey town, lOf yrs, 1953-1972
No New Jersey address, 10+ yrs, 1953-1972
(contd)

Table 3 (contd.)
63
e No radon testing at index address Index address demolished
Refusal by current resident
No contact with current resident
23 ( 2.3%)
112 (11.3%)
33 ( 3.3%)
20 ( 2.0%)
169 (17.0%)
22 ( 2.2%)
f 994 cases represent 76.1% of 1,306 cases identified in original study; 995 controls represent 68.7% of 1,449 controls identified in original study.

64
TABLE 4
Number of lung cancer cases and controls in radon study,
by various risk factors and subject characteristics
New Jersey radon-female luner cancer case-control study,, 1982-1988
No. of
cases (%)
No. of
controls (%)
TOTAL
AGE AT DIAGNOSISa <58 years
58-71 years
72+ years
433 402
98 (22.6%)
215 (49.7%)
120 (27.7%)
78 (19.4%)
216 (53.7%)
108 (26.9%)
RESPONDENT TYPE
self
spouse
other next of kin
246 (56.8%)
74 (17.1%)
113 (26.1%)
212 (52.7%)
89 (22.1%)
101 (25.1%)
RACE
white, including hispanic
nonwhite
418
15
(96.5%)
( 3.5%)
386
16
(96.0%)
( 4.0%)
CIGARETTES/DAY ° Lifetime nonsmoker
< 15 cigarettes/day
15-24 cigarettes/day
25+ cigarettes/day
61 (14.1%)
83 (19.2%)
178 (41.1%)
111 (25.6%)
213 (53.0%)
90 (22.4%)
67 (16.7%)
32 ( 8.0%)
TOTAL NUMBER OF YEARS SMOKED
Lifetime nonsmoker
< 35 years
35+ years
61 (14.1%)
90 (20.8%)
282 (65.1%)
213 (53.0%)
72 (17.9%)
117 (29.1%)
NUMBER OF YEARS QUIT SMOKING
Lifetime nonsmoker
Current smoker, quit 0-1 years
Ex-smoker, quit 2-9 years
Ex-smoker, quit 10+ years
61 (14.1%)
289 (66.7%)
49 (11.3%)
34 ( 7.9%)
213 (53.0%)
112 (27.9%)
27 ( 6.7%)
50 (12.4%)
AVERAGE CIGARETTE TAR CONTENT, 1973-1982
Lifetime nonsmoker
Nonsmoker, 1973-1982
SmoKer, tar <21 mg/cigarette
Smoker, tar 21+ mg/cigarette
61 (14.1%)
31 ( 7.2%)
284 (65.6%)
57 (13.2%)
213 (53.0%)
45 (11.2%)
126 (31.3%)
18 ( 4.5%)
VEGETABLE CONSUMPTION9 <35 servings/month
35-74 servings/month
75+ servings/month
118 (27.3%)
241 (55.7%)
74 (17.1%)
83 (20.7%)
209 (52.0%)
110 (27.4%)
(contd)

65
TABLE 4 (contd.)
Number of lung cancer cases and controls in radon stud/,
by various risk factors and subject characteristics
New Jersey radon-female luna cancer case-control study. 1982-1988
EDUCATION
<8 years completed
8-12 years completed
13+ years completed
35 ( 8.1%)
278 (64.2%)
120 (27.7%)
51 (12.7%)
232 (57.7%)
119 (29.6%)
COUNTY AT DIAGNOSIS*3 low radon
moderately low radon
moderate radon
high radon
112 (25 ..9%)
163 (37.6%)
84 (19.4%)
74 (17.1%)
89 (22.1%)
178 (44.3%)
76 (18.9%)
59 (14.7%)
LIFETIME NONSMDKERS ONLY,
BY PASSIVE SMOKING
No exposure to spouse tobacco
Exposure to spouse cigarette smoke
Exposure to spouse pipe/cigar only
18 (29.5%)
38 (62.3%)
5 ( 8.2%)
70 (32.9%)
116 (54.5%)
27 (12.7%)
a Cutpoints based on distribution of controls in original female lung cancer
study (1st quartile; 2nd+3rd quartile; 4th quartile)
b Lifetime average number of cigarettes smoked per day. Cutpoints based on bimodal distribution of controls in original female lung cancer study, with
peaks at 10. and 20 cigarettes/day, and a long tail starting at 25
cigarettes/day.
c Ever'employed in any occupational group shown to have a smoking adjusted
risk of 1.5 or greater in the original female lung cancer study. This is
an a posteriori definition, used only for the purpose of adjusting in the radon
analyses for the possible effect of occupational exposure. See Appendix b for
further clarification of this variable.
^ County at diagnosis for cases, or county at ascertainment for controls. Low radon counties include include Atlantic, Cape May, Essex, Hudson, and Ocean
counties. Moderately low radon counties include Bergen, Burlington,
Cumberland, Gloucester, Middlesex, and Union counties. Moderate radon counties
include Camden, Monmouth, Bassaic, and Salem counties. High radon counties
include Hunterdon, Mercer, Morris, Somerset, Sussex, and Warren counties.
Grouping of counties was determined by the percentage of houses with basement
or lower level screening values above 4 pCi/L in the statewide survey conducted
for the New Jersey State Department of Environmental Protection (see Appendix
G).

66
TABLE 5
Distribution of lung cancer cases and controls included in radon study
by type of radon measurement results at index residence,
Estimates of living area alpha
track results from basement
alpha track measurements b 27 ( 6.2%) 28 ( 7.0%) 55 ( 6.6%)
Estimates of living area alpha
track results from
canister measurements b 38 ( 8.8%) 39 ( 9.7%) 77 ( 9.2%)
Living area alpha track results
estimated as < 1 pCi/L; no actual
radon measurements; index
residence is apartment 3^°'° 22 ( 5.1%) 17 ( 4.2%) 39 ( 4.7%)
TOTAL • 433 402 835
Chi-square for case vs. control distributions: 0.95, 4 d.f., p = 0.92.
a Includes measurements made in apartments which were below the third floor,
k See Appendix J .
c Subjects whose index address was an apartment above the second floor or a trailer.

67
TABLE 6
Distribution of lung cancer cases and controls by radon level
(year-long living area alpha track measurements, n=664; estimates, n=171)
and by lifetime average daily cigarette consumption,
a Includes subjects whose index address was an apartment above the second floor or a trailer.
b Unadjusted odds ratio (an estimate of the lung cancer risk associated with radon exposure and smoking, but not adjusted for any other factors), relative to
nonsmokers with < 1.0 pCi/L radon exposure.
c Unadjusted odds ratio (an estimate of the lung cancer risk associated with smoking, but not adjusted for radon exposure or any other factors), relative to lifetime nonsmokers.
d Unadjusted odds ratio (an estimate of the lung cancer risk associated with radon exposure, but not adjusted for smoking or any other factors), relative to subjects with < 1.0 pCi/L radon exposure.
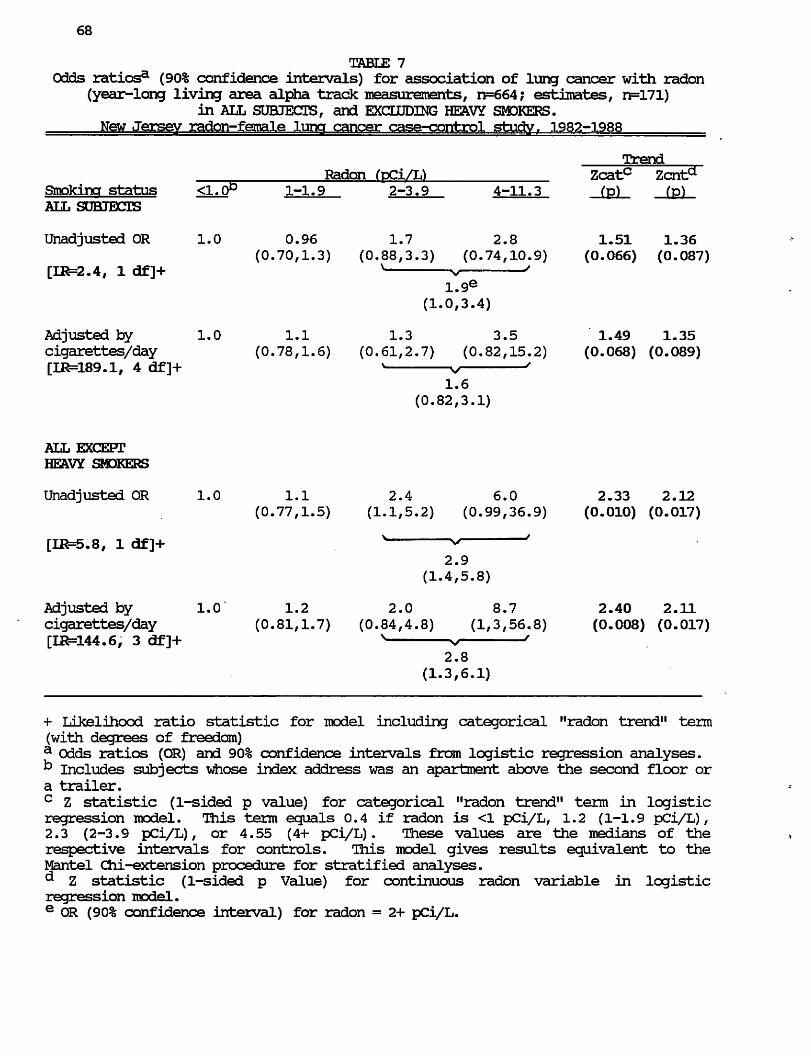
68
TABLE 7
Odds ratiosa (90% confidence intervals) for association of lung cancer with radon (year-long living area alpha track measurements, n=664; estimates, n=171)
in ALL SUBJECTS, and EXCLUDING HEAVY SMOKERS.
New Jersey radon-female lung cancer case-control study f 1982-1988
Trend
Radon (pCi/h) Zcatc Zcnta Smoking status <1.0P 1-1.9 2-3.9 4-11.3 (p) (p) ALL SUBJECTS
Unadjusted OR 1.0 0.96 1.7 2.8 1.51 1.36
(0.70,1.3) (0.88,3.3) (0.74,10.9) (0.066) (0.087)
[LR=2.4, 1 df]+ x v '
1.9e
(1.0,3.4)
Adjusted by 1.0 1.1 1.3 3.5 1.49 1.35
cigarettes/day (0.78,1.6) (0.61,2.7) (0.82,15.2) (0.068) (0.089)
[IR=189.1, 4 df]+ * s/ '
1.6
(0.82,3.1)
+ Likelihood ratio statistic for model including categorical "radon trend" term
(with degrees of freedom)
a Odds ratios (OR) and 90% confidence intervals from logistic regression analyses.
k Includes subjects whose index address was an apartment above the second floor or a trailer.
c Z statistic (1-sided p value) for categorical "radon trend" term in logistic regression model. This term equals 0.4 if radon is <1 pCi/L, 1.2 (1-1.9 pCi/L),
2.3 (2-3.9 pCi/L), or 4.55 (4+ pCi/L). These values are the medians of the
respective intervals for controls. This model gives results equivalent to the
Mantel Cni-extension procedure for stratified analyses.
^ Z statistic (1-sided p Value) for continuous radon variable in logistic regression model.
e OR (90% confidence interval) for radon = 2+ pCi/L.

69
TABLE 8
Odds ratiosa for association of lung cancer with radon (year-long living area alpha track measurements, n=664; estimates, n=171)
in all subjects, adjusting for other risk factors and subject characteristics, New Jersey radon-female lung cancer case-control study. 1982-1988
Adjusted by;
Cigarettes/day**
[IR=189.1, 4df]+
Cigarettes/day
+ occupation^ [IR=200.4, 5df]+
(p < 0.001)++
Cigarettes/day 9
[IR=202.3, 6df]+
(p = 0.001)++
Cigarettes/day
+ yrs quit stroking"
[IR=207.1, 10df]+
(p = 0.006)++
Cigarettes/day .
+ cigarette tar1
[IR=205.0, 10df]+
(p = 0.014)++
Cigarettes/day ,
+ respondent type^ v
+ resptype+cigs/dayk 1.6 [11^=200.6, 8df]+
(p = 0.021)++
Cigarettes/day 1.0 1.1 1.3 3.6 1.55
+ vegetables1 N v " (0.061) [ER=195.0, 6df]+ 1.7
(p= 0.052)++
Cigarettes/day .1.0 1.1 1.3 3.6 1.51
+ respondent typeJ ^ s/ J (0.066) [IR=190.5r 5df]+ 1.6
(p = 0.237)++

70
TABLE 8 (contd)
Odds ratiosa for association of lung cancer with radon (year-long living area alpha track measurements, n=664; estimates, n=171)
in all subjects, adjusting for other risk factors and subject characteristics,
New Jersey radon-female luna cancer case-control study f 1982-1988
Trend
Radon (pCi/L) Zcatc Adjusted by: <1.0P 1-1.92-3.9 4-11.3 (v)
Cigarettes/day 1.0 1.1 1.2 3.6 1-47
+ years smoked?1 N v ' (0.071)
[IR=193.2, 7df]+ 1.6
(p = 0.251)++
Cigarettes/day 1.0 1.1 1.2 3.2 1.36
+ county11 N v ' (0.087) [IR=191.5, 7df]+ 1.5
(p = 0.494)++
Cigarettes/day 1.0 1.1 1.3 3.5 1.48
+ education0 N v ' (0.069) [IR=189.4, 6df]+ 1.6
(p = 0.861)++
Cigarettes/day 1.0 1.1 1.3 3.5 1.48
+ raceP v v ' (0.069) [IR=189.1, 5df]+ 1.6
(p = 0.99)++
+ Likelihood ratio statistic for model including categorical "radon trend" term
(with degrees of freedom)
++ Significance of Chi-square statistic evaluating the improvement in fit, i.e.,
the difference in likelihood ratio statistics between this model and the base model
(including only adjustment for cigarettes/day)
a Odds ratios from logistic regression analyses. Models are ranked by the improvement in the fit of the model, as determined by the difference in the
likelihood ratio statistics of the new model and the likelihood ratio statistic of
the base model including only terms for cigarettes per day and radon. This
difference was evaluated as a Chi-square statistic with degrees of freedom
equivalent to the difference in degrees of freedom between the new model and the
base model.
k Includes subjects whose index address was an apartment above the second floor or a trailer.
c Z statistic (1-sided p value) for categorical "radon trend" term in logistic regression model. This term equals 0.4 if radon is <1 pCi/L, 1.2 (1-1.9 pCi/L),
2.3 (2-3.9 pCi/L), or 4.55 (4+ pCi/L). These values are the medians of the
respective intervals for controls. This model gives results equivalent to the
Mantel Chi-extension procedure for stratified analyses, (contd)

71
TABLE 8 (contd.)
d adjusted by lifetime average daily cigarette consumption (nonsmokers, <15 cigarettes/day, 15-24 cigarettes/day, 25+ cigarettes/day).
e OR for radon = 2+ pCi/L.
f adjusted by lifetime average daily cigarette consumption and hi#i risk occupation (ever employed in any occupational group shown to have a smoking adjusted risk of
1.5 or greater in the original female lung cancer study [see Appendix B for
further clarification of this variable]; never employed in any of these occupational groups)
9 adjusted by lifetiine average daily cigarette consumption and age (<58, 58-71, 72+)
n adjusted by lifetiine average daily cigarette consumption and number of years since smoking cessation (lifetime nonsmoker, quit 0-1 year, quit 2-9 years, quit 10+ years).
1 adjusted by lifetime average daily cigarette consumption and time-wei^ited average tar content of cigarettes smoked during 1973-1982 (lifetime nonsmoker, tar
<21 mg/cigarette, tar 21+ mg/cigarette, smoker but did not smoke during 1973-1982). See Appendix B for further clarification of this variable.
1 adjusted by lifetime average daily cigarette consumption and respondent type (self, next of kin). There was little difference if next of kin were separated into spouse and other next of kin groups.
k adjusted by lifetime average daiily cigarette consumption, respondent type (see above, note j), and the interaction between respondent type and number of
cigarettes smoked per day. See Appendix B for further clarification of this variable.
1 adjusted by lifetime average daily cigarette consumption and vegetable consumption as a measure of dietary Vitamin A (<35 servings/month, 35-74 servings/month, 75+ servings/month) .
m adjusted by lifetime average daily cigarette consumption and total duration of smoking (lifetiine nonsmoker, <35 years, 35+ years).
n adjusted by lifetiine average daily cigarette consumption and county of residence at diagnosis (low radon, moderately low radon, moderate radon, high radon). See Appendix B or footnote d, Table 3, for further clarification of this variable.
° adjusted by lifetiine average daily cigarette consumption and education (<8 years, 8-12 years, 13+ years)
P adjusted by lifetime average daily cigarette consumption and race (white including hispanic, nonwhite)

72
TABLE 9
Odds ratiosa (90% confidence intervals) for association of lung cancer with radon (year-long living area alpha track measurements, n=664; estimates, n=171)
in ALL SUBJECTS, adjusting for multiple risk factors and subject characteristics
New Jersey radon-fgTrel.fr lung cancer case-control studyf 1982-1988
Trend
Radon (pCi/L) Zca^Zcnte Adjusted bv:b <1.0c 1-1.9 2-3.9 4-11.3 (p) (p)
Cigarettes/day, 1.0 1.2 1.2 4.7 1.80 1.48
age, (0.81,1.7) (0.58,2.7) (1.1,20.3) (0.036) (0.069)
occupation, v v '
yrs quit smoking 1.7* [IR=236.3, 13df]+ (0.87,3.4)
Cigarettes/day, 1.0 1.1 1.3 4.2 1.75 1.45
age, occupation, (0.79,1.7) (0.62,2.9) (0.99,17.5) (0.040) (0.074)
yrs quit smoking, N v /
respondent type, 1.8
resptype*cigs/day (0.89,3.5)
[IR=246.6, 17df]+
Cigarettes/day, 1.0 1.1 1.4 4.8 1.82 1.50
age, occupation, (0.79,1.6) (0.63,2.9) (1.1,21.5) (0.034) (0.067)
yrs quit smoking, s <*> : '
vegetables, 1.8
respondent type, (0.92,3.6)
race
[IR=243.2, 17df]+
+ Likelihood ratio statistic for model including categorical "radon trend" term
(with degrees of freedom).
a Odds ratios and 90% confidence intervals from logistic regression analyses. k See footnotes to Table 8 for definitions of variables c Includes subjects whose index address was an apartment above the second floor or
a trailer.
^ Z statistic (1-sided p value) for categorical "radon trend" term in logistic regression model. This term equals 0.4 if radon is <1 pCi/L, 1.2 (1-1.9 pCi/L),
2.3 (2-3.9 pCi/L), or 4.55 (4+ pCi/L). These values are the medians of the
respective intervals for controls. This model gives results equivalent to the
Mantel Chi-extension procedure for stratified analyses.
e Z statistic (1-sided p Value) for continuous radon variable in logistic
regression model.
* OR (90% confidence interval) for radon = 2+ pCi/L.
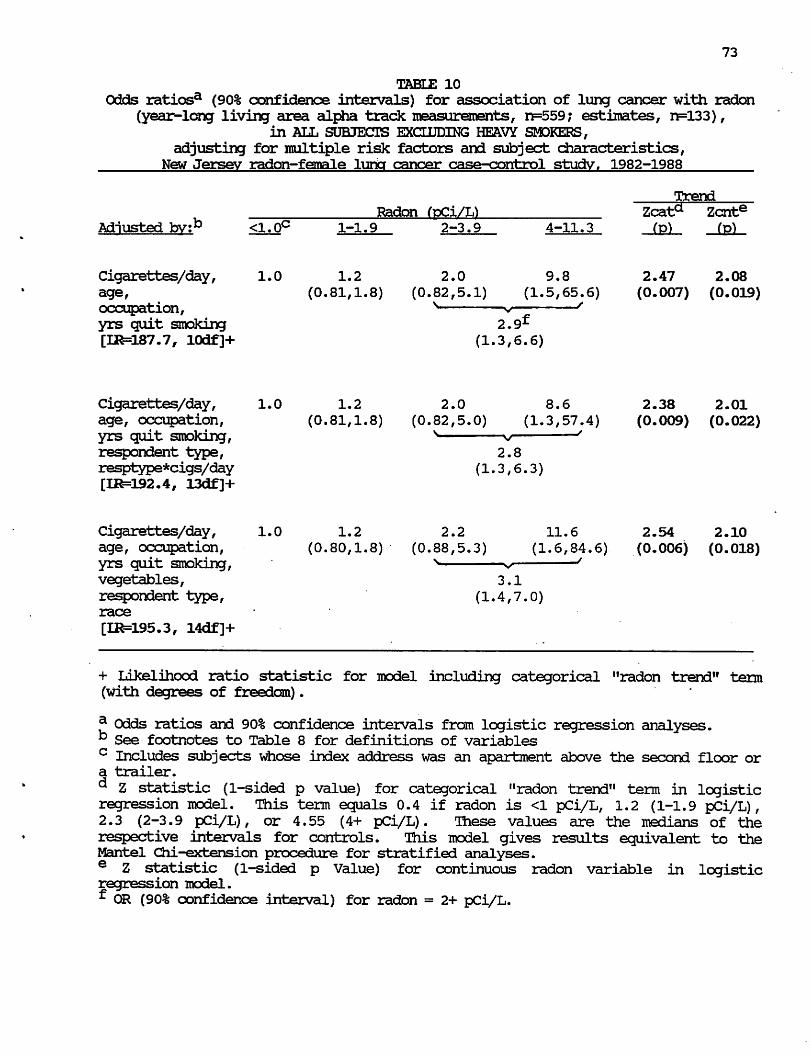
73
TABLE 10
Odds ratiosa (90% confidence intervals) for association of lung cancer with radon
(year-long living area alpha track measurements, n=559; estimates, n=133),
in ALL SUBJECTS EXCLUDING HEAVY SMDKERS,
adjusting for multiple risk factors and subject characteristics,
New Jersey radon-female lung cancer case-control study. 1982-1988
Trend
Radon (pCi/L) Zcata Zcnte Adjusted bv:b <1.0c 1-1.9 2-3.9 4-11.3 fp) (p)
Cigarettes/day, 1.0 1.2 2.0 9.8 2.47 2.08
age, (0.81,1.8) (0.82,5.1) (1.5,65.6) (0.007) (0.019)
occupation, s v f
yrs quit smoking 2.9^ [IR=187.7, 10df]+ (1.3,6.6)
Cigarettes/day, 1.0 1.2 2.0 8.6 2.38 2.01
age, occupation, (0.81,1.8) (0.82,5.0) (1.3,57.4) (0.009) (0.022)
yrs quit smoking, N v '
respondent type, 2.8
resptype*cigs/day (1.3,6.3)
[IR=O92,4, 13df]+
Cigarettes/day, 1.0 1.2 2.2 11.6 2.54 2.10
age, occupation, (0.80,1.8) (0.88,5.3) (1.6,84.6) (0.006) (0.018) yrs quit smoking, N ^ '
vegetables, 3.1
respondent type, (1.4,7.0)
race
[LR=195.3, 14df]+
+ Likelihood ratio statistic for model including categorical "radon trend" term (with degrees of freedom).
f- Odds ratios and 90% confidence intervals from logistic regression analyses. b See footnotes to Table 8 for definitions of variables c Includes subjects whose index address was an apartment above the second floor or a trailer.
d Z statistic (1-sided p value) for categorical "radon trend" term in logistic regression model. This term equals 0.4 if radon is <1 pCi/L, 1.2 (1-1.9 pCi/L),
2.3 (2-3.9 pCi/L), or 4.55 (4+ pCi/L). lhese values are the medians of the
respective intervals for controls. This model gives results equivalent to the Mantel Chi-extension procedure for stratified analyses.
e Z statistic (1-sided p Value) for continuous radon variable in logistic regression model.
f OR (90% confidence interval) for radon = 2+ pCi/L.
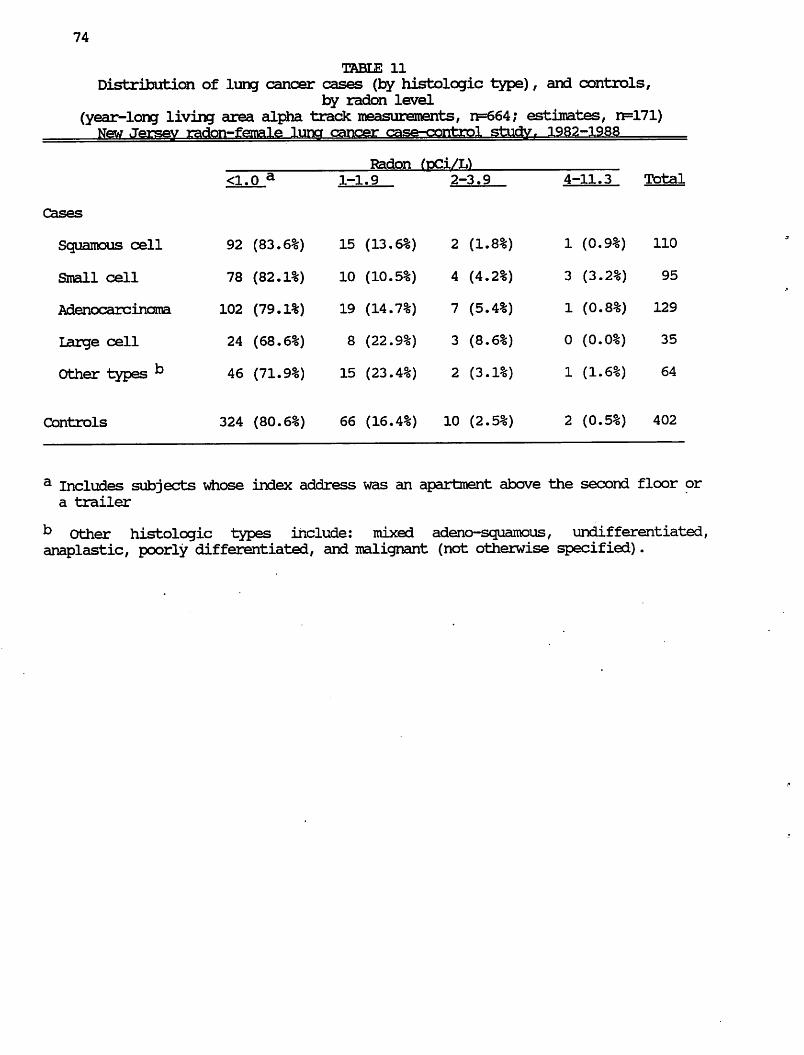
74
TABLE 11
Distribution of lung cancer cases (by histologic type), and controls,
by radon level
(year-long living area alpha track roeasureroents, n=664; estimates, n=171) New Jersev radon-female luna cancer case-control study. 1982-1988
a Includes subjects whose index address was an apartment above the second floor or
a trailer
b Other histologic types include: mixed adeno-squamous, undifferentiated, anaplastic, poorly differentiated, and malignant (not otherwise specified).

75
TABLE 12
Adjusted odds ratiosa (90% confidence intervals) for association of lung cancer, by histologic type, with radon level
(year-long living area alpha track measurements, n=664; estimates, n=171) New Jersey radon—female luncr cancer case-eorrhrnl «=rhiriv iqo*?—i
Small cell 1.0 0.83 0.87 13.2 1.41 0.88
(0.39,1.7) (0.26,2.9) (1.5,118.2) (0.079) (0.189) [IR=178.2, 17df]+ N v '
1.8
(0.66,5.0)
Adenocarcinoma 1.0 1.1 2.0 2.4 1.29 0.81
(0.66,1.8) (0.79,5.1) (0.26,22.1) (0.099) (0.209) [IR=71.7, 17df]+ n v '
2.1
(0.87,4.9)
Large cellf 1.0 2.2 3.2 0.0 1.93. 1.00 (0.96,5.2) (0.83,12.2) (—-,•—) (0.027) (0.159)
[IR=69.1, 14df]+ ^- v '
3.2
(0.83,12.0)
Other types^ i.o 2.1 0.96 3.5 1.46 1.39
(1.2,3.8) (0.24,3.9) (0.35,34.7) (0.072) (0.082) [IR=51.1, 17df]+ n ^ ^
1.3
(0.40,4.2)
+ Likelihood ratio statistic for model including categorical "radon trend" term (with degrees of freedom).
a Odds ratios (OR) and 90% confidence intervals from logistic regression analyses, adjusted by lifetime average daily cigarette consumption, age, occupation, years since smoking cessation, respondent type, and interaction between respondent type and cigarettes/day. See footnotes, Table 8, for further definitions of these variables,
(contd)

76
TABIE 12 (contd)
b Includes subjects whose index address was an apartment above the second floor or a trailer.
c Z statistic (1-sided p value) for categorical "radon trend" term in logistic regression model. This term equals 0.4 if radon is <1 pCi/L, 1.2 (1-1.9 pCi/L),
2.3 (2-3.9 pCi/L), or 4.55 (4+ pCi/L). These values are the medians of the
respective intervals for controls. This model gives results equivalent to the
Mantel Chi-extension procedure for stratified analyses.
^ Z statistic (1-sided p Value) for continuous radon variable in logistic regression model.
e OR (90% confidence interval) for radon = 2+ pCi/L.
f Model including respondent type*cigarettes/day interaction was indeterminate. Results are shown for model without the interaction terms.
9 Other histologic types include: mixed adeno-squamous, undifferentiated, anaplastic, poorly differentiated, and malignant (not otherwise specified).
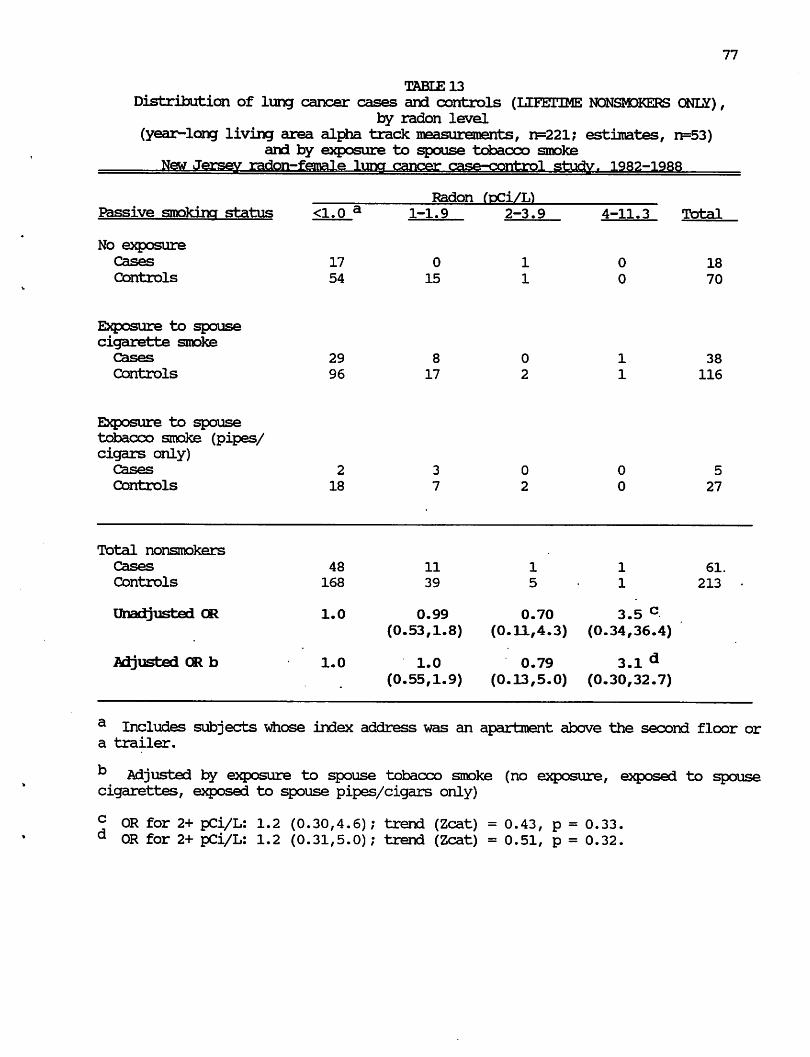
77
TABLE 13
Distribution of lung cancer cases and controls (LIFETIME NONSMOKERS ONL£), by radon level
(year-long living area alpha track measurements, n=221; estimates, n=53)
and by exposure to spouse tobacco smoke
New Jersey radon-female luna cancer case-control studv. 1982-1988
a Includes subjects whose index address was an apartment above the second floor or a trailer.
b Adjusted by exposure to spouse tobacco smoke (no exposure, exposed to spouse cigarettes, exposed to spouse pipes/cigars only)
c OR for 2+ pCi/L: 1.2 (0.30,4.6); trend (Zcat) = 0.43, p = 0.33. d OR for 2+ pCi/L: 1.2 (0.31,5.0); trend (Zcat) = 0.51, p = 0.32.
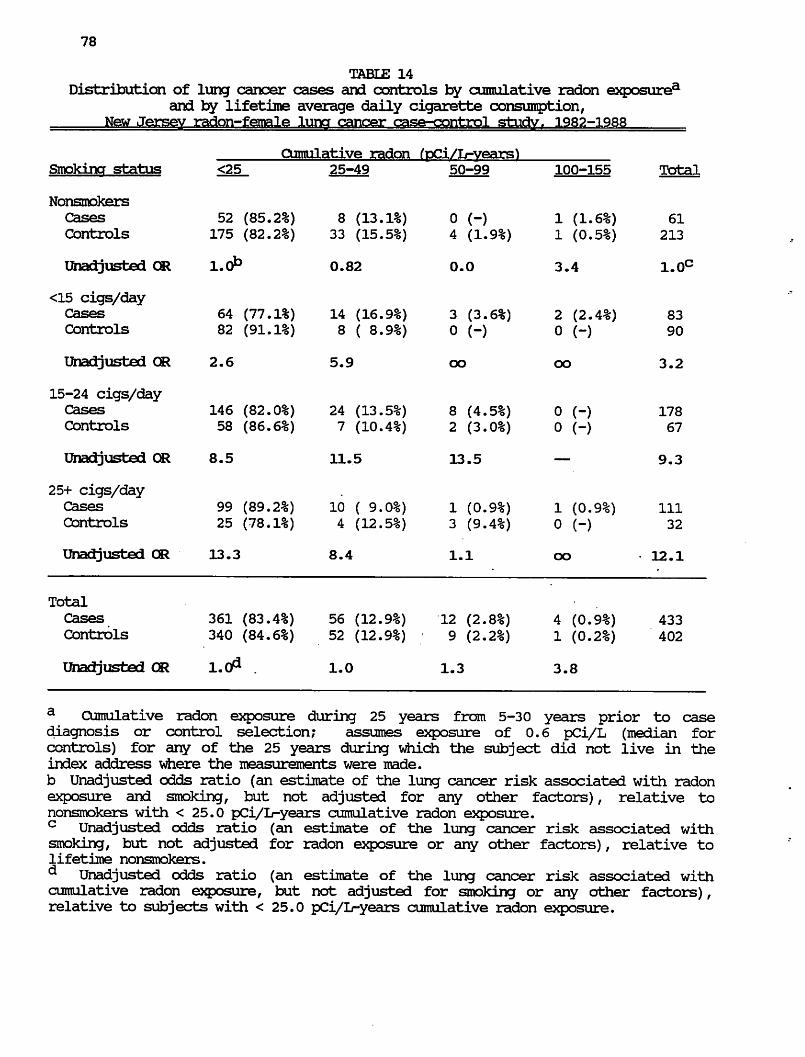
78
TABLE 14
Distribution of lung cancer cases and controls by cumulative radon exposurea
and by lifetime average daily cigarette consumption,
a Cumulative radon exposure during 25 years from 5-30 years prior to case diagnosis or control selection; assumes exposure of 0.6 pCi/L (median for
controls) for any of the 25 years during which the subject did not live in the
index address where the measurements were made.
b Unadjusted odds ratio (an estimate of the lung cancer risk associated with radon
exposure and smoking, but not adjusted for any other factors), relative to
nonsmokers with < 25.0 pCi/L-years cumulative radon exposure.
c Unadjusted odds ratio (an estimate of the lung cancer risk associated with smoking, but not adjusted for radon exposure or any other factors), relative to lifetime nonsmokers.
d Unadjusted odds ratio (an estimate of the lung cancer risk associated with cumulative radon exposure, but not adjusted for smoking or any other factors),
relative to subjects with < 25.0 pCi/L-years cumulative radon exposure.
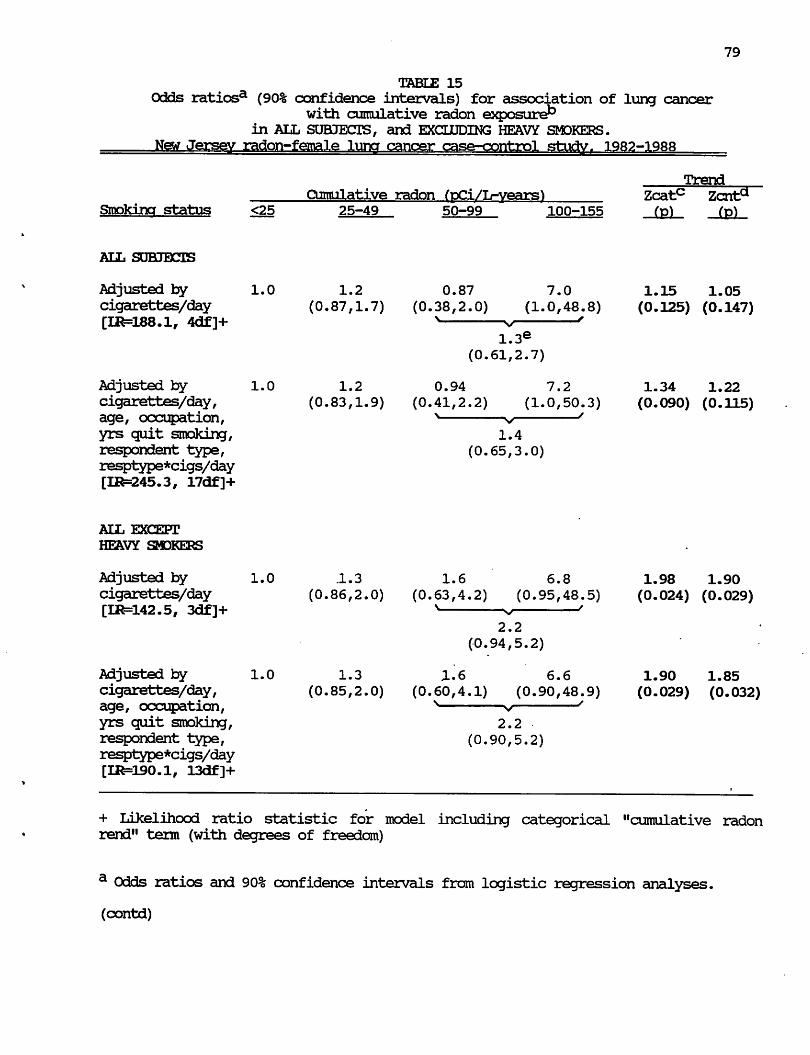
79
TABLE 15
Odds ratiosa (90% confidence intervals) for association of lung cancer with cumulative radon exposure*3
in ALL SUBJECTS, and EXCLUDING HEAVY SMOKERS.
New Jersey radon-female luna cancer case-control stuctyr 1982-1988
Trend
Cumulative radon fpCi/L-years) Zcatc Zcnta
Smoking status <25 25-49 50-99 100-155 (p) (p)
ALL SUBJECTS
Adjusted by 1.0 1.2 0.87 7.0 1.15 1.05
cigarettes/day (0.87,1.7) (0.38,2.0) (1.0,48.8) (0.125) (0.147) [IR=188.1, 4df]+ > v '
1.3e (0.61,2.7)
Adjusted by 1.0 1.2 0.94 7.2 1.34 1.22
cigarettes/day, (0.83,1.9) (0.41,2.2) (1.0,50.3) (0.090) (0.115) age, occupation, > v '
yrs quit smoking, 1.4
respondent type, (0.65,3.0)
resptype*cigs/day
[IR=245.3, 17df]+
ALL EXCEPT
HEAVY SMDKERS
Adjusted by 1.0 .1.3 1.6 6.8 1.98 1.90
cigarettes/day (0.86,2.0) (0.63,4.2) (0.95,48.5) (0.024) (0.029) [IR=142.5, 3df]+ > v '
2.2
(0.94,5.2)
Adjusted by 1.0 1.3 1.6 6.6 1.90 1.85
cigarettes/day, (0.85,2.0) (0.60,4.1) (0.90,48.9) (0.029) (0.032) age, occupation, N v '
yrs quit smoking, 2.2
respondent type, (0.90,5.2)
resptype*cigs/day
[IR=lS0.1, 13df]+
+ Likelihood ratio statistic for model including categorical "cumulative radon rend" term (with degrees of freedom)
a Odds ratios and 90% confidence intervals from logistic regression analyses,
(contd)
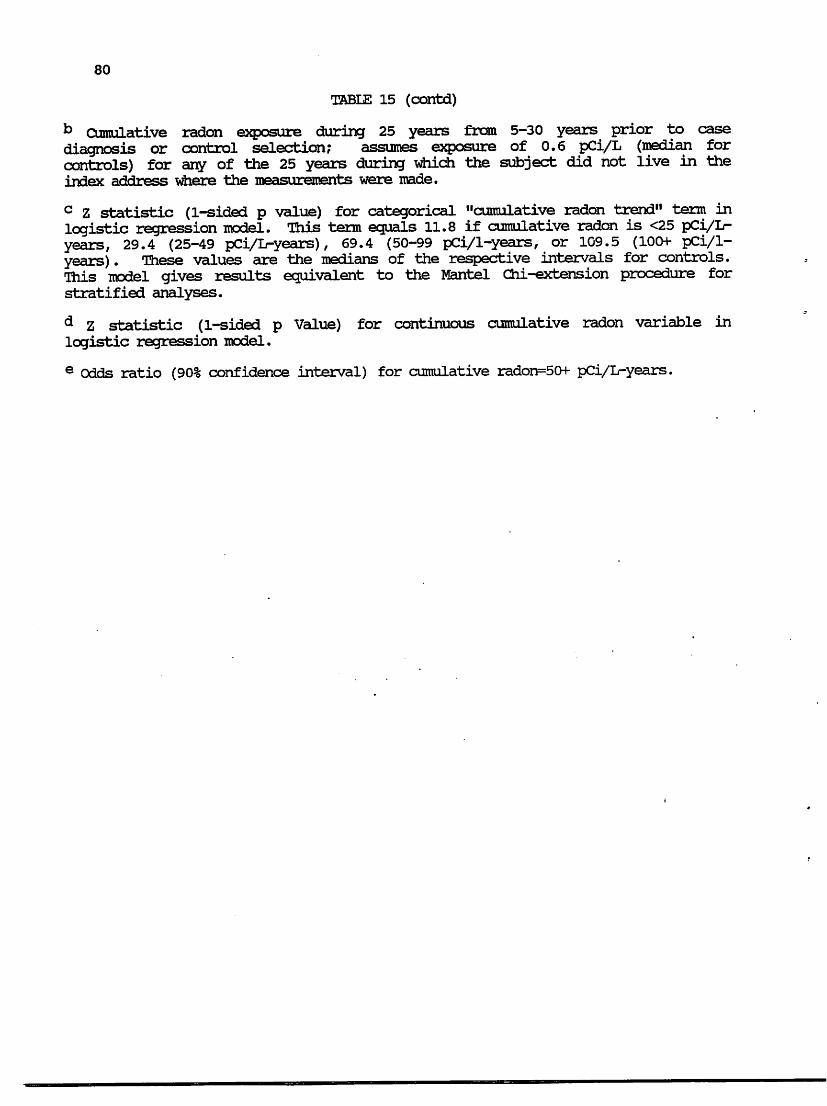
80
TABLE 15 (contd)
b Cumulative radon exposure during 25 years from 5-30 years prior to case
diagnosis or control selection; assumes exposure of 0.6 pCi/L (median for controls) for any of the 25 years during which the subject did not live in the index address where the measurements were made.
c Z statistic (1-sided p value) for categorical "cumulative radon trend" term in logistic regression model. This term equals 11.8 if cumulative radon is <25 pCi/L-years, 29.4 (25-49 pCi/L-years), 69.4 (50-99 pCi/1-years, or 109.5 (10O+- pCi/1-years). These values are the medians of the respective intervals for controls.
This model gives results equivalent to the Mantel Qii-extension procedure for
stratified analyses.
^ Z statistic (1-sided p Value) for continuous cumulative radon variable in
logistic regression model.
e Odds ratio (90% confidence interval) for cumulative radon=50+ pCi/L-years.
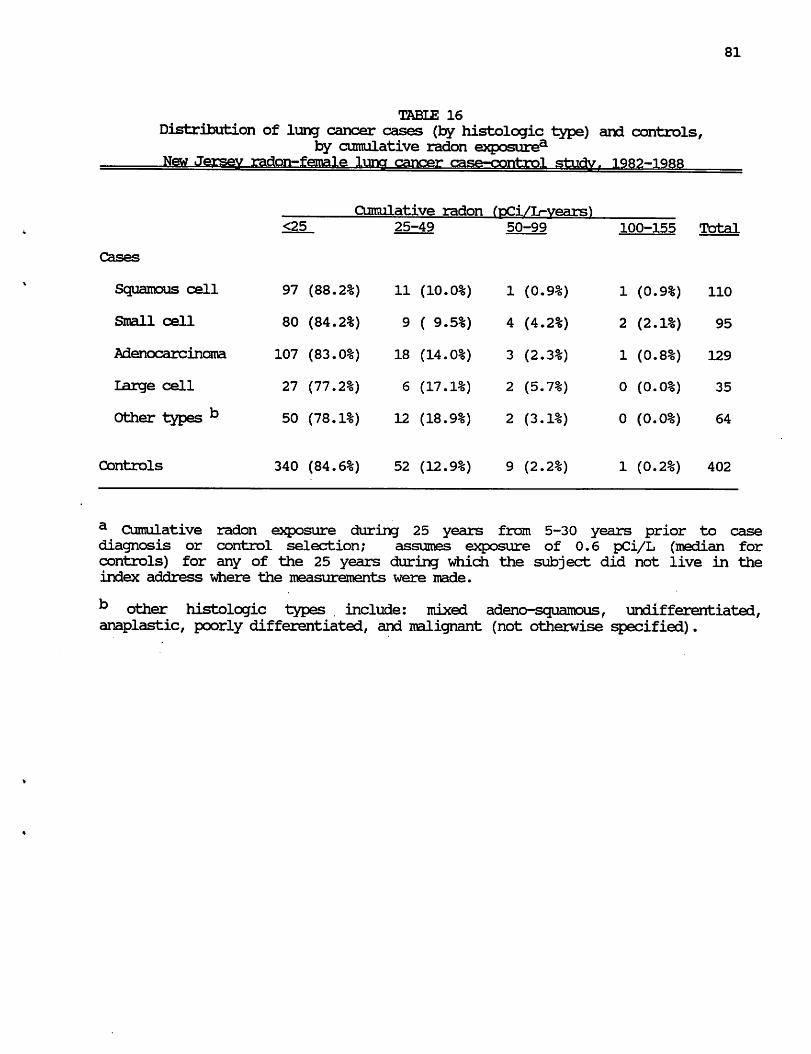
81
TABLE 16
Distribution of lung cancer cases (by histologic type) and controls, by cumulative radon exposurea
_lfew__Jersev radon—female luner cancer case-control sriiHv 1QR9—iqrr
a Cumulative radon exposure during 25 years from 5-30 years prior to case diagnosis or control selection; assumes exposure of 0.6 pCi/L (median for
controls) for any of the 25 years during which the subject did not live in the
index address where the measurements were made.
b other histologic types . include: mixed adeno-squamous, undifferentiated, anaplastic, poorly differentiated, and malignant (not otherwise specified).
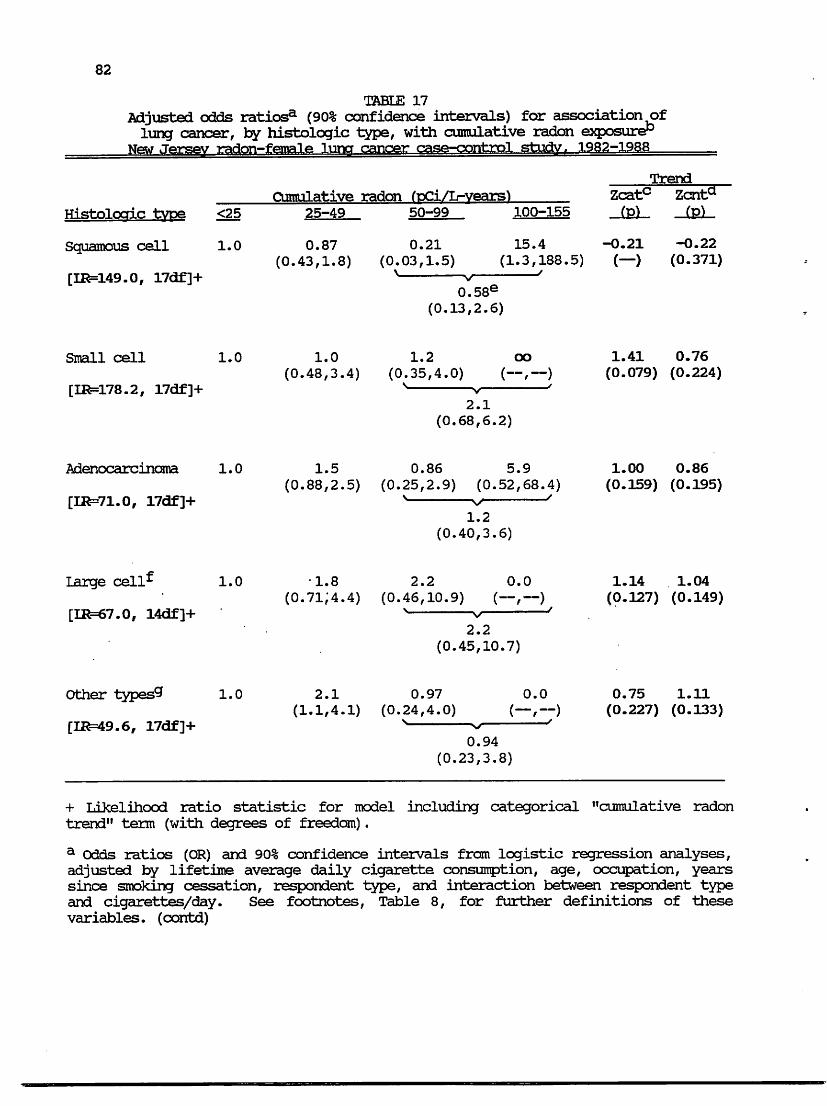
82
TABLE 17
Adjusted odds ratiosa (90% confidence intervals) for association of
lung cancer, by histologic type, with cumulative radon exposure13 New Jersey radon-femail** VTK? cancer case-control study, 1982-1988
Trend
Cumulative radon fpCi/Ir-vears) Zcat(
Histoloaic type
Squamous cell
[IR=149.0, 17df]+
Small cell
[IR=178.2, 17df]+
Adenocarcinama
[IR=71.0, 17df]+
Large cell^
[IR=67.0, 14df]+
Other types9
[11^=49.6, 17df]+
+ Likelihood ratio statistic for model including categorical "cumulative radon
trend" term (with degrees of freedom).
a Odds ratios (OR) and 90% confidence intervals from logistic regression analyses,
adjusted by lifetime average daily cigarette consumption, age, occupation, years
since smoking cessation, respondent type, and interaction between respondent type
and cigarettes/day. See footnotes, Table 8, for further definitions of these
variables, (contd)
83
TABLE 17 (contd)
b^ Cumulative radon exposure during 25 years from 5-30 years prior to case diagnosis or control selection; assumes exposure of 0.6 pCi/L (median for controls) for any of the 25 years during which the subject did not live in the index address where the measurements were made.
c Z statistic (1-sided p value) for categorical "cumulative radon trend" term in logistic regression model. This term equals 11.8 if cumulative radon is <25 pCi/L-years, 29.4 (25-49 pCi/L-years), 69.4 (50-99 pCi/1-years, or 109.5 (10CK- pCi/1-
years). These values are the medians of the respective intervals for controls.
This model gives results equivalent to the Mantel Chi-extension procedure for stratified analyses.
d Z statistic (1-sided p value) for continuous cumulative radon variable in logistic regression model.
e Odds ratio (90% confidence interval) for cumulative radon=50+ pCi/L-years.
f Model including respondent type*cigarettes/day interaction was indeterminate. Results are shown for model without the interaction terms.
9 Other histologic types include: mixed adeno-squamous, undifferentiated, anaplastic, poorly differentiated, and malignant (not otherwise specified).
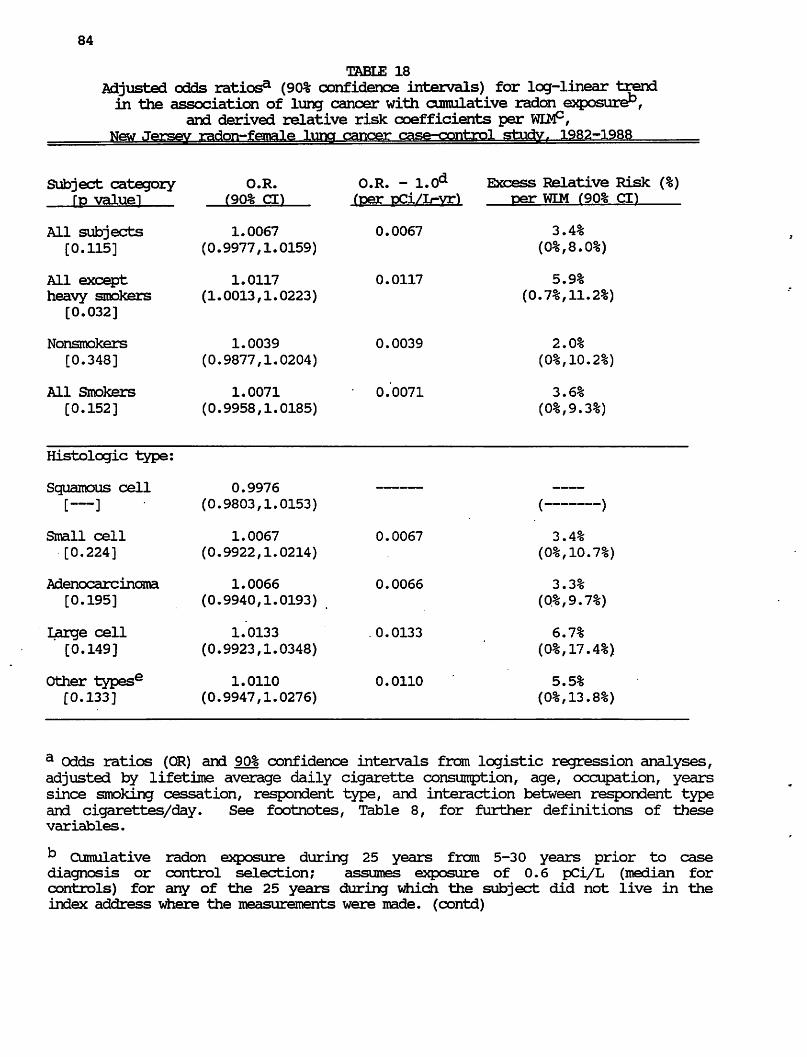
84
TABLE 18
Adjusted odds ratios3 (90% confidence intervals) for log-linear trend
in the association of lung cancer with cumulative radon exposure",
and derived relative risk coefficients per WLM°, New Jersev radon-female luna cancer case-control study. 1982-1988
Excess Relative Risk (%)
per WIM (90% d)
3.4%
5.9%
(0.7%,11.2%)
2.0%
3.6%
/_______ \
3.4%
%,10.7%
3.3%
%,9.
6.7%
%,17
5.5%
a Odds ratios (OR) and 90% confidence intervals from logistic regression analyses,
adjusted by lifetime average daily cigarette consumption, age, occupation, years
since smoking cessation, respondent type, and interaction between respondent type
and cigarettes/day. See footnotes, Table 8, for further definitions of these
variables.
k Cumulative radon exposure during 25 years from 5-30 years prior to case diagnosis or control selection; assumes exposure of 0.6 pCi/L (median for
controls) for any of the 25 years during which the subject did not live in the
index address where the measurements were made, (contd)
85
TABLE 18 (contd)
c Relative risk coef f icient/WIM equals excess relative risk per pCi/D-year
(OR - 1.0) divided by 0.20 WIM per pd/L-year. See Appendix A for equivalences.
d OR - 1.0 equals the leg-linear increase in risk per pCi/L-year.
e Other histolcgic types include: mixed adeno-squamous, undifferentiated, anaplastic, poorly differentiated, and malignant (not otherwise specified).
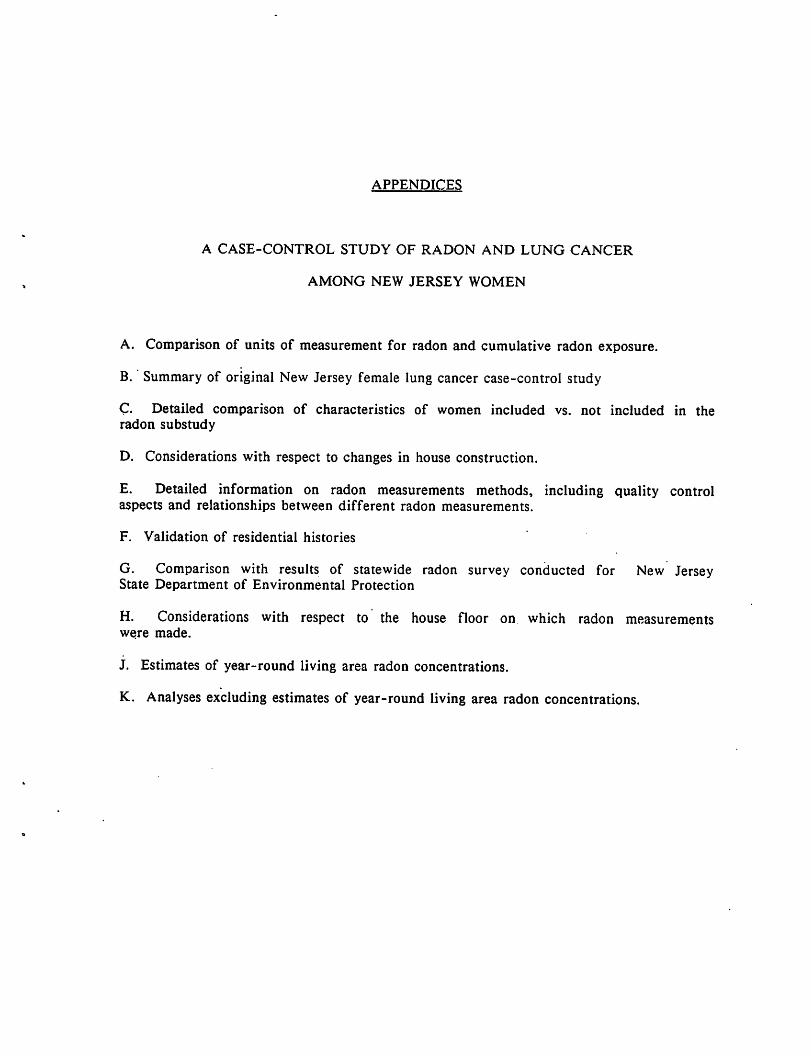
APPENDICES
A CASE-CONTROL STUDY OF RADON AND LUNG CANCER
AMONG NEW JERSEY WOMEN
A. Comparison of units of measurement for radon and cumulative radon exposure.
B. Summary of original New Jersey female lung cancer case-control study
C. Detailed comparison of characteristics of women included vs. not included in the radon substudy
D. Considerations with respect to changes in house construction.
E. Detailed information on radon measurements methods, including quality control
aspects and relationships between different radon measurements.
F. Validation of residential histories
G. Comparison with results of statewide radon survey conducted for New Jersey
State Department of Environmental Protection
H. Considerations with respect to the house floor on which radon measurements were made.
J. Estimates of year-round living area radon concentrations.
K. Analyses excluding estimates of year-round living area radon concentrations.

A 1
APPENDIX A
Units of Exposure for Radon
Exposure intensity concentration
Traditional units used in previous underground mining studies and still in
general use in the United States:
Radon gas: picocuries per liter (pCi/L)
Radon decay products: Working Levels (WL)
(radon daughters, radon progeny)
At 100% equilibrium of radon and its decay products, 100 pCi/L corresponds to 1 WL.
At 50% equilibrium (usual assumption), 200 pCi/L corresponds to 1 WL.
S.I.(International) units now in general use in Europe and in most
scientific journals:
Radon gas: Becquerels per cubic meters (Bq/m3)
Radon decay products: Becquerels per cubic meters equilibrium
equivalent radon (Bq/nP EER)
Cumulative exposure
Traditional units: Working Level Months (WLM)
1 WLM = 1 WL for one "working month" for 170 hr/month
Occupational: 12 WLM/WL per year
Residential (assuming 80% occupancy): 40 WLM/WL per year
S.I. units: Becquerels per cubic meters equilibrium equivalent radon
annum (Bq/m3 EER-a)
Joules hours per cubic meters (J hr/m3)
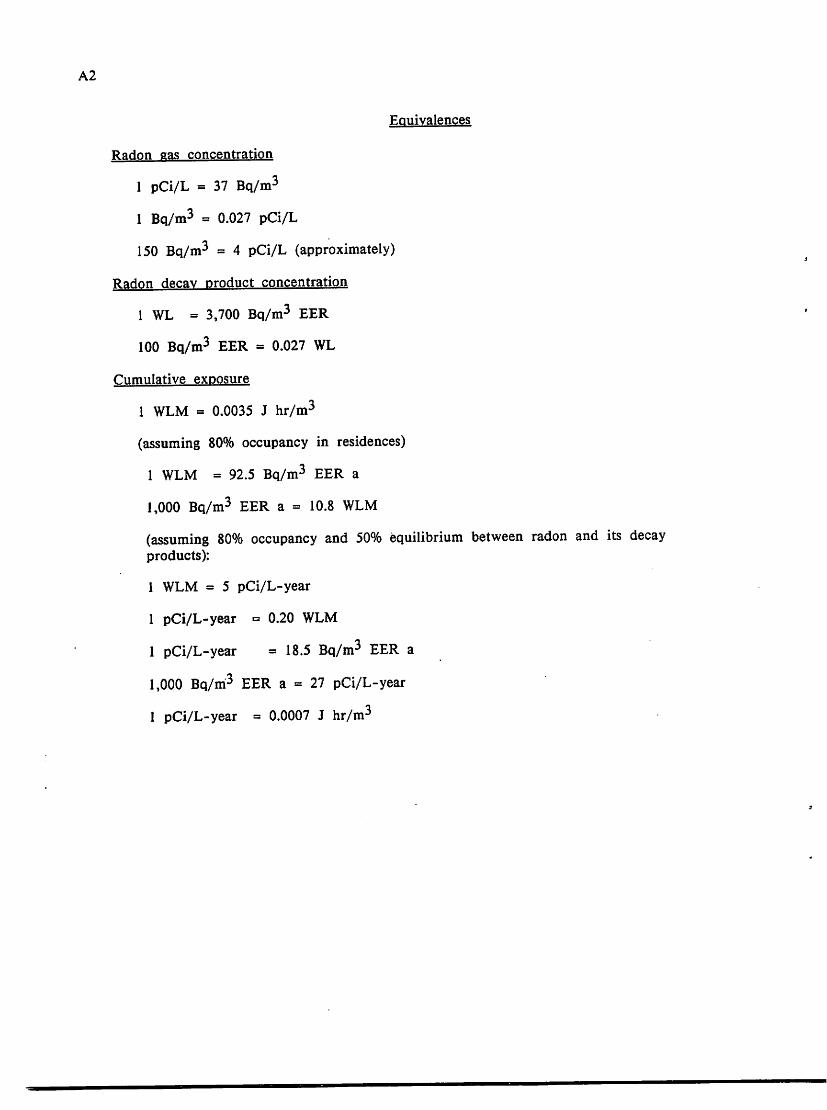
A2
Equivalences
Radon gas concentration
1 pCi/L = 37 Bq/m3
1 Bq/m3 = 0.027 pCi/L
150 Bq/m3 = 4 pCi/L (approximately)
Radon decay product concentration
1 WL = 3,700 Bq/m3 EER
100 Bq/m3 EER = 0.027 WL
Cumulative exposure
1 WLM = 0.0035 J hr/m3
(assuming 80% occupancy in residences)
1 WLM = 92.5 Bq/m3 EER a
1,000 Bq/m3 EER a = 10.8 WLM
(assuming 80% occupancy and 50% equilibrium between radon and its decay
products):
1 WLM = 5 pCi/L-year
1 pCi/L-year = 0.20 WLM
1 pCi/L-year = 18.5 Bq/m3 EER a
1,000 Bq/m3 EER a = 27 pCi/L-year
1 pCi/L-year = 0.0007 J hr/m3

B 1
APPENDIX B
Original NJ Female Lung Cancer Case-Control Studv: Methods
Cases included all female state residents who were newly diagnosed with
histologically confirmed primary cancer of the lung, trachea or bronchus (code 162,
International Classification of Diseases, 9th Revision) from August 1982 through
September 1983. They were ascertained through a rapid reporting system that the
NJ State Department of Health (NJDOH) established with local hospital pathology
departments, and by periodic review of hospital pathology records and of State
Cancer Registry and death certificate files. Pathology reports, from which the
histologic type was determined, and other medical records were reviewed by NJDOH
physicians to verify the diagnosis. No slide review was conducted. Some
adenocarcinoma cases were designated as "probably in-scope,11 rather than "in-scope,"
if there was insufficient documentation to rule out completely the possibility of
another primary site, particularly breast cancer.
Population-based controls were selected using one of three files. For cases who
were themselves interviewed, controls were selected using a random sample of either
New Jersey drivers1 license files (for ages less than 65) or Health Care Financing
Administration Files (for ages 65 or older), and were frequency matched to the
cases within race and 5-year age groups. For deceased or incapacitated cases, with
next-of-kin respondents, New Jersey State mortality files were used to select
controls who were individually matched to the cases by race, age, and closest date
of death (or date of death closest to date of diagnosis, for incapacitated cases).
Controls selected from mortality files were excluded if lung cancer or any other
respiratory disease was mentioned on the death certificate.
Subjects or their next-of-kin were personally interviewed in their homes by
trained interviewers. Questionnaire items included demographic data, a detailed

B2
brand-specific smoking history, a history of passive exposure to smoking by other
household members, a dietary history to determine consumption of foods containing
vitamin A, and lifetime residential and occupational histories.
In the cigarette use section of the questionnaire, a smoker first was asked to
recall the years in which she smoked cigarettes for any period 6 months or longer.
Second, she was asked to recall the brands of cigarettes she smoked during each
period, the specific years in which she smoked each brand, the number of cigarettes
of each brand smoked per day, and the depth of inhalation for each. The
interviewer probed for any changes in number per day of a particular brand; a
change greater than 10 per day generated a new data entry. The sequence of
temporal episodes yielded the summary measures of years actually smoked and years
since cessation (if any). The collection of brand name and intensity records for
each episode yielded a lifetime intensity measure, or average number of cigarettes
smoked per day. The tar content per cigarette for any brand in any year was
determined from historical estimates (Tobacco Merchants Association, 1978; USDHHS,
1981) and test data (Federal Trade Commission, 1976; Federal Trade
Commission, 1983).
Time-weighted average tar levels were calculated for the interval 1973-1982.
This period was selected because (a) precise figures for tar content of all
domestically produced cigarettes were available; (b) except for the latter part of the
interval, when ultra-low-tar cigarettes became available, this period did not show as
sharp a decline in tar content as the two previous decades; and (c) this proximal
portion of the smoking history was assumed to be recalled more accurately by both
self- and next of kin respondents.
Diet was assessed by asking about the usual frequency of consumption,
approximately 4 years earlier, of 59 food items, including major sources of
preformed retinol and carotenoids. For fruits and vegetables that the respondent

B 3
said were eaten primarily in certain seasons, frequency of consumption both in
season and out of season and the length of season were obtained. In these
analyses, the average frequency of consumption was calculated for the food group
"vegetables", which in an earlier study of lung cancer among New Jersey white
males (Ziegler, 1986) had shown the strongest, most consistent inverse association
with lung cancer risk. The variable used in these analyses was calculated using
exactly the same food items as had been used in the earlier study. However, it
should be noted that the questionnaire used in this study also asked about
consumption of several additional vegetables; this additional information is not yet
included in the analyses. Therefore, the dietary associations presented here are
preliminary. However, it is doubtful that this will strongly affect the degree to
which diet confounds any association with radon.
In the occupational history section of the questionnaire, information was
obtained on each full-time or part-time job held for 3 months or more since age 12.
This included the name and address of employer; type of business; job title; duties
performed; materials handled; exposure to solvents, fumes, or dust; and time period
of employment. All industry and job title information was coded using the 1970
census index system (US Bureau of Census, 1971). Job title categories and industry-
job title categories (selected job titles from specified industries; only those
potentially exposed, excluding most clerical, administrative, and sales personnel)
were chosen for analysis after an extensive literature review, with particular
attention to Dubrow and Wegman's summary of occupational surveillance studies
(Dubrow and Wegman, 1983). For this study, categories were also chosen if they
represented occupations in which women were frequently employed.
In the passive smoking exposure section of the questionnaire, a subject was
asked whether any member of her household ever smoked. This included parents
and other members of her family while she was growing up, and her spouse if she
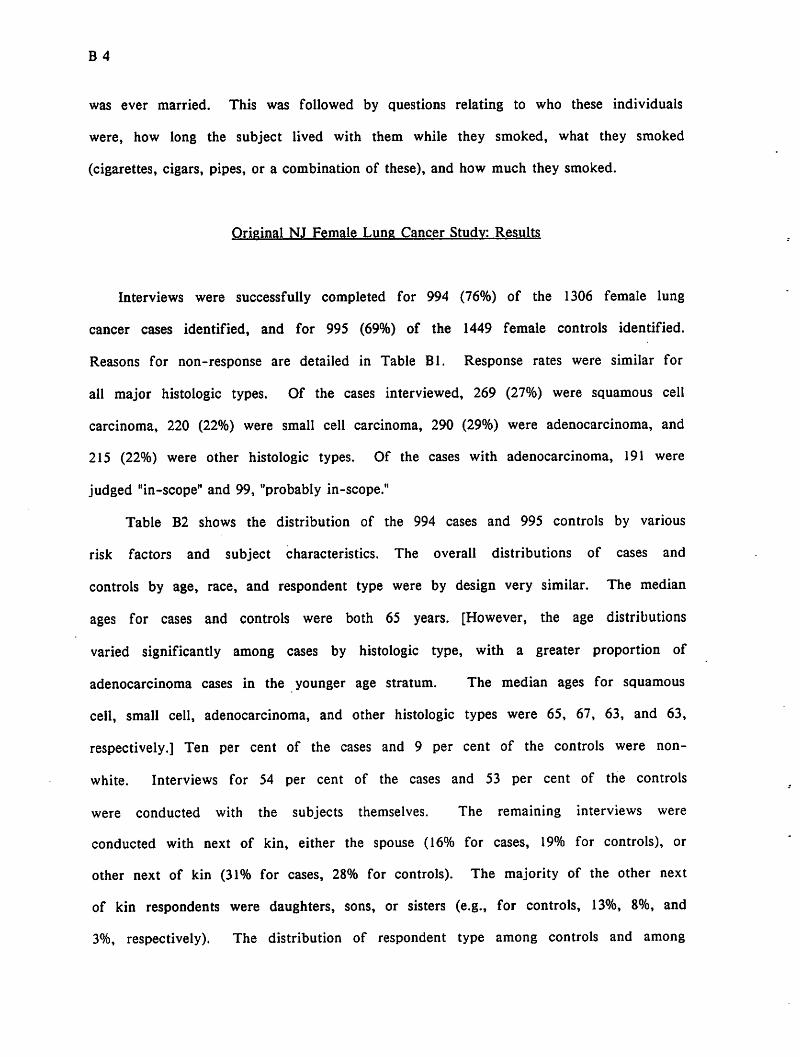
B4
was ever married. This was followed by questions relating to who these individuals
were, how long the subject lived with them while they smoked, what they smoked
(cigarettes, cigars, pipes, or a combination of these), and how much they smoked.
Original NJ Female Lung Cancer Studv: Results
Interviews were successfully completed for 994 (76%) of the 1306 female lung
cancer cases identified, and for 995 (69%) of the 1449 female controls identified.
Reasons for non-response are detailed in Table Bl. Response rates were similar for
all major histologic types. Of the cases interviewed, 269 (27%) were squamous cell
carcinoma, 220 (22%) were small cell carcinoma, 290 (29%) were adenocarcinoma, and
215 (22%) were other histologic types. Of the cases with adenocarcinoma, 191 were
judged "in-scope" and 99, "probably in-scope."
Table B2 shows the distribution of the 994 cases and 995 controls by various
risk factors and subject characteristics. The overall distributions of cases and
controls by age, race, and respondent type were by design very similar. The median
ages for cases and controls were both 65 years. [However, the age distributions
varied significantly among cases by histologic type, with a greater proportion of
adenocarcinoma cases in the younger age stratum. The median ages for squamous
cell, small cell, adenocarcinoma, and other histologic types were 65, 67, 63, and 63,
respectively.] Ten per cent of the cases and 9 per cent of the controls were non-
white. Interviews for 54 per cent of the cases and 53 per cent of the controls
were conducted with the subjects themselves. The remaining interviews were
conducted with next of kin, either the spouse (16% for cases, 19% for controls), or
other next of kin (31% for cases, 28% for controls). The majority of the other next
of kin respondents were daughters, sons, or sisters (e.g., for controls, 13%, 8%, and
3%, respectively). The distribution of respondent type among controls and among
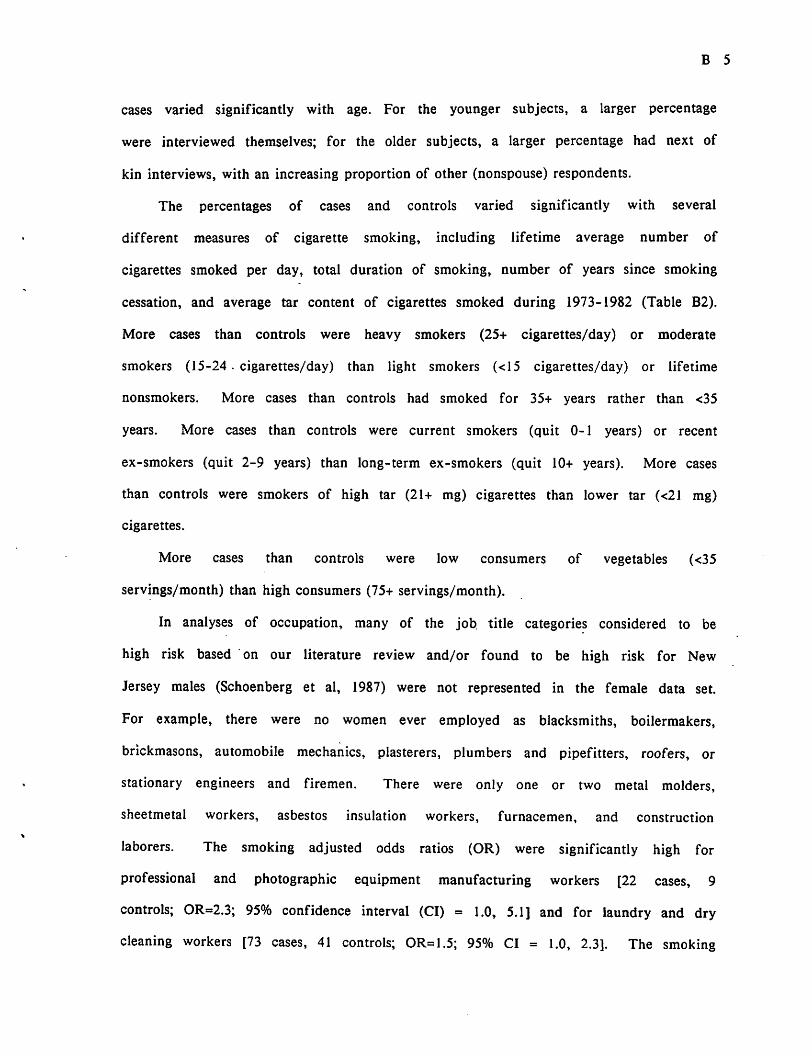
B 5
cases varied significantly with age. For the younger subjects, a larger percentage
were interviewed themselves; for the older subjects, a larger percentage had next of
kin interviews, with an increasing proportion of other (nonspouse) respondents.
The percentages of cases and controls varied significantly with several
different measures of cigarette smoking, including lifetime average number of
cigarettes smoked per day, total duration of smoking, number of years since smoking
cessation, and average tar content of cigarettes smoked during 1973-1982 (Table B2).
More cases than controls were heavy smokers (25+ cigarettes/day) or moderate
smokers (15-24 . cigarettes/day) than light smokers (<15 cigarettes/day) or lifetime
nonsmokers. More cases than controls had smoked for 35+ years rather than <35
years. More cases than controls were current smokers (quit 0-1 years) or recent
ex-smokers (quit 2-9 years) than long-term ex-smokers (quit 10+ years). More cases
than controls were smokers of high tar (21+ mg) cigarettes than lower tar (<21 mg)
cigarettes.
More cases than controls were low consumers of vegetables (<35
servings/month) than high consumers (75+ servings/month).
In analyses of occupation, many of the job. title categories considered to be
high risk based on our literature review and/or found to be high risk for New
Jersey males (Schoenberg et al, 1987) were not represented in the female data set.
For example, there were no women ever employed as blacksmiths, boilermakers,
brickmasons, automobile mechanics, plasterers, plumbers and pipefitters, roofers, or
stationary engineers and firemen. There were only one or two metal molders,
sheetmetal workers, asbestos insulation workers, furnacemen, and construction
laborers. The smoking adjusted odds ratios (OR) were significantly high for
professional and photographic equipment manufacturing workers [22 cases, 9
controls; OR=2.3; 95% confidence interval (CI) = 1.0, 5.1] and for laundry and dry
cleaning workers [73 cases, 41 controls; OR=1.5; 95% CI = 1.0, 2.3]. The smoking
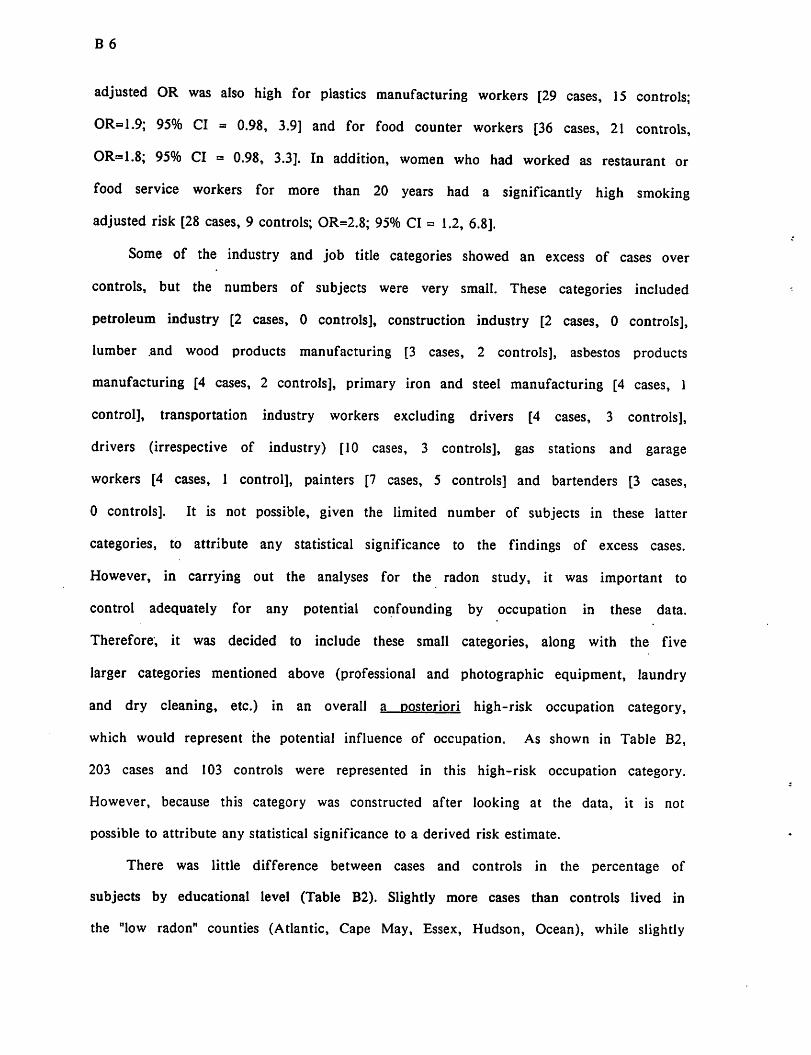
B 6
adjusted OR was also high for plastics manufacturing workers [29 cases, 15 controls;
OR=1.9; 95% CI = 0.98, 3.9] and for food counter workers [36 cases, 21 controls,
OR=1.8; 95% CI = 0.98, 3.3]. In addition, women who had worked as restaurant or
food service workers for more than 20 years had a significantly high smoking
adjusted risk [28 cases, 9 controls; OR=2.8; 95% CI = 1.2, 6.8].
Some of the industry and job title categories showed an excess of cases over
controls, but the numbers of subjects were very small. These categories included
petroleum industry [2 cases, 0 controls], construction industry [2 cases, 0 controls],
lumber .and wood products manufacturing [3 cases, 2 controls], asbestos products
manufacturing [4 cases, 2 controls], primary iron and steel manufacturing [4 cases, 1
control], transportation industry workers excluding drivers [4 cases, 3 controls],
drivers (irrespective of industry) [10 cases, 3 controls], gas stations and garage
workers [4 cases, 1 control], painters [7 cases, 5 controls] and bartenders [3 cases,
0 controls]. It is not possible, given the limited number of subjects in these latter
categories, to attribute any statistical significance to the findings of excess cases.
However, in carrying out the analyses for the radon study, it was important to
control adequately for any potential confounding by occupation in these data.
Therefore, it was decided to include these small categories, along with the five
larger categories mentioned above (professional and photographic equipment, laundry
and dry cleaning, etc.) in an overall a posteriori high-risk occupation category,
which would represent the potential influence of occupation. As shown in Table B2,
203 cases and 103 controls were represented in this high-risk occupation category.
However, because this category was constructed after looking at the data, it is not
possible to attribute any statistical significance to a derived risk estimate.
There was little difference between cases and controls in the percentage of
subjects by educational level (Table B2). Slightly more cases than controls lived in
the "low radon" counties (Atlantic, Cape May, Essex, Hudson, Ocean), while slightly

B 7
more controls than cases lived in the "moderately low radon" counties (Bergen,
Burlington, Cumberland, Gloucester, Middlesex, and Union). [See footnote e, Table
B2, for further details on the grouping of counties according to radon level.]
Among lifetime nonsmokers only [116 cases, 499 controls], there were slightly
more cases than controls who were exposed to spouse cigarette smoke, and fewer
cases than controls who were exposed to spouse smoke from only pipes or cigars.
Table B3 shows the odds ratios and 95% confidence intervals estimated for
these risk factors and subject characteristics using multiple logistic regression
analysis (Breslow and Day, 1980) as carried out using the microcomputer-based
LOGRESS program (McGee, 1986). Of the several variables for smoking, only
lifetime average number of cigarettes smoked per day was considered in this initial
analysis. Smoking was the major risk for lung cancer among these women, with
risks ranging from 4.4 for light smokers to 14.4 for heavy smokers. After
controlling for smoking, the age variable (72+ years compared to 58-71 years)1, the
vegetable consumption variable (both low and moderate consumption) and the
occupation variable showed moderate increases in risk. Respondent type, race,
education, and county group had little influence on lung cancer risk, after adjusting
for smoking, age, diet, and occupation.
Even though respondent type was not an appreciable confounder . for the
associations between lung cancer and smoking, there were significant differences in
the smoking-related risk by respondent type, i.e., there was significant interaction
(Schoenberg et al, 1989). Table B4 shows results of an analysis similar to that
shown in Table B3, but including interaction terms between respondent type and
each of the three variables for the smoking groups according to cigarettes per day.
* The risk associated with increased age emerges despite the fact the the original case and control series were age matched. This reflects reverse confounding by
smoking. It also reflects a cohort effect, in that subjects age 72+ were more often
nonsmokers than were subjects younger than age 72.

B8
The OR for the three cigarettes per day groups (i.e., the main effects in the model)
now reflect the smoking-associated risk in subjects who were self-respondents, with
risks ranging from 6.2 in light smokers to 27.7 in heavy smokers. The OR for the
three respondent type* cigarettes per day groups (i.e., the interaction terms), when
multiplied by the OR for the main effects, yield the OR for subjects with next of
kin respondents, with risks ranging from 3.2 for light smokers to 9.1 for heavy
smokers. The hypothesized reasons for this significant interaction have been
discussed extensively elsewhere (Schoenberg et al, 1989). Actual differences in
smoking between living and deceased controls may explain some of the risk
differences by respondent type. However, misclassification by next of kin
respondents seems as likely an explanation, given the significantly lower percentage
of smokers reported by next of kin for cases. The possibility of misclassification is
also consistent with differences in the degree of respondent type heterogeneity
observed in histologic type specific smoking risks.
Because smoking is such an important risk factor, it was not considered
sufficient to control only for lifetime average number of cigarettes smoked per day.
Table B5 shows the results of analyses considering total duration of smoking,
number of years since smoking cessation, or average cigarette tar content (1973-
1982), in addition to lifetime average daily cigarette consumption. All of these
analyses are adjusted for age, race, respondent type, vegetable consumption,
occupation, and education (but not for the interaction between smoking and
respondent type). Inclusion of any of the three detailed smoking variables shows a
highly signficant improvement in the overall fit of the model, as measured by the
increase in the likelihood ratio statistic [duration of smoking, Chi-square=40.9, 4 df,
p < 0.0001; years since smoking cessation, Chi-square=78.6, 6 df, p < 0.0001;
cigarette tar content, Chi-square=59.0, 6 df, p < 0.0001]. Within light, moderate, or
heavy smokers, risk increases systematically with increasing number of years

B 9
smoked, with decreasing number of years since smoking cessation (if any), or with
increasing cigarette tar content. The maximum risk is 18.8 for heavy smokers who
smoked 35+ years, 20.5 for heavy current smokers, or 33.2 for heavy smokers of
high tar cigarettes.
Logistic regression analyses for passive smoking were limited to lifetime
nonsmokers (Table B6). After adjusting for age, race, respondent type, vegetable
consumption, occupation, and education, there was a very slight, non-significant
increase in risk associated with exposure to spouse cigarette smoke, and a
nonsignificant decrease in risk associated with exposure to spouse smoke only from
pipes or cigars. Previous analyses (not shown) gave the same results when exposure
to smoke from any household member, not just the spouse, was considered. Also,
previous analyses according to the duration of exposure to spouse cigarette smoke,
or the reported intensity of exposure (number of cigarettes smoked per day in the
house) did not show any systematic relationship, after adjusting for age. Therefore,
only the spouse smoking variable shown in these tables has been used in the radon
study analyses.
References
Dubrow R, and Wegman DH. Setting priorities for occupational cancer research and
control: Synthesis of the results of occupational disease surveillance studies. JNCI
71:1123-1142 (1983).
Federal Trade Commission. Report of "tar" and nicotine content of the smoke of
169 varieties of cigarettes. U.S. Gopvernment Printing Office, Washington, DC
(1976).
Federal Trade Commission. "Tar" and nicotine and carbon monixide of the smoke of
208 varieties of domestic cigarettes. U.S. Government Printing Office, Washington, DC. (1983).
Schoenberg JB, Stemhagen A, Mason TJ et al. Occupation and lung cancer risk
among New Jersey white males. JNCI 79:13-21 (1987).

BIO
Schoenberg, JB, Wilcox HB, Mason TJ et al. Variation in smoking-related lung cancer risk among New Jersey women. Amer J Epid (in press).
Tobacco Merchants Association of the U.S. The TMA directory of cigarette brand names 1913-1977. New York (1978).
U.S. Department of Commerce. 1970 census of population: Alphabetical index of industries and occupations. Washington, DC: US Government Printing Office (1971).
U.S. Department of Health and Human Services. The health consequences of smoking—the changing cigarette. A report of the Surgeon General. [DHHS(PHS)81 -50156], U.S. Government Printing Office, Washington, DC (1982).
Ziegler RG, Mason TJ, Stemhagen A, et al. Carotenoid intake, vegetables and the risk of lung cancer among white men in New Jersey. Amer J Epidemiol 123:1080-1093 (1986).
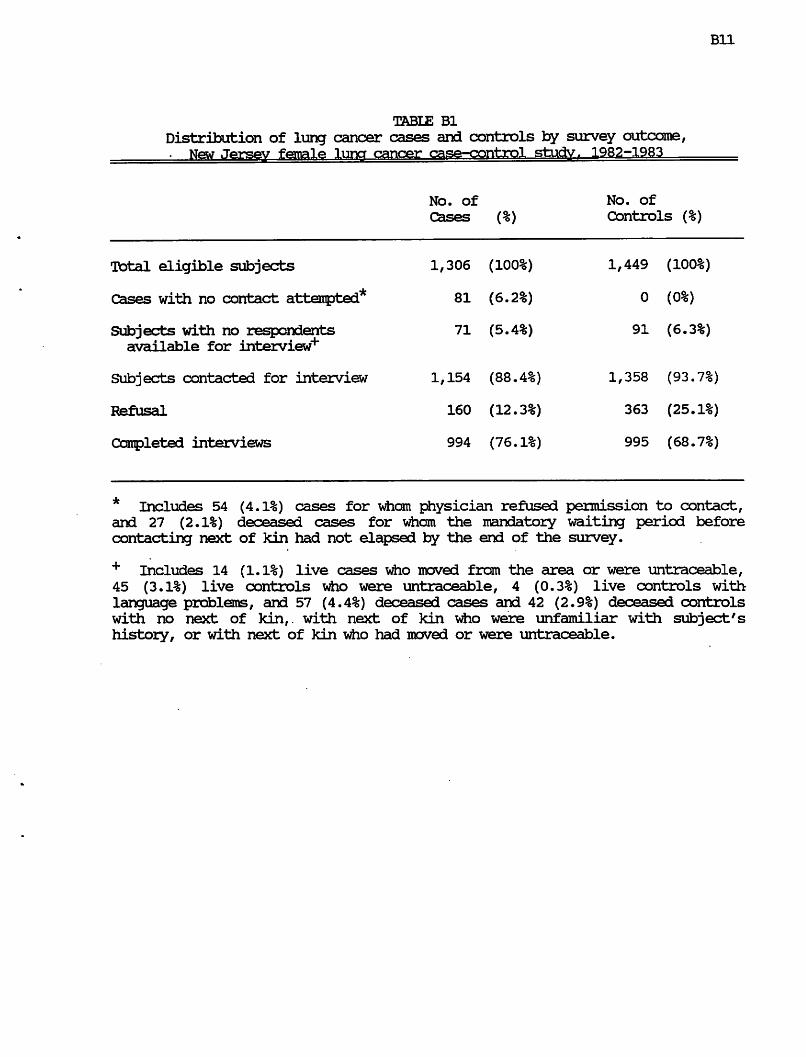
Bll
TABLE Bl
Distribution of lung cancer cases and controls by survey outcome,
Kfcw .Tersw female Tuner cancer case-control studv. 1982-1983
No. of
Cases (%)
No. of
Controls
Total eligible subjects
Cases with no contact attempted*
Subjects with no respondents
available for interview"4"
Subjects contacted for interview
Refusal
Completed interviews
1,306 (100%)
81 (6.2%)
71 (5.4%)
1,154 (88.4%)
160 (12.3%)
994 (76.1%)
1,449 (100%)
0 (0%)
91 (6.3%)
1,358 (93.7%)
363 (25.1%)
995 (68.7%)
* Includes 54 (4.1%) cases for wham physician refused permission to contact, and 27 (2.1%) deceased cases for whom the mandatory waiting period before
contacting next of kin had not elapsed by the end of the survey.
+ Includes 14 (1.1%) live cases who moved from the area or were untraceable, 45 (3.1%) live controls who were untraceable, 4 (0.3%) live controls with
language problems, and 57 (4.4%) deceased cases and 42 (2.9%) deceased controls
with no next of kin,, with next of kin who were unfamiliar with subject's
history, or with next of kin who had moved or were untraceable.

B12
TABLE B2
Number of lung cancer cases and controls in original study,
by various risk factors and subject characteristics, New Jersey female lima cancer case-oon+ml stiiriv iqoo—i
No. of
cases (%)
No. of
controls (%) TOTAL 994
AGE AT DIAGNOSIS*1
<58 years
58-71 years
72+ years
995
255 (25.7%)
489 (49.2%)
250 (25.2%)
249 (25.0%)
485 (48.7%)
261 (26.2%)
RESPONDENT TYPE
self
spouse
other next of kin
532 (53.5%)
155 (15.6%)
307 (30.9%)
528 (53.1%)
188 (18.9%)
279 (28.0%)
RACE
\rfiite, including hispanic
nonwhite
899
95
(90.4%)
( 9.6%)
910
85
(91.5%)
( 8.5%)
CIGARETTES/EIAY fi Lifetime nonsmoker
< 15 cigarettes/day
15-24 cigarettes/day
25+ cigarettes/day
116 (11.7%)
198 (19.9%)
414 (41.7%)
266 (26.8%)
499 (50.2%)
210 (21.1%)
195 (19.6%)
91 ( 9.2%)
TOTAL NUMBER OF YEARS SMOKED
Lifetime nonsmoker
< 35 years
35+ years
116 (11.7%)
219 (22.0%)
659 (66.3%)
499 (50.2%)
235 (23.6%)
261 (26.2%)
NUMBER OF YEARS QUIT SMDKENG
Lifetime nonsmoker
Current smoker, quit 0-1 years
Ex-smoker, quit 2-9 years
Ex-smoker, quit 10+ years
116 (11.7%)
712 (71.6%)
103 (10.4%)
63 ( 6.3%)
499 (50.2%)
289 (29.1%)
78 ( 7.8%)
129 (13.0%)
AVERAGE CIGARETTE TAR CONTENT, 1973-1982
Lifetime nonsmoker
Nonsmoker, 1973-1982
Smoker, tar <21 mg/cigarette
Smoker, tar 21+ mg/cigarette
116 (11.7%)
60 ( 6.0%)
664 (66.8%)
154 (15.5%)
499 (50.2%)
116 (11.7%)
336 (33.8%)
44 ( 4.4%)
VEGETABLE CONSUMPTION51
<35 servings/month
35-74 servings/month
75+ servings/month
284 (28.6%)
532 (53.5%)
178 (17.9%)
238 (23.9%)
510 (51.3%)
247 (24.8%)
(contd)

B13
TABLE B2 (contd)
Number of lung cancer cases and controls in original study,
by various risk factors and subject characteristics,
New Jersey female luna cancer case-control studv. 1982-1983
EDUCATION
<8 years completed
8-12 years completed
13+ years completed
127 (12.8%)
648 (65.2%)
219 (22.0%)
COUNTY AT DIAGNOSIS01 Low radon
Moderately low radon
Moderate radon
High radon
144 (14.5%)
605 (60.8%)
246 (24.7%)
300 (30.2%)
354 (35.6%)
190 (19.1%)
150 (15.1%)
265 (26.6%)
389 (39.1%)
195 (19.6%)
146 (14.7%)
LIFETIME NONSMOKERS ,
BY PASSIVE SM3KENG
No exposure to spouse tobacco
Exposure to spouse cigarette smoke
Exposure to spouse pipe/cigar only
43 (37.1%)
66 (56.9%)
7 ( 6.0%)
196 (39.3%)
250 (50.1%)
53 (10.6%)
a Cutpoints based on distribution of controls in original female lung cancer stucty (1st quartile; 2ndK3rd quartiles; 4th quartile).
b Lifetime average number of cigarettes smoked per day. Cutpoints based on bimodal distribution of controls in original female lung cancer study, with peaks at 10 and 20 cigarettes per day, and a long tail starting at 25 cigarettes per day.
c Ever employed in any occupational group shown to have a smoking adjusted risk of 1.5 or greater in the original female lung cancer study. This is an a posteriori definition, used only for the purpose of adjusting in the radon analyses for the possible effect of occupational exposure. See text for further clarification of this variable.
County at diagnosis for cases, or county at ascertainment for controls. Low radon counties include include Atlantic, Cape May, Essex, Hudson, and Ocean counties. Moderately low radon counties include Bergen, Burlington, Cumberland, Gloucester, Middlesex, and Union counties. Moderate radon counties include Camden, Monmouth, Passaic, and Salem counties. High radon counties include Hunterdon, Mercer, Morris, Somerset, Sussex, and Warren counties. Grouping of counties was determined by the percentage of houses with basement or lower level screening values above 4 pCi/L in the statewide survey conducted
for the New Jersey State Department of Environmental Protection (see Appendix G).
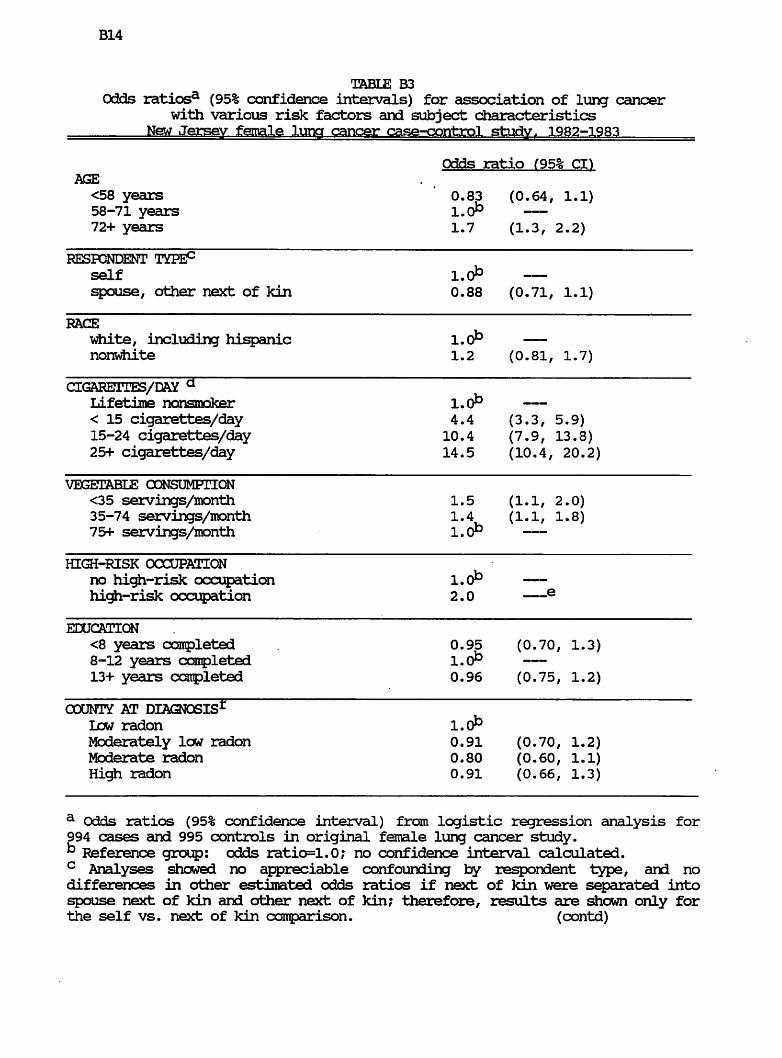
B14
TABLE B3
Odds ratiosa (95% confidence intervals) for association of lung cancer with various risk factors and subject characteristics
New Jersey female lung cancer case-control study f 1982-1983
Odds ratio (95% CI)
AGE
<58 years ' 0.83 (0.64, 1.1) 58-71 years l.(P 72+ years 1.7 (1.3, 2.2)
RESPONDENT
self l.(P spouse, other next of kin 0.88 (0.71, 1.1)
RACE
white, including hispanic l.(P nonwhite 1.2 (0.81, 1.7)
CIGARETTES/DAY a Lifetime nonsmoker 1.0^ — < 15 cigarettes/day 4.4 (3.3, 5.9)
15-24 cigarettes/day 10.4 (7.9, 13.8)
25+ cigarettes/day 14.5 (10.4, 20.2)
VEGETABLE CONSUMPTION
<35 servings/month 1.5 (1.1, 2.0)
35-74 servings/month 1.4 (1.1, 1.8)
75+ servings/month l.(P
HE2I-RISK OCCUPATION
no high-risk occupation l.d° — high-risk occupation 2.0 —e
EDUCATION
<8 years completed . 0.95 (0.70, 1.3)
8-12 years completed l.(P 13+ years completed 0.96 (0.75, 1.2)
COUNTY AT DIAGNOSIS1 Irw radon l.(P Moderately low radon 0.91 (0.70, 1.2)
Moderate radon 0.80 (0.60, 1.1)
radon 0.91 (0.66, 1.3)
a Odds ratios (95% confidence interval) from logistic regression analysis for
994 cases and 995 controls in original female lung cancer study.
b Reference group: odds ratio=1.0; no confidence interval calculated. c Analyses showed no appreciable confounding by respondent type, and no differences in other estimated odds ratios if next of kin were separated into
spouse next of kin and other next of kin? therefore, results are shown only for
the self vs. next of kin comparison. (contd)

B15
Table B3 (contd)
d lifetime average number of cigarettes per day e no significance testing or confidence limits shown for a posteriori occupation category.
f County at diagnosis for cases, or county at ascertainment for controls. low radon counties include include Atlantic, Cape May, Essex, Hudson, and Ocean
counties. Moderately low radon counties include Bergen, Burlington,
Cumberland, Gloucester, Middlesex, and Union counties. Moderate radon counties
include Camden, Monmouth, Passaic, and Salem counties. High radon counties
include Hunterdon, Mercer, Morris, Somerset, Sussex, and Warren counties.
Grouping of counties was determined by the percentage of houses with basement
or lower level screening values above 4 pCi/L in the statewide survey conducted
for the New Jersey State Department of Environmental Protection (see Appendix G).

B16
TABLE B4
Odds ratios3 (95% confidence intervals) for association of lung cancer with various risk factors and subject characteristics,
including interaction between smoking and respondent type, New Jersey female lung cancer case-aontrol study r 1982-1983
Odds ratio (95% CD
AGE
<58 years 0.81 (0.63, 1.1)
58-71 years l.O*3 — 72+ years 1.6 (1.3, 2.1)
RESPONDENT TYPE0 self l.oib
spouse, other next of kin 1.6 (1.0, 2.4)
RACE
white, including hispanic l.(P — nonwhite 1.2 (0.81, 1.7)
CIGARETTES/DMT a Lifetime nonsmoker l.(P — < 15 cigarettes/day 6.2 (4.1, 9.3)
15-24 cigarettes/day 14.7 (9.9, 22.0)
25+ cigarettes/day 27.7 (16.3, 47.2)
RESPONDENT TYPE * CIGARETTES/DAY
Next of kin*Nonsmoker i.d° — Next of kin*<15 cigarettes/day 0.51 (0.28, 0.91)
Next of kin*15-24 cigarettes/day 0.51 (0.30, 0.89)
Next of kin*25f cigarettes/day 0.33 (0.17, 0.63)
VEGETABLE CONSUMPTION
<35 servings/month 1.5 (1.1, 2.0)
35-74 servings/month 1.4 (1.1, 1.8)
75+ servings/month i.(P
HIGH-RISK OCCUPATION : no high-risk occupation l.(P — high-risk occupation 2.0 e
EDUCATION
<8 years completed 0.96 (0.70, 1.3)
8-12 years completed 1.<P — 13+ years completed 0.96 (0.75, 1.2)
OOUNTY AT DIAGNOSIS1
low radon l.(P Moderately low radon 0.92 (0.72, 1.2)
Moderate radon 0.79 (0.59, 1.1)
High radon 0.91 (0.66, 1.3)
(contd)

B17
Table B4 (contd)
a Odds ratios (95% confidence interval) from logistic regression analysis for 994 cases and 995 controls in original female lung cancer study.
k Reference group: odds ratio=1.0; no confidence interval calculated. c Analyses showed no appreciable confounding by respondent type, and no
significant differences in other estimated odds ratios if next of kin were
separated into spouse next of kin and other next of kin; therefore, results are
shown only for the self vs. next of kin comparison.
d lifetime average number of cigarettes per day e no significance testing or confidence limits shown for a posteriori occupation category.
f County at diagnosis for cases, or county at ascertainment for controls. Low radon counties include include Atlantic, Cape May, Essex, Hudson, and Ocean
counties. Moderately low radon counties include Bergen, Burlington,
Cumberland, Gloucester, Middlesex, and Union counties. Moderate radon counties
include Camden, Monmouth, Passaic, and Salem counties. Hic£i radon counties
include Ifcinterdon, Mercer, Morris, Somerset, Sussex, and Warren counties.
Grouping of counties was determined by the percentage of houses with basement
or lower level screening values above 4 pCi/L in the statewide survey conducted
for the New Jersey State Department of Environmental Protection (see Appendix
G).

B18
TABLE B5
Odds ratiosa (95% confidence intervals) for association of lung cancer
with detailed smoking characteristics
1982-1983
a Odds ratios (95% confidence interval) from logistic regression analysis for
994 cases and 995 controls in original female lung cancer study, adjusting for
age, race, respondent type, vegetable consumption, occupation, and education.
b Reference group: odds ratio=1.0; no confidence interval calculated.
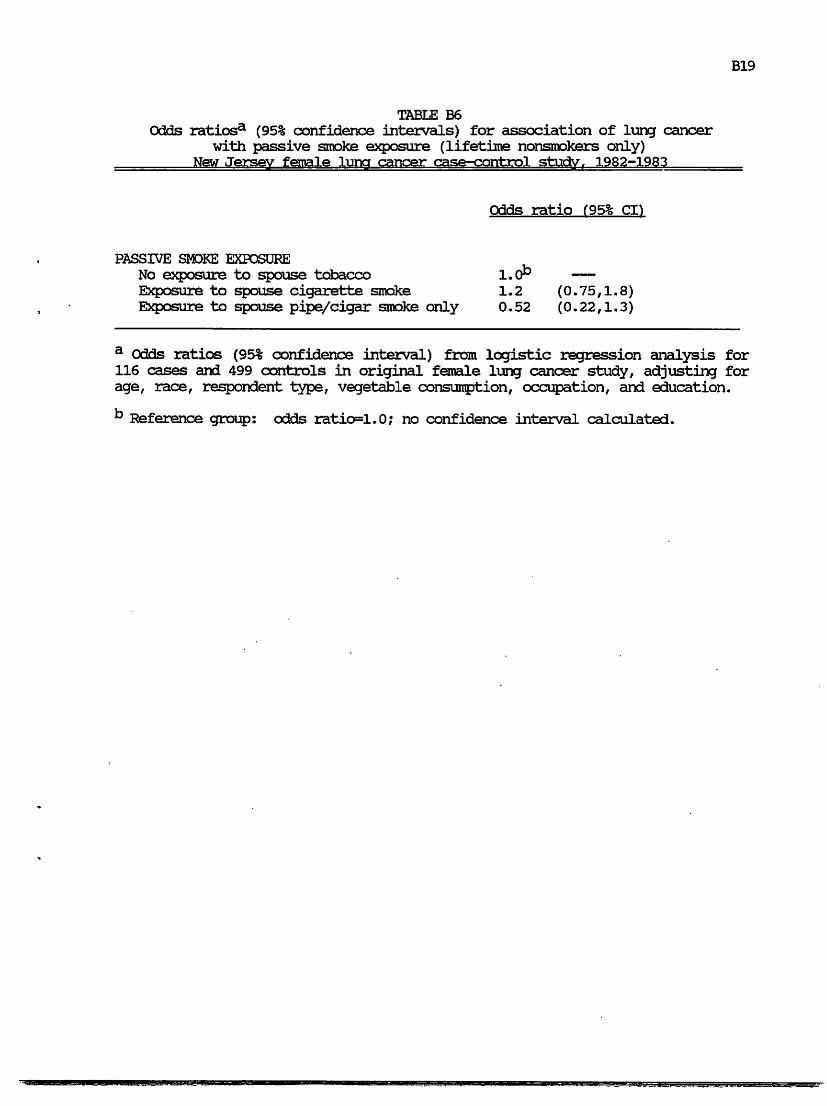
B19
TABLE B6
Odds ratiosa (95% confidence intervals) for association of lung cancer
with passive smoke exposure (lifetime nonsmokers only)
New Jersey female lung cancer case-control study. 1982-1983
Odds ratio f95% CL)
PASSIVE SMOKE EXPOSURE
No exposure to spouse tobacco l.(P Exposure to spouse cigarette smoke 1.2 (0.75,1.8)
Exposure to spouse pipe/cigar smoke only 0.52 (0.22,1.3)
a Odds ratios (95% confidence interval) from logistic regression analysis for 116 cases and 499 controls in original female lung cancer study, adjusting for
age, race, respondent type, vegetable consumption, occupation, and education.
b Reference group: odds ratio=1.0; no confidence interval calculated.
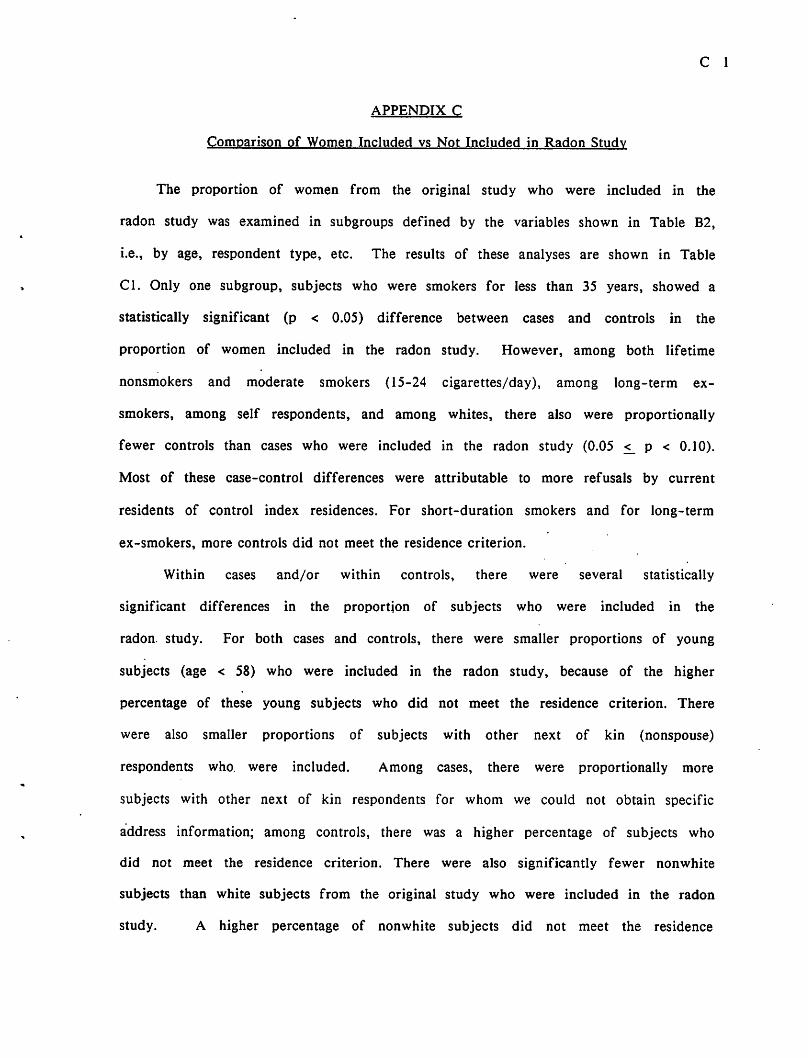
C 1
APPENDIX C
Comparison of Women Included vs Not Included in Radon Study
The proportion of women from the original study who were included in the
radon study was examined in subgroups defined by the variables shown in Table B2,
i.e., by age, respondent type, etc. The results of these analyses are shown in Table
Cl. Only one subgroup, subjects who were smokers for less than 35 years, showed a
statistically significant (p < 0.05) difference between cases and controls in the
proportion of women included in the radon study. However, among both lifetime
nonsmokers and moderate smokers (15-24 cigarettes/day), among long-term ex-
smokers, among self respondents, and among whites, there also were proportionally
fewer controls than cases who were included in the radon study (0.05 <_ p < 0.10).
Most of these case-control differences were attributable to more refusals by current
residents of control index residences. For short-duration smokers and for long-term
ex-smokers, more controls did not meet the residence criterion.
Within cases and/or within controls, there were several statistically
significant differences in the proportion of subjects who were included in the
radon, study. For both cases and controls, there were smaller proportions of young
subjects (age < 58) who were included in the radon study, because of the higher
percentage of these young subjects who did not meet the residence criterion. There
were also smaller proportions of subjects with other next of kin (nonspouse)
respondents who. were included. Among cases, there were proportionally more
subjects with other next of kin respondents for whom we could not obtain specific
address information; among controls, there was a higher percentage of subjects who
did not meet the residence criterion. There were also significantly fewer nonwhite
subjects than white subjects from the original study who were included in the radon
study. A higher percentage of nonwhite subjects did not meet the residence

C2
criterion; there were also more nonwhites for whom specific address information
could not be obtained.
Within cases and controls, there were no statistically significant differences in
the proportion of subjects included in the radon study according to cigarettes
smoked per day. However, radon study subjects had higher proportions of
nonsmokers and light smokers, and lower proportions of moderate and heavy
smokers. Controls who had smoked less than 35 years, cases who were current
smokers, and cases who smoked high tar cigarettes had significantly lower
proportions of subjects included in the radon study, primarily because fewer of
these subgroups met the residence criterion.
There were significant increases in the proportion of original subjects
included in the radon study with increasing educational level. This was related to
differences in the percentage of subjects for whom address specific information
could not be obtained, as well as differences in the percentages of subjects whose
index residence could not be tested for radon (because of refusal or because the
house had been demolished). These differences persisted when the analyses were
restricted only to white subjects.
Those counties with lower proportions of cases or controls included in the
radon study also had higher proportions who did not meet the residence criterion.
There was little difference by county group in the proportion with no radon testing
at the index residence, or in the proportion with refusal by the current resident.
Control nonsmokers with no reported spouse tobacco exposure also had a
lower proportion included in the radon study, because there were more subjects for
whom specific address information could not be obtained.
Although the case-control differences in radon study inclusion appeared to be
minimal within most subgroups, the differences in risk factor distributions were
frequent. Therefore, we repeated the logistic regression analyses shown in Appendix
C 3
B, with a variable representing inclusion in the radon substudy (Table C2). Among
all subjects (TOTAL), adjusting for all other risk factors and subject characteristics
shown, it was significantly more likely for a case than a control to be included in
the radon substudy [OR = 1.3; 95% CI= 1.1, 1.6]. Given the smoking-related
differences in the radon-associated risk observed in this study, it was also
important to assess this bias potential within subgroups according to smoking. The
radon study inclusion term was marginally significant for nonsmokers [OR = 1.5; 95%
CI= 0.98, 2.3] and significant for moderate smokers [OR = 1.5; 95% CI= 1.0, 2.1].
Light smokers, who showed the strongest radon-associated risk, showed the least
bias potential. Heavy smokers, who showed no radon-associated risk, also showed
little bias potential.
Table C2 also shows the odds ratios for other risk factors within the smoking
subgroups, after controlling for inclusion in the radon study. These odds ratios
suggest that proportionally more cases with next of kin respondents were reported
to be nonsmokers, while proportionally fewer cases with next of kin respondents
were reported to be moderate or heavy smokers. The differences in smoking-
associated risk according to respondent type discussed in Appendix B are consistent
with the possibility of misclassification of smoking by next of kin respondents.
Among nonsmokers, the odds ratios for residence in the three higher radon
county groups are significantly low, relative to residence in the low radon county
group [moderately low: OR=0.57, 95% CI=0.34, 0.94; moderate: OR= 0.43, 95%
CI=0.22, 0.85; high: OR = 0.59, 95% CI= 0.30, 1.2]. Among heavy smokers, the odds
ratio for residence in the moderately low radon county group, relative to residence
in the low radon counties, is marginally significantly high [OR = 2.0 (0.98, 3.9)].
These observations suggest the possibility that other, as yet undetermined,
geographically-associated risk factors might be operating to mask any slight radon
effect in nonsmokers or heavy smokers.

C4
Another means of examining the possibility of bias in the radon substudy
population is to compare odds ratios for other risk factors and subject
characteristics in those subjects included vs. those subjects not included. Tabie C3
shows the results of such analyses, for the total study population, and for subgroups
according to smoking. The 95% confidence intervals for the odds ratios are not
shown; however, any statistically significant (p < 0.05) or marginally signficant (p <
0.10) differences in odds ratios between those included and not included are noted.
In the total study population, the only marginally significant difference was in the
odds ratio for moderate, long-term ex-smokers relative to lifetime nonsmokers. This
difference also appeared in the comparisons for the moderate smokers. The only
other statistically significant differences in odds ratios were for the heavy smokers.
Those heavy smokers included in the radon study showed a pattern of increasing
risk with increasing vegetable consumption, which was opposite to that observed for
the heavy smokers not included in the radon study, and opposite to that observed
for most other subgroups. The heavy smokers included in the radon study also
showed a significantly low risk associated with fewer years of school, compared to
no association in the heavy smokers who were not included in the radon study.
The absence of a radon-association among heavy smokers (in fact, the
suggestion of a negative trend, although non-significant) suggested that the heavy
smokers included in the radon study might be unusual in some respects. The
differences observed in Table C3 are consistent with this suspicion, and suggest that
the heavy smokers should be examined in greater detail. Table C4 replicates Table
Cl, but exclusively for heavy smokers. Although the numbers are small, several
observations are noteworthy. There is a pronounced deficit of subjects with less
than eight years of school among the heavy smoker cases included in the radon
study. There is also a deficit of subjects with high vegetable consumption among
the heavy smoker controls included in the radon study.
C 5
Conclusions The original female lung cancer study was population-based in
design. However, in establishing the residence criterion for the radon substudy, and
in eliciting cooperation from the current residents of the index addresses, the radon
study was no longer population-based. Overall, there was significantly greater
participation for cases in the original study than for controls. Moreoever, radon
study subjects were more often older, whites, either nonsmokers, light smokers, or
exsmokers, residents of counties with higher radon levels, and more highly educated.
Nonetheless, there were relatively few significant differences in other risk factors
and subject characteristics between those included and not included, except among
heavy smokers, who showed some highly unusual risk factor distributions. The
significant differences in smoking-related risk by respondent type discussed in
Appendix B are consistent with the possibility of misclassification of smoking by
next of kin respondents. The possibility of a case response bias and further
misclassification of smoking, even by subject respondents, is purely speculative, but
cannot be ruled out. All of these factors suggest that the results of this study with
respect to differences in radon-associated risk according to smoking status need to
be evaluated very carefully in other study populations before they are accepted as
proven.

C 6
TABLE Cl
Total number of women in original study,
and number and percentage (%) included in radon study3,
by various risk factors and subject characteristics,
New Jersey radon-female lung cancer case-control study. 1982-1988
(contd)
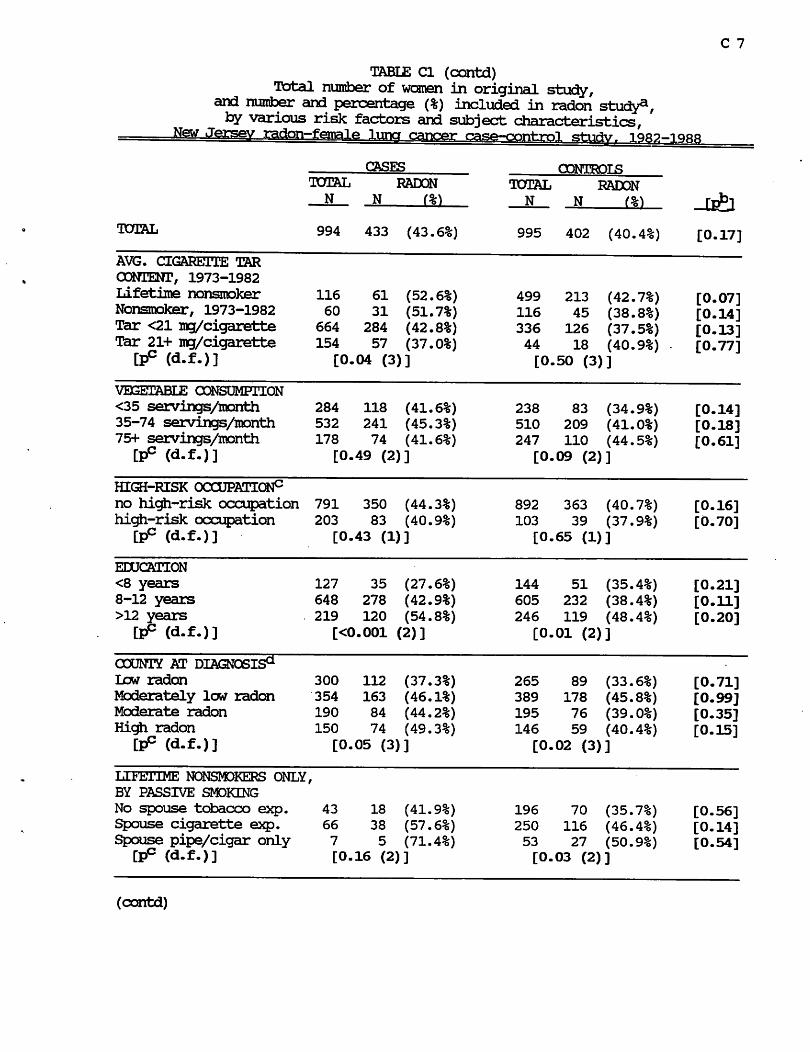
C 7
TABIE Cl (contd)
Total number of women in original study, and number and percentage (%) included in radon study21, by various risk factors and subject characteristics,
New Jersey radon-female luna cancer case-control study. 1982-
CASES CONTROLS
TOTAL RADON
N N (%)
TOTAL 994 433 (43.6%) 995 402 (40.4%) [0.17]
AVG. CIGARETTE TAR "
CONTENT, 1973-1982
Lifetime nonsmoker 116 61 (52.6%) 499 213 (42.7%) [0.07] Nonsmoker, 1973-1982 60 31 (51.7%) 116 45 (38.8%) [0.14]
Tar <21 mg/cigarette 664 284 (42.8%) 336 126 (37.5%) [0.13] Tar 21+ mg/cigarette 154 57 (37.0%) 44 18 (40.9%) - [0.77]
" " (d.f.)] [0.04 (3)] [0.50 (3)]
VEGETABLE CONSUMPTION
<35 servings/month 284 118 (41.6%) 238 83 (34.9%) [0.14] 35-74 servings/month 532 241 (45.3%) 510 209 (41.0%) [0.18] 75+ servings/month 178 74 (41.6%) 247 110 (44.5%) [0.61]
[d.f.)] [0.49 (2)] [0.09 (2)]
(contd)

C 8
TABLE Cl (contd)
a Number of women included in radon study includes those whose index address was tested for radon and those whose index address was an apartment higher than the second floor (see Table 2). Percentage represents number of women included in radon study divided by total number of women in original study.
b p value for Chi-square test (1 degree of freedom, with continuity correction) comparing the percentage of all cases vs. all controls included in the radon
study.
c p value for di-square test (with degrees of freedom noted in parentheses)
comparing the percentage of cases (or controls) included in the radon study, by
subgroups of the various risk factors and subject characteristics.
d Lifetime average number of cigarettes smoked per day.
e Ever employed in any occupational group shown to have a smoking adjusted
risk of 1.5 or greater in the original female lung cancer study. This is
an a posteriori definition, used only for the purpose of adjusting in the radon
analyses for the possible effect of occupational exposure. See text, Appendix
B, for further clarification of this variable.
f County at diagnosis for cases, or county at ascertainment for controls. Low radon counties include include Atlantic, Cape May, Essex, Hudson, and Ocean
counties. Moderately low radon counties include Bergen, Burlington,
Cumberland, Gloucester, Middlesex, and Union counties. Moderate radon counties
include Camden, Mbnmouth, Bassaic, and Salem counties. High radon counties
include Ifcinterdon, Mercer, Morris, Somerset, Sussex, and Warren counties.
Grouping of counties was determined by the percentage of houses with basement
or lower level screening values above 4 pCi/L in the statewide survey conducted
for the New Jersey State Department of Environmental Protection (see Appendix
G).

C 9
TABLE C2
Odds ratiosa for association of lung cancer with various risk factors and subject characteristics and with inclusion in the radon substudy,
for all subjects and by subgroups according to smoking
NewJersevvradon-female luna cancer case-control studv. 1982-1988
SUBGRCUP:
NO. CASES:
NO. OONTROIS:
CIGAREITES/DAY+YEARS QUIT
Lifetime nonsmoker (NS)
< 15 cigarettes/day (IS)
Ex-smoker, quit 10+ years
Ex-smoker, quit 2-9 years
Current smoker, quit 0-1 years
15-24 cigarettes/day (MS)
Ex-smoker, quit 10+ years
Ex-smoker, quit 2-9 years
Current smoker, quit 0-1 years
25+ cigarettes/day (HS)
Ex-smoker, quit 10+ years
Ex-smoker, quit 2-9 years
Current smoker, quit 0-1 years
(contd)
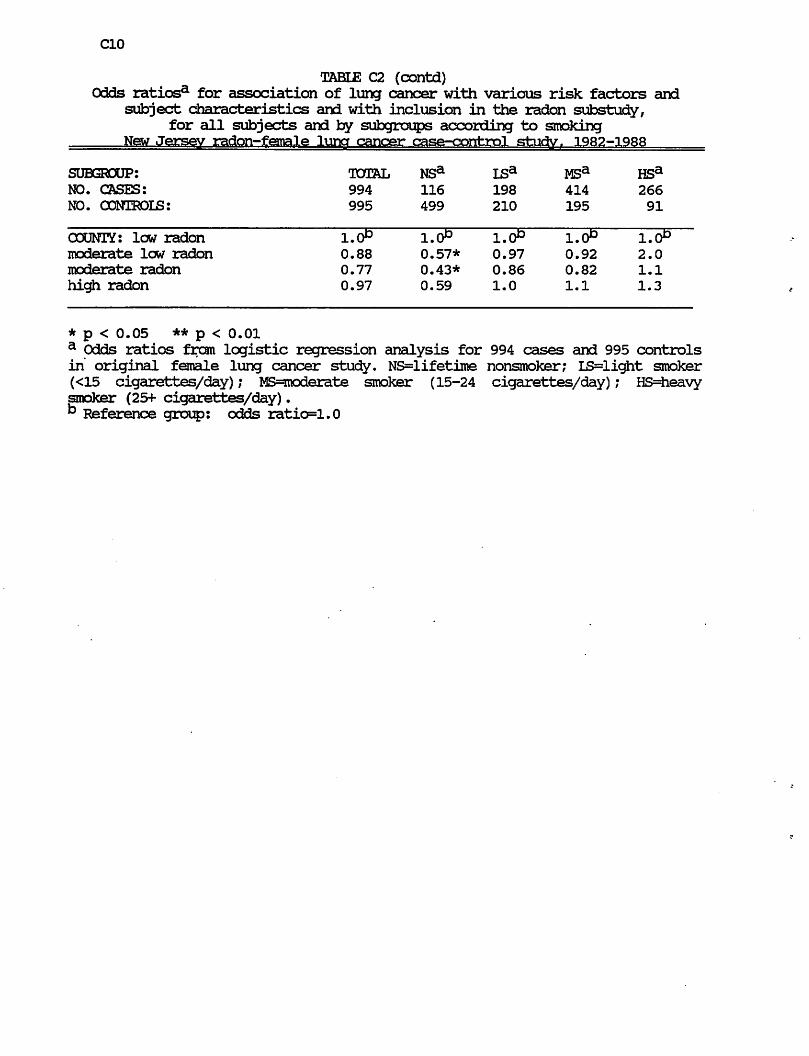
C10
TABIE C2 (contd)
Odds ratiosa for association of lung cancer with various risk factors and subject characteristics and with inclusion in the radon substudy,
for all subjects and by subgroups according to smoking
New Jersey radon-female lung cancer case-control study,. 1982-1988
SUBGROUP:
NO. CASES:
NO. CONTROLS:
OOUNTY: low radon
moderate low radon
moderate radon
high radon
* p < 0.05 ** p < 0.01
a Odds ratios from logistic regression analysis for 994 cases and 995 controls
in original female lung cancer study. NS=lifetime nonsmoker; IS=light smoker
(<15 cigarettes/day); MS=rooderate smoker (15-24 cigarettes/day); HS=heavy
smoker (25+ cigarettes/day).
k Reference group: odds ratio=1.0

TABLE C3
Odds ratiosa for association of lung cancer with various risk factors and subject characteristics,
for all subjects and for subgroups according to smoking, and by inclusion in the radon substudy,
New Jersev radon—female luncr cancer case—control stiidv 1QR9-iqrr
SUBGROUP:
INCLUDED IN RADON STUDY:
NO. CASES:
NO. CONTROLS:
TOTAL
YES
NO
433
561
402
593
NONSM3KER
YES
NO
61
55
213
286
UGHT SMDKER
<15 CIGS/DftY
YES
NO
83
115
90
120
MDD. SMOKER
15-24 CIGS/DftY
YES
NO
178
236
67
128
CIGARETTES/D&Y+YEARS QUIT
Lifetime nonsmoker (NS)
<15 cigarettes/day (15)
Ex-smoker, quit 10+ years
Ex-smoker, quit 2-9 years
Current smoker, quit 0-1 years
15-24 cigarettes/day (MS)
Ex-smoker, quit 10+ years
Ex-smoker, quit 2-9 years
Current smoker, quit 0-1 years
25+ cigarettes/day (HS)
Ex-smoker, quit 10+ years
Ex-smoker, quit 2-9 years
Current smoker, quit 0-1 years
2.9
3.9
2.1
4.0
1.0
1.5++
3.0
6.7
HEAVY SMOKER
25+ CIGS/D&Y
YES
NO
111
155
32
59
6.1
12.3
3.8
21.4
+ p<0.10
++p<0.05
for difference in OR between those included and not included in radon stud/ (contd)
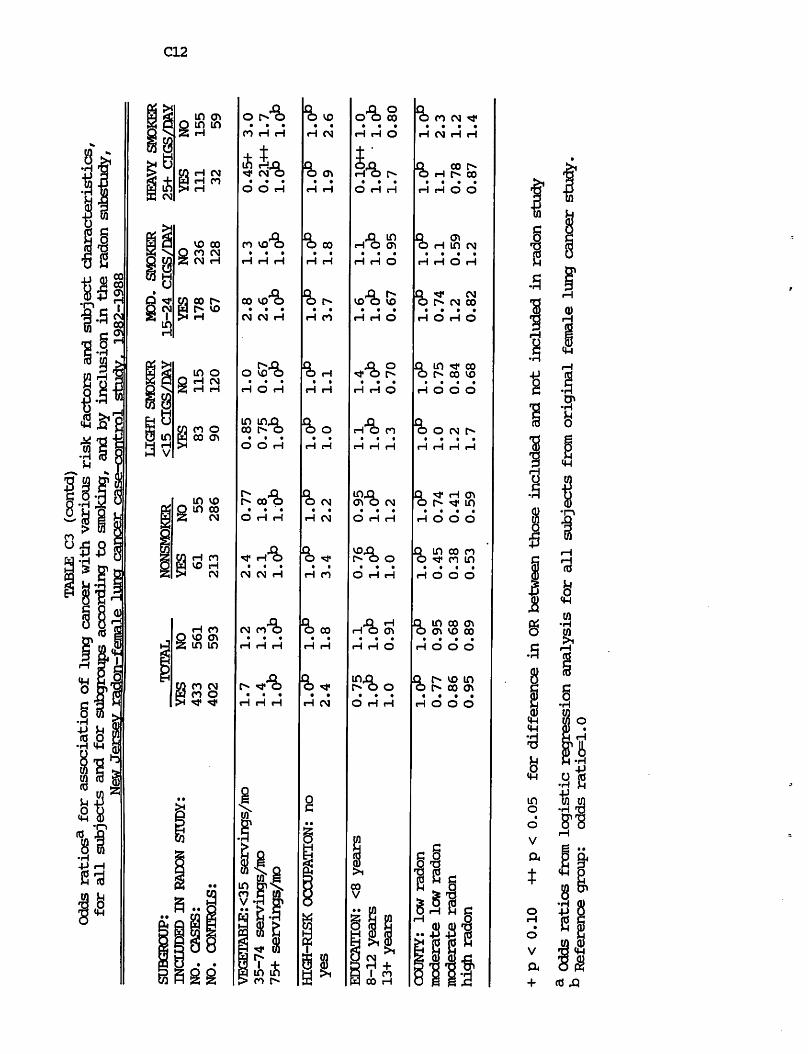
TABLE C3 (contd)
Odds ratiosa for association of lung cancer with various risk factors and subject characteristics,
for all subjects and for subgroups according to smoking, and by inclusion in the radon substudy,
New Jersey radon—-fpuna ie>
luna cancer case-cnrrt-ml
iqro—iqab
+ p<0.10
++p<0.05
for difference in OR between those included and not included in radon stud/
f* Odds ratios from logistic regression analysis for all subjects from original female lung cancer study.
" Reference group:
odds ratio=1.0

C13
TABLE C4
Total number of HEAVY SMOKERS in original study,
and number and percentage (%) included in radon study*,
by various risk factors and subject characteristics, New Jersey radon-female luna cancer case-control study. 1982-1988
CASES
RADON
N
TOTAL 266 111 (41.7%)
TOTAL RADON
N N (%)
91 32 (35.2%) [0.33]
AGE AT DIAGNOSIS
<58 years
58-71 years
72+ years
[pP (d.f.)]
81 27 (33.3%)
142 66 (46.5%)
43 18 (41.9%)
[0.16 (2)]
28 6 (21.4%) [0.35]
49 21 (42.9%) [0.79]
14 5 (35.7%) [0.93]
[0.17 (2)]
RESPONDENT TYPE
Self
Spouse
Other next of kin
[pP (d.f.)]
119 53 (44.5%)
43 17 (39.5%)
104 41 (39.4%)
[0.71 (2)]
28 9 (32.1%) [0.33]
21 5 (23.8%) [0.34]
42 18 (42.9%) [0.84]
[0.30 (2)]
RACE
White
Nonwhite
[pP (d.f.)]
250 109 (43.6%)
16 2 (12.5%)
[0.03 (1)]
85 31 (36.5%) [0.31]
6 1 (16.7%) [0.99]
[0.59 (1)]
TOTAL NO. YEARS SMOKED
<35 years
35+ years
[Pc (d-f.)]
47 16 (34.0%)
219 95 (43.4%)
[0.31 (1)]
36 6 (16.7%) [0.13]
55 26 (47.3%) [0.71]
[0.006 (1)]
NO. YEARS QUIT SMOKING
Quit 0-1 years
Quit 2-9 years
Quit 10+ years
P
235 95 (40.4%)
24 12 (50.0%)
7 4 (57.1%)
[0.47 (2)]
60 25 (41.7%) [0.98]
17 3 (17.7%) [0.07]
14 4 (28.6%) [0.43]
[0.16 (2)]
AVG. CIGARETTE TAR
CONTENT, 1973-1982
Nonsmoker, 1973-1982
Tar <21 irg/cigarette
Tar 21+ mg/cigarette
[pP (d.f.)]
7 4 (57.1%)
205 89 (43.4%)
54 18 (33.3%)
[0.29 (2)]
13 4 (30.8%) [0.50]
70 23 (32.9%) [0.16]
8 5 (62.5%) [0.23]
[0.24 (2)]
(contd)

C14
TABLE C4 (contd)
Total number of HEAVY SM3KERS in original study,
and number and percentage (%) included in radon
by various risk factors and subject characteristics,
New Jersey radon-female lung cancer case-control study. 1982-1988
CASES O0NTBDI5
TOTAL
N
RADON
N
TOTAL 994 433 (43.6%)
RADON
N (%)
995 402 (40.4%) [0.17]
VEGETABLE CONSUMPTION
<35 servings/month
35-74 servings/month
75+ servings/month
[pP (d.f.)]
86 30 (34.9%)
135 62 (45.9%)
45 19 (42.2%)
[0.27 (2)]
23 8 (34.8%) [0.99]
52 22 (42.3%) [0.78]
16 2 (12.5%) [0.07]
[0.09 (2)]
HIGH-RISK OCCUPATION
no high-risk occupation
high-risk occupation
[pc (d.f.)]
204 89 (43.6%)
62 22 (35.5%)
[0.32 (1)]
79 28 (35.4%) [0.26]
12 4 (33.3%) [0.99]
[0.99 (1)]
EDUCATION
<8 years
8-12 years
>12 years
[pP (d.f
30 3 (10.0%)
189 82 (43.4%)
47 26 (55.3%)
[<0.001 (2)]
14 6 (42.9%) [0.03]
60 22 (36.7%) [0.44]
17 4 (23.5%) [0.05]
[0.49 (2)]
COUNTY AT DIAGNOSIS
law radon
Moderately low radon
Moderate radon
High radon
[Pc (d-f-)]
76
93
59
38
32
39
22
18
(42.1%)
(41.9%)
(37.3%)
(47.4%)
[0.81 (3)]
31
22
23
15
8 (25.8%)
9 (40.9%)
9 (39.1%)
6 (40.0%)
[0.17]
[0.99]
[0.99]
[0.86]
[0.61 (3)]
a Number of heavy smokers included in radon study includes those whose index address was tested for radon and those whose index address was an apartment
hi^ier than the second floor (see Table 2). Percentage represents number of
heavy smokers included in radon study divided by total number of heavy smokers
in original study.
b p value for Chi-square test (1 degree of freedom, with continuity correction) comparing the percentage of all cases vs. all controls included in the radon
study.
c p value for Chi-square test (with degrees of freedom noted in parentheses) comparing the percentage of cases (or controls) included in the radon study, by
subgroups of the various risk factors and subject characteristics.

D 1
APPENDIX D
Considerations about Changes in House Construction
One of the basic, underlying assumptions of this study is that the radon
concentrations measured in 1986-1988 in the index addresses are adequate estimates
of the exposures that were incurred by the subjects when they were living in these
houses, particularly for residence in these houses from 1953 to 1978, the presumed
latency period. However, it is possible that changes in construction of the house
have occurred which have fundamentally altered the radon concentrations in the
house. Let us consider two different scenarios:
(1) The house construction has been changed in such a way that the radon
concentrations have been significantly reduced. There were not any houses in this
study which were known to have undergone changes specifically for the purpose of
radon remediation. However, this does not mean that there were no houses with
other structural changes which might have reduced the radon levels in the house.
Nevertheless, at this point in time, there is no way to estimate what the radon
concentration might have been before, given certain structural changes.
(2) The house construction has been changed in such a way that the radon
concentrations have been significantly increased. For example, a basement has
been dug out where none existed previously, or significant cracks have developed in
the foundation. Again, at this point in time, there is no way to estimate what the
radon concentration might have been before, given this structural change.
The final problem in considering changes in construction is that the
information which has been collected for the study houses is not complete. This is
particularly true for houses in which the current resident was not the study subject
or a relative. The new resident was often not aware of any structural changes
which might have occurred.

D2
Given all of the above, it is still important to determine the magnitude of the
potential problem, particularly for the 36 houses with living area measurements at
2+ pCi/L which represent the driving force behind these results. Therefore, Table
HI presents key characteristics with respect to construction changes for these 36
houses, in addition to the residence period reported for the subject and the
residence period of the current occupant. These changes have not yet been taken
into account in the analyses. One focus of the additional analyses planned for the
final study report will be whether the cumulative exposure estimate can be modified,
based on this limited information on construction changes.
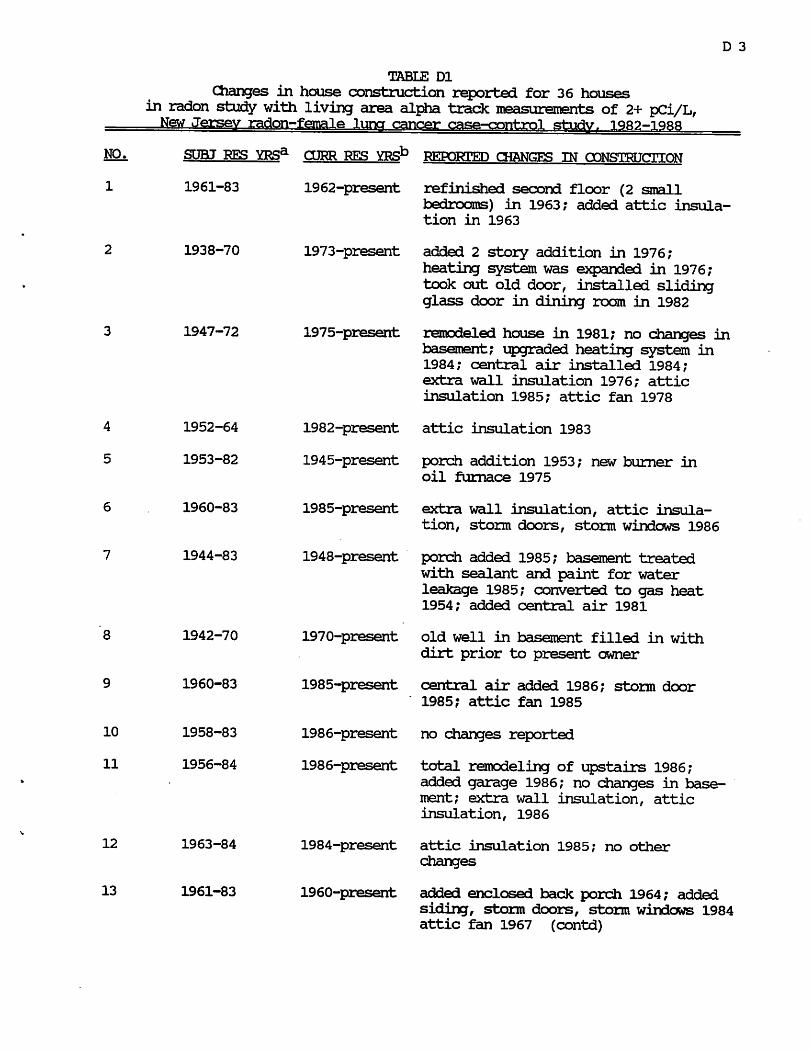
D 3
8
10
11
12
13
1947-72
1942-70
1960-83
1958-83
1956-84
1963-84
1961-83
1975-present
TABLE Dl
Changes in house construction reported for 36 houses in radon study with living area alpha track measurements of 2+ pCi/L, New Jersey radon-female luna cancer case-control study. 1982-1988
REPORTED CHANGES IN CONSTRUCTION
refinished second floor (2 small
bedrooms) in 1963; added attic insula
tion in 1963
added 2 story addition in 1976;
heating system was expanded in 1976;
took out old door, installed sliding
glass door in dining rcon in 1982
remodeled house in 1981; no changes in
basement; upgraded heating system in
1984; central air installed 1984;
extra wall insulation 1976; attic
insulation 1985; attic fan 1978
attic insulation 1983
porch addition 1953; new burner in
oil furnace 1975
extra wall insulation, attic insula
tion, storm doors, storm windows 1986
porch added 1985; basement treated
with sealant and paint for water
leakage 1985; converted to gas heat
1954; added central air 1981
old well in basement filled in with
dirt prior to present owner
central air added 1986; storm door
1985? attic fan 1985
no changes reported
total remodeling of upstairs 1986;
added garage 1986; no changes in base
ment; extra wall insulation, attic
insulation, 1986
attic insulation 1985; no other
changes
added enclosed back porch 1964; added
siding, storm doors, storm windows 1984 attic fan 1967 (contd)
1970-present
1985-present
1986-present
1986-present
1984-present
1960-present

D 4
NO,
14
26
27
TABLE Dl (contd)
Changes in house construction reported for 36 houses
in radon study with living area alpha track measurements of 2+ pCi/Lf
New Jersey radon-female lung cancer case-control study. 1982-1988
SUBJ RES YRSa
1953-83
1950-83
1950-84
O3RR RES YRSb
1953-present
(contd)
1951-present
1952-present
KEFOKJL'KL) CHANGES IN CONSTRUCTION
replaced oil furnace 1980; extra wall
insulation, attic insulation, storm
doors, attic fan 1953; storm windows
1982
building addition 1985; no changes in
basement; no other reported changes
no reported changes
storm door 1984
replaced furnace 1985; attic insula
tion 1985; replaced storm door and
windows 1962
converted from oil to gas furnace,
1982
no reported changes
installed central air 1980; installed
new thermopane windows and doors 1984
attic insulation 1982; attic fan 1980
siding, storm doors, storm windows 1963
added French drain 1984; extra wall
insulation 1985; storm doors, storm
windows 1983; siding 1986
coal furnace converted to gas 1961;
storm doors, storm windows 1952;
siding 1942
addition 1985; remodeled old section
of house 1985; no changes in basement;
crawl space added with addition, 1985;
changed heating system from oil
(forced air) to gas (hot water), 1985
extra wall insulation, attic insulation
1985
no reported changes
siding 1984; no other reported changes
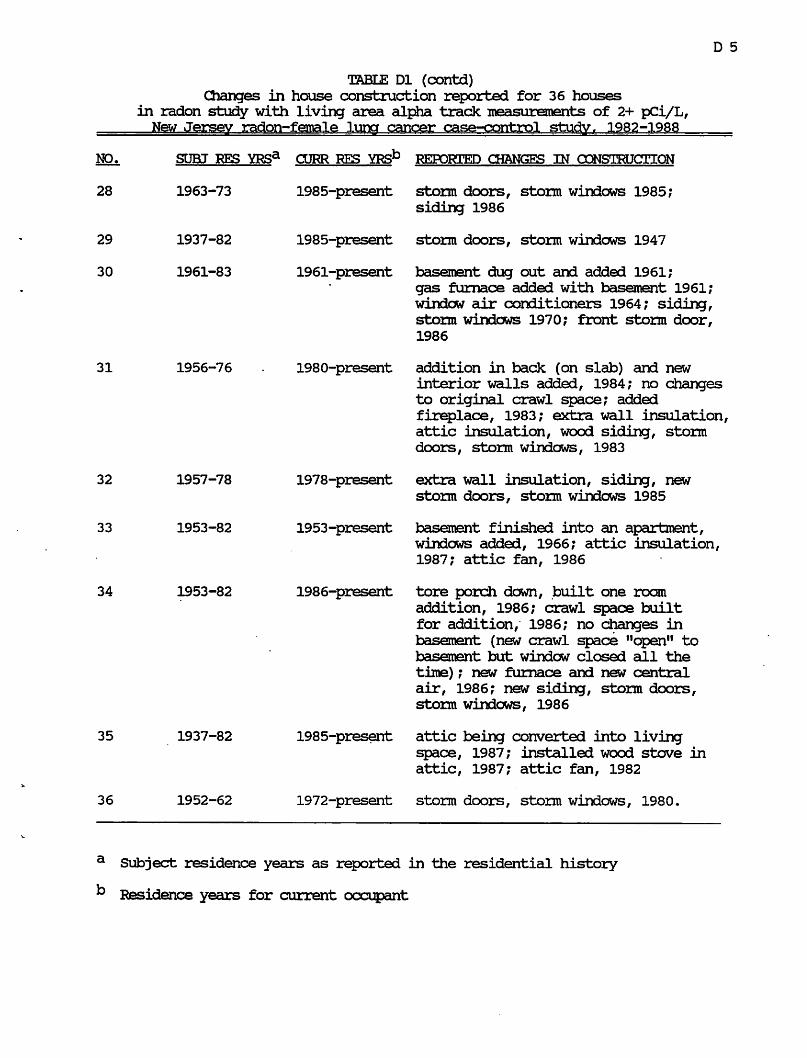
D 5
31
32
33
34
35
36
1956-76
1957-78
1953-82
1953-82
1937-82
1952-62
1980-present
TABLE Dl (contd)
Changes in house construction reported for 36 houses
in radon study with living area alpha track measurements of 2+ pCi/L,
New Jersey radon-female lung cancer case-control studyr 1982-1988
NO. SUBJ RES YRSa CURR RES YRSb REPORTED CHANGES IN CONSTRUCTION
storm doors, storm windows 1985;
siding 1986
storm doors, storm windows 1947
basement dug out and added 1961;
gas furnace added with basement 1961;
window air conditioners 1964; siding,
storm windows 1970; front storm door,
1986
addition in back (on slab) and new
interior walls added, 1984; no changes
to original crawl space; added
fireplace, 1983; extra wall insulation,
attic insulation, wood siding, storm
doors, storm windows, 1983
extra wall insulation, siding, new
storm doors, storm windows 1985
basement finished into an apartment,
windows added, 1966; attic insulation,
1987; attic fan, 1986
tore porch down, built one roam
addition, 1986; crawl space built
for addition, 1986; no changes in
basement (new crawl space "open" to
basement but window closed all the
time); new furnace and new central
air, 1986; new siding, storm doors,
storm windows, 1986
attic being converted into living
space, 1987; installed wood stove in
attic, 1987; attic fan, 1982
1978-present
1953-present
1986-present
1985-present
1972-present storm doors, storm windows, 1980.
a Subject residence years as reported in the residential history
b Residence years for current occupant

E 1
APPENDIX E
Radon Measurement Methods
Charcoal canister measurements
A cylindrical metal canister about 4 inches in diameter and 3/4 inches in
height is filled with 100 grams of activated carbon. Before sampling, the detector
is purged of radon gas and water by baking for several hours, and then sealed with
a metal cover and tape. The canister is weighed before deployment. At the
sampling site, the tape and metal cover are removed, and the open side of the
canister is exposed to the air for four days. During this period, radon in air
passively diffuses into the canister and is adsorbed onto the carbon. During the
decay of the radon gas, its decay product particles remain adsorbed. After the
sampling period, the detector is closed, taped again, and then mailed to the NJDEP
laboratory for counting.
Assay for radon gas concentration in the sampled air is accomplished in the
laboratory by counting the gamma-ray activity of the specific radon decay
products, lead-214 and bismuth-214, with a sodium iodide detector. Absorption of
water by the charcoal (and loss of adsorption capability for radon) is measured by
weighing the canister again and correcting for the water content.
The charcoal canister is a passive, integrating detector which depends only
upon air diffusion. The method is not sensitive to the precise length of time that
the detector was exposed. Instead, it yields an average radon concentration for
approximately the last two days of exposure. The minimum detectable concentration
(MDC) and precision of the detector are also very sensitive to the elapse of time
after the canister is closed and to the amount of radon adsorbed. After more than
two half-lives of radon-222 (two times 3.8 days), the MDC increases markedly. It
often took up to a week from the midpoint of sampling for the mailed canisters to

E 2
reach the lab. Typical MDCs for this study were 0.6-0.9 pCi/L. Every effort was
made to repeat canister measurements if the MDCs were greater than 1.0 pCi/L.
The charcoal canister measurement component of this study included quality
control checks routinely utilized by the NJDEP laboratory. This includes
processing of blanks, known calibration standards, and unknowns provided by the
US Environmental Protection Agency. Of the canisters reported for this study, ten
percent were selected at random and recounted on another detector. Any result
discrepant by more than +_ 1.96 standard deviations caused the laboratory personnel
to recaliabrate the counting instrumentation until the specified level of agreement
was achieved.
Aloha track detector measurements
The alpha track detector consists of a small cylindrical plastic cup, about one
inch in diameter. The method is based on passive diffusion. The open top of the
cup is covered with a membrane which is permeable to radon gas but impermeable
to radon decay particles. Consequently, only the radon gas entering the open side
of the cup (and the particles resulting from the decay of the gas inside the cup)
are assayed with this method. The . radon decay products in the room air are not
assayed. Inside the cup is a plastic (acrylic) film onto which alpha particles
resulting from the decay of the radon gas produce submicroscopic "tracks" when
they impact. Etching this film with a caustic solution accentuates the tracks,
enabling them to be counted visually. The number of tracks within a specific area
of the film are proportional to the radon concentration in air multiplied by the
precise length of exposure. Sensitivity depends both upon the area of the alpha-
sensitive film which is counted and the time that the detector has been exposed.
After the exposure period is completed, the detector is enclosed in an air-tight
aluminum pouch (or, as in this study, in several layers of aluminum foil) and mailed
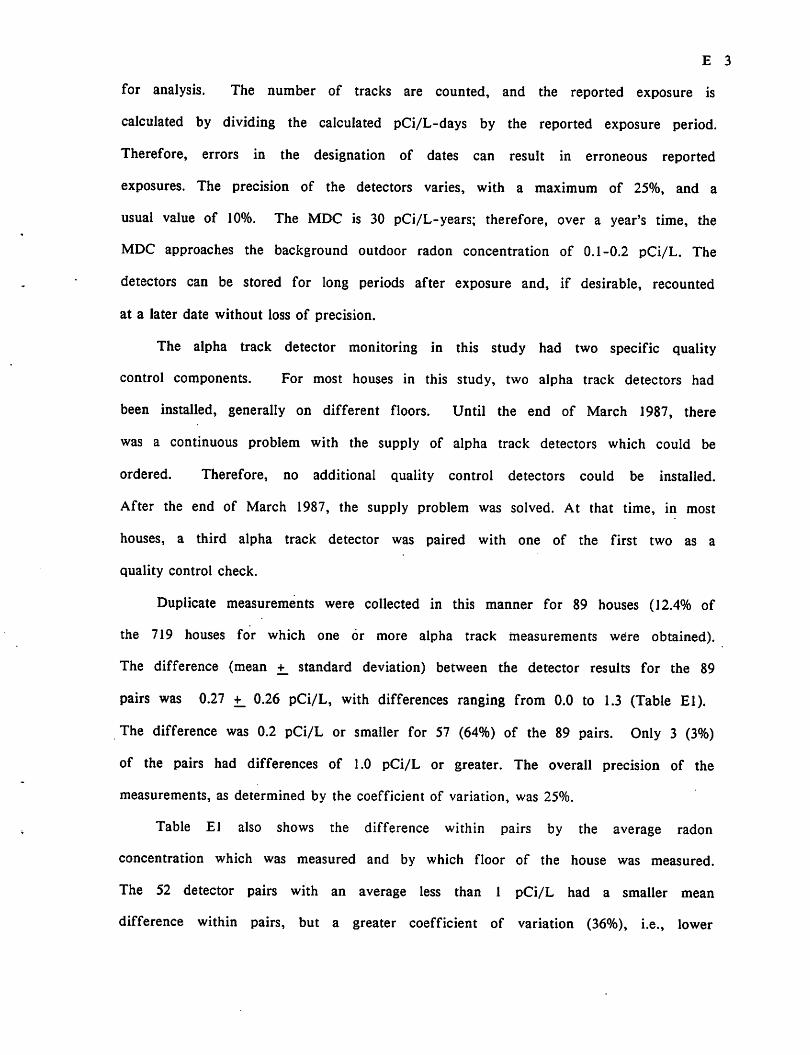
E 3
for analysis. The number of tracks are counted, and the reported exposure is
calculated by dividing the calculated pCi/L-days by the reported exposure period.
Therefore, errors in the designation of dates can result in erroneous reported
exposures. The precision of the detectors varies, with a maximum of 25%, and a
usual value of 10%. The MDC is 30 pCi/L-years; therefore, over a year's time, the
MDC approaches the background outdoor radon concentration of 0.1-0.2 pCi/L. The
detectors can be stored for long periods after exposure and, if desirable, recounted
at a later date without loss of precision.
The alpha track detector monitoring in this study had two specific quality
control components. For most houses in this study, two alpha track detectors had
been installed, generally on different floors. Until the end of March 1987, there
was a continuous problem with the supply of alpha track detectors which could be
ordered. Therefore, no additional quality control detectors could be installed.
After the end of March 1987, the supply problem was solved. At that time, in most
houses, a third alpha track detector was paired with one of the first two as a
quality control check.
Duplicate measurements were collected in this manner for 89 houses (12.4% of
the 719 houses for which one or more alpha track measurements were obtained).
The difference (mean +_ standard deviation) between the detector results for the 89
pairs was 0.27 +_ 0.26 pCi/L, with differences ranging from 0.0 to 1.3 (Table El).
The difference was 0.2 pCi/L or smaller for 57 (64%) of the 89 pairs. Only 3 (3%)
of the pairs had differences of 1.0 pCi/L or greater. The overall precision of the
measurements, as determined by the coefficient of variation, was 25%.
Table El also shows the difference within pairs by the average radon
concentration which was measured and by which floor of the house was measured.
The 52 detector pairs with an average less than 1 pCi/L had a smaller mean
difference within pairs, but a greater coefficient of variation (36%), i.e., lower

E 4
precision. The 10 detector pairs with an average 2-3.9 pCi/L had a coefficient of
variation of 12%. The 49 detector pairs in the basement had a larger mean
difference within pairs, and a smaller coefficient of variation (21%). The 17 first
floor pairs, with a mean exposure of 0.70 pCi/L, had a coefficient of variation of
24%. The 23 second floor pairs, with a mean exposure of 0.56 pCi/L, had a
coefficient of variation of 38%.
As an additional quality control check, the NJDEP made arrangements with
Andreas George of the Environmental Measurements Laboratory (EML), US
Department of Energy, to expose 40 alpha track detectors to known concentrations
of radon. These "spiked" detectors and a sample of "blank" (unexposed) detectors
were then labeled, packaged, and shipped to Terradex in such a way as to resemble
the other detectors submitted with each batch.
Table E2 shows the results for these detectors, according to the level of
exposure (in pCi/L-days; and in pCi/L, if the detector had been exposed for 365
days, as were the majority of detectors in this study). The maximum level
reported for any of the blank detectors was 129 pCi/L-days, equivalent to 0.35
pCi/L for a one year exposure period.
The absolute value of the difference between the reported pCi/L-days and the
"true" pCi/L-days was calculated; the accuracy of the alpha track detector method
(the average difference divided by the "true" pCi/L) ranged from 84% for the lowest
known exposure level (0.5 pCi/L) to 9-28% for the highest known exposure levels
(1.2 to 2.1 pCi/L). One of the detectors which had been exposed to 168 pCi/L-days
(0.5 pCi/L) was reported as 636 pCi/L (1.7 pCi/L), even after a repeat reading. This
was by far the largest discrepancy observed. The calculated accuracy of this group
of detectors without this one apparent outlier was 36%. These results still suggest
that there is much more uncertainty in readings below 1 pCi/L. However, the extent
of error is not likely to result in a reading greater than 2 pCi/L.

E 5
The precision of the alpha track detector reading was also assessed with
these spiked detectors. The standard deviation for each exposure level group,
divided by the mean reported exposure, yielded the coefficient of variation. This
statistic was 131% for the blank detectors, 65% for the lowest exposed level (0.5
pCi/L) [29% excluding the outlier], and then ranged from 6% to 32% for all other
exposure levels.
These quality control results suggest that, given the low levels of exposure
prevalent in this study, the precision of the measurements may not be sufficient to
analyze all of the data on a continuous scale. Rather, a categorical analysis, based
on low, medium, and high exposure (e.g., <1, 1-1.9, 2-3.9, 4+) may be preferable.
Therefore, the continuous variable analyses for exposure should be interpreted
cautiously. On the other hand, cumulative exposure, which includes the additional
component of residence duration, may be less sensitive to the imprecision of the
measurement, but also less sensitive to variation in the true values. This is the
justification for presenting both the results of continuous and categorical analyses
in this report.
Length of aloha track detector installation.
Table E3 shows the distribution of alpha track detector installation times, by
case-control status, for the 664 living area alpha track detectors and for the 55
basement alpha track detectors which were used to estimate living area radon
concentrations. Only 27 of the 664 living area alpha track detectors (4.1%) and 2
of the 55 basement alpha track detectors (3.6%) were installed for less than 11
months (48 weeks). This included one case alpha track detector with a measurement
of 4.9 pCi/L which was installed for 15 weeks (March 10 - June 26), and one case
alpha track detector with a measurement of 2.4 pCi/L which was installed for 22

E6
weeks (August 31 - January 29). None of the control detectors with measurements
above 2.0 pCi/L were installed for less than 11 months.
Relationship between canister and aloha track measurements
One of the strengths of this study is the fact that both canister and alpha
track measurements of radon were obtained. If only alpha track measurements had
been conducted, the low levels of reported exposures might have seemed unlikely
and the entire study results might have been compromised. However, because the
alpha track detector results were consistent with the canister measurements, both
on an individual and on a group basis, the study conclusions are strengthened.
Table E4 shows the geometric means for basement canisters, living area
canisters, basement alpha track detectors, and living area alpha track detectors, and
the correlations between pairs of measurements. The top part, Table E4a, shows
these statistics for the 516 houses with all four types of measurements, and all
paired combinations. The bottom part, Table E4b, shows these statistics for all 796
houses with any measurements, with the number for each type of paired combination
shown along with the statistics. The correlation between measurements was good,
given the different time periods for the canister and alpha track measurements, and
given the loss of precision attributable to the greater number of low measurements.
Table E4b also shows that the basement canister results were slightly higher in
those houses for which living area alpha track measurements were obtained; i.e.,
detector retrieval was much poorer for those houses with very low canister results.
Ratio of lower level (basement) canister to first floor aloha track measurements.
Initially it seemed inconsistent that 13.3 percent of the lower floor (usually
basement) canister measurements in this study had results over 4 pCi/L, compared

E 7
to only 1.0 percent of the living area alpha track measurements. The relationship
of the lower floor canister measurements to the living area alpha track
measurements, at increasing radon concentrations (as measured by the lower floor
canister), is shown in Table E5. The results are shown for all lower floor canisters,
and for all basement canisters, for which there were living area alpha track
measurements. The results of a similar analysis also taking into account the type
of heat circulation (forced air vs. hot water/electric) are also shown in Table E5.
The relationship of the living area alpha track measurement to the lower
floor or basement canister measurement was markedly non-linear. Those houses
with a higher concentration of radon measured for four days during the heating
season on the lower floor had a proportionally lower concentration of radon as
measured by a year-round alpha track detector in the living area. This difference
was less pronounced for forced air houses than for hot water/electric houses;
however, the non-linearity was present in both groups. This non-linearity may be
due, in part, to the relatively greater imprecision at low radon concentrations for
both the canister and the alpha track detectors.
The observation that the ratio plateaus at levels greater than previously
speculated may be related to the manner in which previous estimates of the ratio of
screening measurements to annual averages were calculated. Many of these former
ratios were actually based on the average of two screening measurements, one in
the heating season, and one in the summer (see, for example, Nero et al., 1986).
This may result in an artifactually high estimate of the "annual average." Also,
reported ratios were often the ratio of the average basement canister to the
average "annual average", rather than the average of the ratio calculated for each
individual house.
Data from the NJDEP study (see Appendix G), which included a sample of
about 200 heating season alpha track detectors installed for 3-5 months, also

£ 8
suggest that the ratio of heating season basement canister results to living area
alpha track results increase with increasing basement radon levels (NJDEP, 1989).
These results, together with the results in Table E5, reiterate the necessity for
screening measurements to be followed up by some type of confirmatory
measurement before remediation decisions are made. If the screening measurement
is between 4 and 20 pCi/L, it probably should be followed by a measurement of the
annual average radon concentration in areas of the house where residents spend
considerable amounts of time, although short-term measurements in the living area
may also be useful. These recommendations are actually consistent with existing
USEPA and NJDEP guidelines, but are not necessarily understood by the public.
If the results of the analyses comparing screening measurements to year-round
average living area radon concentrations are confirmed by other studies, they also
suggest that national surveys based only on screening results may overestimate the
radon exposures of the general population.

E 9
TABLE El
Analysis of results of paired alpha track detectors, by radon concentration, and by house level,
a Average radon concentration for pairs of alpha track detectors
b Average of difference between members of pairs
c Coefficient of variation, standard deviation of the difference divided by the mean of the measured radon concentrations

E10
TABLE E2
Difference between radon concentration determinations (pCi/L-days)
and known concentration, for laboratory-exposed and
blank alpha track detectors, by known radon concentration,
New Jersey radon-female lung cancer case-control study. 1982-1988
a pCi/I/-days=days of exposure in chamber X radon exposure concentration in chamber. Number in parentheses (pCi/L) is hypothetical exposure concentration
if monitor with the same reported number of tracks had been exposed for 365
days.
b coefficient of variation, standard deviation divided by the mean.
c % difference (accuracy) = mean of absolute differences for each group, divided by known radon concentration (pCi/D-days)
d Three of the 17 blanks in this group were prepared at the Environmental Measurements laboratory. The average reported measurement was 66.1 pCi/L-
years, compared to an expected value of 0.0. The coefficient of variation for
these three was 0.26. The remaining 14 blanks detectors were opened, labeled,
and then repackaged for shipment at the New Jersey State Department of Health.
The average reported measurement was 20.2 pCi/Ir-years, compared to an expected
value of 0.0. The coefficient of variation for these 14 was 1.76.
e This group contained one extreme outlier (reported value of 640.5 pCi/L-years. The accuracy and precision, respectively, of the other 4 measurements
in this group was 29% and 0.36.

Ell
TABLE E3
Deration of exposure of alpha track detectors in index residences for living area alpha tracks (A), and basement installations (B),
by case-control status,
New Jersey radon—female luncr cancer* t*asp-mnhr»l crt-uHv iqqo-iqbq
a Living area measurement estimated from basement measurement for these 55 houses, see Appendix J.
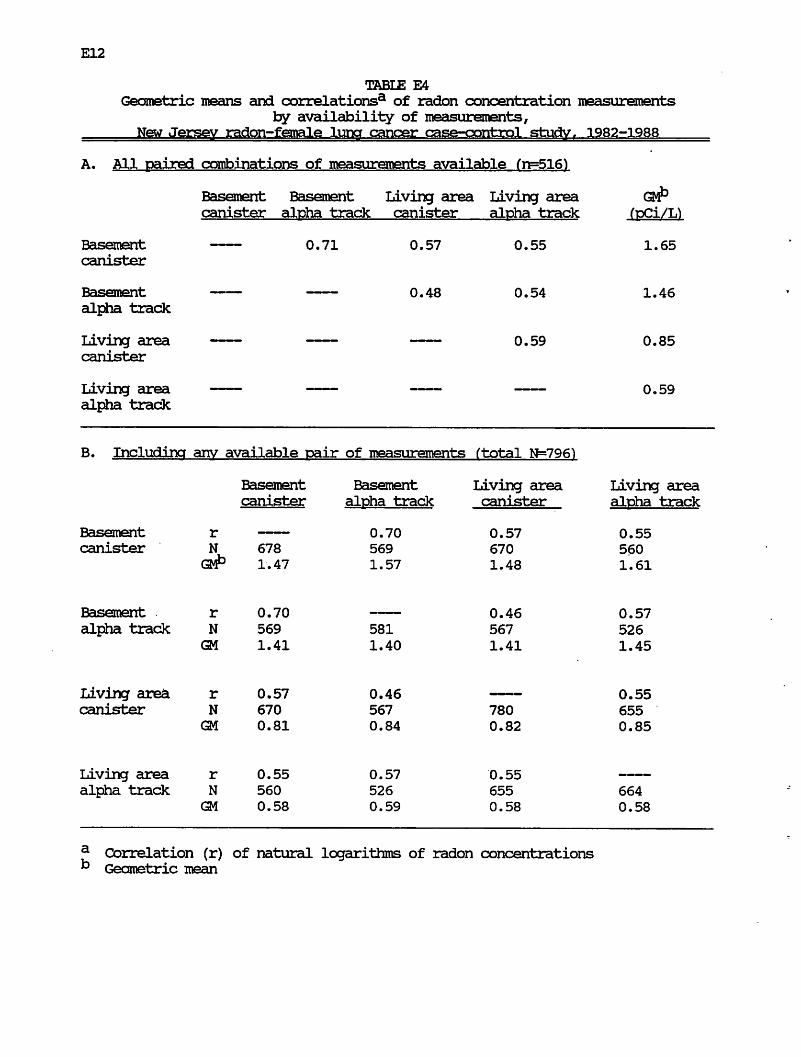
E12
table: E4
Geometric means and correlations3 of radon concentration measurements by availability of measurements,
a Correlation (r) of natural logarithms of radon concentrations k Geometric mean
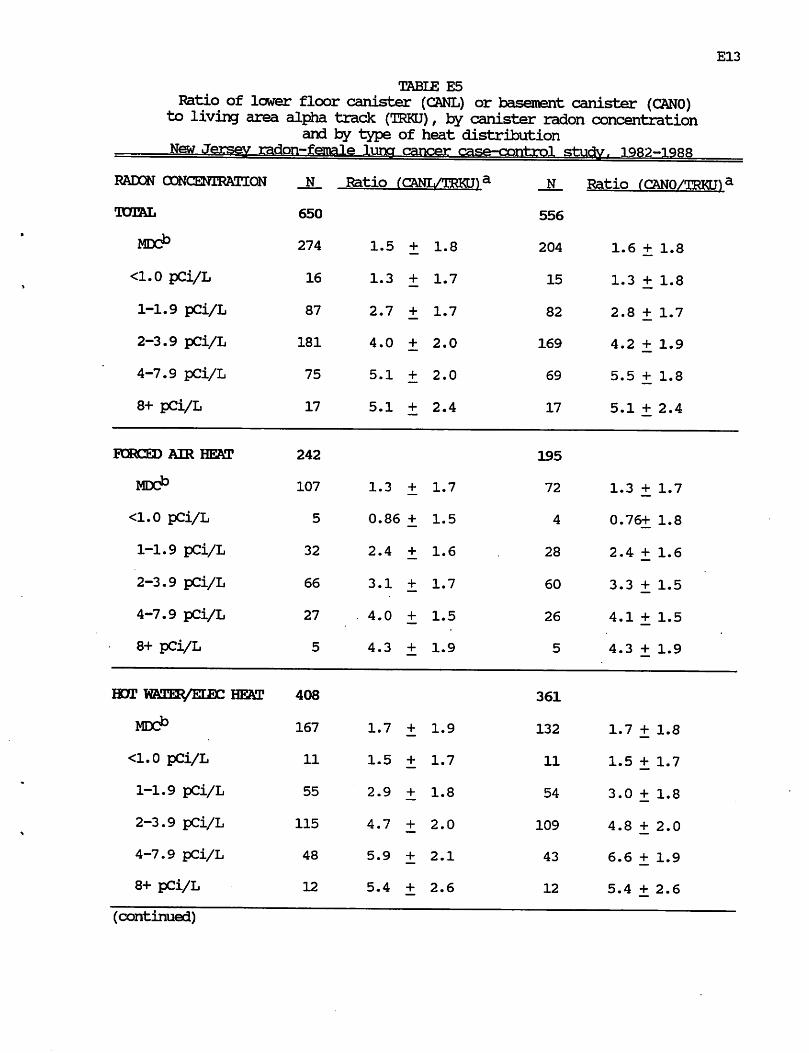
E13
TABLE E5
Ratio of lower floor canister (CANL) or basement canister (CANO) to living area alpha track (TRKU), by canister radon concentration
and by type of heat distribution
E14
a Hiis table includes all houses with actual living area alpha track
measurements and excludes any houses for which living area alpha track results
were estimated. This also excludes houses for which only alpha track
measurements and no canister measurements were conducted. Ratio statistic
shown is: geometric mean of ratios + geometric standard deviation.
b MX>miiiijnum detectable concentration. For these canisters, the value of CANL or CftNO used to calculate the ratio was assumed to equal the MDC.

F 1
APPENDIX F
Validation of Residential Histories
Tax office records were searched in order to validate the information provided
by the respondent with respect to occupancy of the index residence. There are
several limitations to this approach. Tax office records list the owner(s) of record,
and there is no guarantee that the owner of a building and the occupants were
identical. There is also no reason to expect perfect agreement between the dates of
ownership and the dates of residence. Nevertheless, it is important that there be
some degree of consistency between the tax office records and the reported
residential histories. Also, any major inconsistencies between the two sources of
information were probed and many were resolved.
Table Fl shows a tabulation of validation data for the 796 subjects (411
cases, 385 controls) whose index residence was tested for radon in this study. No
validation was attempted for subjects whose residence was an apartment higher than
the second floor. No validation was possible for 98 subjects (12.3%), because there
was no record of ownership by the subject or the subject's family. Validation was
not complete for 84 subjects (10.6%), but tax office records confirmed ownership by
the subject or her family and were consistent with the residence dates reported for
the subject. Tax office records (date of purchase) and reported residential histories
(year of first residence) were within +_ 1 year for 457 subjects (57.4%), within +_ 3
years for 552 subjects (69.3%), and within +_ 5 years for 579 subjects (72.7%).
Only 35 subjects (4.4%) had differences which were greater than +_ 5 years.
Attempts were made to recontact these subjects or their respondents to probe for
further information regarding these discrepancies. Nineteen of the subjects or
respondents indicated that the tax office dates were the correct period of residence
for the subject; recorded residential history dates were changed accordingly. For
eight of these subjects (5 cases, 3 controls), the corrected dates were such that the

F2
subject no longer met the original residence criterion for the study (assuming a 10
year period between relevant radon exposure and diagnosis of lung cancer). Because
the duration of residence, minus only a 5 year period, ranged from 8-14 years, the
decision was made to leave these subjects in the study. However, they were
excluded from the analyses by radon exposure shown in Appendix K, which also
excluded subjects with estimated year-round living area radon concentrations.

F 3
TABLE Fl
Distribution of New Jersey vonen included in radon study by case-control status, and by difference between tax office dates and
reported residential history dates, New Jersey radon—female luna cancer case—rmrrl-ml srhirtv iqqo—iqqq
No. of
cases (%)
No. of
controls
No validation possible a
Validation not completely possible, but dates plausible b
Difference in dates c
>-5 years
-4, -5 years
-3, -2 years
within + 1 year
+2, +3 years
+4, +5 years
>+5 years
Discrepancy in dates >+ 5 years; tax office
dates confirmed by respondent; residential
history dates changed a
53 (12.9%)
47 (11.4%)
7 (1.7%)
10 (2.4%)
32 (7.8%)
219 (53.3%)
22 (5.4%)
7 (1.7%)
2 (0.5%)
12 (2.9%)
45 (11.7%)
37 (9.6%)
5 (1.3%)
9 (2.3%)
25 (6.5%)
238 (61.
16 (4.2%)
1 (0.3%)
2 (0.5%)
7 (1.8%)
TUIALe 411 385
j* No record of ownership by the subject or by the subject's family. " Tax office dates indicated that subject's family owned the residence for a longer period of time than that reported as the residence period for the subject. Also includes a few houses for which available tax office records only covered a portion of the reported residential history years.
c Year of purchase by subject or family (minus) reported year of first residence by subject. Negative difference in dates indicates that tax office date is later than residential history date. Positive difference in dates indicates that tax office date is earlier than residential history date.
Attempts were made to recontact respondents if there was a major
inconsistency between the tax office dates and the residential history dates. For these 19 subjects, the respondents indicated that the tax office dates were the correct period of residence for the subject.
e No attempt made to validate residential histories for 39 subjects (22 cases, 17 controls) whose index residence was an apartment above the second floor.

G 1
APPENDIX G
Comparison with Statewide Radon Survey
The New Jersey Department of Environmental Protection (NJDEP) has
conducted a geographically stratified sample of homes throughout New Jersey,
weighted towards areas suspected of high radon potential (NJDEP, 1989).
Measurements of radon concentrations were made using charcoal canisters in the
basement or the lowest floor of 5,727 homes. Table Gl shows the distribution of
these homes, by county, and the percentage with canister results of 4 pCi/L or
higher, and 20 pCi/L or higher. The table also shows the results of comparable
measurements from 788 homes in this case-control study (8 of the 796 homes only
had alpha-track detector measurements).
Altogether, 1862 (32.5%) of the houses tested in the NJDEP study had lower
floor canister measurements of 4 pCi/L or higher, compared to 105 (13.3%) of the
houses tested in the case-control study. Furthermore, 263 (4.6%) of the houses
tested in the NJDEP study had lower floor canister measurements of 20 pCi/L or
higher, compared to 1 (0.1%) of the houses tested in the case-control study. These
differences must be considered in the context of differences in the sampling
procedures between the two studies.
The NJDEP study was a geographically stratified sample, while the case-
control study was originally a population based sample. When the county-specific
percentages for the two surveys were weighted by the county populations (1986
population estimates, New Jersey State Department of Labor), the percentages above
4 pCi/L were 14.0% for the NJDEP study and 13.7% for the case-control study. The
population weighted average for the NJDEP study was further reduced, to 13.4%,
when municipality specific percentages above 4 pCi/L and municipality specific
populations were used in the calculation for Warren, Hunterdon, Sussex, Morris, and
Somerset counties (the five counties with the greatest number of homes tested in

G2
difference in the percentage of houses with canister results above 4 pCi/L in the
two studies. For example, counties with the greatest percentage of high results in
the NJDEP study (Warren, Sussex, Hunterdon, Morris, Somerset, Mercer) also tend
to have high results in the case-control study. Counties with the lowest percentage
of high results in the NJDEP study (Atlantic, Hudson, Essex, Ocean, Union, Cape
May) also tend to have low results in the case-control study.
However, even adjusting by county population did not completely eliminate the
differences between the two studies in the percentage of houses with canister
results above 20 pCi/L. When the county-specific percentages for the two surveys
were weighted by the county poopulations, the percentages at 20+ pCi/L were 1.6%
for the NJDEP study, and 0.1% for the case-control study. After adjusting by
county, there was a highly significant difference in the percentage with canister
results of 4-19 pCi/L and 20+ pCi/L between the two studies.
There are several possible explanations for these observed differences. Again,
the differences in the sampling procedures for the two studies must be taken into
account. The geographic sampling for the NJDEP study resulted in the sampled
. houses being fairly uniformly distributed throughout rural areas, with relatively
little sampling in the urban areas which represent much of the population.
Preliminary analysis of the NJDEP data showed that there were distinct urban-rural
gradients in radon concentrations (NJDEP, 1989). These differences persisted, even
within subgroups defined by the six geologic provinces (ranked by decreasing radon
concentrations: Highlands, Valley and Ridge, Southern Piedmont, Inner Coastal
Plain, Northern Piedmont, Outer Coastal Plain). For example, within the Highlands
(including parts of Somerset, Warren, Hunterdon, Sussex, Morris, Passaic and Bergen
counties), the 1121 rural detached houses tested had an arithmetic mean radon level
(+_ standard deviation) of 9.2+_17.8 pCi/L; the 283 suburban detached houses tested
had a mean of 6.6+_8.8 pCi/L; the 12 urban detached houses tested had a mean of

G 3
had a mean of 6.6+_8.8 pCi/L; the 12 urban detached houses tested had a mean of
5.3+_4.4. Within the Southern Piedmont (including parts of Hunterdon, Mercer,
Morris, Somerset, Middlesex, and Union counties), the 1052 rural detached houses
tested had a mean of 5.6+J0.3 pCi/L; the 459 suburban detached houses tested had a
mean of 3.9+J7.0 pCi/L; the 30 urban detached houses tested had a mean of 2.3+_2.2
pCi/L.
Preliminary data from the NJDEP study also showed differences in the level
of radon measured in houses according to the age of the house. The 1077 houses
which were up to 10 years old had an arithmetic mean radon level of 6.8+J2.7
pCi/L. The 2851 houses which were 11-40 years old had a mean radon level of
5.1+_10.9 pCi/L. The 955 houses which were 41-90 years old had a mean radon
level which was 3.8+J7.7 pCi/L. The 722 houses which were 91+ years old had a
mean radon level of 5.7+_8.6 pCi/L. These differences according to house age
persisted within geologic provinces for rural houses, and to a certain extent for
suburban houses.
In the case-control study, the residence criterion necessitated that every
house had to be at least 24 years old at the time of measurement in 1986-1987.
Information on house age was obtained for 771 of the residences included in the
case-control study. Of these 288 (37.4%) were from 22-40 years old, 421 (54.6%)
were from 41-90 years old, and 62 (8.0%) were 91+ years old. Lower level canister
results were available for most of these houses. The geometric mean (+_ geometric
standard deviation) was 1.43 +_ 2.48 for the 285 houses from 22-40 years old, 1.34 +_
2.44 for the 420 houses from 41-90 years old, and 1.30 +_ 2.72 for the 60 houses
which were 91+ years old.
Conclusions There was relatively good agreement between the NJDEP survey and
the case-control study, once the NJDEP results were population-weighted.
However, the case-control study had significantly fewer houses with lower floor

G4
attributable to differences in sampling between the two studies (the population
based case-control study included more urban residents) and differences in the ages
of the houses tested (the case-control study houses were all at least 22 years old).

G 5
TABLE Gl
Comparison of lowest floor charcoal canister results from
statewide NJDEP survey (1986-1987) and from this case-control study (1986-1988),
a Mantel-Haenszel Chi-square, adjusted for county, for difference in percentage of houses at 4+ pCi/L, between NJDEP study and case-control study:
0.0, 1 d.f., p = 0.99.
D Mantel-Haenszel Oii-square, adjusted for county, for difference in percentage of houses at 4-19 pCi/L and 20+ pCi/L, between NJDEP study and case-
control study: 10.5, 1 d.f., p = 0.005.

H 1
APPENDIX H
Considerations with Respect to Measurement Floor
The original protocol for this study called for making measurements of radon
in the basement and in the master bedroom of the index house. There were
several reasons for these decisions: The basement measurement was included as an
index of the maximal potential for exposure in the house. It was also the part of
the house in which the presence of a detector for a full-year's period was least
likely to be an aesthetic problem for the resident; therefore, it was the part of the
house where the detector was least likely to be disturbed and from which we were
more likely to be able to retrieve the detector successfully after a full year. The
master bedroom was selected as the room in the house where the subject probably
spent the greatest period of time, i.e., 6-8 hours of sleeping per night. Ideally, it
would have been optimal to make measurements on every floor of every house.
However, the study budget did not allow this. Also, we had not collected
information on the percentage of time spent by the .subject in different areas of the
house. Therefore, it would be difficult to assign appropriate weights to
measurements from multiple living areas.
In many houses, the master bedroom was on the second floor; in many other
houses, the master bedroom was on the first floor. In some houses, the current
resident did not allow the placement of detectors in the master bedroom; therefore,
they were placed in an alternate living area (another bedroom, the living room or
dining room). Therefore, it was of some concern to us, whether there was any
systematic difference between measurements on the second floor and measurements
on the first floor, after controlling in some way for the "radon potential" of the
house. If there were a systematic difference between floors, then we might have to
standardize for the measurement floor in some way.

H2
Therefore, we examined the ratio between the living area measurement and
the basement measurement, in houses for which the measured living area was on
the first floor versus houses for which the measured living area was on the second
floor (Table HI). Because the results of the study conducted for the NJDEP (see
Appendix G) had suggested that the inter-floor ratio could vary with the type of
heat distribution (forced air vs. hot water/electric), we did this analysis controlling
for the type of heat distribution. There was no significant difference (p > 0.05) in
the ratio distribution for houses with first floor measurements vs. houses with
second floor measurements, within either type of heat distribution. However, there
were significant differences (p < 0.001) in the ratio distribution for forced air vs.
hot water/electric houses within both first floor and second floor houses.
In this study, there were 39 houses in which both first floor and second floor
measurements were made. For 28 of the 39 houses, the measurement result fell into
the same interval (<1 pCi/L or 1-1.9 pCi/L) for both floors. For 9 of these houses,
the measurement result was one interval higher for the first floor result than for
the second floor result. For 2 of these houses, the measurement result was one
interval lower for the first floor result than for the second floor result. The
decision was made to use the first floor result.
For 92 of the 796 addresses with radon measurements, residential information
indicated that the subject did not occupy the entire house. Rather, she lived in an
apartment on the first or second floor or on the first or second floor of a multi-
family house. Measurements were obtained on the correct index floor for 70 of
these 92 addresses. Of the remaining 22 addresses, measurements were obtained on
the second floor for 10 subjects who had lived on the first floor; measurements
were obtained on the first floor for 9 subjects who had lived on the second floor.
Only basement measurements were obtained for 3 addresses. All but one of these 22
addresses had a measured or estimated living area radon concentration of less than

H 3
1 pCi/L. Review of all of the results for these 22 addresses did not suggest that a
higher measurement would have been obtained on the correct index floor.

H 4
TABLE HI
Ratio of living area alpha track detector results
to basement alpha track detector result,
by living area floor and by type of heat distribution, New Jersey radon—female luner cancer case-control studv
Comparison of distribution of ratio, by floor:
Within forced air heat houses: Chi-square = 9.2, df = 5, p = 0.10
Within hot water/electric heat houses: Chi-square = 4.4, df = 5, p = 0.50
Comparison of distribution of ratio, by type of heat distribution:
Within houses with 1st floor measurements: Chi-square=25.2, df = 5, p < 0.001
Within houses with 2nd floor measurements: Chi-square=l8.1, df = 5,
p = 0.003

J 1
APPENDIX J
Estimates of Year-round Living Area Radon Concentrations
Living area alpha track measurements were not obtained for 171 of the index
addresses. Only basement alpha track measurements were completed for 55
addresses. Only charcoal canister measurements were completed for 77 addresses.
No radon measurements were conducted at the 39 addresses which were apartments
above the second floor. Living area radon concentrations were estimated for these
171 addresses. This estimation process was conducted without knowledge of the
case-control status of the subject, and is described below. Analyses excluding the
estimates are presented in Appendix K.
(1) Estimation from basement alpha track measurements. The analyses
described in Appendix H suggest that there was a systematic difference in the
ratio of living area alpha track measurements to basement alpha track
measurements, depending on the type of heat distribution. The geometric mean of
this ratio was calculated and found to be 0.48 for forced air houses and 0.36 .for
hot "water/electric houses. For houses with only basement alpha track
measurements, the living area radon level was estimated as 0.48 times the basement
level for forced air houses and 0.36 times the basement level for hot water/electric
houses. Of the 55 houses, only five had estimated living area radon concentrations
in the 1-1.9 pCi/L range; these had basement concentrations of 3.8, 2.7, and 2.7
(forced air houses), and 4.1 and 3.5 (hot water/electric houses). The remainder had
estimated living area radon concentrations which were less than 1 pCi/L.
(2) Estimation from charcoal canister measurements. In this study, living area
alpha track results were measured as <1 pCi/L for 50 (86%) of 58 forced air houses
with basement canister results below the minimum detectable concentration. Living
area alpha track results were measured as <1 pCi/L for 120 (98%) of the 123 hot
water/electric houses with basement canister results below the minimum detectable
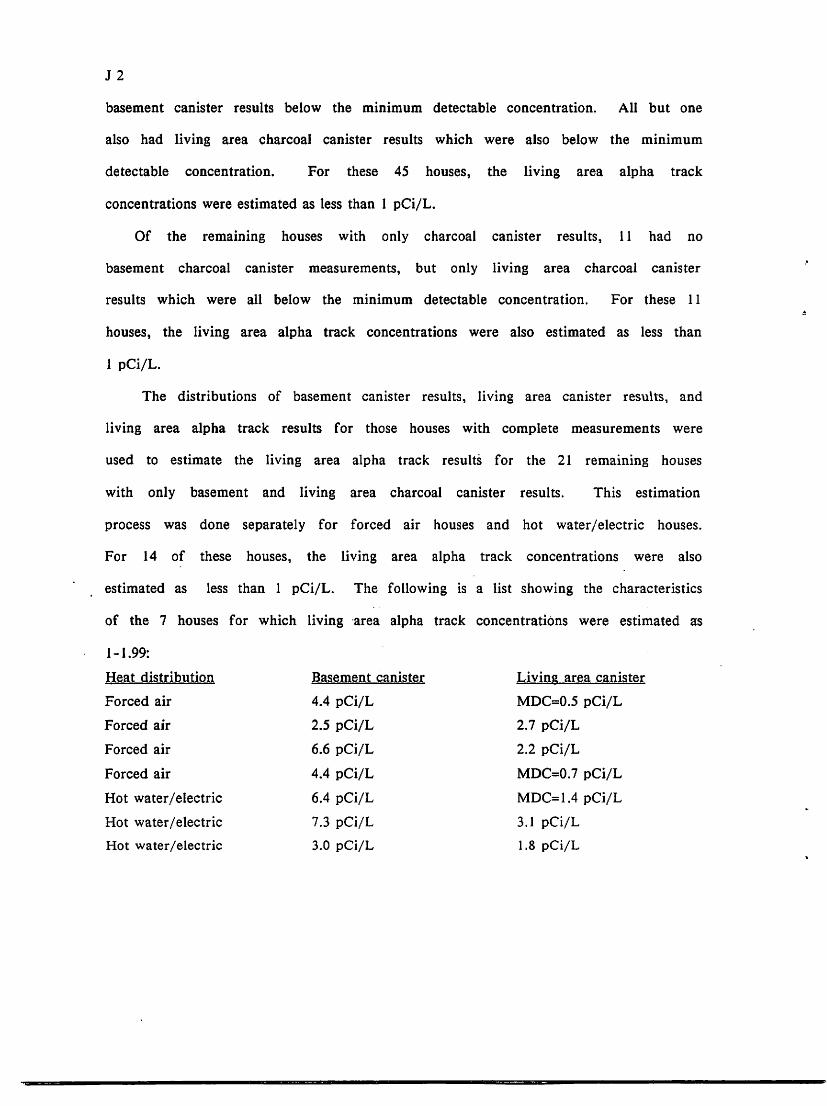
J2
basement canister results below the minimum detectable concentration. All but one
also had living area charcoal canister results which were also below the minimum
detectable concentration. For these 45 houses, the living area alpha track
concentrations were estimated as less than 1 pCi/L.
Of the remaining houses with only charcoal canister results, 11 had no
basement charcoal canister measurements, but only living area charcoal canister
results which were all below the minimum detectable concentration. For these 11
houses, the living area alpha track concentrations were also estimated as less than
1 pCi/L.
The distributions of basement canister results, living area canister results, and
living area alpha track results for those houses with complete measurements were
used to estimate the living area alpha track results for the 21 remaining houses
with only basement and living area charcoal canister results. This estimation
process was done separately for forced air houses and hot water/electric houses.
For 14 of these houses, the living area alpha track concentrations were also
estimated as less than 1 pCi/L. The following is a list showing the characteristics
of the 7 houses for which living area alpha track concentrations were estimated as
1-1.99:
Heat distribution Basement canister Living area canister
Forced air 4.4 pCi/L MDC=0.5 pCi/L
Forced air 2.5 pCi/L 2.7 pCi/L
Forced air 6.6 pCi/L 2.2 pCi/L
Forced air 4.4 pCi/L MDC=0.7 pCi/L
Hot water/electric 6.4 pCi/L MDC=1.4 pCi/L
Hot water/electric 7.3 pCi/L 3.1 pCi/L
Hot water/electric 3.0 pCi/L 1.8 pCi/L
J 3
(3) Estimation for apartment 3+ addresses. As part of the initial study
protocol, it was assumed that subjects whose index address was an apartment above
the second floor would have negligible radon exposures1. Therefore, all of these
addresses were estimated as having exposures less than 1 pCi/L.
1 Cohen, BL, Gromicko, N. Radon-222 levels in low income households. Health Phvs 56: 349-353 (1989).
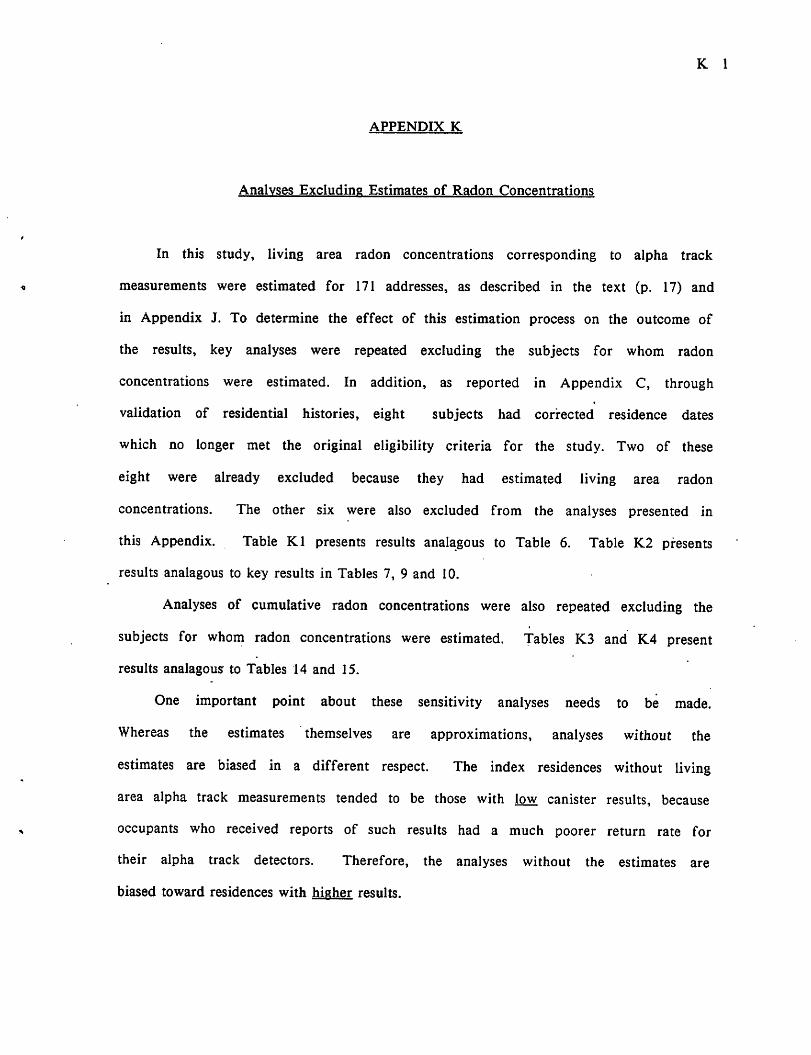
K 1
APPENDIX K
Analyses Excluding Estimates of Radon Concentrations
In this study, living area radon concentrations corresponding to alpha track
measurements were estimated for 171 addresses, as described in the text (p. 17) and
in Appendix J. To determine the effect of this estimation process on the outcome of
the results, key analyses were repeated excluding the subjects for whom radon
concentrations were estimated. In addition, as reported in Appendix C, through
validation of residential histories, eight subjects had corrected residence dates
which no longer met the original eligibility criteria for the study. Two of these
eight were already excluded because they had estimated living area radon
concentrations. The other six were also excluded from the analyses presented in
this Appendix. Table Kl presents results analogous to Table 6. Table K2 presents
results analagous to key results in Tables 7, 9 and 10.
Analyses of cumulative radon concentrations were also repeated excluding the
subjects for whom radon concentrations were estimated. Tables K3 and K.4 present
results analagous to Tables 14 and 15.
One important point about these sensitivity analyses needs to be made.
Whereas the estimates themselves are approximations, analyses without the
estimates are biased in a different respect. The index residences without living
area alpha track measurements tended to be those with low canister results, because
occupants who received reports of such results had a much poorer return rate for
their alpha track detectors. Therefore, the analyses without the estimates are
biased toward residences with higher results.

K 2
TABLE KL
Distribution of lung cancer cases and controls by radon level
(year-long living area alpha track measurements, n=658)a and by lifetime average daily cigarette consumption,
New Jersey radon-female lima cancer case-control studv. 1982-1988
a excludes subjects whose index address was an apartment above the second floor or
a trailer, as well as other subjects whose living area alpha track results were
estimated from basement alpha track results or from charcoal canister results.
Also excludes eight subjects (six with measured living area alpha track results)
for whom validation of residential history information showed that they no longer
met the original criteria for eligibility for the study (see Appendix F).
k Unadjusted odds ratio (an estimate of the lung cancer risk associated with radon exposure and smoking, but not adjusted for any other factors), relative to
nonsmokers with < 1.0 pCi/L radon exposure, (contd.)
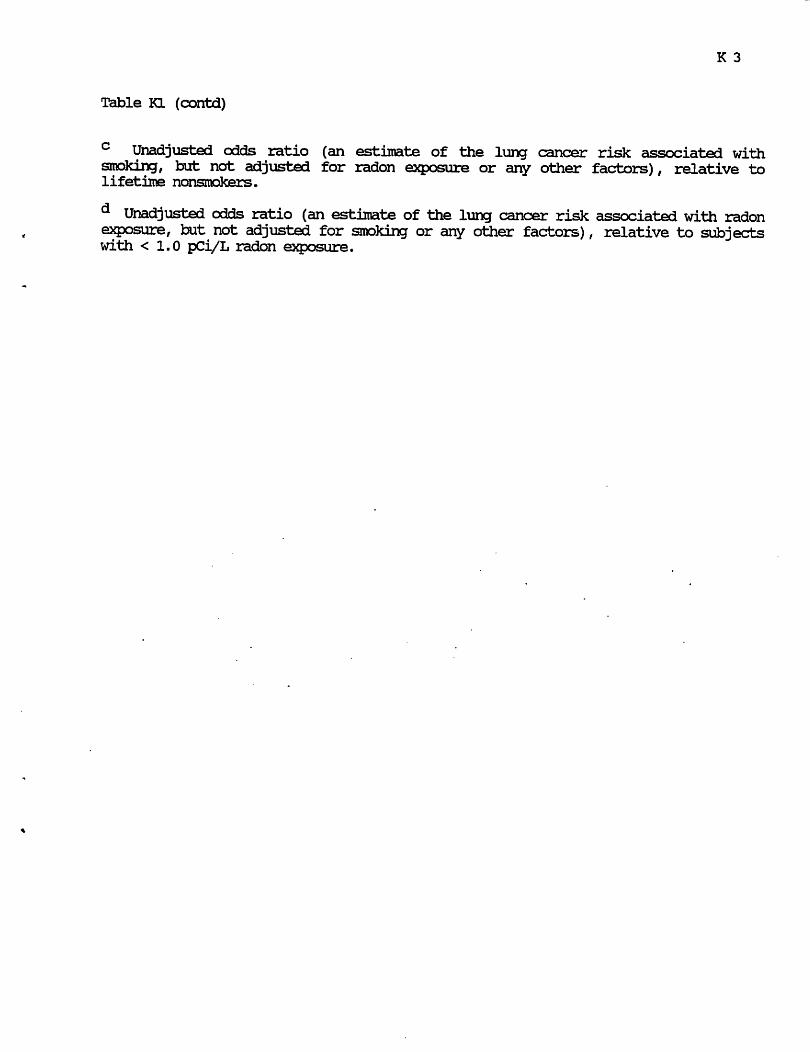
K 3
Table Kl (contd)
c Unadjusted odds ratio (an estimate of the lung cancer risk associated with smoking, but not adjusted for radon exposure or any other factors), relative to lifetime nonsmokers.
d Unadjusted odds ratio (an estimate of the lung cancer risk associated with radon exposure, but not adjusted for smoking or any other factors), relative to subjects with < 1.0 pCi/L radon exposure.

K 4
TABLE K2
Odds ratiosa (90% confidence intervals) for association of lung cancer with radon
(year-long living area alpha track measurements, n=658)k in ALL SUBJECTS, and EXCLUDING HEAVY SMOKERS,
adjusting for multiple risk factors and subject characteristics,
New jtxr^&af radon—female J.ung cancer case-control study r 1982—1988
Trend
Radon (pCi/L) Zcata Zcnte Smoking status: <1.0c 1-1.9 2-3.9 4-11.3 (p) (p)
ALL SUBJECTS
Adjusted by
cigarettes/day 1.0 1.0 1.2 3.5 1.30 1.13
(0.71,1.5) (0.58,2.7) (0.80,14.9) (0.097) (0.129)
[IR=152.8, 4df]+ N v '
1.6f (0.79,3.0)
Adjusted by
cigarettes/day, 1.0 1.1 1.3 3.5 1.37 1.06
age, occupation, (0.71,1.6) (0.59,2.8) (0.80,15.7) (0.085) (0.145)
yrs quit smoking, N v '
respondent type, 1.6
resptype*cigs/day (0.81,3.3)
[1R=219.4, 17df]+
ALL EXCEPT
HEAVY SMOKERS
Adjusted by
cigarettes/day 1.0 1.1
(0.77,1.7)
[1R=118.6, 3df]+
Adjusted by
cigarettes/day, 1.0 1.1
age, occupation, (0.75,1.8)
yrs quit smoking,
respondent type,
resptype*cigs/day
[Ift=164.9, 13df]+
+ Likelihood ratio statistic for model including categorical "radon trend" term
(with degrees of freedom).
a Odds ratios (OR) and 90% confidence intervals from logistic regression analyses,
(contd).

K 5
Table K2 (contd)
b excludes subjects whose index address was an apartment above the second floor or a trailer, as well as other subjects whose living area alpha track results
were estimated from basement alpha track results or from charcoal canister results. Also excludes eight subjects (six with measured living area alpha track results) for whom validation of residential history information showed that they no longer met the original criteria for eligibility for the study (see Appendix F).
c Includes subjects whose index address was an apartment above the second floor or a trailer.
d Z statistic (1-sided p value) for categorical "radon trend" term in logistic regression model. This term equals 0.4 if radon is <1 pCi/L, 1.2 (1-1.9 pCi/L), 2.3 (2-3.9 pCi/L), or 4.55 (4+ pCi/L). These values are the medians of the respective intervals for controls. This model gives results equivalent to the Mantel Chi-extension procedure for stratified analyses.
e Z statistic (1-sided p value) for continuous radon variable in logistic regression model.
f OR (90% confidence interval) for radon = 2+ pCi/L.

K 6
TABLE K3
Distribution of New Jersey female lung cancer cases and controls
by cumulative radon exposurea (excluding all radon estimates)13 and by lifetime average daily cigarette corisumption,
New Jersev radon-female luncr cancer case-control study. 1982-1988
a cumulative radon exposure during 25 years from 5-30 years prior to case
diagnosis or control selection; assumes exposure of 0.6 pCi/L (median for
controls) for any of the 25 years during which the subject did not live in the
index address where the measurements were made.
b excludes subjects for vfaom living area alpha track results were estimated. c Unadjusted odds ratio (an estimate of the lung cancer risk associated with radon
exposure and smoking, but not adjusted for any other factors), relative to
nonsmokers with < 25.0 pCi/L-years cumulative radon exposure.
d Unadjusted odds ratio (an estimate of the lung cancer risk associated with smoking, but not adjusted for radon exposure or any other factors), relative to
lifetime nonsmokers.
e Unadjusted odds ratio (an estimate of the lung cancer risk associated with
cumulative radon exposure, but not adjusted for smoking or any other factors),
relative to subjects with < 25.0 pCi/L-years cumulative radon exposure.

K 7
TABLE K4
Odds ratiosa (90% confidence intervals) for association of lung cancer with cumulative radon exposure13 (excluding radon estimates)0
in ALL SUBJECTS, and EXCLUDING HEAVY SMOKERS. New Jersey radon-femalelung cancer case-control study. 1982-:
Trend
Cumulative radon (pCi/L-vears) Zcatc Zcnta Smoking status <25 25-49 50-99 100-155 fp) (p)
ALL SUBJECTS
Adjusted by 1.0 1.1 0.84 6.9 0.96 0.86
cigarettes/day (0.73,1.7) (0.37,1.9) (0.99,48.3) (0.167) (0.195) [IR=152.0, 4df]+ > v '
1.2e (0.58,2.7)
Adjusted by 1.0 1.2 0.82 6.0 0.87 0.78
cigarettes/day, (0.76,1.8) (0.35,1.9) (0.80,44.9) (0.192) (0.218) age, occupation, v v '
yrs quit smoking, 1.2
respondent type, (0.53,2.6)
resptype*cigs/day
[IR=218.2, 17df]+
ALL EXCEPT
HEAVY SMOKERS
Adjusted by 1.0 1.2 1.6 6.8 1.85 1.78
cigarettes/day (0.80,1.9) (0.62,4.1) (0.95,48.6) (0.032) (0.038) [IR=116.4, 3df]+ > v '
2.2
(0.92,5.2)
Adjusted by 1.0 1.3 1.5 6.2 1.67 1.67
cigarettes/day, (0.79,2.0) (0.55,3.9) (0.80,46.9) (0.047) (0.047) age, occupation, v v '
yrs quit smoking, 2.0
respondent type, (0.83,5.0)
resptype*cigs/day
[IR=162.6, 13df]+
+ Likelihood ratio statistic for model including categorical "cumulative radon rend" term (with degrees of freedom)
a Odds ratios and 90% confidence intervals from logistic regression analyses, (contd)

K 8
TABLE K4 (contd)
b cumulative radon exposure during 25 years from 5-30 years prior to case diagnosis or control selection; assumes exposure of 0.6 pCi/L (median for
controls) for any of the 25 years during which the subject did not live in the
index address where the measurements were made.
c excludes subjects for whan living area alpha track results were estimated.
d Z statistic (1-sided p value) for categorical "cumulative radon trend" term in logistic regression model. This term equals 11.8 if cumulative radon is <25
pCi/L-years, 29.4 (25-49 pCi/L-years), 69.4 (50-99 pCi/1-years, or 109.5 (10O+-
pCi/1-years). These values are the medians of the respective intervals for
controls. This model gives results equivalent to the Mantel Chi-extension
procedure for stratified analyses.
e Z statistic (1-sided p Value) for continuous cumulative radon variable in
logistic regression model.
f Odds ratio (90% confidence interval) for cumulative radon=5CH- pCi/L-years.