of program 135 phase ii through baseline and endline surveys · the lens of baseline and endline...
TRANSCRIPT
ImpactofProgram135‐phaseIIthrough
theLensofBaselineandEndlineSurveys
Hanoi,Dec2012

i
Contents
ACKNOWLEDGEMENTS.......................................................................................................................1
EXECUTIVESUMMARY.........................................................................................................................7
CHAPTER1..............................................................................................................................................15
INTRODUCTION.....................................................................................................................................15
CHAPTER2..............................................................................................................................................19
BASELINESURVEY2007ANDENDLINESURVEY2012......................................................19
2.1 ObjectivesoftheSurveys.................................................................................................19
2.2 SurveyDesign.......................................................................................................................20
2.2.1 SamplingDesign.........................................................................................................20
2.2.2 QuestionnaireDesign...............................................................................................22
2.3 Surveyimplementation....................................................................................................23
2.3.1 Baseline2007..............................................................................................................23
2.3.2 Endline2012................................................................................................................25
2.4 Conclusion..............................................................................................................................28
CHAPTER3..............................................................................................................................................29
REVIEWTHEIMPLEMENTATIONOFP135‐IIANDMETHODOLOGYTOMEASURE
THEIMPACT............................................................................................................................................29
3.1 Introduction..........................................................................................................................29
3.1.1 ControlandTreatmentCommunes....................................................................29
3.1.2 Comparison of Funds Allocation Across Treatment and Control
Communes......................................................................................................................................30
3.2 MethodologiestoMeasureImpacts............................................................................32
3.2.1 ViewsoftheBeneficiaries......................................................................................34
3.2.2 EconometricImpactEvaluationforHigher‐LevelOutcomes.................39
3.3 Conclusion..............................................................................................................................41
CHAPTER4..............................................................................................................................................42
POVERTYPROFILEOFETHNICMINORITIES...........................................................................42
4.1 Povertyandinequalityofethnicminorities............................................................43
ii
4.1.1 Povertytrend...............................................................................................................43
4.1.2 Inequalityanalysis.....................................................................................................48
4.2 Characteristicsofethnicminorities............................................................................54
4.2.1 Livingconditions........................................................................................................54
4.2.2 Incomestructure........................................................................................................62
4.3 Povertydynamicsofethnicminorities......................................................................72
4.4 Conclusions............................................................................................................................76
CHAPTER5..............................................................................................................................................78
CAPACITY,DECENTRALIZATION, PARTICIPATIONAND IMPACTSOFP135‐IION
OUTCOMES..............................................................................................................................................78
5.1 Introduction..........................................................................................................................78
5.2 CapacitystrengtheningandProjectManagement................................................79
5.2.1 Capacitystrengtheningthroughtrainingactivitiesatcommunelevel79
5.2.2 ProjectManagementatcommunelevel...........................................................81
5.2.3 OwnershipofP135‐IIinvestmentprojects.....................................................85
5.2.4 Capacitystrengtheningatcommunity–HouseholdParticipation........87
5.3 ImpactofP135‐IIonoutcomes....................................................................................99
5.3.1P135‐IIImpactsonKeyResponseVariables......................................................99
5.3.2 ControlVariables........................................................................................................99
5.3.3 Estimation.....................................................................................................................99
5.4 Conclusion...........................................................................................................................104
CHAPTER6...........................................................................................................................................107
CONCLUSIONANDRECOMMENDATION.................................................................................107
REFERENCES.......................................................................................................................................112
APPENDIX.............................................................................................................................................115
iii
ABBREVIATION
BLS Baseline Survey
CEMA Committee for Ethnic and Mountainous Area
CSB
DID
Commune Supervision Board
Difference in Difference
ELS Endline Survey
HEPR theHungerandPovertyEradicationProgram
HERP TheHungerandPovertyEradicationProgram
IRC Indochina Research and Consulting
NTP‐PR National Target Program for Poverty Reduction
P135‐I Program 135 Phase I
P135‐II Program 135 Phase II
PMU Project Management Unit
UNDP United Nations Development Programme
VBSP Vietnam Bank for Social Policies
VHLSS Vietnam Household Living Standard Survey
WB The World Bank
WHO World Health Organization
iv
LISTOFTABLES
Table3.1:TransitionMatrixbetweenControlandTreatmentCommunes..............30
Table3.2:Budgetallocationbetweencontrolandtreatmentcommunes.................31
Table3. 3: Evaluationof commune leaders on living standardof people in their
commune.................................................................................................................................................34
Table3.4:Mainreasonsofimprovement.................................................................................35
Table3.5:Mostimportantprogramsconductedincommune........................................36
Table3.6:AwarenessofthehouseholdsonP135‐IIcomponents...............................37
Table3.7:MajorbenefitsofP135‐II...........................................................................................37
Table3.8:WorkingonInfrastructureProjects......................................................................38
Table 4. 1: Per capita income and the poverty rate of households in P135‐II
communes...............................................................................................................................................43
Table4.2: Povertygapandseverityindexesbydemographicsandregions............46
Table4.3:Shareofthepoor...........................................................................................................47
Table4.4:Inequalityinper‐capitaincomedistribution....................................................48
Table4.5:DecompositionofinequalitybyKinhandethnicminorities......................51
Table4.6:Decompositionofinequalitybyregions..............................................................51
Table4.7:Growthandredistributiondecompositionofpovertychanges................52
Table4.8:Elasticityofpovertywithrespecttoincome.....................................................53
Table4.9:Elasticityofpovertywithrespecttotheinequality.......................................53
Table4.10:Housingconditionofhouseholds........................................................................54
Table4.11:Latrinetypes.................................................................................................................55
Table4.12:Drinkingwatersources............................................................................................56
Table4.13:Boilingwaterandaccesstoelectricity..............................................................58
Table4.14:Telephoneandtelevision........................................................................................59
Table4.15:Motorbikeandelectricfan......................................................................................60
Table4.16:Socialallowances........................................................................................................61
Table4.17:Householdincomestructure.................................................................................62

v
Table4.18:Structureofincomefromagriculture,forestryandaquaculture(%).63
Table4.19:Wageincome................................................................................................................63
Table4.20:Nonfarmincome(excludingwage).....................................................................65
Table4.21:No.ofhouseholdincomesources........................................................................66
Table4.22:Cropland........................................................................................................................67
Table4.23:Proportionoflandsthatareirrigated(%)......................................................68
Table4.24:CreditfromVietnamBankforSocialPolicies(VBSP).................................69
Table4.25:Formalcredit................................................................................................................70
Table4.26:Informalcredit.............................................................................................................71
Table4.27:Povertytransitionduring2007‐2012...............................................................73
Table4.28:Marginaleffectinmultinomiallogitregression............................................75
Table5.1:ProjectManagementandPlanningatcommunelevel(%).........................81
Table5.2:OwnershipofP135‐IIinfrastructureprojects.................................................86
Table5.3:CommunitycontributionforP135‐IIinfrastructureprojects(%)..........91
Table 5. 4: Job creation opportunities for households in local infrastructure
projects.....................................................................................................................................................91
Table5.5:ParticipationandqualityofSupervisoryBoard(%).....................................95
Table5.6:HouseholdsbenefitfromP135‐IIinfrastructureprojects...........................98
Table5.7:Impactestimationresults......................................................................................103
vi
LISTOFFIGURES
Figure2.1:LocationsatofP135‐IIEndlinesurveyinterviewers...................................27
Figure3.1: Distribution of Fund allocation per capita............................................................32
Figure3.2:CausalChainHypothesis.........................................................................................33
Figure4.1: Poverty rate and the share of the poor by Kinh and ethnic minorities........45
Figure4.2: Lorenz Curve..................................................................................................................49
Figure4.3:Incomegrowth-incidence curve of all households............................................50
Figure5.1:Trainingactivitiesforcommuneofficials.........................................................80
Figure5.2:Fiduciarytransparencyatcommunelevel(%)..............................................83
Figure 5. 3: Household receive information about financial expenditure of
infrastructureprojects(%).............................................................................................................84
Figure5.4:Householdparticipationrateinselectionmeeting(%).............................89
Figure 5. 5: Job creation for households in local infrastructure projects with
classification...........................................................................................................................................93
Figure5.6:Households’participationinSupervisoryBoard(%).................................94
Figure5.7:Households’involvementinO&MofP135‐IIprojects(%).....................96
Figure 5. 8: Households that are satisfiedwith quality of P135‐II infrastructure
projects(%)............................................................................................................................................97

1
ACKNOWLEDGEMENTS
This report is written by a team of Indochina Research and Consulting (IRC),
includingPhungDucTung(teamleader),NguyenVietCuong,PhungThanhThu,Vu
Thi Bich Ngoc, Le Dang Trung, Pham Thai Hung, Nguyen Thu Nga, and Daniel
Westbrook(ProfessorofGeorgetownUniversity,US),JamesTaylor(TheUniversity
ofAdelaide,Australia).
The teamof authorswould like to express their greatest gratitude tonumerous
organizationsandindividualswhohaveprovidedtremendoushelpincompleting
thisstudy.
SpecialthanksaregiventoFinlandGovernmentforfundingthisproject,toUNDP
OfficeinVietnam,andCEMAfortheircontinualsupportofthisstudy.Thisreport
cannot be completed without valuable support and technical advice from Mr.
Nguyen Tien Phong (UNDP) and Ms. Vo Hoang Nga (UNDP) from the very
beginningoftheprojectuntilthecompletionofthereport.Constructivecomments
andsupportfromCEMAaregreatlyappreciated.ExpertsandofficersfromCEMA
includeMr.TrinhCongKhanh,Mr.VoVanBay,Mr.NguyenVanTan,Ms.Nguyen
ThiNga,andMr.TranKien.
SincerethanksfromtheteamofauthorsalsogotoCEMAatprovincialanddistrict
levelsof43provincesincludedinthestudyfortheirhugeadministrativesupport
during the planning and implementation stages of the field survey. The authors
would like to express great appreciation towards 6,000 interviewedhouseholds
for their cooperation and 120 enumerators for their participation in the data
collectionprocessduringanintensivetwo‐monthperiod.Thissurveywouldhave
notbeenasuccesswithouttheirdedicationandenthusiasm.

2

3
MAJORPROGRESS
Baseline Endline 2010 target
ERADICATION OF POVERTY AND HUNGER
Income-based poverty and inequality
Poverty headcount (%) 57.50 49.25 30.00
Poverty gap (%) 23.50 22.36
Gini coefficient 43.07 47.53
EMPLOYMENT - INCOME
Employment rate for individuals aged 15 - 60 (%) 95.92 95.95
Underemployment rate (%) 67.05 50.27
Wage and salaried work (%) 24.70 24.57
Self-employment in non-farm sector (%) 11.84 5.61
Self-employment in farm sector (%) 79.09 72.79
Number of working hours per year for main job 1306.80 1659.52
Annual Income from main job (thousand vnd) 7747.23 20292.62
Income
Per capital income (thousand VND/year)* 6,024.04 7,265.78
Average income per capita/year > 3.5 million/year
(%)* 30.88 41.13 70.00
Household income structure
Wage, salary 19.54 23.92
Agriculture, forestry and aquaculture 63.50 57.47
Non-farm 5.32 4.73
Others 11.64 13.88
AGRICULTURAL PRODUCTION
Agricultural infrastructures
% annual crop land is irrigated 50.21 82.08
% perennial crop land is irrigated 29.82 61.71
Productivity of some main trees
Rice productivity (ton/ha) 3.54 3.94
Corn productivity (ton/ha) 3.13 3.36
Cassava productivity (ton/ha) 13.41 12.14
Poor households use market-oriented services
% of rice traded 9.70 8.50
% of other food crops traded 24.41 37.12
% of industrial crop traded 39.62 51.83
% households received agri extension support 32.18 49.34
% of household paying for agri extension services 5.44 14.35
% happy with the quality of the information 88.49 87.68
INFRASTRUCTURE DEVELOPMENT
4
Baseline Endline 2010 target
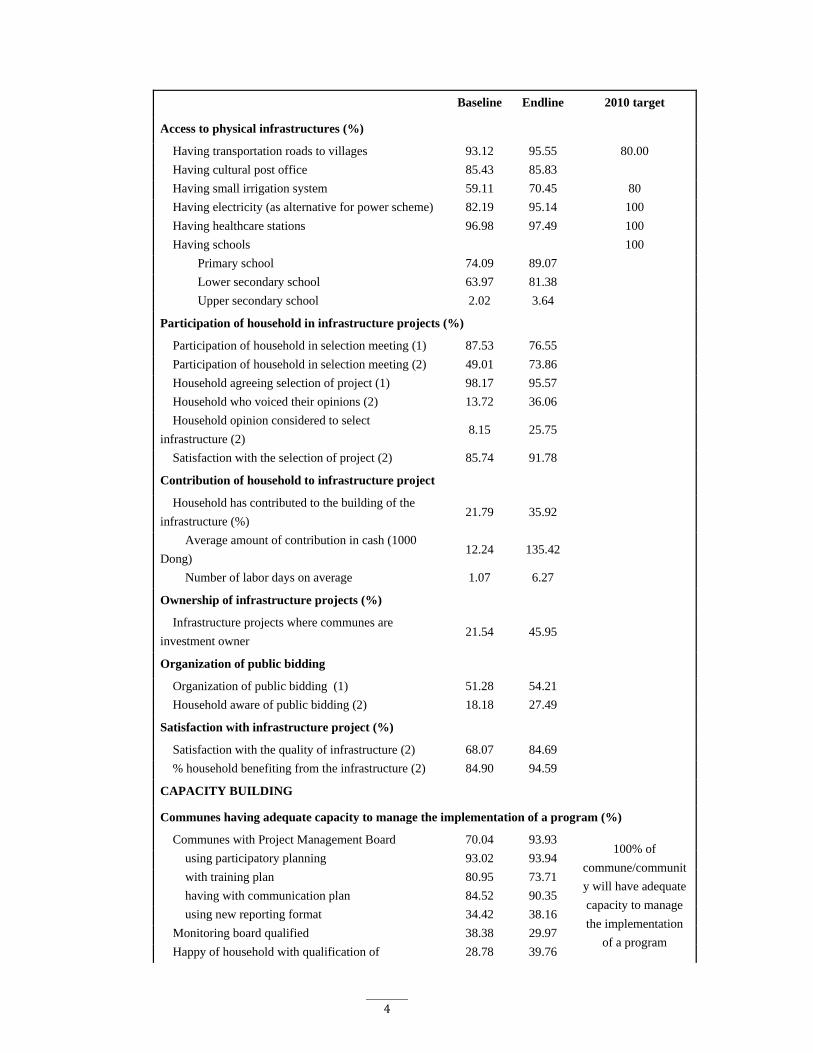
Access to physical infrastructures (%)
Having transportation roads to villages 93.12 95.55 80.00
Having cultural post office 85.43 85.83
Having small irrigation system 59.11 70.45 80
Having electricity (as alternative for power scheme) 82.19 95.14 100
Having healthcare stations 96.98 97.49 100
Having schools 100
Primary school 74.09 89.07
Lower secondary school 63.97 81.38
Upper secondary school 2.02 3.64
Participation of household in infrastructure projects (%)
Participation of household in selection meeting (1) 87.53 76.55
Participation of household in selection meeting (2) 49.01 73.86
Household agreeing selection of project (1) 98.17 95.57
Household who voiced their opinions (2) 13.72 36.06
Household opinion considered to select
infrastructure (2) 8.15 25.75
Satisfaction with the selection of project (2) 85.74 91.78
Contribution of household to infrastructure project
Household has contributed to the building of the
infrastructure (%) 21.79 35.92
Average amount of contribution in cash (1000
Dong) 12.24 135.42
Number of labor days on average 1.07 6.27
Ownership of infrastructure projects (%)
Infrastructure projects where communes are
investment owner 21.54 45.95
Organization of public bidding
Organization of public bidding (1) 51.28 54.21
Household aware of public bidding (2) 18.18 27.49
Satisfaction with infrastructure project (%)
Satisfaction with the quality of infrastructure (2) 68.07 84.69
% household benefiting from the infrastructure (2) 84.90 94.59
CAPACITY BUILDING
Communes having adequate capacity to manage the implementation of a program (%)
Communes with Project Management Board 70.04 93.93 100% of
commune/communit
y will have adequate
capacity to manage
the implementation
of a program
using participatory planning 93.02 93.94
with training plan 80.95 73.71
having with communication plan 84.52 90.35
using new reporting format 34.42 38.16
Monitoring board qualified 38.38 29.97
Happy of household with qualification of 28.78 39.76

5
Baseline Endline 2010 target
supervision board
Open treasury account 29.41 39.05
Infrastructure project with an O&M plan 48.20 54.42
Village and commune staff provided with appropriate skills and knowledge (%)
Duration of training is sufficient 35.09 59.73
Training practical & applicable 82.69 85.42
Quality of the trainers (% good or very good) 79.53 90.06
Supervision team trained before taking their role (2) - -
Capacity strengthened with community participation (%)
Organization of meeting to select project 86.41 85.61 Community capacity
strengthened with
community
participation in
supervision activities.
Participation of household in meeting (2) 49.01 73.86
Households have members monitoring infrastructure
projects 3.48 8.00
Household received financial information (2) 11.57 21.33
IMPROVED SOCIO-CULTURAL LIVELIHOODS
Household access to education (%)
School enrolment
Gross enrolment rate at primary level 97.70 97.18
Net enrolment rate at primary level 84.59 85.41 95
Gross enrolment rate at lower secondary level 74.12 70.95
Net enrolment rate at lower secondary level 60.91 63.11 75
Gross enrolment rate at upper secondary level 42.80 38.43
Net enrolment rate at upper secondary level 31.13 32.50 75
Household access to healthcare services (%)
% of individual being ill or injured over the past 12
months 49.55 49.91
Types of healthcare facilities used for medical
treatment
Health center (hamlet, commune, region) 54.85 45.67
Hospital (district, province, national, other) 15.61 25.15
Other facilities 29.55 29.14
% exempted from health care fees
Having free health care certificates 88.04 88.35
Having no free health care certificates 11.96 11.65
Household access to other key services (%)
Water for drinking and cooking
Over 80% of
households use clean
water
Piped, bought, and rain water 14.96 13.27
Drilled well, hand-dug well covered, protected
spring sources 47.93 52.16
Hand-dug well uncovered, unprotected spring
sources 26.38 28.40
River, lake, pond and other sources of water 10.73 6.17
6
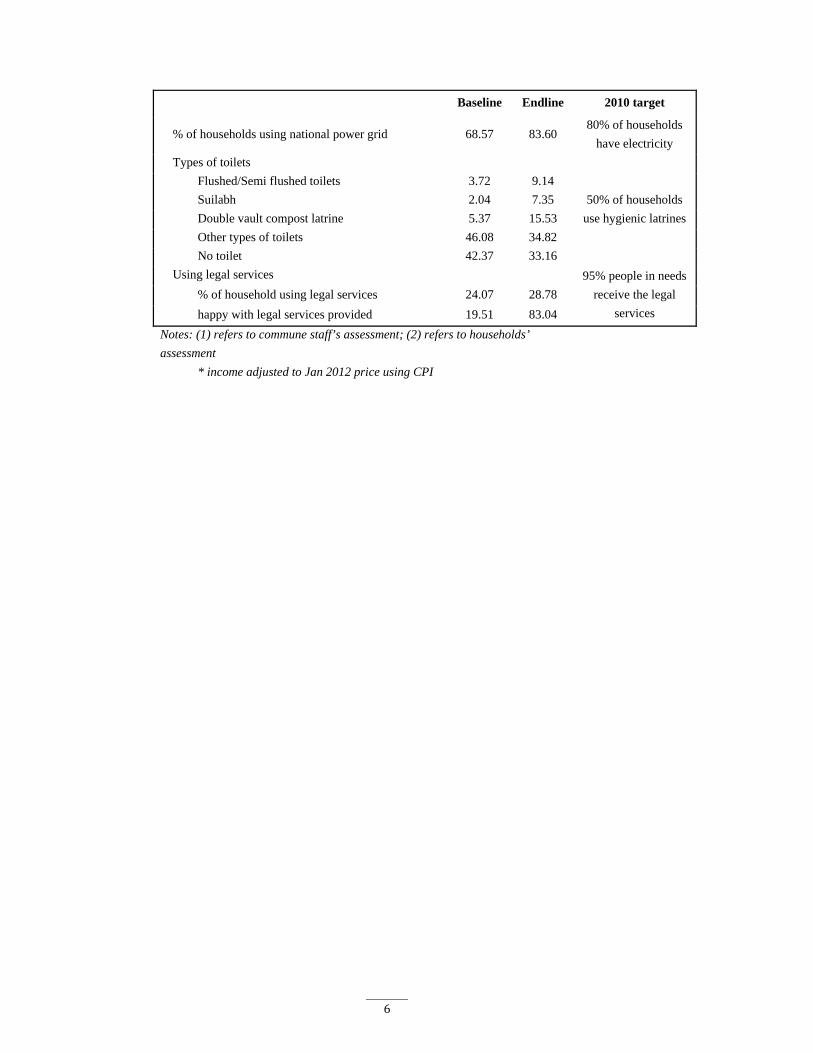
Baseline Endline 2010 target
% of households using national power grid 68.57 83.60 80% of households
have electricity
Types of toilets
50% of households
use hygienic latrines
Flushed/Semi flushed toilets 3.72 9.14
Suilabh 2.04 7.35
Double vault compost latrine 5.37 15.53
Other types of toilets 46.08 34.82
No toilet 42.37 33.16
Using legal services 95% people in needs
receive the legal
services
% of household using legal services 24.07 28.78
happy with legal services provided 19.51 83.04
Notes: (1) refers to commune staff’s assessment; (2) refers to households’
assessment
* income adjusted to Jan 2012 price using CPI
7
EXECUTIVESUMMARY
Vietnamisoneof themostsuccessfulcountries intheworld intermsofpoverty
reductionandeconomicachievementoverthepasttwentyyears.Thepovertyrate
fell from 58 percent in 1993 to around 14 percent by 2008. Land and trade
reforms are themajor factors that contributed to high and sustained economic
growth;thesearethemainreasonsthreeofeveryfourpoorpeopleescapedfrom
poverty during this period. However, the rate of poverty reduction has slowed
downovertime.Mostoftheremainingpoorhouseholdsliveinremoteruralareas
whicharemainlypopulatedbyethnicminorities.
To increase the opportunities for poor households to benefit from economic
growth,thegovernmentintroducedProgram135‐II(P135‐II):thelargestandmost
important poverty reduction program targeted on the ethnic minorities and
remoteareas.ThemainobjectivesofP135‐IIare:(i)toreducethepovertyratein
the target areas to below 30%; (ii) to ensure that more than 70% of the
households in the target areas have annual income per capita higher than 3.5
millionVND;(iii)toimproveagriculturalproductivityofthemaincrops;and(iv)
toincreasethenetprimaryandnetsecondaryschoolenrollmentratestoatleast
95%and75%,respectively.
To achieve these objectives, P135‐II was designed with four major support
components: (i) agricultural production support through improving skills and
trainingtheethnicminoritiesonnewproductionpractices;(ii)supporttodevelop
local infrastructureandtoincreasethehouseholds’accesstothatinfrastructure;
(iii) improvement of the socio‐cultural life and access to public services; (iv)
strengthening the administrative and professional capacity of local officials and
enhancingtheirknowledgeof investmentandoperationsmanagement.Thetotal
budgetallocatedforP135‐IIwasaboutUS$1.1billionfor2006‐2010period.
BaselineSurveyandEnd‐lineSurvey
InasubstantialefforttoevaluatetheeffectivenessofP135‐IIandtoenhancethe
designsof futureprograms,theCommitteeforEthnicMinorities(CEM),withthe
supportofUNDP,conductedabaselinesurveyin2007(BLS2007)andanend‐line
survey in 2012 (ELS 2012). The large sample size (6000 households in 400
communesin42provinces),soundmethodologyinsurveydesign,andsystematic
8
and professional evaluation procedure, these surveys provide the most
comprehensive view of the socio‐economic circumstances of ethnic minority
peopleswhofacepersistentpovertyandotherdifficulties.Inparticular,thesedata
sets(i)supportmeasurementoftheprogressinpovertyreductionandadvances
insocio‐economicstatusofethnicminoritycommunities inremotemountainous
areasofVietnamoverthepast5years;(ii)allowrigorousanalysisofprogressin
thesocio‐economicdevelopmentofethnicminoritycommunitiesparticipatingin
P135‐II;(iii)allowmeasurementofchangesinkeyoutcomesattributabletoP135‐
II;and(iv)providereliablequantitativebaselinedatafordesigningandmeasuring
theprogressoffuturegovernmentpovertyreductionprograms.
ImplementationandDecentralizationofP135‐II
Theprogramhassucceededinencouraginghouseholdstoparticipateinlocal
projects. In2010around85percentofP135‐IIprojects involved local selection
meetings.Theproportionsofhouseholdsawareofthemeetingswere56.1percent
and 79.3 percent in 2007 and 2010, respectively. These figures first show an
improvement in household awareness over the period 2007 – 2010, indicating
better information dissemination at the village level. Nevertheless, there is still
scopetoimprovethelevelofhouseholdawareness.
While the percentage of households who voice their opinions during project
selectionmeeting nearly tripled from2007 to 2010, the figure remained low at
36.1 percent in 2010. Most ethnic minority groups use their native language
during group discussion while written guidance and relevant documents are
writtenintheKinhlanguage.Thislanguagebarrierpreventstheethnicminorities
fromfeelingthattheyareabletoexpresstheiropinionsinaclearmanner.
Theprogramfellfarshortofthetargetof100percentofthecommunesbeing
investmentownersat theendoftheprogram.However,withrigorouscapacity
buildingatthecommunelevel,thenumberofcommune‐ownedprojectsdoubled
by 2010, which demonstrates a significant improvement in the ability of
communes to become investment owners. The percentage now stands at 45.9
percent. The majority of investment‐owning communes did not encounter any
serious problems during the implementation process. The biggest problem
encounteredwasslowdisbursementoffunds.
9
Therewas a large improvement inhouseholds’ involvement inSupervisory
Boards. The better‐off groups and majority ethnics were more likely to be
SupervisoryBoardmembers.Non‐poorhouseholdmembersare50percentmore
likelytojoinSupervisoryBoardsthanpoorhouseholdmembers,andmale‐headed
households were more likely to join than female‐headed households. This
phenomenonindicatestheimportanceofengagingthemostdisadvantagedgroups
ineverycommunity‐drivenactivity.Inaddition,theadministrativecapacityofthe
Supervisory Boards appears to be rather limited. More than 60 percent of
respondents thinkthat themembersof theSupervisoryBoardsarenotqualified
fortheirtasks.
P135‐IIhasdoneagoodjobinattractingmorelocalworkers.Thepercentage
of households having members working for local infrastructure projects was
around 30 percent in 2007 and in 2010. While the percentage of households
gettingpaiddoubledovertheperiod2007–2010, itremains low(4.4percent in
2007 and 9.1 percent in 2010). Most local workers work informally for
infrastructureprojects.Thislackofformalresponsibilitybyeitherthecontractor
or workersmight affect the quality as well as the progress of any project. The
numberofhouseholdsmakingcontributions to infrastructureprojects increased
significantly(by14.2percent)overtheperiod2007–2010.Theaveragevalueof
household contributions to projects also increased greatly – by ten times. Thus,
householdshavedemonstratedtheirresponsibilityaswellastheirrecognitionof
the importance of these infrastructure projects to their living conditions and
livelihoods.However,oneconcernisthatcontributionscouldconstituteakindof
direct taxationonpoorhouseholdsormightreducethetimetheyhaveavailable
forotherincome‐generatingactivities.Thisconcerndoesappeartobevalidasthe
contributionrateofthepoorisrelativelyhigherthanthatofthenon‐poor.
The potential impact of P135‐II depends on the degree to which it enhances
resourceavailabilitytotargetcommunes.Thisissuemaybeparticularlycrucialin
thecurrentstudy,inlightofthepossibilitythattheauthoritiesattheprovinceand
district levels reallocate non‐P135 funds from P135 communes to non‐P135
communes to compensate the latter. While the P135‐II communes did receive
substantiallymoreP135fundsthannon‐P135communes,theyalsoreceivedmuch
less non‐P135 funds. As result, theP135‐II communesdidnot receivemore
funding thanother communes. This undermined the goals of P135: to reduce
the widening gap between P135‐II communes and other communes, the gap
10
betweenpoor andnon‐poor households, and the gapbetween ethnicminorities
andKinhhouseholds.
The levelofsatisfactionwithprojectquality increased,withrespecttoboth
householdsandcommuneofficers.Attheprojectinceptionin2007,households
and commune officers expressed different viewpoints regarding P135‐II project
quality.In2007,communeofficialsweremorepositiveaboutprojectqualitythan
households were. The percentage of commune officials satisfied with project
qualitywas 15.6 percent higher than that of households. By 2010, this gap had
diminished to 4 percent; there occurred a convergence of opinions between
householdsandofficerswithbothgroupshavingmorethan80percentexpressing
satisfactionwithprojectquality.
PovertyandLivingStandardsofEthnicMinorities
Thepovertyincidenceamongethnicminoritiesdecreasedbutstillremains
high.Nung,H’MongandTayweremostsuccessfulinpovertyreduction.However,
the living conditions of the remaining poor households, especially the poor
households of Thai and Muong groups, improved less. The majority of poverty
reduction was achieved by income growth, but the rate of growth tended to
decreaseovertime. Inaddition,povertyreductionatthehouseholdlevelappears
not to be sustainable, as a large proportion of poverty is transient: households
may graduate from poverty, but then fall back into poverty over time. Kinh
householdsaremorelikelytobetransientlypoor,whileotherethnichouseholds
aremorelikelytobepersistentlypoor.
Householdsincomesinthetargetareasincreasedbyaround20percentage
points from 2007 to 2010, which is amuch lower growth rate than the
national average (about 50%). Households at low income levels experienced
lower income growth rates than households at high income levels income. As a
result, income inequality among households in the Program 135‐II communes
increased.TheGiniindexincreasedfrom43.0in2007to47.0in2012.Inequality
among Kinh households as well as among ethnic minority households also
increasedduringthisperiod.
Households in the P135‐II communes rely largely on agricultural income.
Nearly60percentoftotalincomeofthehouseholdsisfromagriculturalactivities.
However,webegintoseeatransitionfromfarmtonon‐farmactivities.Theshare
11
ofincomefromwagetendstoincreaseovertime,albeitataslowrate.Theshareof
non‐farm income in total income was very limited, at around 5 percent. The
proportion of households havingwages increased from47.7 percent in 2007 to
53.7 percent in 2012. Kinh and non‐poor households weremore likely to have
wagesthanethnicminorityandpoorhouseholds.
The typical housing conditions improved for all types of households. The per
capita living area increased from13m2 to 18m2 during theperiod 2007‐2012.
The proportion of households living in permanent houses also increased.
However, access to cleanwater and hygienic latrines remains very limited,
which isaseriousproblem.Only13percentofethnicminorityhouseholdshave
tapwater,whilethecorrespondingfigureatthenationallevelwas27percentin
2010.Onlyabout30%ofhouseholdshadaccesstohygieniclatrines.
Therewasan improvement in theaccess toelectricity in theProgram135‐II
communes. The proportion of households with electricity increased from 68.6
percentin2007to83.6percentin2012.However,comparedwiththefigureof98
percentofhouseholdsnationwide,theelectricitycoverageintheProgram135‐II
communes remains low. Access to electricity varies substantially varies across
ethnicminoritygroups.
ThelivingstandardsofbothKinhandethnicminorityhouseholdshavebeen
improvedbyincreasedownershipofdurables:70.9percentofhouseholdshada
telephone in 2012 and nearly 70 percent of households had a television. The
percentageofhouseholdshavingamotorbikeincreasedfrom43.8percentto66.2
percent. Both the poor and non‐poor, and all the ethnic minority groups are
experiencedincreasesinmotorbikeownership.
ImpactofP135‐IIonOutcomes
P135‐IIhashadpositiveimpactsonseveralimportantoutcomesoftheethnic
minorityhouseholds,includingproductiveassetownership,householddurables
ownership, and rice productivity. Among higher‐order outcomes, they enjoyed
positive impacts in income from agriculture, household total income, and
household per‐capita income. A particularly important result is that poverty
amongminority households in treatment communesdeclined significantlymore
thanitdeclinedincomparisoncommunes.Finally,minorityhouseholdsenjoyeda
12
reduction in travel time to health facilities, relative to households in control
communes.
Statistically significant positive impacts were recorded for non‐minority
households for their household durables index and for their corn, cassava, and
industrialcropsproductivities. While industrial cropproductivity increased, the
shareof landallocated to industrial cropsdecreased.Perhapsboth resultswere
drivenbytakingtheleast‐productivelandoutofindustrialcropsproduction.
Non‐minorityhouseholdsarebetteroffthanminorityhouseholds inseveral
very important respects. In particular, non‐minority households have higher
incomes and higher school enrollments. For both of these, there is evidence of
improvement for minorities. Minorities’ incomes increased, but not as much as
non‐minorities. Minorities school enrollments also increased, and by larger
percentagesthanfornon‐minorities.
School enrollment is critically important to households and their communities.
Enrollment rates of minority children are lower than those of non‐minorities,
especially for upper‐secondary school. However, enrollments improved among
households in treatment and in comparison communes. In all cases but one,
enrollments in treatment communes increased more than in comparison
communes,buttheimpactswerenotstatisticallysignificant.
Conclusionandrecommendation
The budget allocations of P135‐II communes and other communes were not
statistically significantly different. While P135‐II communes did receive
substantially more P135 funds than the other communes received, they also
received substantially less non‐P135 support. The reallocation non‐P135 funds
createdamajordifficultyforidentifyingP135impactsandverylikelyresultedin
underestimating the program impacts. These issues should be addressed and
monitored in futureprograms toensure that the fundswillbeallocated to
targetgroupsand that futureprogramsdonotaffect thedecisionsof local
authoritiesonotherresourceallocations.
P135‐IIachievedsignificantsuccessinfosteringaparticipatoryapproachto
implementation, with remarkable corresponding progress in decentralization.
ThesechangesrepresentlargeimprovementscomparedtothefirstphaseofP135

13
and other programs. Beneficiary households participated in every stage of the
projectincludingselection,implementation,supervision,andcontributionstothe
operation and maintenance funds. Financial transparency also improved to a
certainextent.
The target of 100 percent of communes becoming investment owners has not
been achieved and this is still considered a highly challenging task. In addition,
commune‐owned projects still face problems such as slow funds disbursement
and weak capacity. Participation in project supervision and operations and
maintenance activities received the least attention. Thus, the need remains for
local communities to be equippedwith sufficient information, knowledge,
andunderstandingtoexecuteeachactivity.Theseissuesshouldbeconsidered
andaddressedindesigningfutureprograms.
The living standards of households in P135‐II improved in every measured
respectforallethnicgroups.Housingandsanitationconditionsalsoimprovedfor
mostethnicgroups.However,povertyremainshigh,andthelivingstandardofthe
householdsinthesecommunesisstillverylowcomparedtothenationalaverage.
Thepoorerhouseholdsexperiencedlowerincomegrowthratesthanthebetter‐off
households, thus the gap between poor and non‐poor households in these
communes continues to widen. Therefore, further support for poverty
reductioninthesecommunesisstillneededinthecomingyears.
P135‐II significantly improved the living standards of certain beneficiary
householdsinthetargetedcommunes.Whiletheprogramimpactonincomeand
poverty of the Kinh & Hoa ethnic groups is neither large nor statistically
significant, it has large and statistically significant impacts on the income and
poverty rates of ethnic minority groups. Thus, the program successfully
targetedthemostdisadvantagedgroupsintheP135‐IIcommunes.TheP135‐
II communes were generally worse off than non‐P135‐II communes in 2007,
indicatingthattheprogramtargetingwasaccurate.
P135‐IIonlypartlyachieveditstargets.Itreducedthepovertyratefrom57.5%
to49.2%,thoughthetargetratewas30%.Only41%ofhouseholdshaveannual
incomepercapitaofover3.5millionVND,while the target is70%.Netprimary
enrollment and lower secondary enrollment in the targeted communes did
improve but are still far behind the goals (85.4% compared to 95% and 70.9%
comparedto75%,respectively).Inaddition,progresstowardachievementofthe
14
targets varies among different ethnic groups.While sustained improvements in
income and poverty were found in Tay, Nung, Dao, and H’mong groups, less
improvementwas seenamongotherethnic groups, especially theThai.The fact
thatprogrambenefitswerenotequallydistributedamongdifferentethnicgroups
suggeststhatfuturesupporttothesecommunesshouldbebetterdesignedto
accountforthespecificconditions,needs,andcultureofeachethnicgroup.
15
CHAPTER1
INTRODUCTION
Vietnamisoneof themostsuccessfulcountries intheworld intermsofpoverty
reductionandeconomicachievementoverthepasttwentyyears.Thepovertyrate
fell from 58 percent in 1993 to around 14 percent by 20081. Land and trade
reforms are themajor factors that contributed to high and sustained economic
growth;thesearethemainreasonsthreeofeveryfourpoorpeopleescapedfrom
povertyinthisperiod.
However, the rate of poverty reduction has slowed down overtime and the gap
betweentherichandpooriscontinuingtorise.Poorhouseholdsinsomeregions
gainmuchlessfromeconomicgrowththanthebetteroffhouseholds.Mostofthe
remaining poor households live in the remote rural areas which are mainly
populatedbyethnicminorities.The shareof ethnicminorities in thepoorest10
percentofthepopulationhasrisento65percent.2
To increase the opportunities for poor households to benefit from economic
growth, the government has introduced many poverty reduction programs for
specific targetedpoorhouseholdgroupsandregions.Theseprograms includeP‐
135andP30a(improvingthelivingconditionsofethnicminorities),P‐132andP‐
134 (targeted mainly at the Central Highlands to increase access to land and
improve housing conditions), the Hunger and Poverty Eradication Program
(HEPR), and laterNTP‐PR (health insurance for the poor). These programs and
policies have increased the opportunities for poor households to secure the
benefitsofeconomicgrowth,resultinginimprovelivingstandardsandincreased
chancestoescapetopoverty.
However, themost importantquestion“Whatarethe impactsof theseprograms
ontheexpectedoutcomes”hasnotyetbeenansweredindetail.Themainreason
12008VietnamHouseholdLivingStandardsSurvey(VHLSS)
2“WellBegun,NotYetDone:Vietnam'sRemarkableProgressonPovertyReductionandtheEmergingChallenges”,TheWorkBank,2012.
16
is thatwehave limiteddata.Plans for impactevaluationswerenot incorporated
intotheprogramdesigns.Thus,wedonothavetheBaselineandEndlinesurveys
that would have collected required information for impact evaluation. A few
impactevaluationshavebeenconductedusingqualitativemethods,buttheseare
unable to provide concrete answers to the questions “what percentage of the
povertyreductioniscontributedbytheprogramandhowmuchhouseholdincome
growthiscontributedbytheprogram?”3
With the lessons learnt fromP135‐I andotherpoverty reductionprograms, and
with the technical support of UNDP, P135‐II is the first large and ambitious
programhasbeentargetedontheethnicminoritiesandremoteareas.Moreover,
thedesignofP135‐IIincorporatedsoundmethodologyforimpactevaluation.The
mainobjectivesofP135‐IIattheendoftheprogramintargetedareasare:(i)to
reduce thepoverty rate to less than30%; (ii) to ensure thatmore than70%of
households have annual income per capita higher than 3.5million VND; (iii) to
improve agricultural productivity of main crops;(iv) increase the net primary
enrollment rate to at least 95%; (v) to increase the net lower secondary
enrollmentratetoatleast75%.
In order to achieve these ambitiousobjectives, P135‐ IIwas designedwith four
major components: (i) agricultural production support through improving skills
and training the ethnic minorities on new production practices; (ii) support to
develop the infrastructure and then increase the accessibility to basic
infrastructure of the households in the targeted area; (iii) improvement of the
socio‐cultural life and increase the accessibility to public services; (iv) capacity
strengthening by providing local officers with skills and knowledge on
professional and administrative management as well as enhancing their
knowledgeon investmentmanagementandskillsofoperationmanagement.Led
byCEMA,P135‐IIwasimplementedinabout1,600ofthepoorestcommunes;the
totalbudgetfrom2006to2010wasaboutUS$1.1billion.
Themajoraimofthis“ImpactofProgram135‐phaseIIthroughtheLensofBaseline
and Endline Surveys” report is to measure the impact of the program on the
expected economic outcomes of the households, mainly the poverty, income,
agricultureproduction,housingconditions,andaccesstothebasicpublicservices.
3Design,Monitoring,andEvaluationSystemforProgram135PhaseII,DesignofBaselineSurvey,TungPhungDuc,2007.

17
In addition, the report analyses the current situation of all aspects of living
conditions of the ethnic minority households living in the remote and poorest
communes. The findings and lesson drawn from this report could help the
governmentanddonorstodesignandimplementbetterprogramsinthefuture.
While this chapter gives readers an overview of the trend of poverty, poverty
reductionprograms,thenecessityofimpactevaluationwork,thebriefcontentof
P135‐II, Chapter II providesdetails of the impact evaluationdesign, focusingon
thetwomostimportantsurveys:thebaselineandendlinesurveys(BLS2007and
ELS2012). It firstgivestheconcretedescriptionof thesamplingdesignforboth
surveys, including themethod to select the control and treatment groups, data
usedforthesamplingframe,andthemethodusedtoselectthesurveyvillagesand
households.Second,itdiscussesthequestionnairedesignforbothhouseholdand
communequestionnairesincomparisonwiththequestionnairesadministeredby
the Vietnam Living Standard Surveys. The survey implementation for both BLS
2007andELS2012isthendiscussedindetail,includingthesurveyorganization,
quality control, anddataentryandcleaning,aswell as the comparisonbetween
BLS 2007 and ELS 2012. The lessons learned and quality evaluation of these
surveysisthendiscussedintheConclusion.
Chapter III reviews the implementation process of P135‐II and describes the
methodology used to measure the impacts of the program. It analyses the
implementationprocess,theissuesthatariseduringtheimplementationtimethat
couldaffect themethodologyused formeasuring the impactsof theprogramon
theexpectedoutcomes.Fundallocationandadministrativedecisionsthatchanged
communes’controlortreatmentstatusduringthestudyperiodarediscussed.The
viewsofthebeneficiaryhouseholdsontheimpactofP135‐IIarealsoanalysedin
order to have a better view on which outcomes we should focus on. The last
section of this chapter presents the Difference in Difference (DID)method that
wasproposed tomeasure the impactof theprogramat thedesign stageand its
limitations.Theactualmethodologyusedtomeasuretheimpactsisthendiscussed
indetail,andthelimitationsofthemethodologyareaddressed.
Chapter IV analyses the current poverty and living conditions of the ethnic
minorities in the P135‐II communes. It first analyses the overall poverty trends
among the ethnic minorities in comparison with BLS 2007 and the national
average and then it disaggregates the inequality in income between Kinh and
otherethnicgroupstodeterminethemainfactorsthataffectthis inequality.The

18
characteristics of the ethnic minorities are also presented in this chapter,
including living conditions, endowments of productive assets, education, and
access to basic public services and infrastructure. Poverty dynamics of ethnic
minoritiesalsoaddressedinthischapter;thisallowsustohaveaclearviewonthe
degree to which poverty in these communities is transient and on the
sustainabilityofpovertyreductioninthesecommunes.
Chapter V includes two major parts. The first part provides a comprehensive
analysis of the extent towhich capacity strengthening has been enforced at the
local level.Thisgoal isassessedthroughtheperspectiveofbothlocalauthorities
and the beneficiaries. It describes in‐depth capacity building at the local level
through assessment of local training activities and thenprovides an insight into
projectmanagementcapacityanddecentralizationatthelocallevel.Inaddition,it
analyses the outcomes of commune investment ownership and measures
householdparticipation inplanningand implementationstages.Thesecondpart
concentrates on measuring the impacts of the Program on the key outcomes,
including agricultural production, household income, household poverty status,
and access to education and health services, which are important elements of
P135‐IItargets.
Thekeyfindings,conclusions,policyrecommendations,andchallengesforpoverty
reductionareaddressedinChapterVI.
19
CHAPTER2
BASELINESURVEY2007ANDENDLINESURVEY2012
2.1 ObjectivesoftheSurveys
Vietnam has made impressive achievements in economic growth and poverty
reductionoverthepast20years.Partofthisachievementisduetothebigefforts
of the Government through introducing many poverty reduction programs.
However, recent studies show that it is impossible to measure the impacts of
certainprograms,suchastheNationalTargetProgramandProgram135PhaseI.
The reason is that there was no plan for impact evaluation prior to the
implementation of these programs and therefore no baseline survey was
conductedtocollectinformationneededforimpactevaluation.
Program135Phase II (P135‐II) isamajorpovertyalleviationprogramthatwas
implemented during the period of 2006‐ 2010 for the poorest areas where the
main inhabitants are ethnic minorities. Ina substantial effort to evaluate the
effectiveness of P135‐II and to enhance the designs of future programs, the
Committee for EthnicMinorities (CEM),with the support of UNDP, conducted a
baseline survey in 2007 (BLS 2007) and endline survey 2012 (ELS 2012). The
objectives of these surveys were to provide the most comprehensive data sets
focusingonethnicminoritiesthatfacethedeepestpovertyandotherdifficulties.
In fact, thebaselinedata set iswidely cited in themost recent government and
donordocumentsandpublicationsrelatedtopovertyandethnicminorities.
Theavailabilityofcurrentandcomprehensivedataaboutthesegroupsisessential
forthegovernmentanddonorstodevelopevidence‐basedpoliciesforcontinuing
poverty reduction. In particular, these data sets (i) measure the progress in
poverty reduction and advances in socio‐economic status of ethnic minority
communitiesinmountainous,remoteareasofVietnamoverthepast5years;(ii)
allowrigorousanalysisofprogress in thesocio‐economicdevelopmentofethnic

20
minoritycommunitiesparticipatinginP135‐II;(iii)allowmeasurementofchanges
inkey indicators (povertyrate, income,agriculturalproductivity, access tobasic
infrastructure,etc.)attributabletoP135‐II;and(iv)providereliablequantitative
baseline data for designing and measuring the progress of future government
povertyreductionprograms.
This is the first large government program that has adopted a systematic and
professional evaluation procedure. It meets the highest professional standards,
notonlyforthesakeoftheP135‐II,butalsoasanillustrationofthevalueadded
that good evaluations canprovide and candraw the good lessons for upcoming
governmentprograms.
2.2 SurveyDesign
2.2.1 SamplingDesign
Selectionoftreatmentandcontrolcommunes
Themostdifficultpartof impactevaluationdesign is todeveloptheappropriate
samplingdesignforselectionofcontrolandtreatmentgroups.Themainreasonis
that the treatment groups are often not randomly selected because most
development projects and programs deliberately target themost disadvantaged
groups. The target communes in P135‐II are the poorest and most remote
communes and their selectionwasbasedon theirpoverty rates and lackof key
necessary infrastructure foragriculturalproduction.Thequantifiablecriteria for
identifyingP135‐IIcommuneswerebasedonthefollowingindicators.First,lack
ofatleast4of7keyitems:roadssuitableforcarstotraveltocentralcommunes;
atleast50%ofagriculturallandirrigated;presenceofahealthcenter;presenceof
aschoolpresenceofamarket;availabilityofelectricity;atleast50%ofvillagesin
thecommunehaveaccesstocleanwater.Second,thepovertyrateofthecommune
is higher than 30% using the poverty line for 2000 or the poverty rate of the
communeishigherthan55%usingthenewpovertylineof2006.Basedonthese
criteria(inpractice,mainlyonthepovertyrate),1,632communeswereselected
fromamongthe2,359communesofP135‐IforP135‐II.
Based on the availability of resources and the data requirements for testing for
changesofthekeyindicators(povertyandincome),wedeterminedthatasample
of6,000householdswouldbe adequate. Samplehouseholdswere selected from

21
400 communes, ofwhich266weredefinedas treatment communes and134 as
control communes. From the list of 1,632 communes in P135‐II provided by
CEMA, 266 treatment communes were randomly drawn. This selection process
ensured that the sample treatment communes were selected from all over the
provinces included in P135‐II. In fact, 42 out of 45 P135‐II provinces were
included in the sample. The selection of control communes was rather more
complicated and it was the most challenging task. We need to find communes
which are as similar as possible to the sampled treatment communes. Thus,we
usedthe727communesthathad‘graduated’fromtheP135asthepopulationof
controlcommunesfromwhichthesamplewouldbedrawn.4Aprobitregression
model was used to estimate the probability of being selected for P135‐II using
data for 727 graduated communes and 266 selected treatment, based on key
characteristics of each commune (poverty, key infrastructure, and population).
Thegraduatedcommuneswithestimated selectionprobabilitieshigher than the
average were identified as potential communes for the control group. From
amongthese,134communesforthecontrolgroupwereselectedrandomly.
A simple t‐testwasused toexamine thequalityof sample selection.The results
show that the control and treatment communes displayed no significant
differencesinkeyindicatorsofthathadbeenusedasthecriteriaforselectioninto
P135‐II.Thisprovidesevidencethatthesamplingdesignisgoodformeasuringthe
impactoftheProgram.
Selectionofsurveyhouseholds
TheAgricultureCensusof2006wasusedasthesamplingframeforselectingthe
surveyhouseholds.Usingthisdatasetensuresthatwehavethemostupdatedlist
ofhouseholdsinthe400selectedcommunes.Therearetwostepsintheselection
processofthesurveyhouseholds.Thefirststepistoselectthevillages.Basedon
the listofvillages in400selectedcommunes,onevillagewasrandomlyselected
from each commune using the probability proportional to population sampling
method(PPS).Thisselectionmethodwasappliedforbothcontrolandtreatment
groups.
4‘Graduated’communesweretheP135‐IcommunesthatadvancedsufficientlythattheywerenoteligibleforP135‐II.

22
The second step is to select households to interview. To ensure that the survey
covers6000households,wefirstselectedrandomly20householdsfromthelistof
all households in each selected village and then we selected randomly 15
householdsoutof20householdsforofficialinterview.Theremaininghouseholds
(5) are used as the reserve for replacement in cases that the initially selected
householdswerenotavailablefortheofficialinterviewforanyreason.
2.2.2 QuestionnaireDesign
Two questionnaireswere used in these surveys: one for the household and the
other for the commune. Both the household and communequestionnaireswere
developed based on the questionnaires of VHLSS 2006 with some substantial
modifications toreflect thecontentand implementationprocessofP135‐ II (see
NguyenandPhung,2007fordetailsoftheVHLSS).
Thehousehold questionnaire collects information about various aspects of each
household’s socio‐economic conditions.. It includes demographic attributes,
migration, education, health, agriculture, off‐farm and non‐farm employment,
borrowing and saving, remittances, insurance and assets. Questions relevant to
P135‐IIwereincluded.Aspecialmodulewasdesignedtocollectinformationthat
mainly reflects the implementation of the Program at the grass‐root level,
includingawareness,participationofthehouseholdsintheselection,supervision
andimplementationoftheprojects,andthehousehold’sassessmentofthequality,
transparency,andbenefitoftheprojectssupportedbytheP135‐II
TheVHLSS'sectionsongeneralinformation,infrastructureconditions,andaccess
to public services (i.e., schools and healthcare services) are simplified in the
commune questionnaire. New sections to collect information about the
administrative capacity of the commune management board and commune
officers, and the training for capacity building, as well as details about the
commune‐levelprojectscarriedoutoverthepast12monthswereaddedtocollect
allneededinformationforevaluatingtheimplementationofP135‐II.
Using the same questionnaires produces consistency across the two data sets
(2007 and 2012) that is essential for comparison over time. Therefore, the
questionnaires used for BLS 2007 were used in the ELS 2012 with only a few
modifications based on lessons learned from BLS 2007 and for capturing other
impact factors. For example, some questions about shocks households

23
experienced since the survey time in 2007 were added to the household
questionnaire. This information is very important for modeling the impact
process,especiallywhentheshocksarenotrandomlydistributedamongsurveyed
households in the control and treatment groups. Shocks could affect estimated
program impacts if they are not included in the model. The questions that
appeared in BLS 2007 whose information remains unchanged overtime are
excluded.Forinstance,questionsoneducationalbackgroundofpeoplewhowere
nolongerenrolledinschoolatthetimeofthe2007interview,age,dateofbirth,
gender, and race for the householdmemberswhowere interviewed in the BLS
2007 were excluded. These questions were only used for new household
members. The same approach was used to revise the commune questionnaire:
information thatwasunchanged overtimewas eliminated. Questions related to
projects implemented in thecommunewererevisedtoreflectappropriaterecall
periods.
Consultation workshops were organized with policy makers, donors, and
researcherstogetcommentsonthedraftquestionnairesofbothsurveys.Thefinal
draftquestionnaireswerethenpilottestedinthefieldbeforethecompletedand
finalversionswerereleasedforthedatacollectionstage.
2.3 Surveyimplementation
2.3.1Baseline2007
BLS 2007 was implemented by General Statistics Office (GSO). The Social and
EnvironmentalStatisticsDepartment,whichistheimplementingagencyofVHLSS,
was assigned to conduct BLS 2007. The interviewers were recruited from
Provincial Statistics Offices and they are experienced in conducting VHLSS
interviews. Two training courses for interviewers and supervisorswere held in
HanoiandHoChiMinhcities.Theparticipantsweretrainedaboutthepurposesof
the survey, the content of the questionnaires, the interview methods, and the
solutionstoproblemsthatmightoccurinthefield.
LessonslearnedfromVietnamLivingStandardSurvey1998andVHLSSindicated
thatthebestwaytoconductthissurveyistoorganizetheinterviewersbyteams.
BLS 2007 had 21 survey teams. Each team included 1 team leader and 4
interviewerstocollectinformationfromabout300householdsin2or3provinces.
Thedatacollectionstartedon4thSeptember2007andfinishedon25thNovember
24
2007.Toensurethequalityofthedata,10supervisionteamswereorganizedand
eachsupervisionteamsupervised2or3 interviewteams.Asupervisorattended
each interview, re‐checked the data in the completed questionnaires, and
discussedwith the teamanyproblemsor issues thatoccurred in the field; these
discussionsproducedsolutionsforimproveddatacollection.Thesampleincluded
5,965 households which completed the interviews. A very small number of
households(35)couldnotbeinterviewedbecausetheyhadmovedtootherplaces
orrefusedtocooperatewiththeteam.
DataentrywasimplementedbytheStatisticsInformationCenter(SIC)inHanoi.In
order to reduce non‐sampling errors at the data entry stage, double data entry
was applied for this survey. The rawdatawas then converted to STATA format
and data cleaning was implemented by the Social and Environment Statistics
Department.The firstdata setwasdelivered toCEMAon the6th ofMarch2008
(about4monthsaftercompletionofthefieldwork).Thefinaldatawasreadyfor
analysisbyAugust2008(oneyearlater).
During the fieldwork implementation, some issues emerged that might have
affected the quality of the data5. First, the long delay between training and
fieldworkresultedinlossof10interviewers,andGSOhadtorecruitandtrain10
replacement interviewers. This delay might also have resulted in interviewers
forgettingwhattheyhadlearnedfromthetraining,whichmighthaveaffectedthe
qualityofthedata.Second,mostofthesurveylocationswereinremoteareas,and
were very difficult to travel to (some of the survey communes were only
accessible by foot); this made communication between teams and supervisors
difficult.Third,thetimeforconductingthesurveywasnotsuitable,asitextended
intotherainyseason.Thatdelayeddatacollectionanddisruptedtheworkplanof
the teams. Fourth, respondents were mainly ethnic minorities with limited
knowledgeaboutthecontentofthesurvey;moreover,manyofthemcannotspeak
Vietnamese fluently. Many interviews were conducted with the help of local
interpreters.Ifinterpretationwaspoor,thatmightalsohaveaffectedthequality
oftheinterviews.
5 Survey Report of Baseline Survey 2007‐ General Statistics Office‐ Survey Steering Committee of P135‐
II
25
2.3.2Endline2012
Thisprojectrepresentsthefirsttimeanindependentagencyhasbeenassignedto
conduct an endline survey and evaluate the impact of a large government
program. The endline survey 2012 (ELS 2012) was implemented by Indochina
ResearchandConsulting,anindependentconsultingfirm,whichwaschargedwith
conductinganabsolutelyobjective impactevaluation. ImplementationoftheELS
2012wasquite similar to implementationofBLS2007, but benefitted from the
lessonslearnedfromtheBLS2007.Certainmodificationsandimprovementswere
adopted to avoid any problems that had occurred in the BLS 2007. Details of
interviewteamselectionandtraining,andinterviewimplementationareprovided
inthenextparagraphs.
First, 30% of the BLS 2007 interviews were implemented with the support of
interpreters. Therefore, interviewers for ELS 2012 were recruited from among
Kinh and ethnic minorities represented in the sample communes. The ethnic
minority interviewers received the same training as the other team members.
Thus,whentheyinterviewedthenon‐Vietnamese‐speakingrespondents,thetime
taken for the interviews and the possibility of non‐ sampling errors were both
reduced.
Second,thetrainingmethodemphasizeddevelopingtheskillsoftheinterviewers
andgainingtrustfromthesamplehouseholds.Attheendoftraining,anexamwas
givenandonly interviewerswhopassedtheexamwereselectedtoconductdata
collection.
Third, the basic information from BLS 2007 was extracted, including the
householdmember list,key informationofhouseholdmemberssuchasage,sex,
education, occupation, etc. The interviewers reviewed this information before
doingtheinterview.Havingthisinformationonhandinadvancewasveryhelpful
forinterviewerstoidentifyandcheckdoubtfulanswersandtherebyimprovethe
qualityofthedata.
Fourth,adetailedworkplanwithassignedtasksforeachteammemberwerewell‐
developed in advance and sent to each team aswell as the CEMAofficers at all
levelstwoweeksbeforetheteamswenttothefield.Logisticalpreparationswere
supportedbyCEMAatalllevelstoensurethesurveywasconductedaccordingto
theworkplanandinterviewerswereabletoreachtherightrespondents.
26
Fifth, strict supervisionwas carried out throughout the data collection process.
Apart from attending the interviews, supervisors conducted random checks on
householdstomakesurethatallinterviewersfollowedtheinterviewprocedures
and recorded accurate information. Supervision work was circulated from one
teamtoanother.A“hotline”wassetupandavailableatalltimesforinterviewers
tocontactwhentheyhadquestionsrelatingtotechnicalorlogisticalissues.
Sixth,ELS2012usedtabletPCsfordataentryduringtheinterviews.Thiswasthe
firsttimethenewsurveytechniquewasappliedonsuchalargeandcomplicated
surveyinVietnam.Eachsurveyteamhadtwotabletsforconductingthesurveys;
theyrotatedamongtheteammembersduringeachsurvey.Withhigh‐technology
design, the application of tablets ensured high‐quality data andminimized non‐
sampling errors normally associated with data entry. The tablet technology
incorporated survey software applications, GPS, and internet capabilities to
ensure that thedatawerecollected in themostaccuratepossible fashion, in the
shortesttimeunderthebestqualitycontrol.Thedatawereentereddirectlyduring
theinterviewinsteadofusingapaperquestionnaire.With3G‐internetcapability,
theentereddatawastransmitteddirectlybacktoanonlineserverforimmediate
datachecking.Thisprocedureeliminated thedataentrystageand increasedthe
efficiencyofdatacleaning.Asthesurveysoftwarewasprogrammedtoimplement
logicalchecking,datacleaningcouldbedonesimultaneouslyduring the fieldtrip
period. The survey managers could provide feedback to enumerators for data
correctioninatimelymanner.Withthisfeature,non‐samplingerrorsweregreatly
reduced. Application of tablet technology with GPS and internet capabilities
ensuredqualitycontrolthroughouttheprocess.Thistechnologyalsoenabledusto
monitor the enumerators’ work as the application automatically recorded the
interview’sstartingandendingtimes,sowewereinformedofwhetherthesurvey
was properly done in terms of timing. The application also recorded the
coordinatesofthelocationwheretheinterviewtookplace.Thistechnologyhelped
surveymanagers and supervisors tomonitor each team and to ensure that the
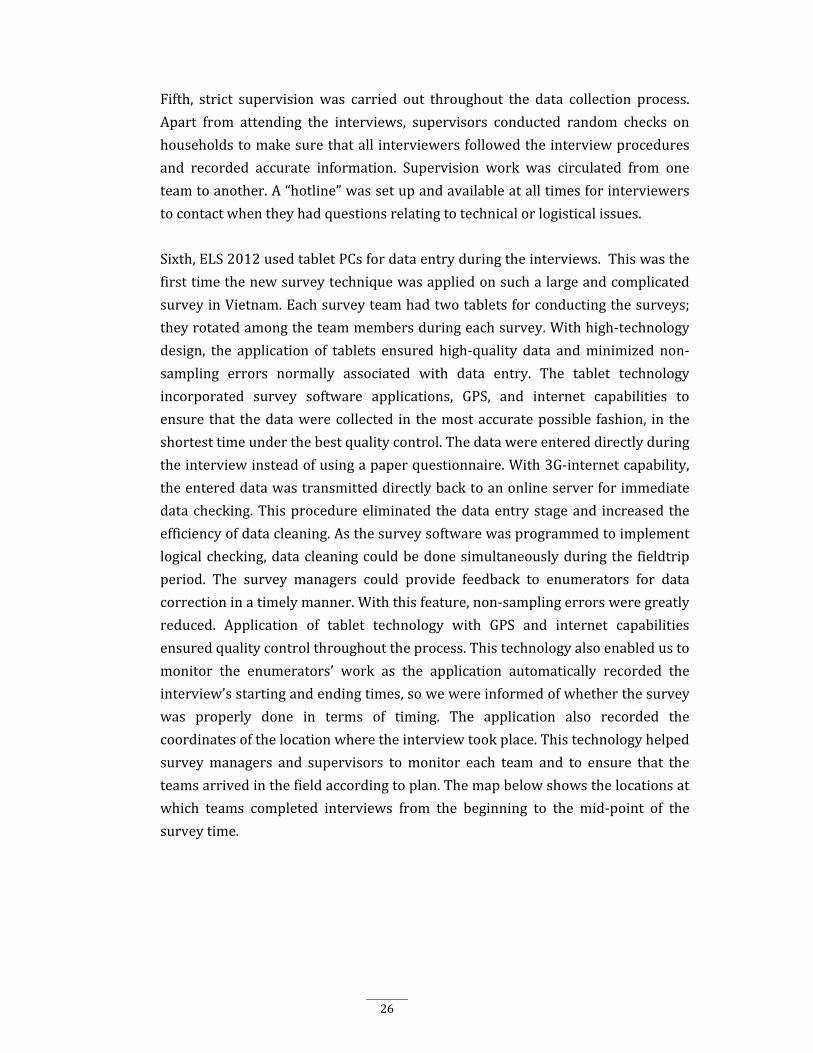
teamsarrivedinthefieldaccordingtoplan.Themapbelowshowsthelocationsat
which teams completed interviews from the beginning to the mid‐point of the
surveytime.
27
Figure2.1:LocationsatofP135‐IIEndlinesurveyinterviewers
Last,theELS2012wasconductedfromearlyApriltotheendofMay2012soasto
avoid the rainy season. The timing reduced problems related to logistical
arrangementsandtraveltimeforthesurveyteams.
Applyingthenewsurveytechniquesandsolutionsforimprovementofthesurvey
implementation,ELS2012 fieldworktookabout twomonths to interview5,668
households.TheattritionratefromBLS2007wasabout5.2%after5years,which
wasmuchlowerthantheattritionrateexperiencedbyVHLSS,partlyreflectingof
the careful logistical arrangements and lower rates of migration in the remote
areas.WhiledataentryandcleaningforBLS2007tookmorethan5months, for
ELS2012ittookonlyonemonthtocompletethedatacleaninganddisseminates
initialfindings.
Despite careful planning, several issues still arose during the fieldwork for ELS
2012. In particular, travel to several communes was quite difficult: teams
sometimes had to walk or go by boat to the survey communes. Also, in some
communes, the knowledge of respondents was so limited that it might have
affectedthequalityoftheinterview.

28
2.4 Conclusion
ThisisthefirsttimethatanimportantpovertyreductionprograminVietnamhas
beenexposedtoasoundandprofessional impactevaluation.Thevalueaddedof
thisimpactevaluationconsistslargelyofthelessonsthatcanbedrawnforfuture
governmentanddonorprograms.
BLS2007andELS2012werewell‐designedand implemented,andtheyprovide
richandhighqualitydatathatsupportimpactevaluationofP135‐IIandanalysis
the program implementation. These data sets are the most complete and
comprehensive data sets on ethnicminorities and on the poorest communes in
Vietnam. As such, they provide a thorough understanding of ethnic minorities’
socioeconomic situations. The data sets are large enough to disaggregate ethnic
minoritiesintoatleast10differentgroups.Therefore,theyhelpustounderstand
the differences inmany aspects of living conditions and livelihood among these
ethnicgroups.
TheBLS2007showedthattreatedcommunes(i.e.,thosechosenforP135‐II)area
bitpoorerand less likely tohave car roads, electricity, andculturalhouses than
the control communes.This constitutes evidence thatP135_II targeted the right
communes; however, it also indicates the need to control the impact of other
factorsinestimatingtheprogramimpact.Inotherwords,thesimpleDifferencein
Difference method must be augmented by appropriate econometric control
methodology.
29
CHAPTER3
REVIEWTHEIMPLEMENTATIONOFP135‐IIAND
METHODOLOGYTOMEASURETHEIMPACT
3.1 Introduction
This chapter analyses the implementation process of P135‐ II, focusing on thebudget allocation from Program and from other projects or programs betweenP135‐ II communes and non‐ P135‐ II communes. In addition, evaluation ofbeneficiary households about the impact of the Program on expected outcomesand the importantofdifferentprojectsprovidedbydifferent componentsof theProgram is analysed. We develop the hypothesis about the impact of differentcomponents of the Program for the whole process from output, outcome, toimpact.TheresultsoftheseanalysishelpstoidentifytheoutcomesthatProgrammight have impacts and to consider and re‐ evaluate the impact evaluationmethodology proposed at the design stage of the Program andBaseline Survey.Thus,wecoulddeveloptheappropriateimpactevaluationmethodandidentifytheindicators that could measure the impact of the Program in the econometricmodels. This chapter mainly focusses on the description of impact evaluationmethodology.Therefore, thereareseveral statisticalandeconometrical termsaswellaseconometricmodelsthatrequirethereadershaveabasiceconometrictofullyunderstandthemeasurementmethod.Wetrytopresentinthemostsimplewayaboutmethodology.However, itmightbe still hard for readerswhodonothave basic statistic knowledge. For those readers, they could skip this skip themethodologysectionanditdoesnotaffectedthemajorcontentsofthereport.
3.1.1 ControlandTreatmentCommunes
Table 3.1 show that the authorities switched a comparison commune intotreatmentcommunestatusandvice‐versa from2006to theendof theProgram.Thus, some communes transitioned from comparison to treatment status orgraduatedfromtreatmentstatusbetweenthetwosurveys.

30
Table3.1:TransitionMatrixbetweenControlandTreatmentCommunes
StatusinEachYearn Code T1 T2 TP
2006 2007 2008 2009 2010 2011 2012
C C C C C C C 98 1 0 0 0
C T T T T T T 1 2 0 1 ⋯
C C T T T T T 30 3 0 1 ⋯
C C C T T T T 1 4 0 1 ⋯
T T T T T T T 247 5 1 1 1
T T C C C C C 17 6 1 0 ⋯
T T T T C C C 2 7 1 0 ⋯
T T T T T C C 2 8 1 0 ⋯
Source:AnalysisTeamcalculationsbasedon2007and2012householdsurveys.
The fact that some communes switched status complicated the assignment of
treatmentindicatorsfortheimpactevaluation.Threepossibilitieswereexplored
in preliminary analysis: an indicator for treatment status in 2006 (T1); an
indicator for treatment status in 2012 (T2); and a conventional treatment
indicatorforthesubsetofcommunesthatneverswitchedstatus(TP).From 2006
to the end of the Program, there are about 21 graduated communes and 30 control
communes at the beginning of the P135- II became to Treatment communes. Therefore,
we have only 98 purely control communes and 247 purely treatment communes.
Therefore, These communesare cleanest definitionof control / treatment status
andtheyaremostappropriatecommunesusedforimpactmeasurement.
3.1.2 ComparisonofFundsAllocationAcrossTreatmentandControl
Communes
The potential impact of P135‐II depends on the degree to which it enhances
resourceavailabilitytotargetcommunes.Thisissuemaybeparticularlycrucialin
the current study, in light of the possibility that the authorities reallocate non‐
P135 funds from P135 communes to non‐P135 communes to compensate the
latterbecausetheywerenotincludedinP135.
Section 5 of the commune questionnaire records data on commune economic
developmentprojectsandtheirfunding.Comparisonandtreatmentcommunesall
receiveP135 funding. ThedatadonotdistinguishbetweenP135‐I andP135‐II,
butprojectsundertaken inmore recentyears are likely tohavebeen fundedby
31
P135‐II,thuswefocusonprojectsundertakenduring2006–2012.Wecalculated
cumulativenetfundingfor2006–2012;fundsforprojectsendingafter2012were
pro‐ratedtoestimatetheexpendituresupto2012.6Averagefundingisdisplayed
inthefollowingtable3.2.
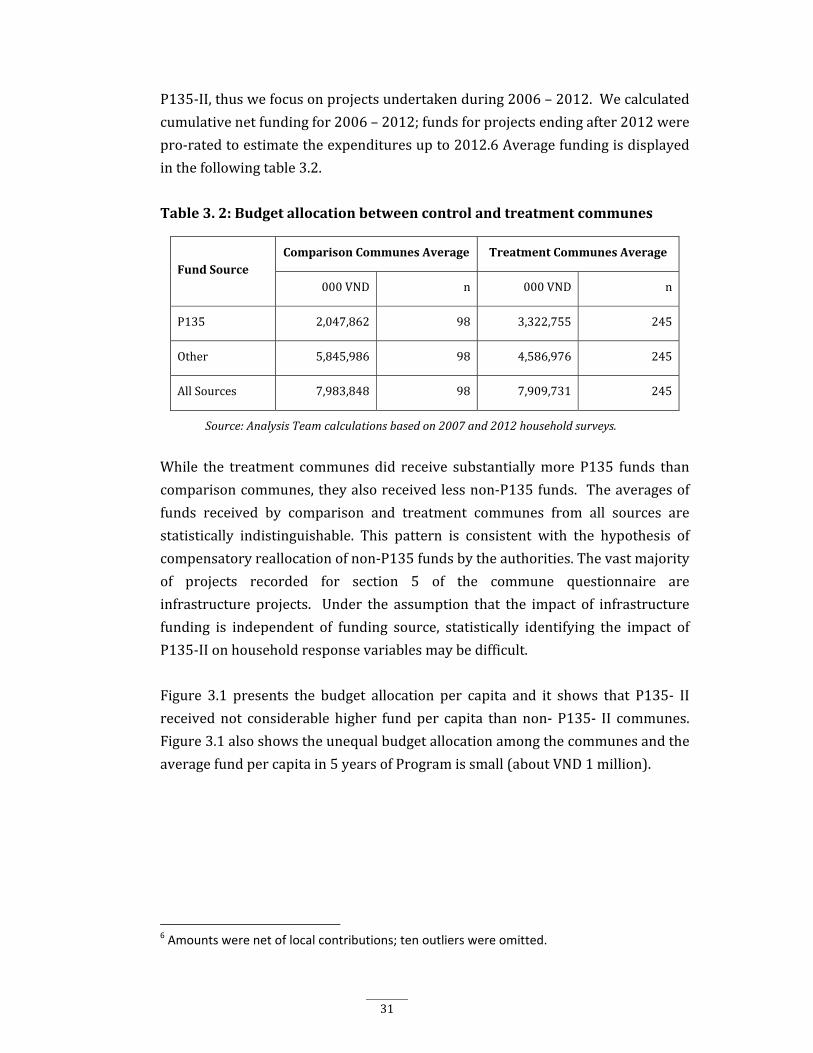
Table3.2:Budgetallocationbetweencontrolandtreatmentcommunes
FundSourceComparisonCommunesAverage TreatmentCommunesAverage
000VND n 000VND n
P135 2,047,862 98 3,322,755 245
Other 5,845,986 98 4,586,976 245
AllSources 7,983,848 98 7,909,731 245
Source:AnalysisTeamcalculationsbasedon2007and2012householdsurveys.
While the treatment communes did receive substantiallymore P135 funds than
comparisoncommunes,theyalsoreceivedlessnon‐P135funds. Theaveragesof
funds received by comparison and treatment communes from all sources are
statistically indistinguishable. This pattern is consistent with the hypothesis of
compensatoryreallocationofnon‐P135fundsbytheauthorities.Thevastmajority
of projects recorded for section 5 of the commune questionnaire are
infrastructure projects. Under the assumption that the impact of infrastructure
funding is independent of funding source, statistically identifying the impact of
P135‐IIonhouseholdresponsevariablesmaybedifficult.
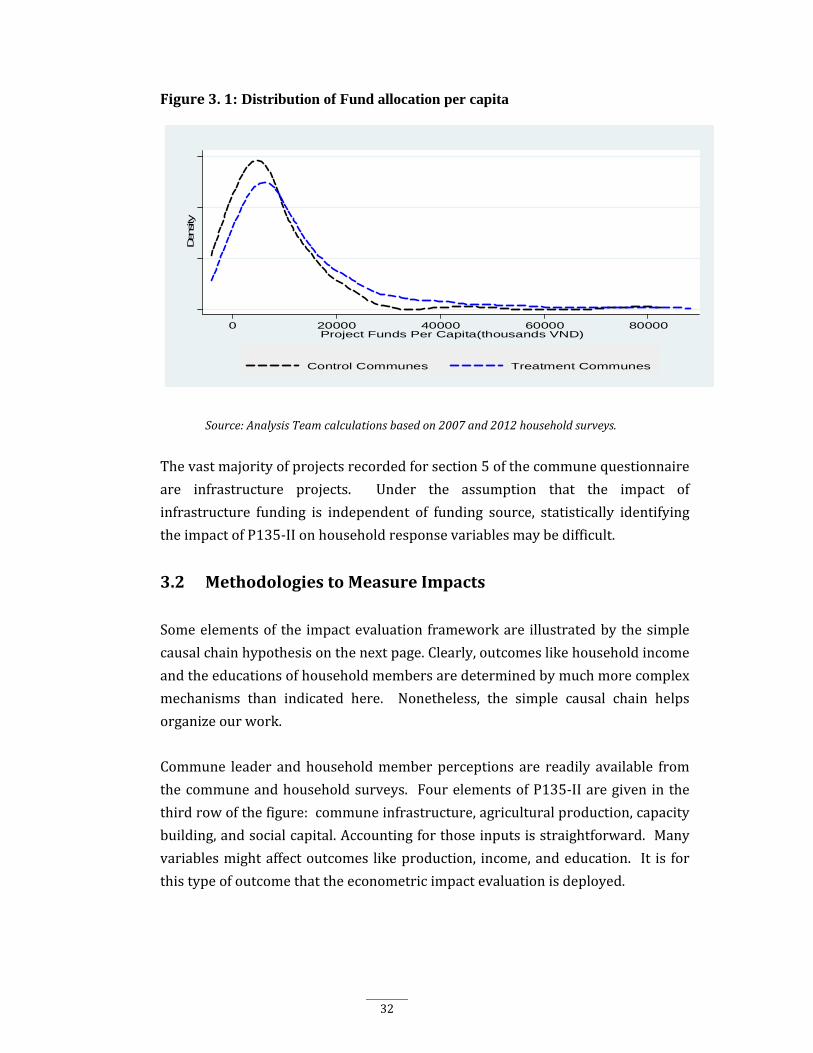
Figure 3.1 presents the budget allocation per capita and it shows that P135‐ II
receivednot considerablehigher fundper capita thannon‐ P135‐ II communes.
Figure3.1alsoshowstheunequalbudgetallocationamongthecommunesandthe
averagefundpercapitain5yearsofProgramissmall(aboutVND1million).
6 Amounts were net of local contributions; ten outliers were omitted.
32
Figure3.1: Distribution of Fund allocation per capita
Source:AnalysisTeamcalculationsbasedon2007and2012householdsurveys.
Thevastmajorityofprojectsrecordedforsection5ofthecommunequestionnaire
are infrastructure projects. Under the assumption that the impact of
infrastructure funding is independent of funding source, statistically identifying
theimpactofP135‐IIonhouseholdresponsevariablesmaybedifficult.
3.2 MethodologiestoMeasureImpacts
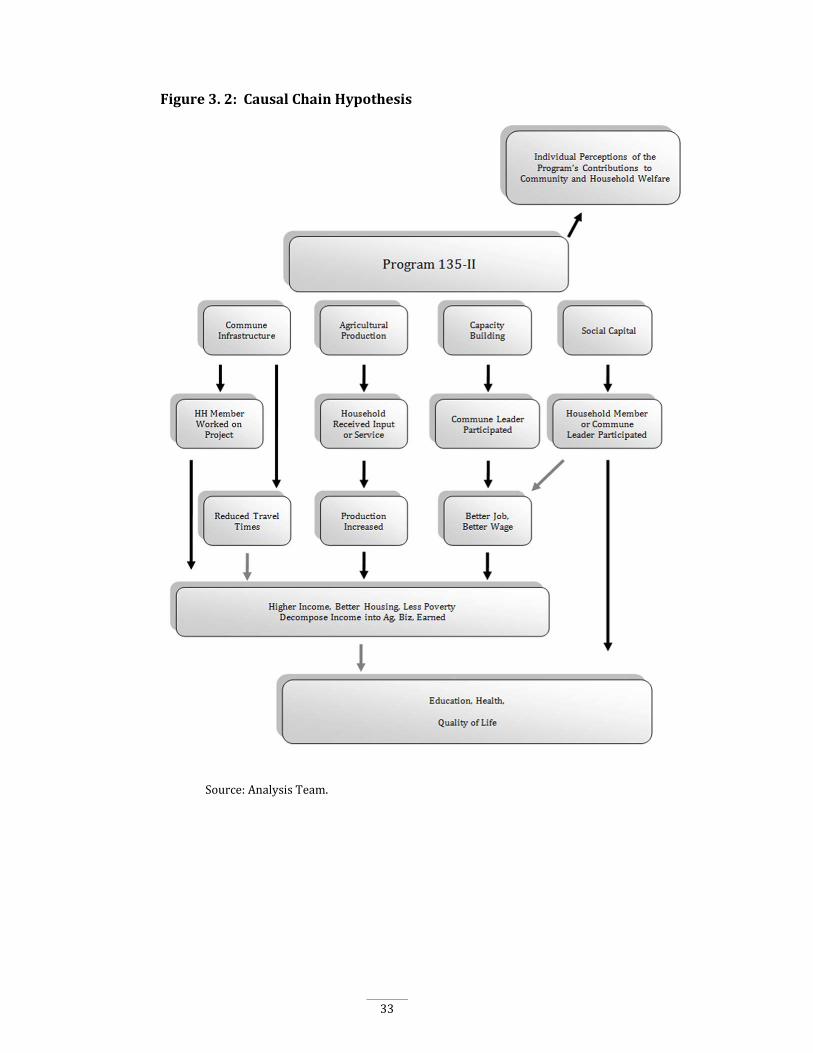
Someelementsof the impactevaluationframeworkare illustratedbythesimple
causalchainhypothesisonthenextpage.Clearly,outcomeslikehouseholdincome
andtheeducationsofhouseholdmembersaredeterminedbymuchmorecomplex
mechanisms than indicated here. Nonetheless, the simple causal chain helps
organizeourwork.
Commune leader andhouseholdmemberperceptions are readily available from
thecommuneandhouseholdsurveys. FourelementsofP135‐IIaregiven inthe
thirdrowofthefigure:communeinfrastructure,agriculturalproduction,capacity
building,andsocialcapital.Accountingforthoseinputsisstraightforward.Many
variablesmightaffectoutcomes likeproduction, income,andeducation. It is for
thistypeofoutcomethattheeconometricimpactevaluationisdeployed.
Den
sity
0 20000 40000 60000 80000Project Funds Per Capita(thousands VND)
Control Communes Treatment Communes
33
Figure3.2:CausalChainHypothesis
Source:AnalysisTeam.
34
3.2.1 ViewsoftheBeneficiaries
Assessing thedegree towhichsurveyrespondentsareawareofP135‐IIand the
activitiesitsupports,andthedegreetowhichsurveyrespondentsperceiveP135‐
IIisbeneficialtothemisstraightforward.
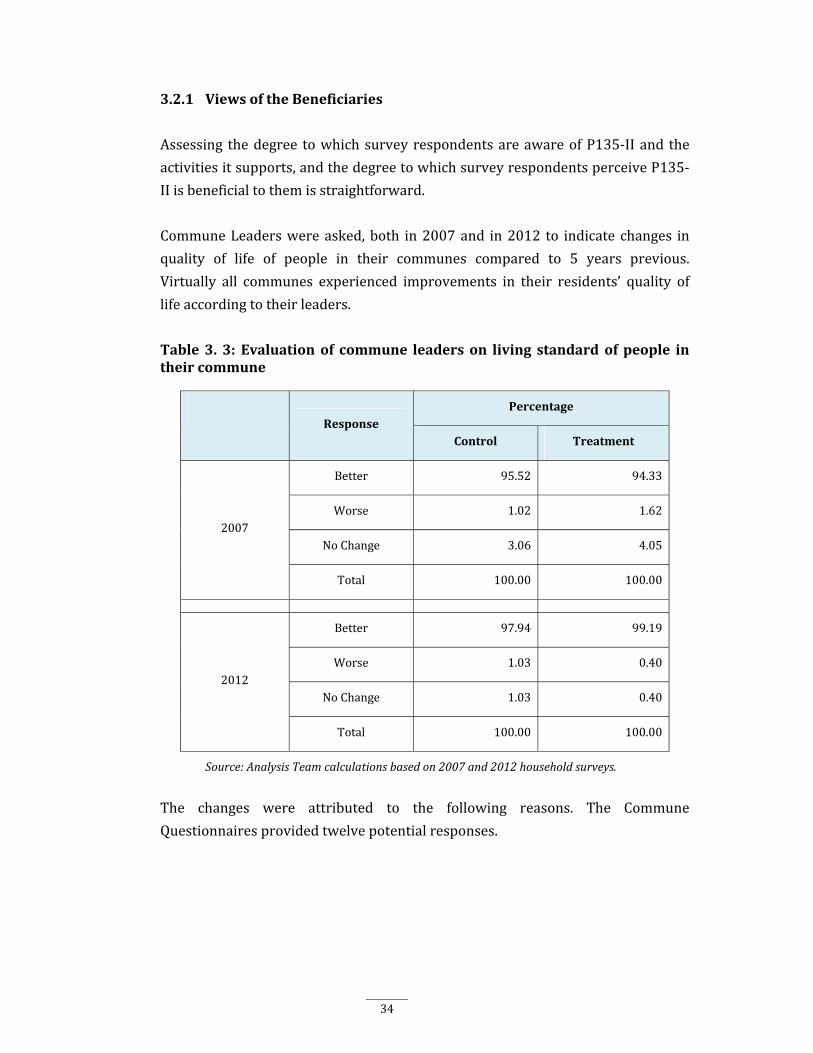
CommuneLeaderswereasked,both in2007and in2012 to indicate changes in
quality of life of people in their communes compared to 5 years previous.
Virtually all communes experienced improvements in their residents’ quality of
lifeaccordingtotheirleaders.
Table3.3:Evaluationofcommune leaderson livingstandardofpeople intheircommune
Response
Percentage
Control Treatment
2007
Better 95.52 94.33
Worse 1.02 1.62
NoChange 3.06 4.05
Total 100.00 100.00
2012
Better 97.94 99.19
Worse 1.03 0.40
NoChange 1.03 0.40
Total 100.00 100.00
Source:AnalysisTeamcalculationsbasedon2007and2012householdsurveys.
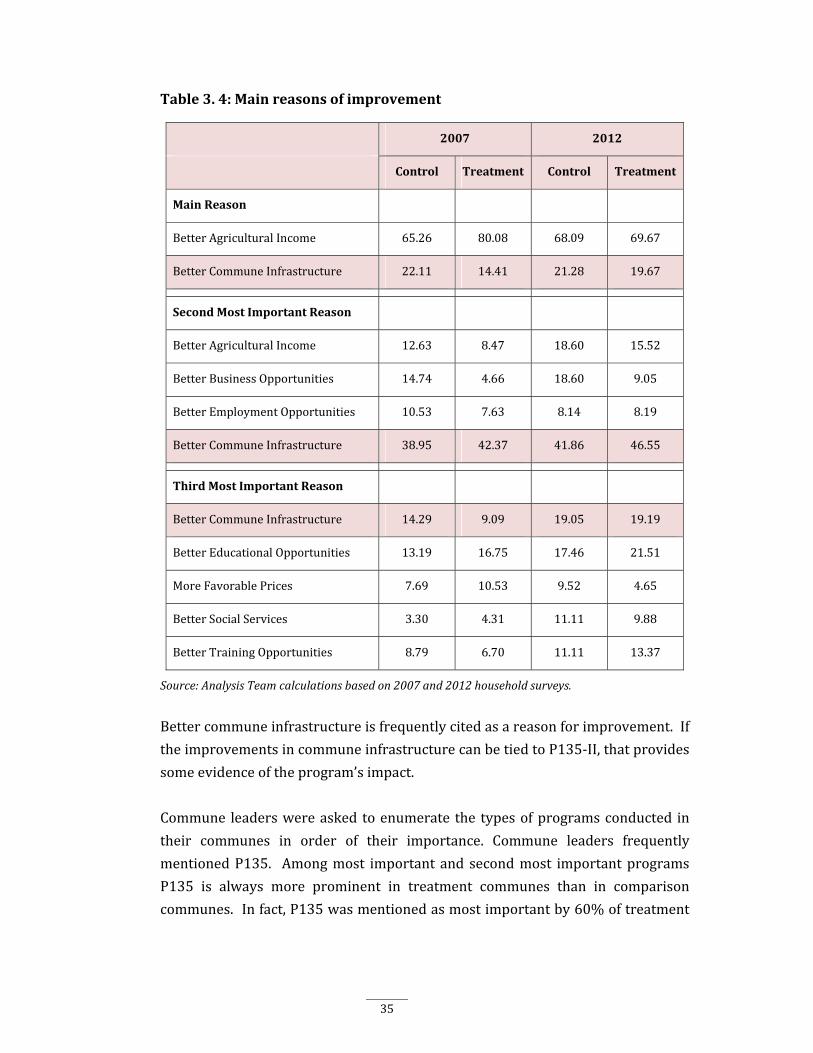
The changes were attributed to the following reasons. The Commune
Questionnairesprovidedtwelvepotentialresponses.
35
Table3.4:Mainreasonsofimprovement
2007 2012
Control Treatment Control Treatment
MainReason
BetterAgriculturalIncome 65.26 80.08 68.09 69.67
BetterCommuneInfrastructure 22.11 14.41 21.28 19.67
SecondMostImportantReason
BetterAgriculturalIncome 12.63 8.47 18.60 15.52
BetterBusinessOpportunities 14.74 4.66 18.60 9.05
BetterEmploymentOpportunities 10.53 7.63 8.14 8.19
BetterCommuneInfrastructure 38.95 42.37 41.86 46.55
ThirdMostImportantReason
BetterCommuneInfrastructure 14.29 9.09 19.05 19.19
BetterEducationalOpportunities 13.19 16.75 17.46 21.51
MoreFavorablePrices 7.69 10.53 9.52 4.65
BetterSocialServices 3.30 4.31 11.11 9.88
BetterTrainingOpportunities 8.79 6.70 11.11 13.37
Source:AnalysisTeamcalculationsbasedon2007and2012householdsurveys.
Bettercommuneinfrastructureisfrequentlycitedasareasonforimprovement.If
theimprovementsincommuneinfrastructurecanbetiedtoP135‐II,thatprovides
someevidenceoftheprogram’simpact.
Commune leaderswereasked toenumerate the typesofprogramsconducted in
their communes in order of their importance. Commune leaders frequently
mentionedP135. Amongmost importantand secondmost importantprograms
P135 is always more prominent in treatment communes than in comparison
communes.Infact,P135wasmentionedasmostimportantby60%oftreatment
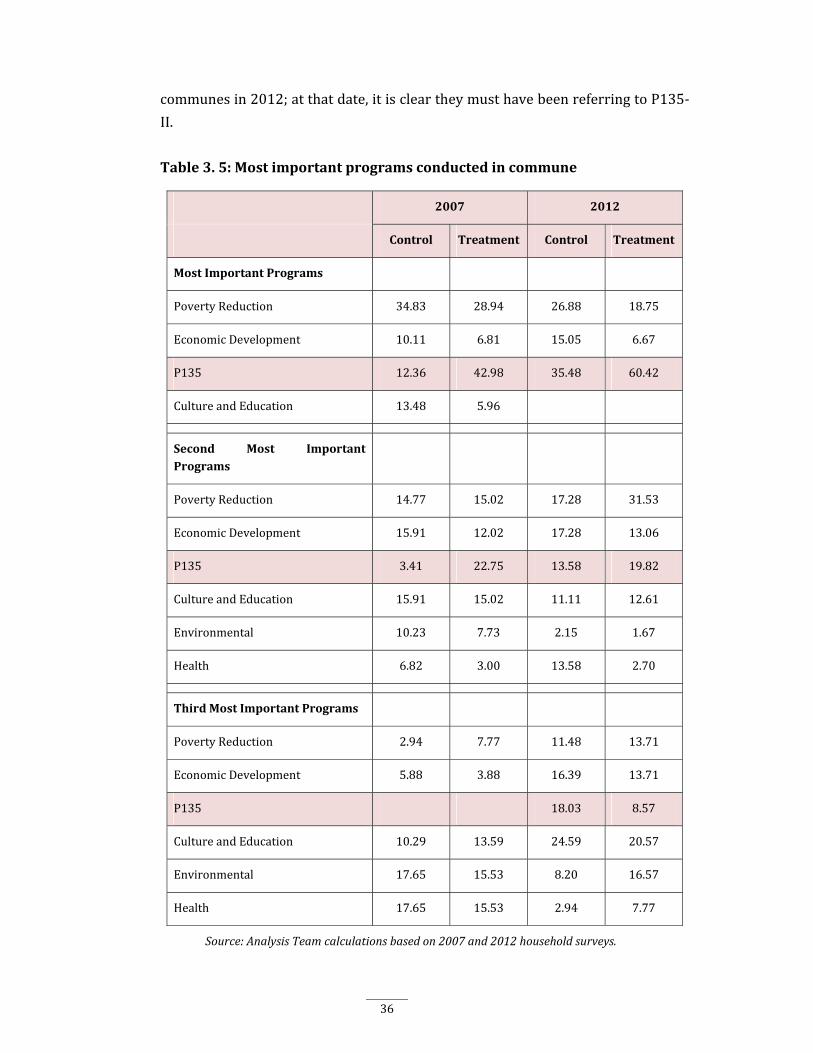
36
communesin2012;atthatdate,itiscleartheymusthavebeenreferringtoP135‐
II.
Table3.5:Mostimportantprogramsconductedincommune
2007 2012
Control Treatment Control Treatment
MostImportantPrograms
PovertyReduction 34.83 28.94 26.88 18.75
EconomicDevelopment 10.11 6.81 15.05 6.67
P135 12.36 42.98 35.48 60.42
CultureandEducation 13.48 5.96
Second Most ImportantPrograms
PovertyReduction 14.77 15.02 17.28 31.53
EconomicDevelopment 15.91 12.02 17.28 13.06
P135 3.41 22.75 13.58 19.82
CultureandEducation 15.91 15.02 11.11 12.61
Environmental 10.23 7.73 2.15 1.67
Health 6.82 3.00 13.58 2.70
ThirdMostImportantPrograms
PovertyReduction 2.94 7.77 11.48 13.71
EconomicDevelopment 5.88 3.88 16.39 13.71
P135 18.03 8.57
CultureandEducation 10.29 13.59 24.59 20.57
Environmental 17.65 15.53 8.20 16.57
Health 17.65 15.53 2.94 7.77
Source:AnalysisTeamcalculationsbasedon2007and2012householdsurveys.
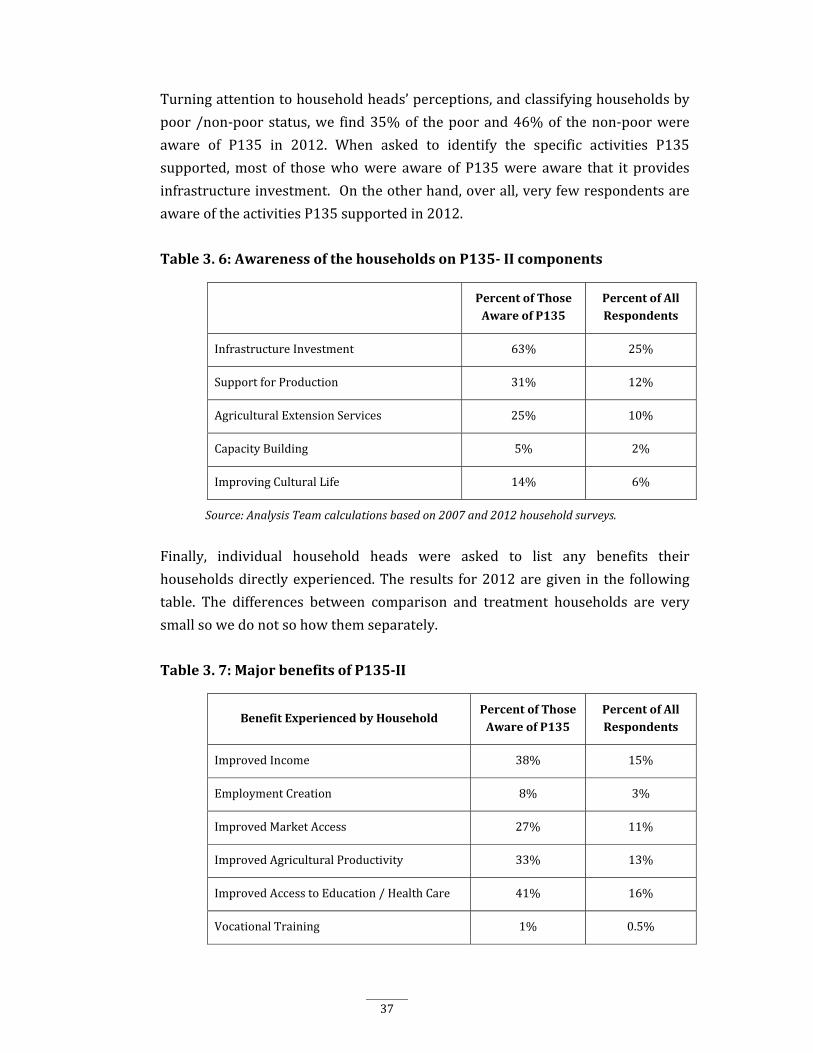
37
Turningattentiontohouseholdheads’perceptions,andclassifyinghouseholdsby
poor/non‐poor status,we find35%of thepoorand46%of thenon‐poorwere
aware of P135 in 2012. When asked to identify the specific activities P135
supported,most of thosewhowere aware of P135were aware that it provides
infrastructureinvestment. Ontheotherhand,overall,veryfewrespondentsare
awareoftheactivitiesP135supportedin2012.
Table3.6:AwarenessofthehouseholdsonP135‐IIcomponents
PercentofThoseAwareofP135
PercentofAllRespondents
InfrastructureInvestment 63% 25%
SupportforProduction 31% 12%
AgriculturalExtensionServices 25% 10%
CapacityBuilding 5% 2%
ImprovingCulturalLife 14% 6%
Source:AnalysisTeamcalculationsbasedon2007and2012householdsurveys.
Finally, individual household heads were asked to list any benefits their
householdsdirectlyexperienced.Theresults for2012aregiven in the following
table. The differences between comparison and treatment households are very
smallsowedonotsohowthemseparately.
Table3.7:MajorbenefitsofP135‐II
BenefitExperiencedbyHouseholdPercentofThoseAwareofP135
PercentofAllRespondents
ImprovedIncome 38% 15%
EmploymentCreation 8% 3%
ImprovedMarketAccess 27% 11%
ImprovedAgriculturalProductivity 33% 13%
ImprovedAccesstoEducation/HealthCare 41% 16%
VocationalTraining 1% 0.5%

38
Material/MachinesforAgriculturalProduction
10% 4%
OtherBenefit 6% 2%
NoBenefit 18% 7%
Source:AnalysisTeamcalculationsbasedon2007and2012householdsurveys.
It seems fair to say that a program which 15% of all respondents credit forincreased incomehashadapositive impact; similarly for the11% thatperceiveimprovedmarket access, 13% that perceive improved agricultural productivity,and16%thatlinkimprovedaccesstoeducationandhealthcaretotheprogram.
Weclosethissectionwithasummaryoftheworking‐ageadultsdirectlyemployed
in commune‐level infrastructure projects. Table 3.8 shows that about 12% of
workingageadultsworkoninfrastructureprojectsincomparisoncommunesand
11% of working age adults work on infrastructure projects in treatment
communes. This similarity is not surprising given the fact that average
infrastructurespendingisthesameamongcomparisonandtreatmentcommunes.
Theproportionsof thoseworkingon infrastructureprojectswhobelongtopoor
households reflect the proportions of poor households in comparison and
treatmentcommunes.
Table3.8:WorkingonInfrastructureProjects
GroupControl
CommunesTreatmentCommunes
P‐valueforDifference
SampleSize
%ofWorking‐ageAdultsWhoworkonInfrastructureProjects
12.05 11.46 0.06 49,354
%ofWorking‐ageAdultsofPoorHHWhoWorkonInfrastructureProjects
11.52 11.11 0.36 28,006
%ofWorking‐ageAdultsWhoBelongtoPoorHH
46.32 61.96 0.00 52,865
% of Working on InfrastructureProjectsWhoBelongtoPoorHH
43.50 59.27 0.00 5,737
Source:AnalysisTeamcalculationsbasedon2007and2012householdsurveys.
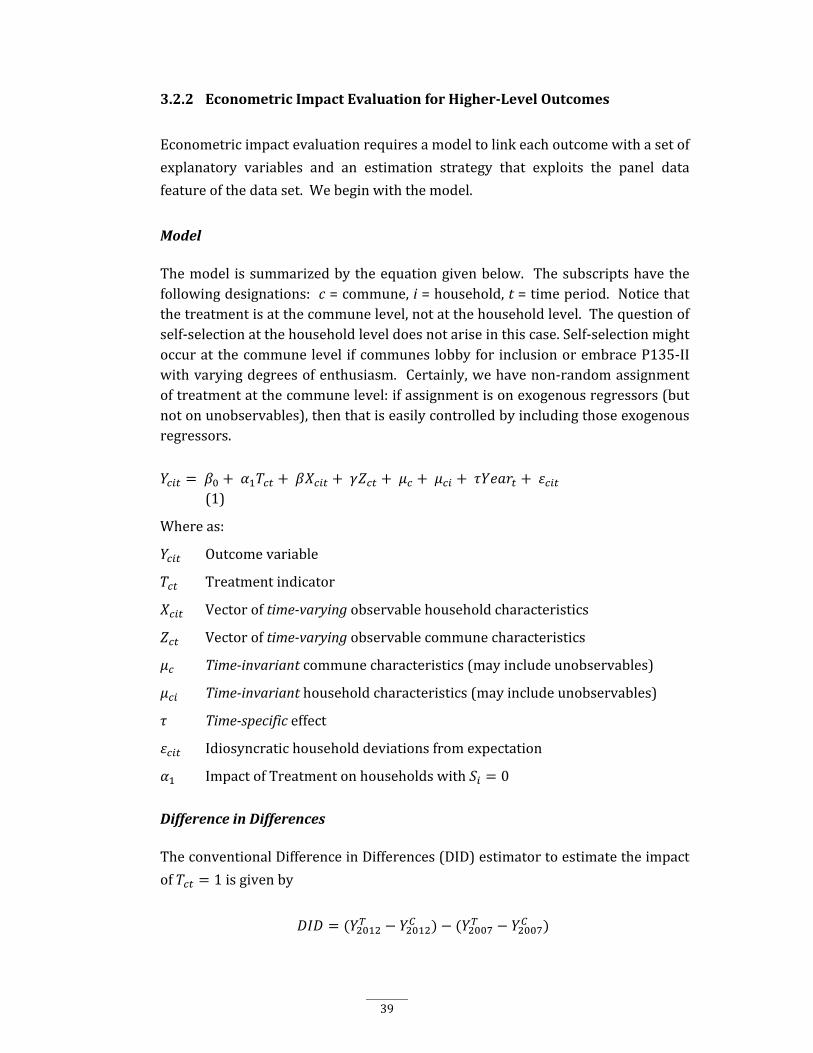
39
3.2.2 EconometricImpactEvaluationforHigher‐LevelOutcomes
Econometricimpactevaluationrequiresamodeltolinkeachoutcomewithasetof
explanatory variables and an estimation strategy that exploits the panel data
featureofthedataset.Webeginwiththemodel.
Model
Themodel issummarizedbytheequationgivenbelow. Thesubscriptshavethefollowingdesignations:c=commune,i=household,t=timeperiod.Noticethatthetreatmentisatthecommunelevel,notatthehouseholdlevel.Thequestionofself‐selectionatthehouseholdleveldoesnotariseinthiscase.Self‐selectionmightoccuratthecommunelevel ifcommunes lobbyfor inclusionorembraceP135‐IIwithvaryingdegreesofenthusiasm. Certainly,wehavenon‐randomassignmentoftreatmentatthecommunelevel:ifassignmentisonexogenousregressors(butnotonunobservables),thenthatiseasilycontrolledbyincludingthoseexogenousregressors.
(1)
Whereas:
Outcomevariable
Treatmentindicator
Vectoroftime‐varyingobservablehouseholdcharacteristics
Vectoroftime‐varyingobservablecommunecharacteristics
Time‐invariantcommunecharacteristics(mayincludeunobservables)
Time‐invarianthouseholdcharacteristics(mayincludeunobservables)
Time‐specificeffect
Idiosyncratichouseholddeviationsfromexpectation
ImpactofTreatmentonhouseholdswith 0
DifferenceinDifferences
TheconventionalDifferenceinDifferences(DID)estimatortoestimatetheimpact
of 1isgivenby

40
or .
The DID estimator of the program impact is valid if the time‐varying
characteristics and areuncorrelatedwithtreatment 1. Thiswould
be the case if assignment toP135‐IIhadbeen random. However, the treatment
communeswerenotrandomlyselected,sothatassumptionishighlyquestionable.
Wemaycontrolforcharacteristics and byrunningtheregressionspecified
by equation (1), using the panel data nature of our data to control for the
unobservablesin and .
FixedEffectsTransformation
Thefixed‐effects(FE)transformationsweepsoutalltime‐invariantcharacteristics
listed in equation (1), including those that are unobservable. Re‐write the
equationas:
, (2)
where
12
illustratesthetransformationthatisappliedtoeachvariable. PooledOLSonthe
transformedmodelyieldsconsistentestimatorsofthecoefficients.Noticethatthe
transformation does not sweep out the time‐specific effects, so fixed‐effects
estimationmustincludeatime‐dummy.
Theimpactestimate,istheestimatedpartialregressioncoefficientonthedummy
variablethatrepresentstreatment:
.
Estimation
A set of plausible control variables is selected for each response variable under
consideration. The set of control variables is narrowed‐down by stepwise
deletion:theleastsignificantvariableisdeletedandthemodelre‐estimateduntil
allremainingcontrolsaresignificantatthe40%level.Thehighsignificancelevel
isusedtoguardagainstTypeIIerror,whichwouldleadtoomittedvariablesbias.
41
Limitations
Theprimary limitation of fixed‐effects panel data estimation is the fact that the
differencedregressorsoftenhavemuchlessvariationthantheregressorsinlevel
form.Asaresult,theestimatedcoefficentsmaybeestimatedwithpoorprecision
andmaythereforebestatisticallyinsignificant.
3.3 Conclusion
During the implementation process, there are some communes graduated and
moved out of the Program, while some control communes become treatment
communes. This switched status created the difficulty and complication for
developing the appropriate impact measurement methodology and accuracy of
estimations.Itreducesthesamplesizeofbothcontrolandtreatmentgroupsthus
reducespoweroftestingandaffectsmeasurementofimpactsconsiderably.
Budget allocation between P135‐ II commune and non‐ P135‐ II commune are
insignificantdifference.While theP135‐ IIcommunetends toreceivemore fund
fromProgramcompared tonon‐P135‐ II, it receivesmuch less fund fromother
programs, projects and government budget than non‐ P135‐ II. Local authority
(districtandprovincial levels)oftenreallocateotherfundsfromP135‐IItonon‐
P135‐ II for compensation is the major reason. Potential impact of P135‐ II
depends on the budget enhancement for these communes so the reallocation of
budgetfornon‐P135‐IIcommunescouldcreatetheconstraintformeasuringthe
impactoftheProgramandmightunderestimateofProgram’simpact.
Perceptionof localauthorityandbeneficiaryhouseholdshows that theProgram
improvedclearlyaccessibility tobasic infrastructure,marketand then increased
agricultureproductivity,non‐farmjobopportunity.Thus,itincreasedtheincome
and improved the livelihood of the beneficiary households living in P135‐ II
communes.
TheimplementationoftheProgramisinconsistenceovertimesotheDifferencein
DifferenceMethod (doubledifferences) is not suitable tomeasure the impactof
the Program. Results from analysis of the implementation of the Program,
perceptionofthelocalauthorityandbeneficiaryhouseholdsinthischapterhelps
ustodevelopthemostappropriateimpactmeasurementmethodandidentifythe
impactoutcomes.
42
CHAPTER4
POVERTYPROFILEOFETHNICMINORITIES
With a high economic growth rate during the past two decades, Vietnam has
become amiddle‐income country. Poverty incidence and poverty severity index
have been decreasing. In middle 1990s, half of the population were below the
consumption poverty line. In 2008, the poverty rate is around 14 percent
(according to the 2008 Vietnam Household Living Standard Survey ‐ VHLSS).
Although there is a high economic growth and fast poverty reduction, not all
households can benefit from the economic growth. Poverty remains high in the
mountainandhighland,where therearea largepopulationof ethnicminorities.
Ethnicminoritiesaccountforaround14percentoftheVietnam’spopulation,but
account for 50 percent of the poor population (according to the 2010 VHLSS).
Economic growth and poverty reduction is not very successful in ethnic
minorities. Many studies show that chronic poverty is now a phenomenon of
ethnicminorities(Phametal.,2012;WorldBank,2012).
Toreducepovertyindifficultyareas,theGovernmenthaslaunchedProgram135
which was targeted at the poor and ethnic minorities in the most difficult and
poorestcommunesofVietnamsince2000.Thischapterexaminespovertypattern
and characteristics of households in the poorest areas of Vietnam – communes
benefittedfromProgram135phaseII(2006‐2010).Thischapteralsoinvestigates
povertydynamicsofthesehouseholds,andexaminestherelationbetweenincome
growth, inequality and poverty of the households. This analysis relies on panel
data from the Baseline Survey of P135‐II conducted in 2007 and the Endline
SurveyofP135‐IIconductedin2012.
Thischapterisstructuredintofiveparts.Thesecondpartexaminespovertystatus
and inequality pattern of households in P135‐II communes through
decomposition of change in poverty into change due to growth and change in
inequality. The third part examines characteristics of the poor including living
conditions, livelihood and assets of households. The forthpart analyses poverty
dynamics of ethnicminorities and estimates the determinants of persistent and
transientpoverty.Thefifthpartconcludes.
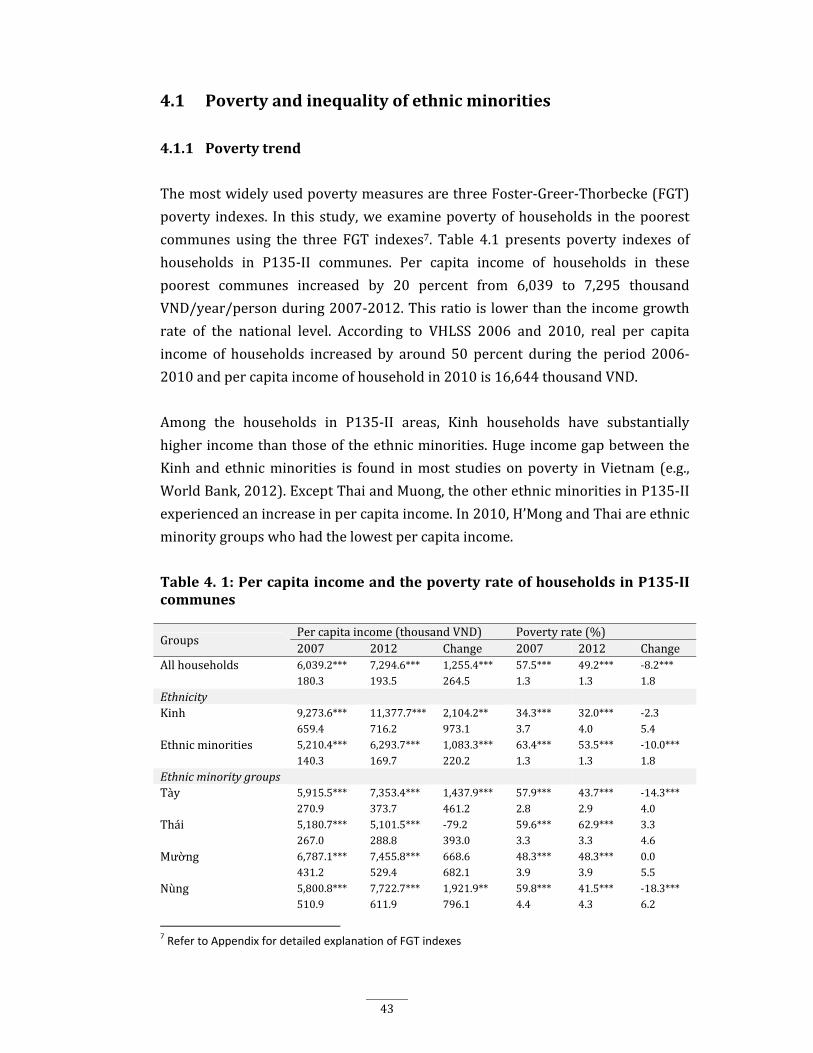
43
4.1 Povertyandinequalityofethnicminorities
4.1.1 Povertytrend
ThemostwidelyusedpovertymeasuresarethreeFoster‐Greer‐Thorbecke(FGT)
poverty indexes. In thisstudy,weexaminepovertyofhouseholds in thepoorest
communes using the three FGT indexes7. Table 4.1 presents poverty indexes of
households in P135‐II communes. Per capita income of households in these
poorest communes increased by 20 percent from 6,039 to 7,295 thousand
VND/year/personduring2007‐2012.Thisratioislowerthantheincomegrowth
rate of the national level. According to VHLSS 2006 and 2010, real per capita
income of households increased by around 50 percent during the period 2006‐
2010andpercapitaincomeofhouseholdin2010is16,644thousandVND.
Among the households in P135‐II areas, Kinh households have substantially
higherincomethanthoseoftheethnicminorities.Hugeincomegapbetweenthe
Kinhandethnicminorities is found inmost studiesonpoverty inVietnam (e.g.,
WorldBank,2012).ExceptThaiandMuong,theotherethnicminoritiesinP135‐II
experiencedanincreaseinpercapitaincome.In2010,H’MongandThaiareethnic
minoritygroupswhohadthelowestpercapitaincome.
Table4.1:PercapitaincomeandthepovertyrateofhouseholdsinP135‐IIcommunes
GroupsPercapitaincome(thousandVND) Povertyrate(%)2007 2012 Change 2007 2012 Change
Allhouseholds 6,039.2*** 7,294.6*** 1,255.4*** 57.5*** 49.2*** ‐8.2***180.3 193.5 264.5 1.3 1.3 1.8
EthnicityKinh 9,273.6*** 11,377.7*** 2,104.2** 34.3*** 32.0*** ‐2.3
659.4 716.2 973.1 3.7 4.0 5.4Ethnicminorities 5,210.4*** 6,293.7*** 1,083.3*** 63.4*** 53.5*** ‐10.0***
140.3 169.7 220.2 1.3 1.3 1.8EthnicminoritygroupsTày 5,915.5*** 7,353.4*** 1,437.9*** 57.9*** 43.7*** ‐14.3***
270.9 373.7 461.2 2.8 2.9 4.0Thái 5,180.7*** 5,101.5*** ‐79.2 59.6*** 62.9*** 3.3
267.0 288.8 393.0 3.3 3.3 4.6Mường 6,787.1*** 7,455.8*** 668.6 48.3*** 48.3*** 0.0
431.2 529.4 682.1 3.9 3.9 5.5Nùng 5,800.8*** 7,722.7*** 1,921.9** 59.8*** 41.5*** ‐18.3***
510.9 611.9 796.1 4.4 4.3 6.2
7 Refer to Appendix for detailed explanation of FGT indexes
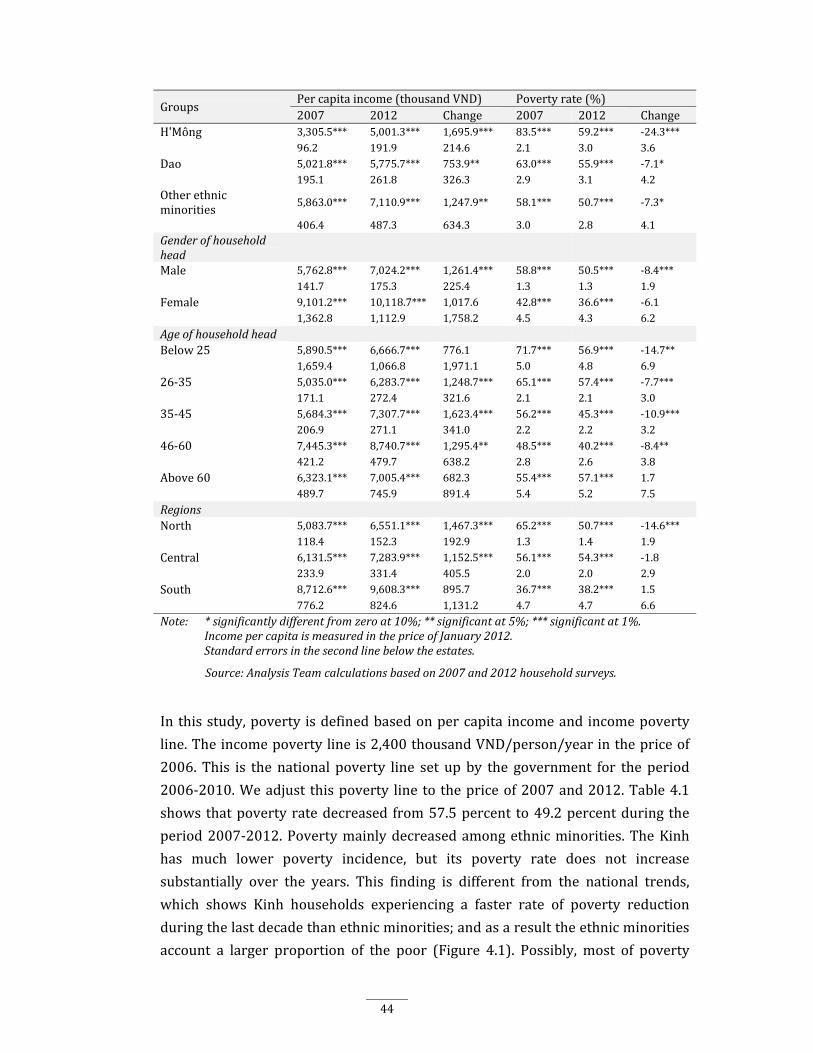
44
GroupsPercapitaincome(thousandVND) Povertyrate(%)2007 2012 Change 2007 2012 Change
H'Mông 3,305.5*** 5,001.3*** 1,695.9*** 83.5*** 59.2*** ‐24.3***96.2 191.9 214.6 2.1 3.0 3.6
Dao 5,021.8*** 5,775.7*** 753.9** 63.0*** 55.9*** ‐7.1*195.1 261.8 326.3 2.9 3.1 4.2
Otherethnicminorities
5,863.0*** 7,110.9*** 1,247.9** 58.1*** 50.7*** ‐7.3*
406.4 487.3 634.3 3.0 2.8 4.1Genderofhouseholdhead Male 5,762.8*** 7,024.2*** 1,261.4*** 58.8*** 50.5*** ‐8.4***
141.7 175.3 225.4 1.3 1.3 1.9Female 9,101.2*** 10,118.7*** 1,017.6 42.8*** 36.6*** ‐6.1
1,362.8 1,112.9 1,758.2 4.5 4.3 6.2AgeofhouseholdheadBelow25 5,890.5*** 6,666.7*** 776.1 71.7*** 56.9*** ‐14.7**
1,659.4 1,066.8 1,971.1 5.0 4.8 6.926‐35 5,035.0*** 6,283.7*** 1,248.7*** 65.1*** 57.4*** ‐7.7***
171.1 272.4 321.6 2.1 2.1 3.035‐45 5,684.3*** 7,307.7*** 1,623.4*** 56.2*** 45.3*** ‐10.9***
206.9 271.1 341.0 2.2 2.2 3.246‐60 7,445.3*** 8,740.7*** 1,295.4** 48.5*** 40.2*** ‐8.4**
421.2 479.7 638.2 2.8 2.6 3.8Above60 6,323.1*** 7,005.4*** 682.3 55.4*** 57.1*** 1.7
489.7 745.9 891.4 5.4 5.2 7.5RegionsNorth 5,083.7*** 6,551.1*** 1,467.3*** 65.2*** 50.7*** ‐14.6***
118.4 152.3 192.9 1.3 1.4 1.9Central 6,131.5*** 7,283.9*** 1,152.5*** 56.1*** 54.3*** ‐1.8
233.9 331.4 405.5 2.0 2.0 2.9South 8,712.6*** 9,608.3*** 895.7 36.7*** 38.2*** 1.5
776.2 824.6 1,131.2 4.7 4.7 6.6Note:*significantlydifferentfromzero at10%;**significantat5%;***significantat1%.IncomepercapitaismeasuredinthepriceofJanuary2012.Standarderrorsinthesecondlinebelowtheestates.
Source:AnalysisTeamcalculationsbasedon2007and2012householdsurveys.
Inthisstudy,poverty isdefinedbasedonpercapita incomeandincomepoverty
line.Theincomepovertylineis2,400thousandVND/person/yearinthepriceof
2006. This is the national poverty line set up by the government for the period
2006‐2010.Weadjust thispoverty line tothepriceof2007and2012.Table4.1
showsthatpovertyratedecreased from57.5percent to49.2percentduring the
period2007‐2012.Povertymainlydecreasedamongethnicminorities.TheKinh
has much lower poverty incidence, but its poverty rate does not increase
substantially over the years. This finding is different from the national trends,
which shows Kinh households experiencing a faster rate of poverty reduction
duringthelastdecadethanethnicminorities;andasaresulttheethnicminorities
account a larger proportion of the poor (Figure 4.1). Possibly, most of poverty

45
reduction programs are mainly targeted at the ethnic minorities in difficult
communes;thereforetheethnicminoritiescanbenefitmorefromtheseprograms
than the Kinh. Nung, H’Mong and Tay groups experience the highest poverty
reduction rates during the past five years. By regions, households in Northern
MountainarepoorerthanthoseintheCentralandtheSouth.Therearemorepoor
ethnicminoritiessuchasNung,TayandH’MonginNorthernMountain.However,
povertywasreducedfasterintheNorthernregionthantheSouthernregion.
Figure4.1: Poverty rate and the share of the poor by Kinh and ethnic minorities
Poverty rate (%) Share of the poor of the groups in the total number of the poor (%)
Note: The poor in this figure are those who have per capita expenditure below the expenditurepovertyrate.Thenominalexpenditurepoverty lines in1993,1998,2004and2010are1160,1790,2077and7836thousandVND/person/year.
Source:AnalysisTeamcalculationsbasedonVLSS1993,1998,andVHLSS2004,2010.
While poverty incidence simply demonstrates rate of people who live below a
poverty line in a given population, poverty gap indexmeasures the intensity of
poverty.Povertygapandseverityindexes8,presentedinTable4.2giveamorein‐
depth poverty picture of the targeted population. Table 4.2 indicates slight
changes in these poverty indexes during the period 2007‐2012 except for
significant increases in poverty gap and poverty severity indexes of Thai and
MuonghouseholdswhileH’Mongexperiencedsignificantreductioninallpoverty
indexes.ThisphenomenonindicatesthatforThaiandMuonghouseholds,poverty
8 Poverty gap index measures the extent to which individuals fall below the poverty line (the poverty
gap) as a proportion of the poverty line. Poverty severity index is the squared poverty gap index, which
averages the squares of the poverty gaps relative to poverty line (Introduction to Poverty Analysis, WB
2005).
53.9
31.1
13.5 12.9
88.4
77.0
57.4
67.484.2
72.9 64.7
65.1
0
20
40
60
80
100
1993 1998 2004 2010Kinh and Hoa
Northern ethnic minorities
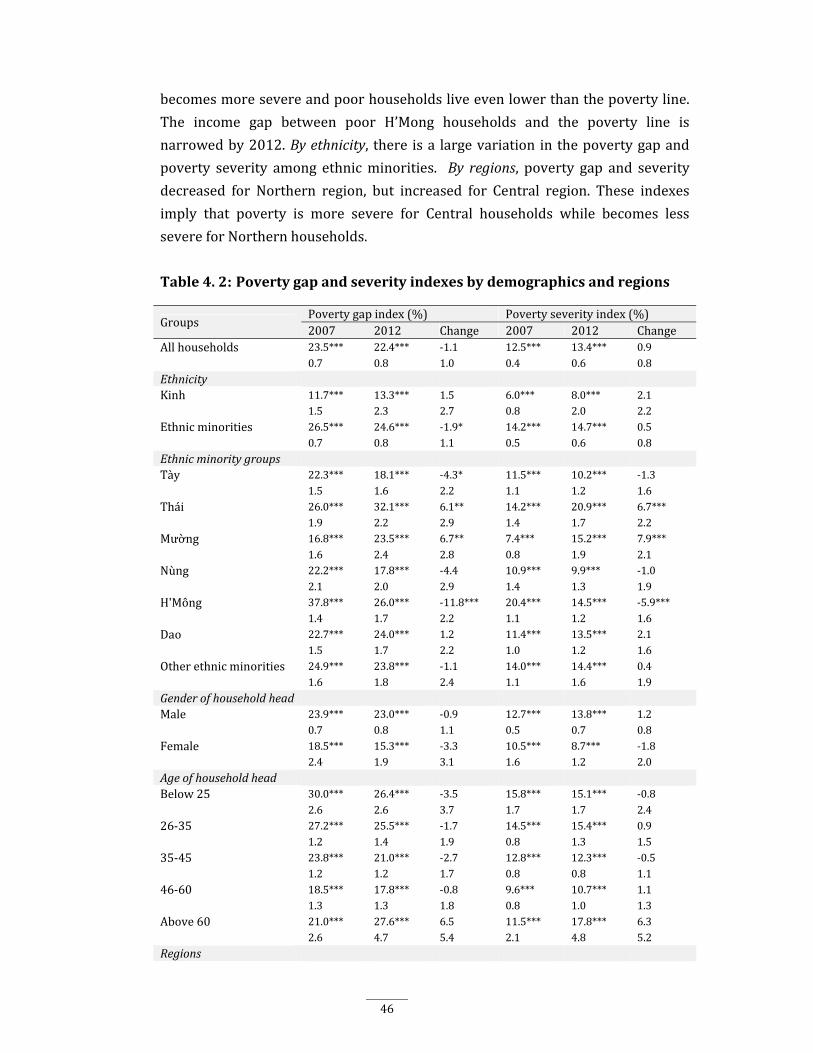
46
becomesmoresevereandpoorhouseholdsliveevenlowerthanthepovertyline.
The income gap between poor H’Mong households and the poverty line is
narrowedby2012.Byethnicity, there isa largevariation inthepovertygapand
poverty severity among ethnicminorities. By regions, poverty gap and severity
decreased for Northern region, but increased for Central region. These indexes
imply that poverty is more severe for Central households while becomes less
severeforNorthernhouseholds.
Table4.2: Povertygapandseverityindexesbydemographicsandregions
GroupsPovertygapindex(%) Povertyseverityindex(%)2007 2012 Change 2007 2012 Change
Allhouseholds 23.5*** 22.4*** ‐1.1 12.5*** 13.4*** 0.90.7 0.8 1.0 0.4 0.6 0.8
EthnicityKinh 11.7*** 13.3*** 1.5 6.0*** 8.0*** 2.1
1.5 2.3 2.7 0.8 2.0 2.2Ethnicminorities 26.5*** 24.6*** ‐1.9* 14.2*** 14.7*** 0.5
0.7 0.8 1.1 0.5 0.6 0.8EthnicminoritygroupsTày 22.3*** 18.1*** ‐4.3* 11.5*** 10.2*** ‐1.3
1.5 1.6 2.2 1.1 1.2 1.6Thái 26.0*** 32.1*** 6.1** 14.2*** 20.9*** 6.7***
1.9 2.2 2.9 1.4 1.7 2.2Mường 16.8*** 23.5*** 6.7** 7.4*** 15.2*** 7.9***
1.6 2.4 2.8 0.8 1.9 2.1Nùng 22.2*** 17.8*** ‐4.4 10.9*** 9.9*** ‐1.0
2.1 2.0 2.9 1.4 1.3 1.9H'Mông 37.8*** 26.0*** ‐11.8*** 20.4*** 14.5*** ‐5.9***
1.4 1.7 2.2 1.1 1.2 1.6Dao 22.7*** 24.0*** 1.2 11.4*** 13.5*** 2.1
1.5 1.7 2.2 1.0 1.2 1.6Otherethnicminorities 24.9*** 23.8*** ‐1.1 14.0*** 14.4*** 0.4
1.6 1.8 2.4 1.1 1.6 1.9GenderofhouseholdheadMale 23.9*** 23.0*** ‐0.9 12.7*** 13.8*** 1.2
0.7 0.8 1.1 0.5 0.7 0.8Female 18.5*** 15.3*** ‐3.3 10.5*** 8.7*** ‐1.8
2.4 1.9 3.1 1.6 1.2 2.0AgeofhouseholdheadBelow25 30.0*** 26.4*** ‐3.5 15.8*** 15.1*** ‐0.8
2.6 2.6 3.7 1.7 1.7 2.426‐35 27.2*** 25.5*** ‐1.7 14.5*** 15.4*** 0.9
1.2 1.4 1.9 0.8 1.3 1.535‐45 23.8*** 21.0*** ‐2.7 12.8*** 12.3*** ‐0.5
1.2 1.2 1.7 0.8 0.8 1.146‐60 18.5*** 17.8*** ‐0.8 9.6*** 10.7*** 1.1
1.3 1.3 1.8 0.8 1.0 1.3Above60 21.0*** 27.6*** 6.5 11.5*** 17.8*** 6.3
2.6 4.7 5.4 2.1 4.8 5.2Regions
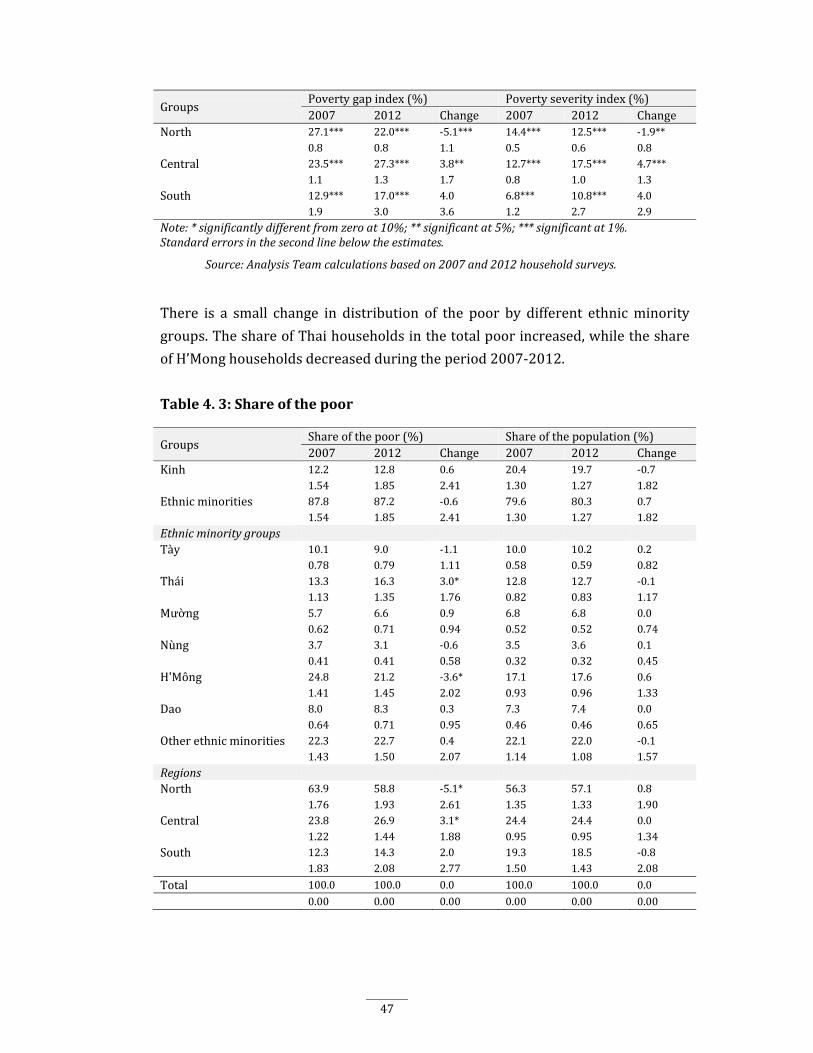
47
GroupsPovertygapindex(%) Povertyseverityindex(%)2007 2012 Change 2007 2012 Change
North 27.1*** 22.0*** ‐5.1*** 14.4*** 12.5*** ‐1.9**0.8 0.8 1.1 0.5 0.6 0.8
Central 23.5*** 27.3*** 3.8** 12.7*** 17.5*** 4.7***1.1 1.3 1.7 0.8 1.0 1.3
South 12.9*** 17.0*** 4.0 6.8*** 10.8*** 4.01.9 3.0 3.6 1.2 2.7 2.9
Note:*significantlydifferentfromzero at10%;**significantat5%;***significantat1%.Standarderrorsinthesecondlinebelowtheestimates.
Source:AnalysisTeamcalculationsbasedon2007and2012householdsurveys.
There is a small change in distribution of the poor by different ethnicminority
groups.TheshareofThaihouseholdsinthetotalpoorincreased,whiletheshare
ofH’Monghouseholdsdecreasedduringtheperiod2007‐2012.
Table4.3:Shareofthepoor
GroupsShareofthepoor(%) Shareofthepopulation(%)2007 2012 Change 2007 2012 Change
Kinh 12.2 12.8 0.6 20.4 19.7 ‐0.71.54 1.85 2.41 1.30 1.27 1.82
Ethnicminorities 87.8 87.2 ‐0.6 79.6 80.3 0.71.54 1.85 2.41 1.30 1.27 1.82
EthnicminoritygroupsTày 10.1 9.0 ‐1.1 10.0 10.2 0.2
0.78 0.79 1.11 0.58 0.59 0.82Thái 13.3 16.3 3.0* 12.8 12.7 ‐0.1
1.13 1.35 1.76 0.82 0.83 1.17Mường 5.7 6.6 0.9 6.8 6.8 0.0
0.62 0.71 0.94 0.52 0.52 0.74Nùng 3.7 3.1 ‐0.6 3.5 3.6 0.1
0.41 0.41 0.58 0.32 0.32 0.45H'Mông 24.8 21.2 ‐3.6* 17.1 17.6 0.6
1.41 1.45 2.02 0.93 0.96 1.33Dao 8.0 8.3 0.3 7.3 7.4 0.0
0.64 0.71 0.95 0.46 0.46 0.65Otherethnicminorities 22.3 22.7 0.4 22.1 22.0 ‐0.1
1.43 1.50 2.07 1.14 1.08 1.57RegionsNorth 63.9 58.8 ‐5.1* 56.3 57.1 0.8
1.76 1.93 2.61 1.35 1.33 1.90Central 23.8 26.9 3.1* 24.4 24.4 0.0
1.22 1.44 1.88 0.95 0.95 1.34South 12.3 14.3 2.0 19.3 18.5 ‐0.8
1.83 2.08 2.77 1.50 1.43 2.08
Total 100.0 100.0 0.0 100.0 100.0 0.0
0.00 0.00 0.00 0.00 0.00 0.00
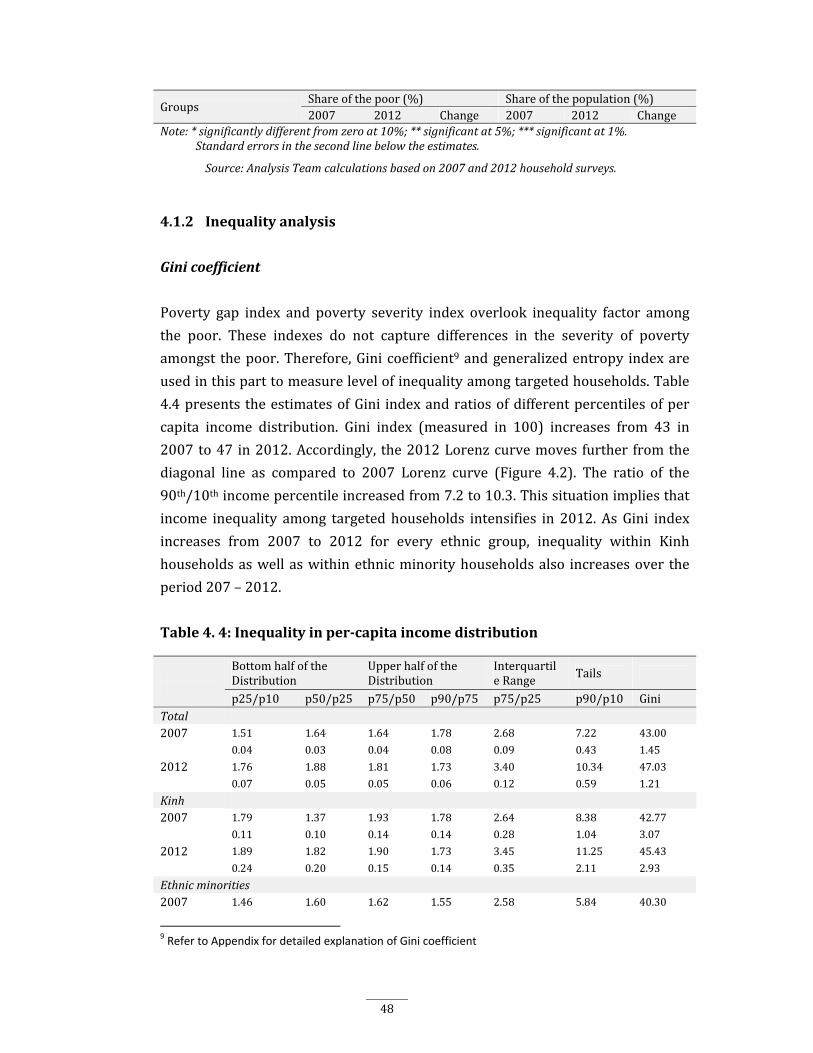
48
GroupsShareofthepoor(%) Shareofthepopulation(%)2007 2012 Change 2007 2012 Change
Note:*significantlydifferentfromzero at10%;**significantat5%;***significantat1%.Standarderrorsinthesecondlinebelowtheestimates.
Source:AnalysisTeamcalculationsbasedon2007and2012householdsurveys.
4.1.2 Inequalityanalysis
Ginicoefficient
Poverty gap index and poverty severity index overlook inequality factor among
the poor. These indexes do not capture differences in the severity of poverty
amongst thepoor.Therefore,Ginicoefficient9andgeneralizedentropy indexare
usedinthisparttomeasurelevelofinequalityamongtargetedhouseholds.Table
4.4presentstheestimatesofGini indexandratiosofdifferentpercentilesofper
capita income distribution. Gini index (measured in 100) increases from 43 in
2007to47 in2012.Accordingly, the2012Lorenzcurvemoves further fromthe
diagonal line as compared to 2007 Lorenz curve (Figure 4.2). The ratio of the
90th/10thincomepercentileincreasedfrom7.2to10.3.Thissituationimpliesthat
income inequality among targeted households intensifies in 2012.AsGini index
increases from 2007 to 2012 for every ethnic group, inequality within Kinh
householdsaswellaswithinethnicminorityhouseholdsalso increasesover the
period207–2012.
Table4.4:Inequalityinper‐capitaincomedistribution
BottomhalfoftheDistribution
UpperhalfoftheDistribution
InterquartileRange Tails
p25/p10 p50/p25 p75/p50 p90/p75 p75/p25 p90/p10 GiniTotal2007 1.51 1.64 1.64 1.78 2.68 7.22 43.00
0.04 0.03 0.04 0.08 0.09 0.43 1.45
2012 1.76 1.88 1.81 1.73 3.40 10.34 47.03
0.07 0.05 0.05 0.06 0.12 0.59 1.21
Kinh2007 1.79 1.37 1.93 1.78 2.64 8.38 42.77
0.11 0.10 0.14 0.14 0.28 1.04 3.07
2012 1.89 1.82 1.90 1.73 3.45 11.25 45.43
0.24 0.20 0.15 0.14 0.35 2.11 2.93
Ethnicminorities2007 1.46 1.60 1.62 1.55 2.58 5.84 40.30
9 Refer to Appendix for detailed explanation of Gini coefficient
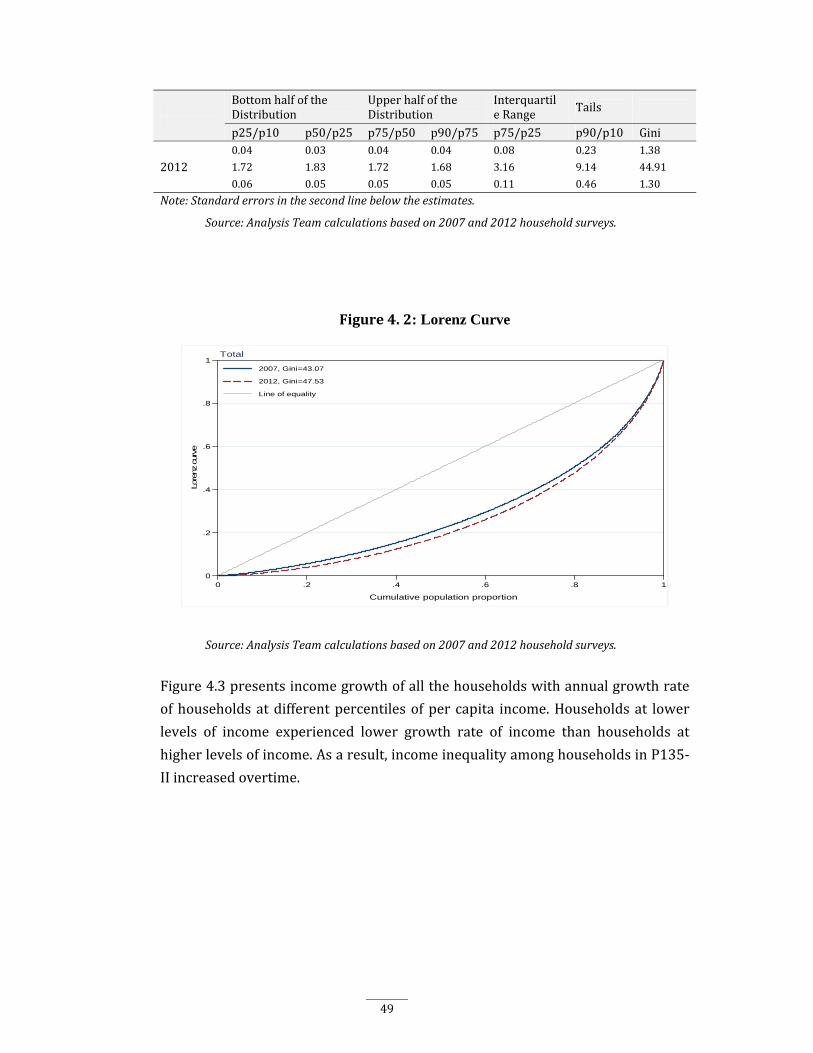
49
BottomhalfoftheDistribution
UpperhalfoftheDistribution
InterquartileRange Tails
p25/p10 p50/p25 p75/p50 p90/p75 p75/p25 p90/p10 Gini0.04 0.03 0.04 0.04 0.08 0.23 1.38
2012 1.72 1.83 1.72 1.68 3.16 9.14 44.91
0.06 0.05 0.05 0.05 0.11 0.46 1.30
Note:Standarderrorsinthesecondlinebelowtheestimates.
Source:AnalysisTeamcalculationsbasedon2007and2012householdsurveys.
Figure4.2: Lorenz Curve
Source:AnalysisTeamcalculationsbasedon2007and2012householdsurveys.
Figure4.3presentsincomegrowthofallthehouseholdswithannualgrowthrate
ofhouseholdsatdifferentpercentilesofpercapita income.Householdsat lower
levels of income experienced lower growth rate of income than households at
higherlevelsofincome.Asaresult,incomeinequalityamonghouseholdsinP135‐
IIincreasedovertime.
0
.2
.4
.6
.8
1
Lore
nz
curv
e
0 .2 .4 .6 .8 1
Cumulative population proportion
2007, Gini=43.07
2012, Gini=47.53
Line of equality
Total
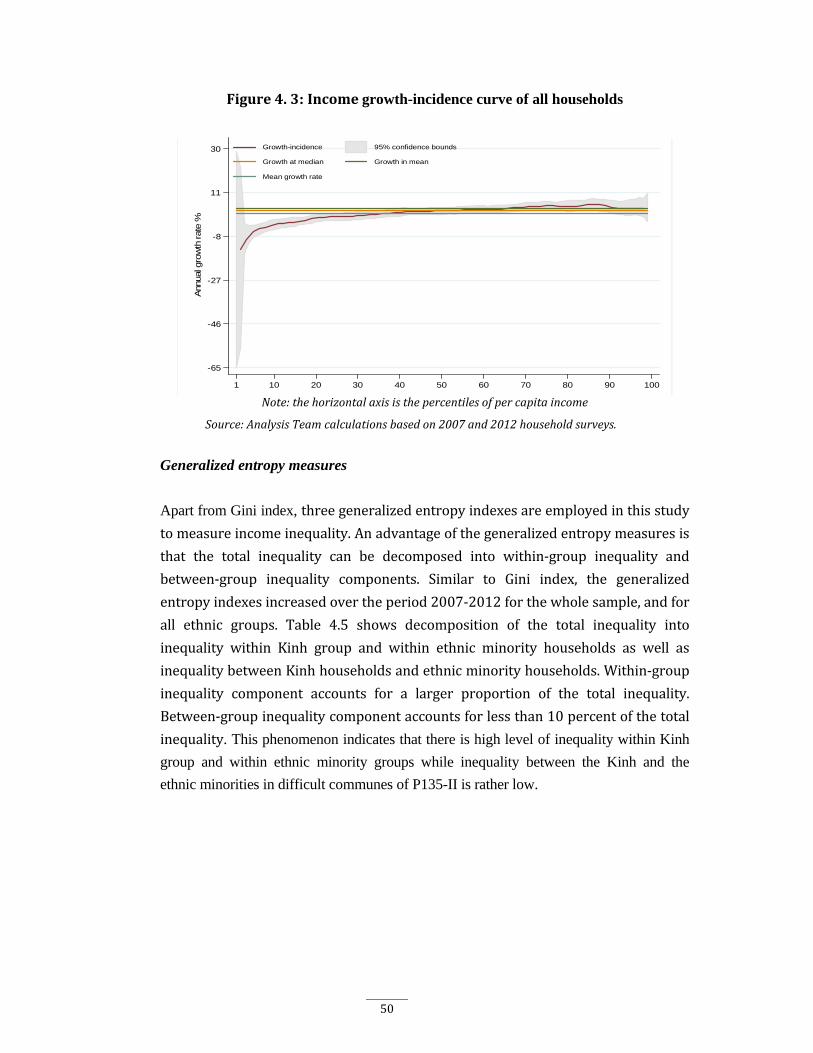
50
Figure4.3:Incomegrowth-incidence curve of all households
Note:thehorizontalaxisisthepercentilesofpercapitaincome
Source:AnalysisTeamcalculationsbasedon2007and2012householdsurveys.
Generalized entropy measures
Apart from Gini index, threegeneralizedentropyindexesareemployedinthisstudy
tomeasureincomeinequality.Anadvantageofthegeneralizedentropymeasuresis
that the total inequality can be decomposed into within‐group inequality and
between‐group inequality components. Similar to Gini index, the generalized
entropyindexesincreasedovertheperiod2007‐2012forthewholesample,andfor
all ethnic groups. Table 4.5 shows decomposition of the total inequality into
inequality within Kinh group and within ethnic minority households as well as
inequalitybetweenKinhhouseholdsandethnicminorityhouseholds.Within‐group
inequality component accounts for a larger proportion of the total inequality.
Between‐groupinequalitycomponentaccountsforlessthan10percentofthetotal
inequality. This phenomenon indicates that there is high level of inequality within Kinh
group and within ethnic minority groups while inequality between the Kinh and the
ethnic minorities in difficult communes of P135-II is rather low.
-65
-46
-27
-8
11
30
Ann
ual
gro
wth
rate
%
1 10 20 30 40 50 60 70 80 90 100
Growth-incidence 95% confidence bounds
Growth at median Growth in mean
Mean growth rate
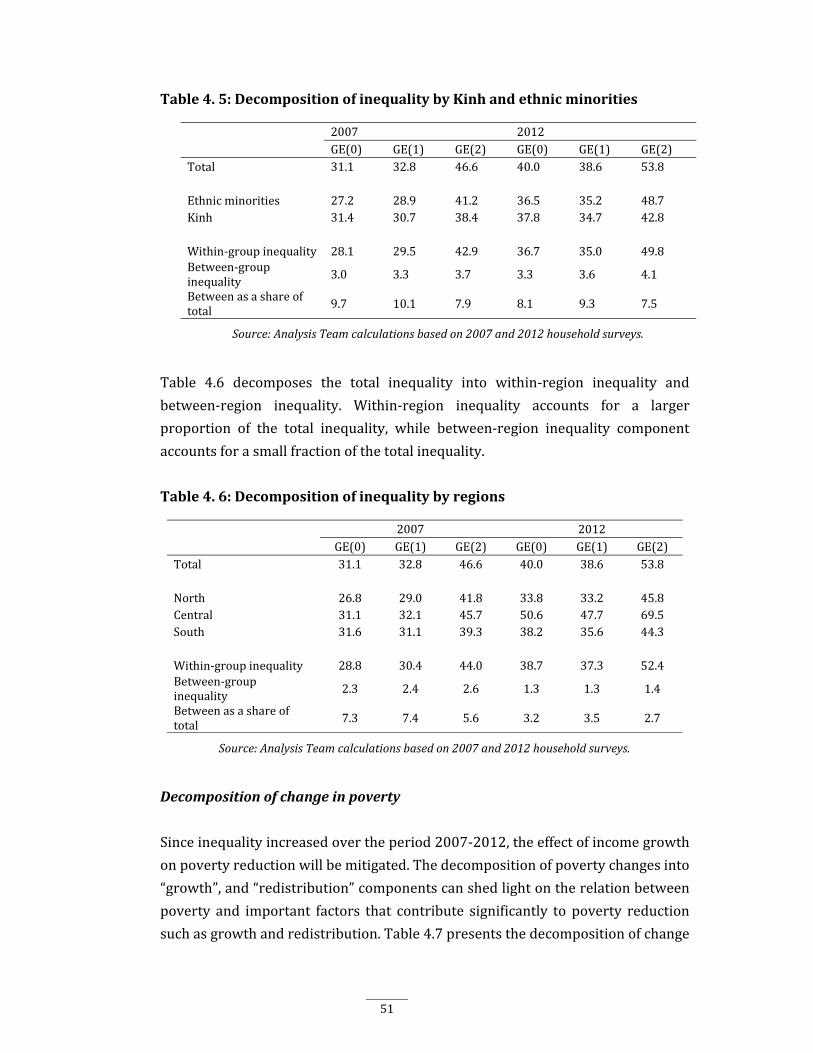
51
Table4.5:DecompositionofinequalitybyKinhandethnicminorities
2007 2012GE(0) GE(1) GE(2) GE(0) GE(1) GE(2)
Total 31.1 32.8 46.6 40.0 38.6 53.8
Ethnicminorities 27.2 28.9 41.2 36.5 35.2 48.7Kinh 31.4 30.7 38.4 37.8 34.7 42.8
Within‐groupinequality 28.1 29.5 42.9 36.7 35.0 49.8Between‐groupinequality 3.0 3.3 3.7 3.3 3.6 4.1
Betweenasashareoftotal 9.7 10.1 7.9 8.1 9.3 7.5
Source:AnalysisTeamcalculationsbasedon2007and2012householdsurveys.
Table 4.6 decomposes the total inequality into within‐region inequality and
between‐region inequality. Within‐region inequality accounts for a larger
proportion of the total inequality, while between‐region inequality component
accountsforasmallfractionofthetotalinequality.
Table4.6:Decompositionofinequalitybyregions
2007 2012GE(0) GE(1) GE(2) GE(0) GE(1) GE(2)
Total 31.1 32.8 46.6 40.0 38.6 53.8
North 26.8 29.0 41.8 33.8 33.2 45.8Central 31.1 32.1 45.7 50.6 47.7 69.5South 31.6 31.1 39.3 38.2 35.6 44.3
Within‐groupinequality 28.8 30.4 44.0 38.7 37.3 52.4Between‐groupinequality 2.3 2.4 2.6 1.3 1.3 1.4
Betweenasashareoftotal 7.3 7.4 5.6 3.2 3.5 2.7
Source:AnalysisTeamcalculationsbasedon2007and2012householdsurveys.
Decompositionofchangeinpoverty
Sinceinequalityincreasedovertheperiod2007‐2012,theeffectofincomegrowth
onpovertyreductionwillbemitigated.Thedecompositionofpovertychangesinto
“growth”,and“redistribution”componentscanshedlightontherelationbetween
poverty and important factors that contribute significantly to poverty reduction
suchasgrowthandredistribution.Table4.7presentsthedecompositionofchange
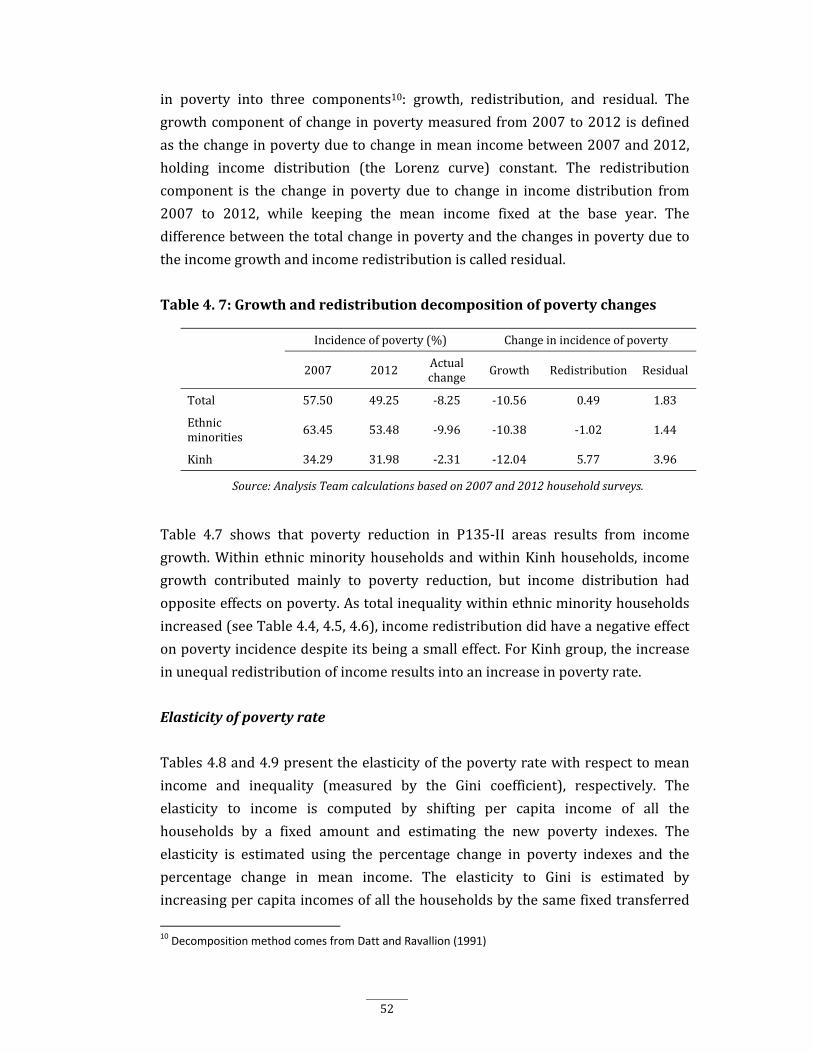
52
in poverty into three components10: growth, redistribution, and residual. The
growthcomponentofchangeinpovertymeasuredfrom2007to2012isdefined
asthechangeinpovertyduetochangeinmeanincomebetween2007and2012,
holding income distribution (the Lorenz curve) constant. The redistribution
component is the change in poverty due to change in income distribution from
2007 to 2012, while keeping the mean income fixed at the base year. The
differencebetweenthetotalchangeinpovertyandthechangesinpovertydueto
theincomegrowthandincomeredistributioniscalledresidual.
Table4.7:Growthandredistributiondecompositionofpovertychanges
Incidenceofpoverty(%) Changeinincidenceofpoverty
2007 2012 Actualchange Growth Redistribution Residual
Total 57.50 49.25 ‐8.25 ‐10.56 0.49 1.83
Ethnicminorities 63.45 53.48 ‐9.96 ‐10.38 ‐1.02 1.44
Kinh 34.29 31.98 ‐2.31 ‐12.04 5.77 3.96
Source:AnalysisTeamcalculationsbasedon2007and2012householdsurveys.
Table 4.7 shows that poverty reduction in P135‐II areas results from income
growth.Within ethnicminorityhouseholds andwithinKinhhouseholds, income
growth contributed mainly to poverty reduction, but income distribution had
oppositeeffectsonpoverty.Astotalinequalitywithinethnicminorityhouseholds
increased(seeTable4.4,4.5,4.6),incomeredistributiondidhaveanegativeeffect
onpovertyincidencedespiteitsbeingasmalleffect.ForKinhgroup,theincrease
inunequalredistributionofincomeresultsintoanincreaseinpovertyrate.
Elasticityofpovertyrate
Tables4.8and4.9presenttheelasticityofthepovertyratewithrespecttomean
income and inequality (measured by the Gini coefficient), respectively. The
elasticity to income is computed by shifting per capita income of all the
households by a fixed amount and estimating the new poverty indexes. The
elasticity is estimated using the percentage change in poverty indexes and the
percentage change in mean income. The elasticity to Gini is estimated by
increasingpercapitaincomesofallthehouseholdsbythesamefixedtransferred
10 Decomposition method comes from Datt and Ravallion (1991)
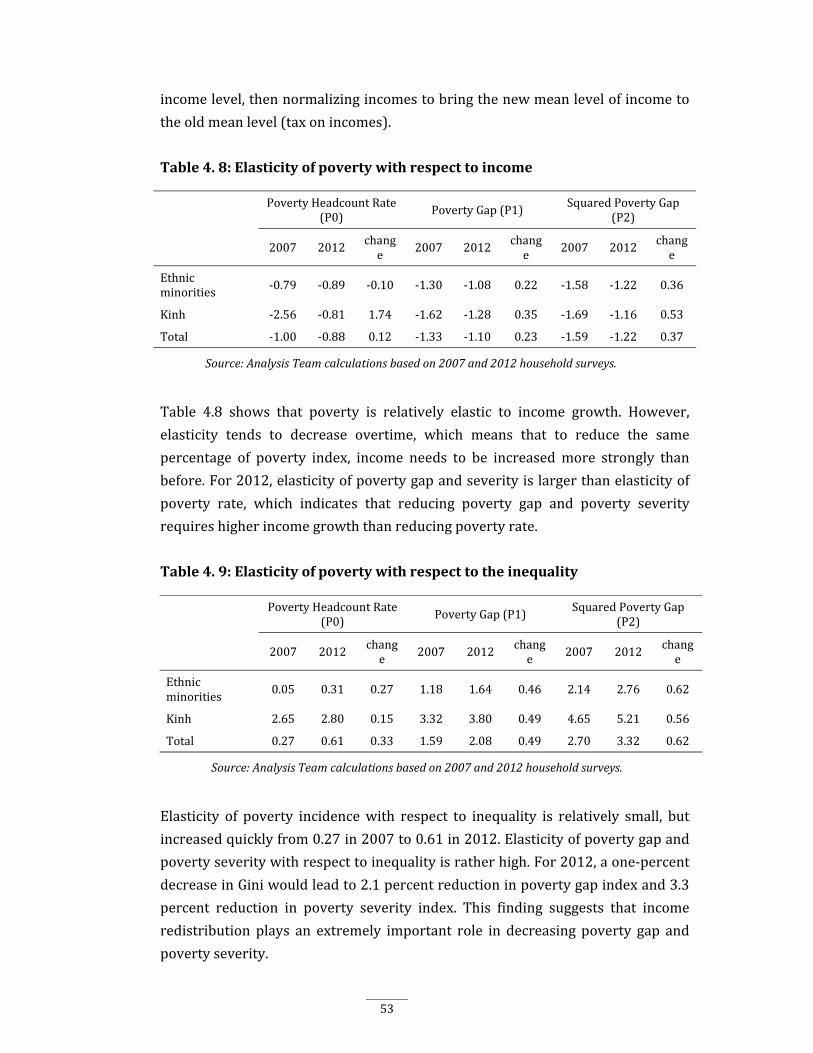
53
incomelevel,thennormalizingincomestobringthenewmeanlevelofincometo
theoldmeanlevel(taxonincomes).
Table4.8:Elasticityofpovertywithrespecttoincome
PovertyHeadcountRate(P0) PovertyGap(P1) SquaredPovertyGap
(P2)
2007 2012 change
2007 2012 change
2007 2012 change
Ethnicminorities ‐0.79 ‐0.89 ‐0.10 ‐1.30 ‐1.08 0.22 ‐1.58 ‐1.22 0.36
Kinh ‐2.56 ‐0.81 1.74 ‐1.62 ‐1.28 0.35 ‐1.69 ‐1.16 0.53
Total ‐1.00 ‐0.88 0.12 ‐1.33 ‐1.10 0.23 ‐1.59 ‐1.22 0.37
Source:AnalysisTeamcalculationsbasedon2007and2012householdsurveys.
Table 4.8 shows that poverty is relatively elastic to income growth. However,
elasticity tends to decrease overtime, which means that to reduce the same
percentage of poverty index, income needs to be increasedmore strongly than
before.For2012,elasticityofpovertygapandseverityislargerthanelasticityof
poverty rate, which indicates that reducing poverty gap and poverty severity
requireshigherincomegrowththanreducingpovertyrate.
Table4.9:Elasticityofpovertywithrespecttotheinequality
PovertyHeadcountRate(P0) PovertyGap(P1) SquaredPovertyGap
(P2)
2007 2012 change 2007 2012 chang
e 2007 2012 change
Ethnicminorities
0.05 0.31 0.27 1.18 1.64 0.46 2.14 2.76 0.62
Kinh 2.65 2.80 0.15 3.32 3.80 0.49 4.65 5.21 0.56
Total 0.27 0.61 0.33 1.59 2.08 0.49 2.70 3.32 0.62
Source:AnalysisTeamcalculationsbasedon2007and2012householdsurveys.
Elasticity of poverty incidencewith respect to inequality is relatively small, but
increasedquicklyfrom0.27in2007to0.61in2012.Elasticityofpovertygapand
povertyseveritywithrespecttoinequalityisratherhigh.For2012,aone‐percent
decreaseinGiniwouldleadto2.1percentreductioninpovertygapindexand3.3
percent reduction in poverty severity index. This finding suggests that income
redistribution plays an extremely important role in decreasing poverty gap and
povertyseverity.
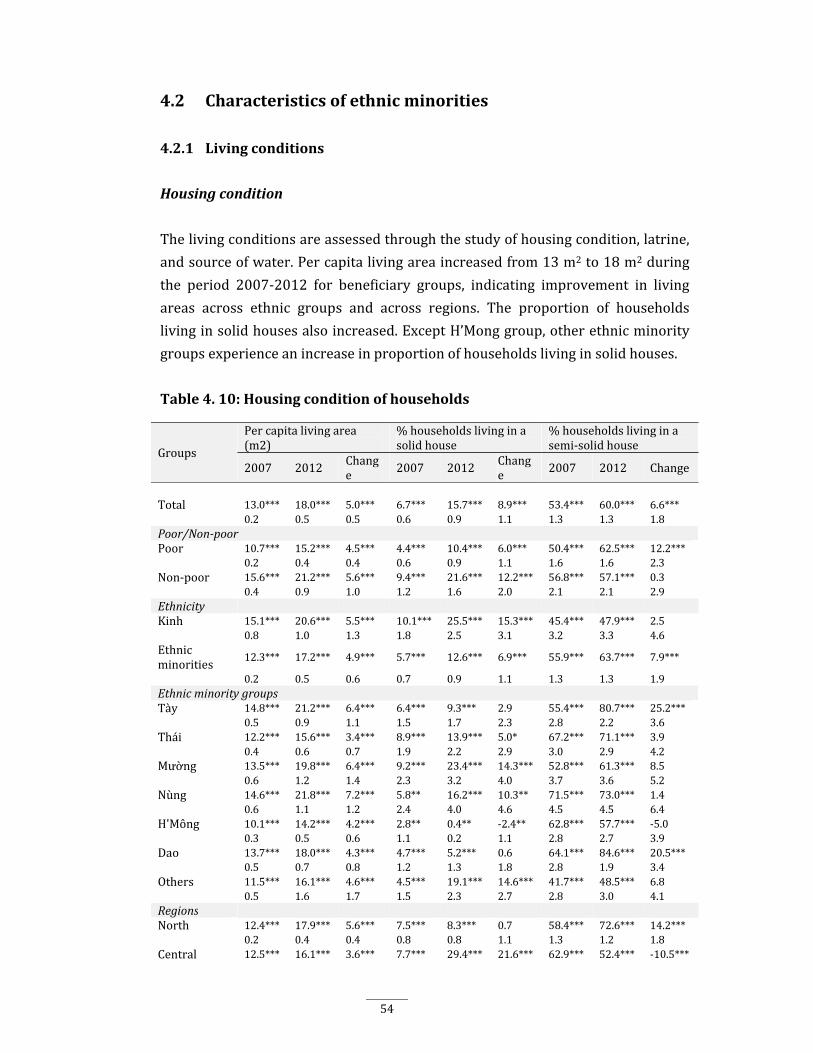
54
4.2 Characteristicsofethnicminorities
4.2.1 Livingconditions
Housingcondition
Thelivingconditionsareassessedthroughthestudyofhousingcondition,latrine,
andsourceofwater.Percapitalivingareaincreasedfrom13m2to18m2during
the period 2007‐2012 for beneficiary groups, indicating improvement in living
areas across ethnic groups and across regions. The proportion of households
livinginsolidhousesalsoincreased.ExceptH’Monggroup,otherethnicminority
groupsexperienceanincreaseinproportionofhouseholdslivinginsolidhouses.
Table4.10:Housingconditionofhouseholds
Groups
Percapitalivingarea(m2)
%householdslivinginasolidhouse
%householdslivinginasemi‐solidhouse
2007 2012 Change 2007 2012 Chang
e 2007 2012 Change
Total 13.0*** 18.0*** 5.0*** 6.7*** 15.7*** 8.9*** 53.4*** 60.0*** 6.6***0.2 0.5 0.5 0.6 0.9 1.1 1.3 1.3 1.8
Poor/Non‐poorPoor 10.7*** 15.2*** 4.5*** 4.4*** 10.4*** 6.0*** 50.4*** 62.5*** 12.2***
0.2 0.4 0.4 0.6 0.9 1.1 1.6 1.6 2.3Non‐poor 15.6*** 21.2*** 5.6*** 9.4*** 21.6*** 12.2*** 56.8*** 57.1*** 0.3
0.4 0.9 1.0 1.2 1.6 2.0 2.1 2.1 2.9EthnicityKinh 15.1*** 20.6*** 5.5*** 10.1*** 25.5*** 15.3*** 45.4*** 47.9*** 2.5
0.8 1.0 1.3 1.8 2.5 3.1 3.2 3.3 4.6Ethnicminorities
12.3*** 17.2*** 4.9*** 5.7*** 12.6*** 6.9*** 55.9*** 63.7*** 7.9***
0.2 0.5 0.6 0.7 0.9 1.1 1.3 1.3 1.9EthnicminoritygroupsTày 14.8*** 21.2*** 6.4*** 6.4*** 9.3*** 2.9 55.4*** 80.7*** 25.2***
0.5 0.9 1.1 1.5 1.7 2.3 2.8 2.2 3.6Thái 12.2*** 15.6*** 3.4*** 8.9*** 13.9*** 5.0* 67.2*** 71.1*** 3.9
0.4 0.6 0.7 1.9 2.2 2.9 3.0 2.9 4.2Mường 13.5*** 19.8*** 6.4*** 9.2*** 23.4*** 14.3*** 52.8*** 61.3*** 8.5
0.6 1.2 1.4 2.3 3.2 4.0 3.7 3.6 5.2Nùng 14.6*** 21.8*** 7.2*** 5.8** 16.2*** 10.3** 71.5*** 73.0*** 1.4
0.6 1.1 1.2 2.4 4.0 4.6 4.5 4.5 6.4H'Mông 10.1*** 14.2*** 4.2*** 2.8** 0.4** ‐2.4** 62.8*** 57.7*** ‐5.0
0.3 0.5 0.6 1.1 0.2 1.1 2.8 2.7 3.9Dao 13.7*** 18.0*** 4.3*** 4.7*** 5.2*** 0.6 64.1*** 84.6*** 20.5***
0.5 0.7 0.8 1.2 1.3 1.8 2.8 1.9 3.4Others 11.5*** 16.1*** 4.6*** 4.5*** 19.1*** 14.6*** 41.7*** 48.5*** 6.8
0.5 1.6 1.7 1.5 2.3 2.7 2.8 3.0 4.1RegionsNorth 12.4*** 17.9*** 5.6*** 7.5*** 8.3*** 0.7 58.4*** 72.6*** 14.2***
0.2 0.4 0.4 0.8 0.8 1.1 1.3 1.2 1.8Central 12.5*** 16.1*** 3.6*** 7.7*** 29.4*** 21.6*** 62.9*** 52.4*** ‐10.5***
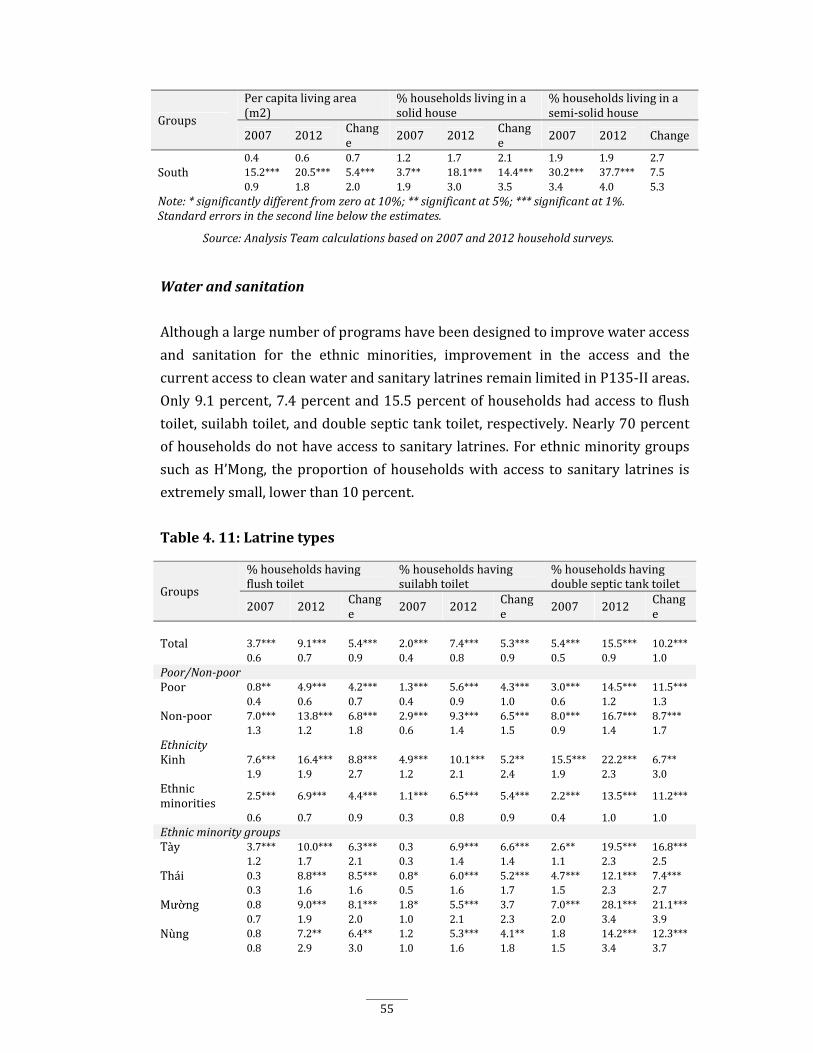
55
Groups
Percapitalivingarea(m2)
%householdslivinginasolidhouse
%householdslivinginasemi‐solidhouse
2007 2012 Change 2007 2012 Chang
e 2007 2012 Change
0.4 0.6 0.7 1.2 1.7 2.1 1.9 1.9 2.7South 15.2*** 20.5*** 5.4*** 3.7** 18.1*** 14.4*** 30.2*** 37.7*** 7.5
0.9 1.8 2.0 1.9 3.0 3.5 3.4 4.0 5.3Note:*significantlydifferentfromzero at10%;**significantat5%;***significantat1%.Standarderrorsinthesecondlinebelowtheestimates.
Source:AnalysisTeamcalculationsbasedon2007and2012householdsurveys.
Waterandsanitation
Althoughalargenumberofprogramshavebeendesignedtoimprovewateraccess
and sanitation for the ethnic minorities, improvement in the access and the
currentaccesstocleanwaterandsanitarylatrinesremainlimitedinP135‐IIareas.
Only9.1percent,7.4percentand15.5percentofhouseholdshadaccesstoflush
toilet,suilabhtoilet,anddoubleseptictanktoilet,respectively.Nearly70percent
ofhouseholdsdonothaveaccesstosanitarylatrines.Forethnicminoritygroups
suchasH’Mong, theproportionofhouseholdswithaccess to sanitary latrines is
extremelysmall,lowerthan10percent.
Table4.11:Latrinetypes
Groups
%householdshavingflushtoilet
%householdshavingsuilabhtoilet
%householdshavingdoubleseptictanktoilet
2007 2012 Change 2007 2012 Chang
e 2007 2012 Change
Total 3.7*** 9.1*** 5.4*** 2.0*** 7.4*** 5.3*** 5.4*** 15.5*** 10.2***0.6 0.7 0.9 0.4 0.8 0.9 0.5 0.9 1.0
Poor/Non‐poorPoor 0.8** 4.9*** 4.2*** 1.3*** 5.6*** 4.3*** 3.0*** 14.5*** 11.5***
0.4 0.6 0.7 0.4 0.9 1.0 0.6 1.2 1.3Non‐poor 7.0*** 13.8*** 6.8*** 2.9*** 9.3*** 6.5*** 8.0*** 16.7*** 8.7***
1.3 1.2 1.8 0.6 1.4 1.5 0.9 1.4 1.7EthnicityKinh 7.6*** 16.4*** 8.8*** 4.9*** 10.1*** 5.2** 15.5*** 22.2*** 6.7**
1.9 1.9 2.7 1.2 2.1 2.4 1.9 2.3 3.0Ethnicminorities
2.5*** 6.9*** 4.4*** 1.1*** 6.5*** 5.4*** 2.2*** 13.5*** 11.2***
0.6 0.7 0.9 0.3 0.8 0.9 0.4 1.0 1.0EthnicminoritygroupsTày 3.7*** 10.0*** 6.3*** 0.3 6.9*** 6.6*** 2.6** 19.5*** 16.8***
1.2 1.7 2.1 0.3 1.4 1.4 1.1 2.3 2.5Thái 0.3 8.8*** 8.5*** 0.8* 6.0*** 5.2*** 4.7*** 12.1*** 7.4***
0.3 1.6 1.6 0.5 1.6 1.7 1.5 2.3 2.7Mường 0.8 9.0*** 8.1*** 1.8* 5.5*** 3.7 7.0*** 28.1*** 21.1***
0.7 1.9 2.0 1.0 2.1 2.3 2.0 3.4 3.9Nùng 0.8 7.2** 6.4** 1.2 5.3*** 4.1** 1.8 14.2*** 12.3***
0.8 2.9 3.0 1.0 1.6 1.8 1.5 3.4 3.7
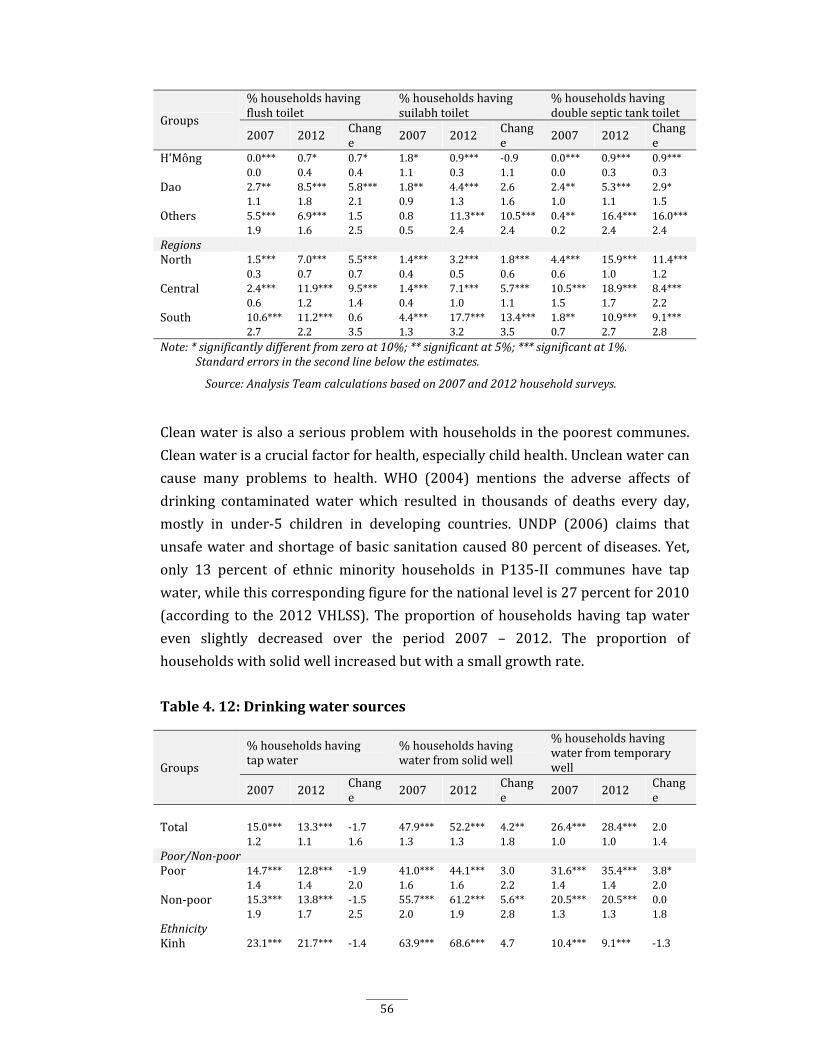
56
Groups
%householdshavingflushtoilet
%householdshavingsuilabhtoilet
%householdshavingdoubleseptictanktoilet
2007 2012 Change 2007 2012 Chang
e 2007 2012 Change
H'Mông 0.0*** 0.7* 0.7* 1.8* 0.9*** ‐0.9 0.0*** 0.9*** 0.9***0.0 0.4 0.4 1.1 0.3 1.1 0.0 0.3 0.3
Dao 2.7** 8.5*** 5.8*** 1.8** 4.4*** 2.6 2.4** 5.3*** 2.9*1.1 1.8 2.1 0.9 1.3 1.6 1.0 1.1 1.5
Others 5.5*** 6.9*** 1.5 0.8 11.3*** 10.5*** 0.4** 16.4*** 16.0***1.9 1.6 2.5 0.5 2.4 2.4 0.2 2.4 2.4
RegionsNorth 1.5*** 7.0*** 5.5*** 1.4*** 3.2*** 1.8*** 4.4*** 15.9*** 11.4***
0.3 0.7 0.7 0.4 0.5 0.6 0.6 1.0 1.2Central 2.4*** 11.9*** 9.5*** 1.4*** 7.1*** 5.7*** 10.5*** 18.9*** 8.4***
0.6 1.2 1.4 0.4 1.0 1.1 1.5 1.7 2.2South 10.6*** 11.2*** 0.6 4.4*** 17.7*** 13.4*** 1.8** 10.9*** 9.1***
2.7 2.2 3.5 1.3 3.2 3.5 0.7 2.7 2.8Note:*significantlydifferentfromzero at10%;**significantat5%;***significantat1%.
Standarderrorsinthesecondlinebelowtheestimates.
Source:AnalysisTeamcalculationsbasedon2007and2012householdsurveys.
Cleanwaterisalsoaseriousproblemwithhouseholdsinthepoorestcommunes.
Cleanwaterisacrucialfactorforhealth,especiallychildhealth.Uncleanwatercan
cause many problems to health. WHO (2004) mentions the adverse affects of
drinking contaminated water which resulted in thousands of deaths every day,
mostly in under‐5 children in developing countries. UNDP (2006) claims that
unsafewaterandshortageofbasicsanitationcaused80percentofdiseases.Yet,
only 13 percent of ethnic minority households in P135‐II communes have tap
water,whilethiscorrespondingfigureforthenationallevelis27percentfor2010
(according to the 2012VHLSS). The proportion of households having tapwater
even slightly decreased over the period 2007 – 2012. The proportion of
householdswithsolidwellincreasedbutwithasmallgrowthrate.
Table4.12:Drinkingwatersources
Groups
%householdshavingtapwater
%householdshavingwaterfromsolidwell
%householdshavingwaterfromtemporarywell
2007 2012 Change 2007 2012 Chang
e 2007 2012 Change
Total 15.0*** 13.3*** ‐1.7 47.9*** 52.2*** 4.2** 26.4*** 28.4*** 2.01.2 1.1 1.6 1.3 1.3 1.8 1.0 1.0 1.4
Poor/Non‐poorPoor 14.7*** 12.8*** ‐1.9 41.0*** 44.1*** 3.0 31.6*** 35.4*** 3.8*
1.4 1.4 2.0 1.6 1.6 2.2 1.4 1.4 2.0Non‐poor 15.3*** 13.8*** ‐1.5 55.7*** 61.2*** 5.6** 20.5*** 20.5*** 0.0
1.9 1.7 2.5 2.0 1.9 2.8 1.3 1.3 1.8EthnicityKinh 23.1*** 21.7*** ‐1.4 63.9*** 68.6*** 4.7 10.4*** 9.1*** ‐1.3
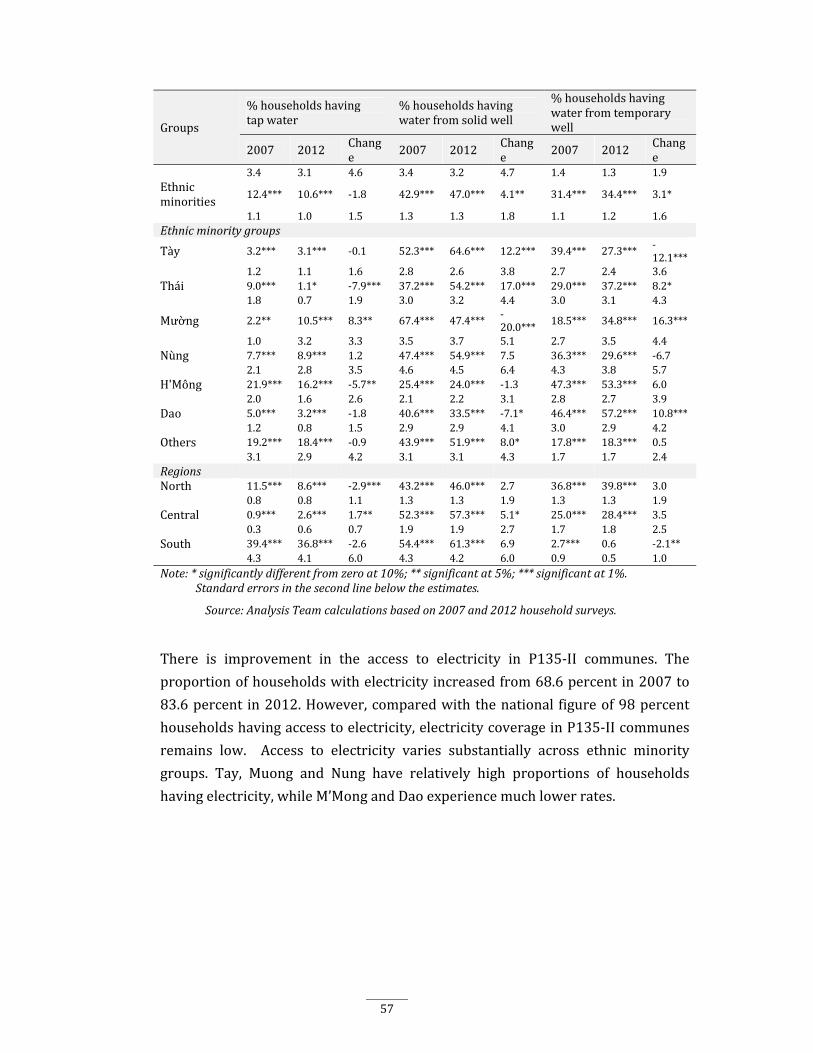
57
Groups
%householdshavingtapwater
%householdshavingwaterfromsolidwell
%householdshavingwaterfromtemporarywell
2007 2012 Change 2007 2012 Chang
e 2007 2012 Change
3.4 3.1 4.6 3.4 3.2 4.7 1.4 1.3 1.9Ethnicminorities
12.4*** 10.6*** ‐1.8 42.9*** 47.0*** 4.1** 31.4*** 34.4*** 3.1*
1.1 1.0 1.5 1.3 1.3 1.8 1.1 1.2 1.6Ethnicminoritygroups
Tày 3.2*** 3.1*** ‐0.1 52.3*** 64.6*** 12.2*** 39.4*** 27.3***‐12.1***
1.2 1.1 1.6 2.8 2.6 3.8 2.7 2.4 3.6Thái 9.0*** 1.1* ‐7.9*** 37.2*** 54.2*** 17.0*** 29.0*** 37.2*** 8.2*
1.8 0.7 1.9 3.0 3.2 4.4 3.0 3.1 4.3
Mường 2.2** 10.5*** 8.3** 67.4*** 47.4***‐20.0***
18.5*** 34.8*** 16.3***
1.0 3.2 3.3 3.5 3.7 5.1 2.7 3.5 4.4Nùng 7.7*** 8.9*** 1.2 47.4*** 54.9*** 7.5 36.3*** 29.6*** ‐6.7
2.1 2.8 3.5 4.6 4.5 6.4 4.3 3.8 5.7H'Mông 21.9*** 16.2*** ‐5.7** 25.4*** 24.0*** ‐1.3 47.3*** 53.3*** 6.0
2.0 1.6 2.6 2.1 2.2 3.1 2.8 2.7 3.9Dao 5.0*** 3.2*** ‐1.8 40.6*** 33.5*** ‐7.1* 46.4*** 57.2*** 10.8***
1.2 0.8 1.5 2.9 2.9 4.1 3.0 2.9 4.2Others 19.2*** 18.4*** ‐0.9 43.9*** 51.9*** 8.0* 17.8*** 18.3*** 0.5
3.1 2.9 4.2 3.1 3.1 4.3 1.7 1.7 2.4RegionsNorth 11.5*** 8.6*** ‐2.9*** 43.2*** 46.0*** 2.7 36.8*** 39.8*** 3.0
0.8 0.8 1.1 1.3 1.3 1.9 1.3 1.3 1.9Central 0.9*** 2.6*** 1.7** 52.3*** 57.3*** 5.1* 25.0*** 28.4*** 3.5
0.3 0.6 0.7 1.9 1.9 2.7 1.7 1.8 2.5South 39.4*** 36.8*** ‐2.6 54.4*** 61.3*** 6.9 2.7*** 0.6 ‐2.1**
4.3 4.1 6.0 4.3 4.2 6.0 0.9 0.5 1.0Note:*significantlydifferentfromzero at10%;**significantat5%;***significantat1%.
Standarderrorsinthesecondlinebelowtheestimates.
Source:AnalysisTeamcalculationsbasedon2007and2012householdsurveys.
There is improvement in the access to electricity in P135‐II communes. The
proportionofhouseholdswithelectricityincreasedfrom68.6percentin2007to
83.6percent in2012.However,comparedwith thenational figureof98percent
householdshavingaccesstoelectricity,electricitycoverageinP135‐IIcommunes
remains low. Access to electricity varies substantially across ethnic minority
groups. Tay, Muong and Nung have relatively high proportions of households
havingelectricity,whileM’MongandDaoexperiencemuchlowerrates.
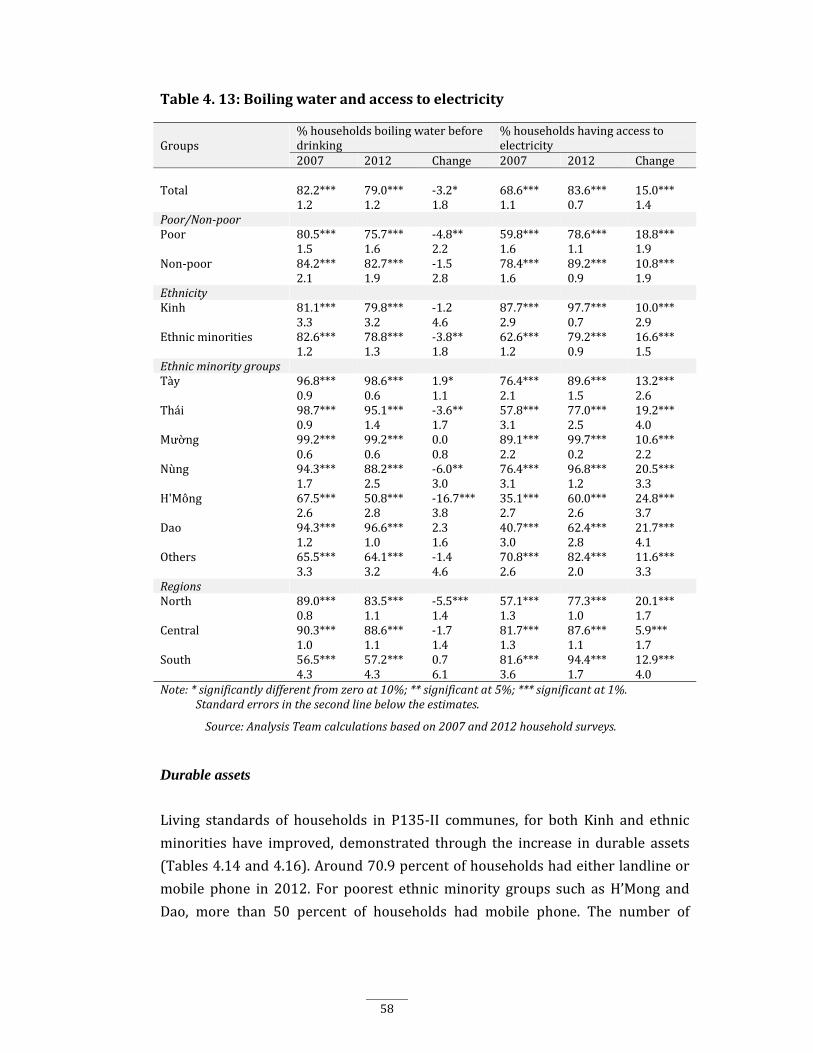
58
Table4.13:Boilingwaterandaccesstoelectricity
Groups%householdsboilingwaterbeforedrinking
%householdshavingaccesstoelectricity
2007 2012 Change 2007 2012 Change
Total 82.2*** 79.0*** ‐3.2* 68.6*** 83.6*** 15.0***1.2 1.2 1.8 1.1 0.7 1.4
Poor/Non‐poorPoor 80.5*** 75.7*** ‐4.8** 59.8*** 78.6*** 18.8***
1.5 1.6 2.2 1.6 1.1 1.9Non‐poor 84.2*** 82.7*** ‐1.5 78.4*** 89.2*** 10.8***
2.1 1.9 2.8 1.6 0.9 1.9EthnicityKinh 81.1*** 79.8*** ‐1.2 87.7*** 97.7*** 10.0***
3.3 3.2 4.6 2.9 0.7 2.9Ethnicminorities 82.6*** 78.8*** ‐3.8** 62.6*** 79.2*** 16.6***
1.2 1.3 1.8 1.2 0.9 1.5EthnicminoritygroupsTày 96.8*** 98.6*** 1.9* 76.4*** 89.6*** 13.2***
0.9 0.6 1.1 2.1 1.5 2.6Thái 98.7*** 95.1*** ‐3.6** 57.8*** 77.0*** 19.2***
0.9 1.4 1.7 3.1 2.5 4.0Mường 99.2*** 99.2*** 0.0 89.1*** 99.7*** 10.6***
0.6 0.6 0.8 2.2 0.2 2.2Nùng 94.3*** 88.2*** ‐6.0** 76.4*** 96.8*** 20.5***
1.7 2.5 3.0 3.1 1.2 3.3H'Mông 67.5*** 50.8*** ‐16.7*** 35.1*** 60.0*** 24.8***
2.6 2.8 3.8 2.7 2.6 3.7Dao 94.3*** 96.6*** 2.3 40.7*** 62.4*** 21.7***
1.2 1.0 1.6 3.0 2.8 4.1Others 65.5*** 64.1*** ‐1.4 70.8*** 82.4*** 11.6***
3.3 3.2 4.6 2.6 2.0 3.3RegionsNorth 89.0*** 83.5*** ‐5.5*** 57.1*** 77.3*** 20.1***
0.8 1.1 1.4 1.3 1.0 1.7Central 90.3*** 88.6*** ‐1.7 81.7*** 87.6*** 5.9***
1.0 1.1 1.4 1.3 1.1 1.7South 56.5*** 57.2*** 0.7 81.6*** 94.4*** 12.9***
4.3 4.3 6.1 3.6 1.7 4.0Note:*significantlydifferentfromzero at10%;**significantat5%;***significantat1%.
Standarderrorsinthesecondlinebelowtheestimates.
Source:AnalysisTeamcalculationsbasedon2007and2012householdsurveys.
Durable assets
Living standards of households in P135‐II communes, for both Kinh and ethnic
minorities have improved, demonstrated through the increase in durable assets
(Tables4.14and4.16).Around70.9percentofhouseholdshadeitherlandlineor
mobile phone in 2012. For poorest ethnicminority groups such asH’Mong and
Dao, more than 50 percent of households had mobile phone. The number of
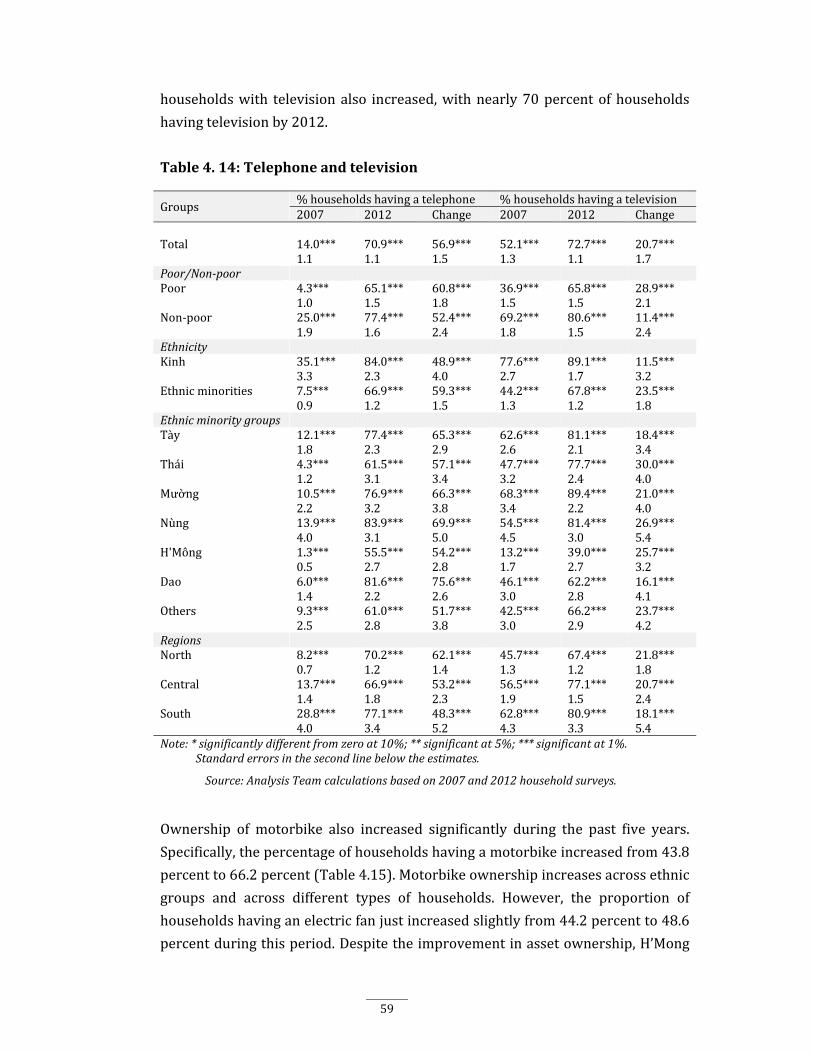
59
householdswith televisionalso increased,withnearly70percentofhouseholds
havingtelevisionby2012.
Table4.14:Telephoneandtelevision
Groups%householdshavingatelephone %householdshavingatelevision2007 2012 Change 2007 2012 Change
Total 14.0*** 70.9*** 56.9*** 52.1*** 72.7*** 20.7***1.1 1.1 1.5 1.3 1.1 1.7
Poor/Non‐poorPoor 4.3*** 65.1*** 60.8*** 36.9*** 65.8*** 28.9***
1.0 1.5 1.8 1.5 1.5 2.1Non‐poor 25.0*** 77.4*** 52.4*** 69.2*** 80.6*** 11.4***
1.9 1.6 2.4 1.8 1.5 2.4EthnicityKinh 35.1*** 84.0*** 48.9*** 77.6*** 89.1*** 11.5***
3.3 2.3 4.0 2.7 1.7 3.2Ethnicminorities 7.5*** 66.9*** 59.3*** 44.2*** 67.8*** 23.5***
0.9 1.2 1.5 1.3 1.2 1.8EthnicminoritygroupsTày 12.1*** 77.4*** 65.3*** 62.6*** 81.1*** 18.4***
1.8 2.3 2.9 2.6 2.1 3.4Thái 4.3*** 61.5*** 57.1*** 47.7*** 77.7*** 30.0***
1.2 3.1 3.4 3.2 2.4 4.0Mường 10.5*** 76.9*** 66.3*** 68.3*** 89.4*** 21.0***
2.2 3.2 3.8 3.4 2.2 4.0Nùng 13.9*** 83.9*** 69.9*** 54.5*** 81.4*** 26.9***
4.0 3.1 5.0 4.5 3.0 5.4H'Mông 1.3*** 55.5*** 54.2*** 13.2*** 39.0*** 25.7***
0.5 2.7 2.8 1.7 2.7 3.2Dao 6.0*** 81.6*** 75.6*** 46.1*** 62.2*** 16.1***
1.4 2.2 2.6 3.0 2.8 4.1Others 9.3*** 61.0*** 51.7*** 42.5*** 66.2*** 23.7***
2.5 2.8 3.8 3.0 2.9 4.2RegionsNorth 8.2*** 70.2*** 62.1*** 45.7*** 67.4*** 21.8***
0.7 1.2 1.4 1.3 1.2 1.8Central 13.7*** 66.9*** 53.2*** 56.5*** 77.1*** 20.7***
1.4 1.8 2.3 1.9 1.5 2.4South 28.8*** 77.1*** 48.3*** 62.8*** 80.9*** 18.1***
4.0 3.4 5.2 4.3 3.3 5.4Note:*significantlydifferentfromzero at10%;**significantat5%;***significantat1%.
Standarderrorsinthesecondlinebelowtheestimates.
Source:AnalysisTeamcalculationsbasedon2007and2012householdsurveys.
Ownership of motorbike also increased significantly during the past five years.
Specifically,thepercentageofhouseholdshavingamotorbikeincreasedfrom43.8
percentto66.2percent(Table4.15).Motorbikeownershipincreasesacrossethnic
groups and across different types of households. However, the proportion of
householdshavinganelectricfanjustincreasedslightlyfrom44.2percentto48.6
percentduringthisperiod.Despitetheimprovementinassetownership,H’Mong
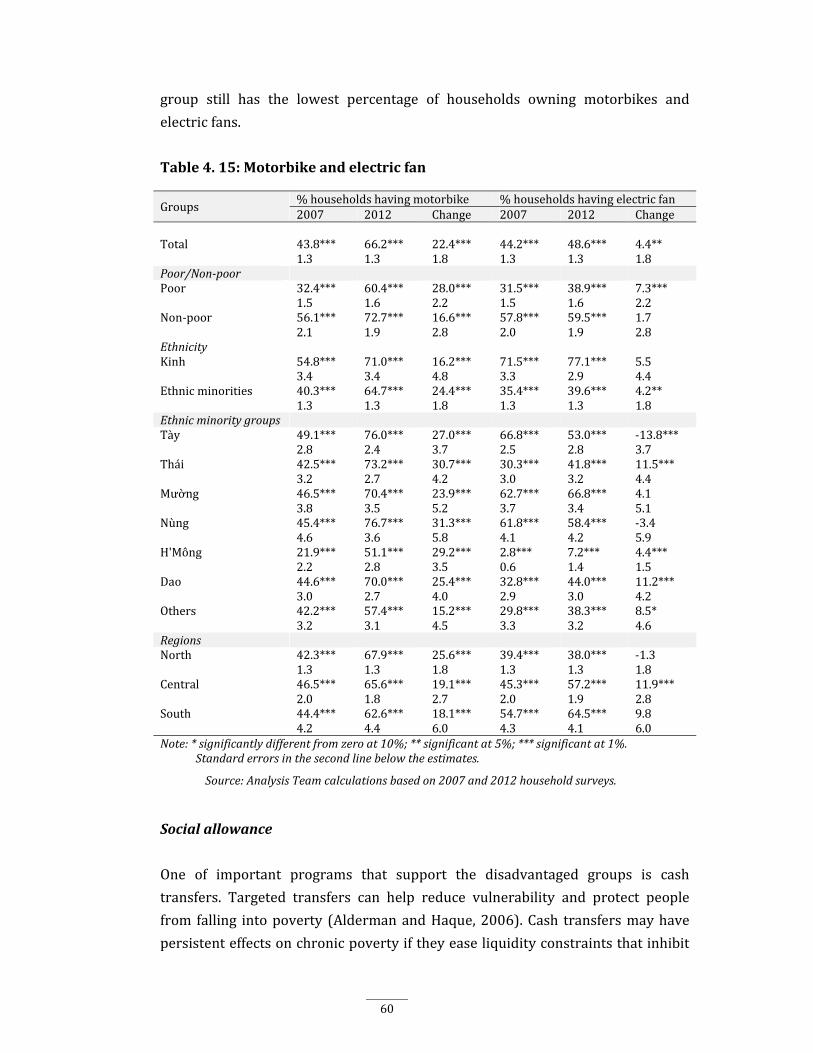
60
group still has the lowest percentage of households owning motorbikes and
electricfans.
Table4.15:Motorbikeandelectricfan
Groups%householdshavingmotorbike %householdshavingelectricfan2007 2012 Change 2007 2012 Change
Total 43.8*** 66.2*** 22.4*** 44.2*** 48.6*** 4.4**1.3 1.3 1.8 1.3 1.3 1.8
Poor/Non‐poorPoor 32.4*** 60.4*** 28.0*** 31.5*** 38.9*** 7.3***
1.5 1.6 2.2 1.5 1.6 2.2Non‐poor 56.1*** 72.7*** 16.6*** 57.8*** 59.5*** 1.7
2.1 1.9 2.8 2.0 1.9 2.8EthnicityKinh 54.8*** 71.0*** 16.2*** 71.5*** 77.1*** 5.5
3.4 3.4 4.8 3.3 2.9 4.4Ethnicminorities 40.3*** 64.7*** 24.4*** 35.4*** 39.6*** 4.2**
1.3 1.3 1.8 1.3 1.3 1.8EthnicminoritygroupsTày 49.1*** 76.0*** 27.0*** 66.8*** 53.0*** ‐13.8***
2.8 2.4 3.7 2.5 2.8 3.7Thái 42.5*** 73.2*** 30.7*** 30.3*** 41.8*** 11.5***
3.2 2.7 4.2 3.0 3.2 4.4Mường 46.5*** 70.4*** 23.9*** 62.7*** 66.8*** 4.1
3.8 3.5 5.2 3.7 3.4 5.1Nùng 45.4*** 76.7*** 31.3*** 61.8*** 58.4*** ‐3.4
4.6 3.6 5.8 4.1 4.2 5.9H'Mông 21.9*** 51.1*** 29.2*** 2.8*** 7.2*** 4.4***
2.2 2.8 3.5 0.6 1.4 1.5Dao 44.6*** 70.0*** 25.4*** 32.8*** 44.0*** 11.2***
3.0 2.7 4.0 2.9 3.0 4.2Others 42.2*** 57.4*** 15.2*** 29.8*** 38.3*** 8.5*
3.2 3.1 4.5 3.3 3.2 4.6RegionsNorth 42.3*** 67.9*** 25.6*** 39.4*** 38.0*** ‐1.3
1.3 1.3 1.8 1.3 1.3 1.8Central 46.5*** 65.6*** 19.1*** 45.3*** 57.2*** 11.9***
2.0 1.8 2.7 2.0 1.9 2.8South 44.4*** 62.6*** 18.1*** 54.7*** 64.5*** 9.8
4.2 4.4 6.0 4.3 4.1 6.0Note:*significantlydifferentfromzero at10%;**significantat5%;***significantat1%.
Standarderrorsinthesecondlinebelowtheestimates.
Source:AnalysisTeamcalculationsbasedon2007and2012householdsurveys.
Socialallowance
One of important programs that support the disadvantaged groups is cash
transfers. Targeted transfers can help reduce vulnerability and protect people
from falling intopoverty (AldermanandHaque,2006).Cash transfersmayhave
persistenteffectsonchronicpovertyiftheyeaseliquidityconstraintsthatinhibit
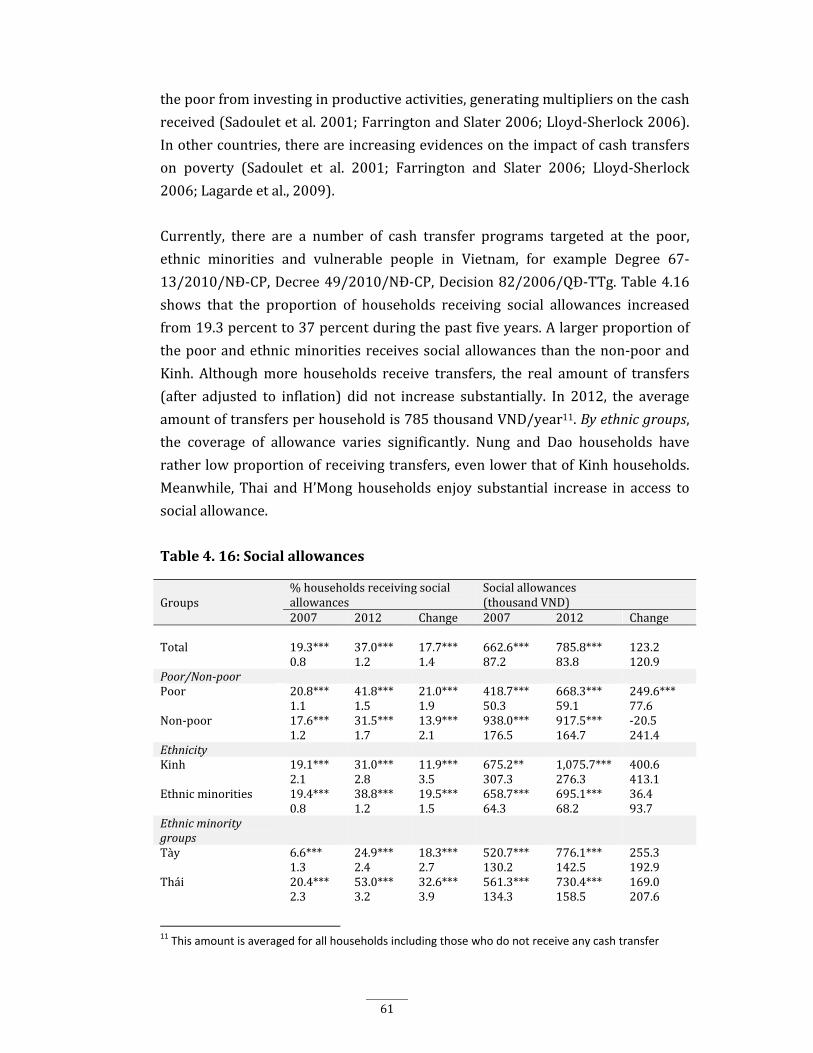
61
thepoorfrominvestinginproductiveactivities,generatingmultipliersonthecash
received(Sadouletetal.2001;FarringtonandSlater2006;Lloyd‐Sherlock2006).
Inothercountries,thereareincreasingevidencesontheimpactofcashtransfers
on poverty (Sadoulet et al. 2001; Farrington and Slater 2006; Lloyd‐Sherlock
2006;Lagardeetal.,2009).
Currently, there are a number of cash transfer programs targeted at the poor,
ethnic minorities and vulnerable people in Vietnam, for example Degree 67‐
13/2010/NÐ‐CP,Decree49/2010/NÐ‐CP,Decision82/2006/QĐ‐TTg.Table4.16
shows that the proportion of households receiving social allowances increased
from19.3percentto37percentduringthepastfiveyears.Alargerproportionof
thepoorandethnicminoritiesreceivessocialallowancesthanthenon‐poorand
Kinh. Althoughmore households receive transfers, the real amount of transfers
(after adjusted to inflation) did not increase substantially. In 2012, the average
amountoftransfersperhouseholdis785thousandVND/year11.Byethnicgroups,
the coverage of allowance varies significantly. Nung and Dao households have
ratherlowproportionofreceivingtransfers,evenlowerthatofKinhhouseholds.
Meanwhile, Thai andH’Monghouseholds enjoy substantial increase in access to
socialallowance.
Table4.16:Socialallowances
Groups%householdsreceivingsocialallowances
Socialallowances(thousandVND)
2007 2012 Change 2007 2012 Change
Total 19.3*** 37.0*** 17.7*** 662.6*** 785.8*** 123.20.8 1.2 1.4 87.2 83.8 120.9
Poor/Non‐poorPoor 20.8*** 41.8*** 21.0*** 418.7*** 668.3*** 249.6***
1.1 1.5 1.9 50.3 59.1 77.6Non‐poor 17.6*** 31.5*** 13.9*** 938.0*** 917.5*** ‐20.5
1.2 1.7 2.1 176.5 164.7 241.4EthnicityKinh 19.1*** 31.0*** 11.9*** 675.2** 1,075.7*** 400.6
2.1 2.8 3.5 307.3 276.3 413.1Ethnicminorities 19.4*** 38.8*** 19.5*** 658.7*** 695.1*** 36.4
0.8 1.2 1.5 64.3 68.2 93.7Ethnicminoritygroups Tày 6.6*** 24.9*** 18.3*** 520.7*** 776.1*** 255.3
1.3 2.4 2.7 130.2 142.5 192.9Thái 20.4*** 53.0*** 32.6*** 561.3*** 730.4*** 169.0
2.3 3.2 3.9 134.3 158.5 207.6
11 This amount is averaged for all households including those who do not receive any cash transfer

62
Groups%householdsreceivingsocialallowances
Socialallowances(thousandVND)
2007 2012 Change 2007 2012 ChangeMường 12.0*** 20.1*** 8.1** 760.6*** 458.2*** ‐302.4
2.3 2.8 3.7 215.9 100.6 237.9Nùng 1.4* 17.7*** 16.3*** 178.4 271.7*** 93.2
0.9 3.5 3.6 112.7 82.0 139.2H'Mông 10.4*** 50.7*** 40.3*** 221.1*** 545.9*** 324.8***
1.3 2.8 3.1 61.4 60.1 85.9Dao 7.1*** 19.5*** 12.3*** 151.1** 255.9*** 104.8
1.5 2.3 2.7 71.3 64.9 96.4Others 39.9*** 46.6*** 6.6* 1,252.9*** 1,019.5*** ‐233.3
2.6 3.0 4.0 184.5 203.5 274.6RegionsNorth 8.5*** 37.1*** 28.6*** 305.3*** 629.2*** 323.9***
0.7 1.3 1.5 44.4 50.7 67.4Central 53.9*** 49.4*** ‐4.6* 1,285.0*** 988.4*** ‐296.7
1.9 1.9 2.7 122.4 146.6 190.9South 5.8*** 22.4*** 16.6*** 825.3** 935.6*** 110.3
1.4 3.2 3.5 363.0 323.2 485.5Note:*significantlydifferentfromzero at10%;**significantat5%;***significantat1%.
Standarderrorsinthesecondlinebelowtheestimates.
Source:AnalysisTeamcalculationsbasedon2007and2012householdsurveys.
4.2.2 Incomestructure
Productive assets and income diversification plays an important role in
sustainablepovertyreduction.Table4.17showsthathouseholdsinP135‐IIareas
rely largelyonagricultural income.Nearly60percentof totalhousehold income
comes from fromagricultural activities.Among farm income, crop and livestock
arethemainincomecontributionsources(Table4.18).Thereisatransitionfrom
farm to non‐farm activities. The share of income from wage tends to increase
overtime,albeitatalowrate.
Table4.17:Householdincomestructure
Householdincome(thousandVND/year) Incomeshare(%)2007 2012 Change 2007 2012 Change
Totalhouseholdincome
29,442.66*** 34,095.74*** 4,653.08*** 100.00 100.00 0.00
884.10 919.25 1,275.31
Salary 6,402.72*** 10,000.03*** 3,597.31*** 19.54*** 23.92*** 4.38***
368.93 453.90 584.88 0.91 1.07 1.40Agriculture,forestryandaquaculture
16,688.06*** 17,464.36*** 776.30 63.50*** 57.47*** ‐6.03***
544.95 618.14 824.00 1.04 1.15 1.55
Non‐farm 2,706.65*** 2,521.03*** ‐185.61 5.32*** 4.73*** ‐0.59
537.01 457.36 705.33 0.54 0.65 0.85
Others 3,645.23*** 4,110.32*** 465.09 11.64*** 13.88*** 2.24***
260.65 232.86 349.49 0.51 0.67 0.84
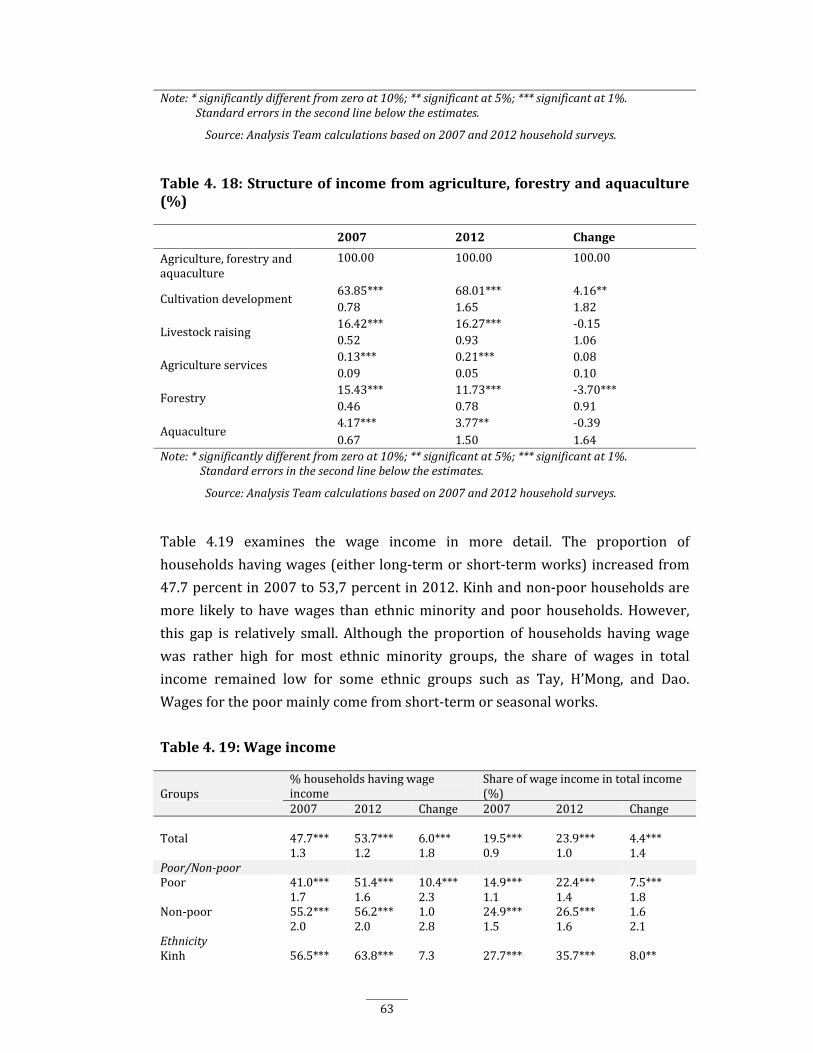
63
Note:*significantlydifferentfromzero at10%;**significantat5%;***significantat1%.Standarderrorsinthesecondlinebelowtheestimates.
Source:AnalysisTeamcalculationsbasedon2007and2012householdsurveys.
Table4.18:Structureofincomefromagriculture,forestryandaquaculture(%)
2007 2012 Change
Agriculture,forestryandaquaculture
100.00 100.00 100.00
Cultivationdevelopment63.85*** 68.01*** 4.16**0.78 1.65 1.82
Livestockraising16.42*** 16.27*** ‐0.150.52 0.93 1.06
Agricultureservices0.13*** 0.21*** 0.080.09 0.05 0.10
Forestry15.43*** 11.73*** ‐3.70***0.46 0.78 0.91
Aquaculture4.17*** 3.77** ‐0.390.67 1.50 1.64
Note:*significantlydifferentfromzero at10%;**significantat5%;***significantat1%.Standarderrorsinthesecondlinebelowtheestimates.
Source:AnalysisTeamcalculationsbasedon2007and2012householdsurveys.
Table 4.19 examines the wage income in more detail. The proportion of
householdshavingwages(eitherlong‐termorshort‐termworks)increasedfrom
47.7percentin2007to53,7percentin2012.Kinhandnon‐poorhouseholdsare
more likely to havewages than ethnicminority andpoor households.However,
this gap is relatively small. Although the proportion of households havingwage
was rather high for most ethnic minority groups, the share of wages in total
income remained low for some ethnic groups such as Tay, H’Mong, and Dao.
Wagesforthepoormainlycomefromshort‐termorseasonalworks.
Table4.19:Wageincome
Groups%householdshavingwageincome
Shareofwageincomeintotalincome(%)
2007 2012 Change 2007 2012 Change
Total 47.7*** 53.7*** 6.0*** 19.5*** 23.9*** 4.4***1.3 1.2 1.8 0.9 1.0 1.4
Poor/Non‐poorPoor 41.0*** 51.4*** 10.4*** 14.9*** 22.4*** 7.5***
1.7 1.6 2.3 1.1 1.4 1.8Non‐poor 55.2*** 56.2*** 1.0 24.9*** 26.5*** 1.6
2.0 2.0 2.8 1.5 1.6 2.1EthnicityKinh 56.5*** 63.8*** 7.3 27.7*** 35.7*** 8.0**
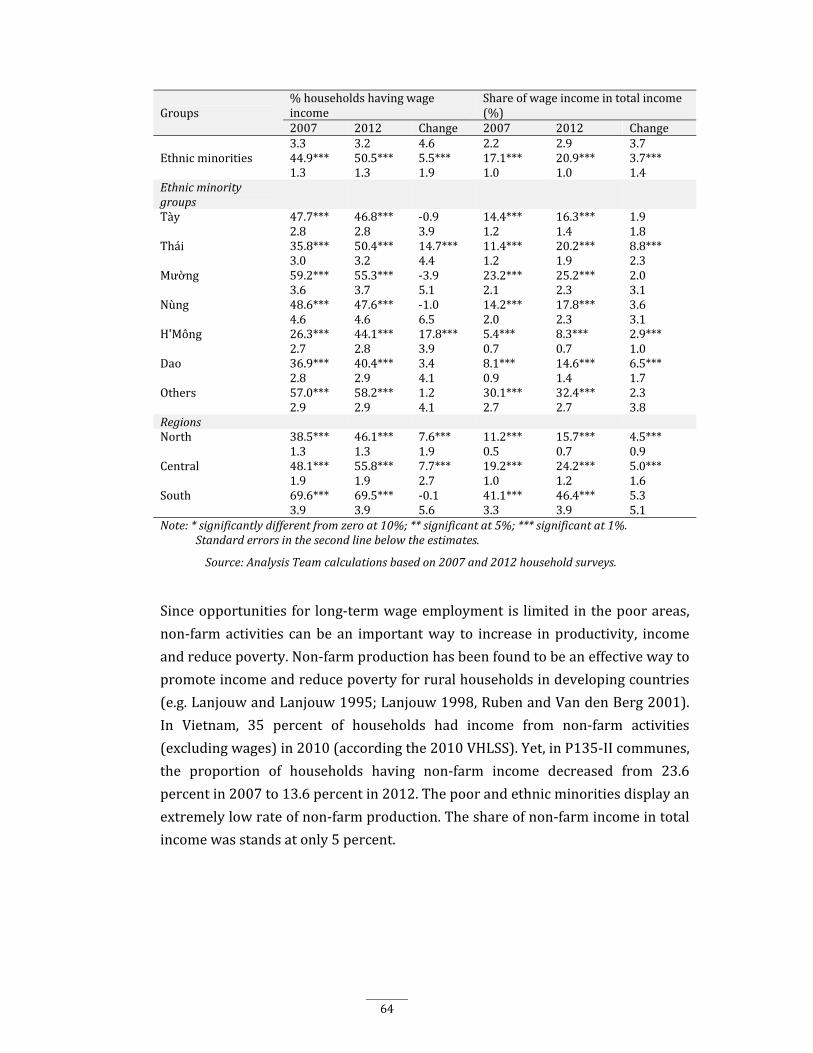
64
Groups%householdshavingwageincome
Shareofwageincomeintotalincome(%)
2007 2012 Change 2007 2012 Change3.3 3.2 4.6 2.2 2.9 3.7
Ethnicminorities 44.9*** 50.5*** 5.5*** 17.1*** 20.9*** 3.7***1.3 1.3 1.9 1.0 1.0 1.4
Ethnicminoritygroups Tày 47.7*** 46.8*** ‐0.9 14.4*** 16.3*** 1.9
2.8 2.8 3.9 1.2 1.4 1.8Thái 35.8*** 50.4*** 14.7*** 11.4*** 20.2*** 8.8***
3.0 3.2 4.4 1.2 1.9 2.3Mường 59.2*** 55.3*** ‐3.9 23.2*** 25.2*** 2.0
3.6 3.7 5.1 2.1 2.3 3.1Nùng 48.6*** 47.6*** ‐1.0 14.2*** 17.8*** 3.6
4.6 4.6 6.5 2.0 2.3 3.1H'Mông 26.3*** 44.1*** 17.8*** 5.4*** 8.3*** 2.9***
2.7 2.8 3.9 0.7 0.7 1.0Dao 36.9*** 40.4*** 3.4 8.1*** 14.6*** 6.5***
2.8 2.9 4.1 0.9 1.4 1.7Others 57.0*** 58.2*** 1.2 30.1*** 32.4*** 2.3
2.9 2.9 4.1 2.7 2.7 3.8RegionsNorth 38.5*** 46.1*** 7.6*** 11.2*** 15.7*** 4.5***
1.3 1.3 1.9 0.5 0.7 0.9Central 48.1*** 55.8*** 7.7*** 19.2*** 24.2*** 5.0***
1.9 1.9 2.7 1.0 1.2 1.6South 69.6*** 69.5*** ‐0.1 41.1*** 46.4*** 5.3
3.9 3.9 5.6 3.3 3.9 5.1Note:*significantlydifferentfromzero at10%;**significantat5%;***significantat1%.
Standarderrorsinthesecondlinebelowtheestimates.
Source:AnalysisTeamcalculationsbasedon2007and2012householdsurveys.
Sinceopportunities for long‐termwageemployment is limitedinthepoorareas,
non‐farmactivities canbe an importantway to increase inproductivity, income
andreducepoverty.Non‐farmproductionhasbeenfoundtobeaneffectivewayto
promoteincomeandreducepovertyforruralhouseholdsindevelopingcountries
(e.g.LanjouwandLanjouw1995;Lanjouw1998,RubenandVandenBerg2001).
In Vietnam, 35 percent of households had income from non‐farm activities
(excludingwages)in2010(accordingthe2010VHLSS).Yet,inP135‐IIcommunes,
the proportion of households having non‐farm income decreased from 23.6
percentin2007to13.6percentin2012.Thepoorandethnicminoritiesdisplayan
extremelylowrateofnon‐farmproduction.Theshareofnon‐farmincomeintotal
incomewasstandsatonly5percent.
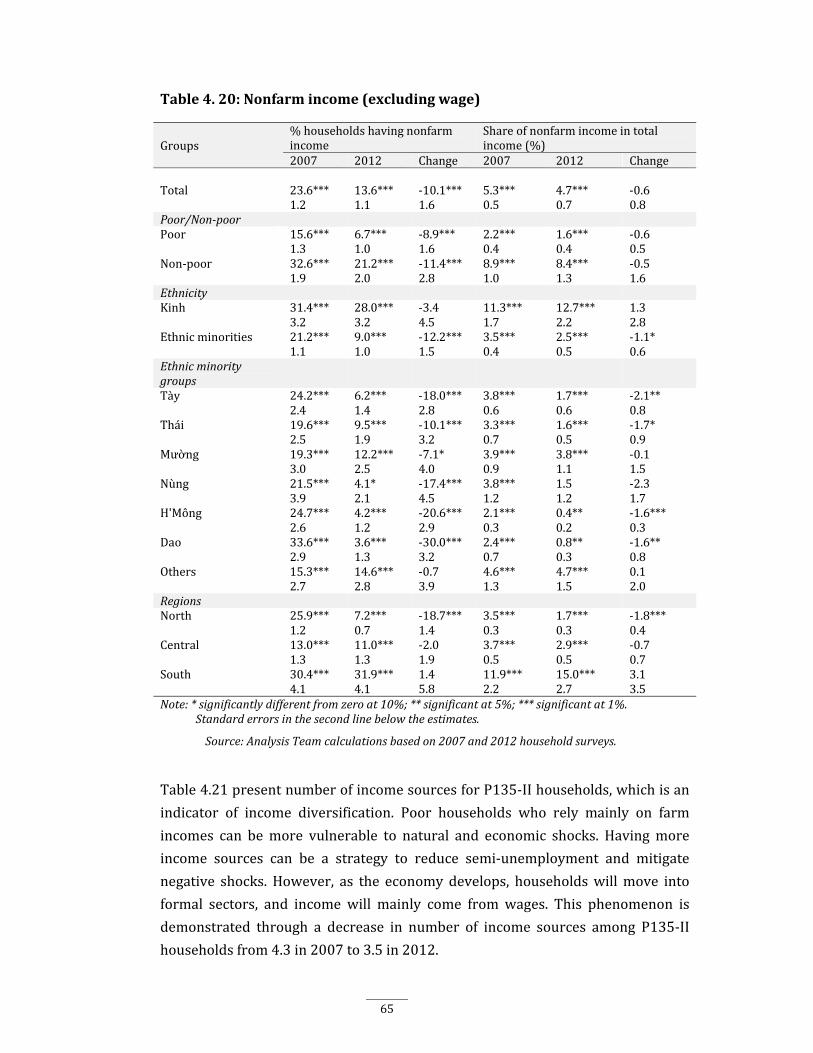
65
Table4.20:Nonfarmincome(excludingwage)
Groups%householdshavingnonfarmincome
Shareofnonfarmincomeintotalincome(%)
2007 2012 Change 2007 2012 Change
Total 23.6*** 13.6*** ‐10.1*** 5.3*** 4.7*** ‐0.61.2 1.1 1.6 0.5 0.7 0.8
Poor/Non‐poorPoor 15.6*** 6.7*** ‐8.9*** 2.2*** 1.6*** ‐0.6
1.3 1.0 1.6 0.4 0.4 0.5Non‐poor 32.6*** 21.2*** ‐11.4*** 8.9*** 8.4*** ‐0.5
1.9 2.0 2.8 1.0 1.3 1.6EthnicityKinh 31.4*** 28.0*** ‐3.4 11.3*** 12.7*** 1.3
3.2 3.2 4.5 1.7 2.2 2.8Ethnicminorities 21.2*** 9.0*** ‐12.2*** 3.5*** 2.5*** ‐1.1*
1.1 1.0 1.5 0.4 0.5 0.6Ethnicminoritygroups Tày 24.2*** 6.2*** ‐18.0*** 3.8*** 1.7*** ‐2.1**
2.4 1.4 2.8 0.6 0.6 0.8Thái 19.6*** 9.5*** ‐10.1*** 3.3*** 1.6*** ‐1.7*
2.5 1.9 3.2 0.7 0.5 0.9Mường 19.3*** 12.2*** ‐7.1* 3.9*** 3.8*** ‐0.1
3.0 2.5 4.0 0.9 1.1 1.5Nùng 21.5*** 4.1* ‐17.4*** 3.8*** 1.5 ‐2.3
3.9 2.1 4.5 1.2 1.2 1.7H'Mông 24.7*** 4.2*** ‐20.6*** 2.1*** 0.4** ‐1.6***
2.6 1.2 2.9 0.3 0.2 0.3Dao 33.6*** 3.6*** ‐30.0*** 2.4*** 0.8** ‐1.6**
2.9 1.3 3.2 0.7 0.3 0.8Others 15.3*** 14.6*** ‐0.7 4.6*** 4.7*** 0.1
2.7 2.8 3.9 1.3 1.5 2.0RegionsNorth 25.9*** 7.2*** ‐18.7*** 3.5*** 1.7*** ‐1.8***
1.2 0.7 1.4 0.3 0.3 0.4Central 13.0*** 11.0*** ‐2.0 3.7*** 2.9*** ‐0.7
1.3 1.3 1.9 0.5 0.5 0.7South 30.4*** 31.9*** 1.4 11.9*** 15.0*** 3.1
4.1 4.1 5.8 2.2 2.7 3.5Note:*significantlydifferentfromzero at10%;**significantat5%;***significantat1%.
Standarderrorsinthesecondlinebelowtheestimates.
Source:AnalysisTeamcalculationsbasedon2007and2012householdsurveys.
Table4.21presentnumberofincomesourcesforP135‐IIhouseholds,whichisan
indicator of income diversification. Poor households who rely mainly on farm
incomes can bemore vulnerable to natural and economic shocks. Havingmore
income sources can be a strategy to reduce semi‐unemployment and mitigate
negative shocks. However, as the economy develops, householdswillmove into
formal sectors, and income will mainly come fromwages. This phenomenon is
demonstrated through a decrease in number of income sources among P135‐II
householdsfrom4.3in2007to3.5in2012.
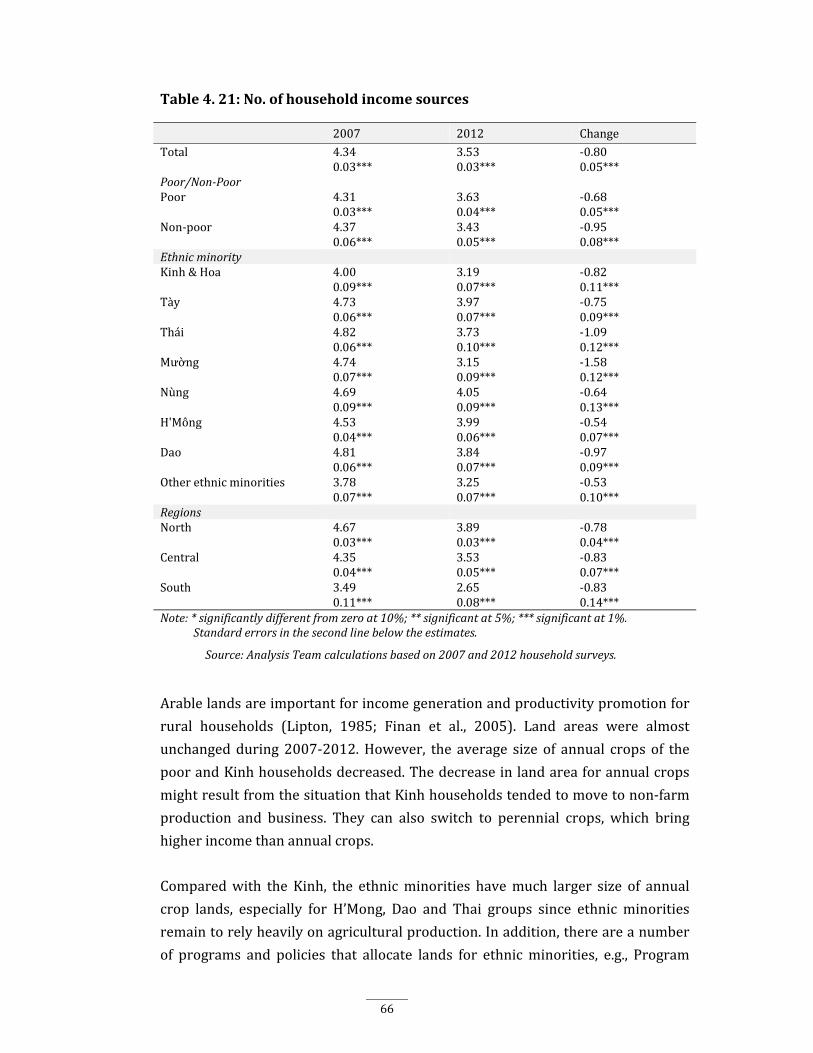
66
Table4.21:No.ofhouseholdincomesources
2007 2012 Change
Total 4.34 3.53 ‐0.800.03*** 0.03*** 0.05***
Poor/Non‐PoorPoor 4.31 3.63 ‐0.68
0.03*** 0.04*** 0.05***Non‐poor 4.37 3.43 ‐0.95
0.06*** 0.05*** 0.08***EthnicminorityKinh&Hoa 4.00 3.19 ‐0.82
0.09*** 0.07*** 0.11***Tày 4.73 3.97 ‐0.75
0.06*** 0.07*** 0.09***Thái 4.82 3.73 ‐1.09
0.06*** 0.10*** 0.12***Mường 4.74 3.15 ‐1.58
0.07*** 0.09*** 0.12***Nùng 4.69 4.05 ‐0.64
0.09*** 0.09*** 0.13***H'Mông 4.53 3.99 ‐0.54
0.04*** 0.06*** 0.07***Dao 4.81 3.84 ‐0.97
0.06*** 0.07*** 0.09***Otherethnicminorities 3.78 3.25 ‐0.53
0.07*** 0.07*** 0.10***RegionsNorth 4.67 3.89 ‐0.78
0.03*** 0.03*** 0.04***Central 4.35 3.53 ‐0.83
0.04*** 0.05*** 0.07***South 3.49 2.65 ‐0.83
0.11*** 0.08*** 0.14***Note:*significantlydifferentfromzero at10%;**significantat5%;***significantat1%.
Standarderrorsinthesecondlinebelowtheestimates.
Source:AnalysisTeamcalculationsbasedon2007and2012householdsurveys.
Arablelandsareimportantforincomegenerationandproductivitypromotionfor
rural households (Lipton, 1985; Finan et al., 2005). Land areas were almost
unchangedduring2007‐2012.However, the average size of annual crops of the
poorandKinhhouseholdsdecreased.Thedecreaseinlandareaforannualcrops
mightresultfromthesituationthatKinhhouseholdstendedtomovetonon‐farm
production and business. They can also switch to perennial crops, which bring
higherincomethanannualcrops.
Comparedwith the Kinh, the ethnicminorities havemuch larger size of annual
crop lands, especially for H’Mong, Dao and Thai groups since ethnic minorities
remaintorelyheavilyonagriculturalproduction.Inaddition,thereareanumber
of programs and policies that allocate lands for ethnicminorities, e.g., Program
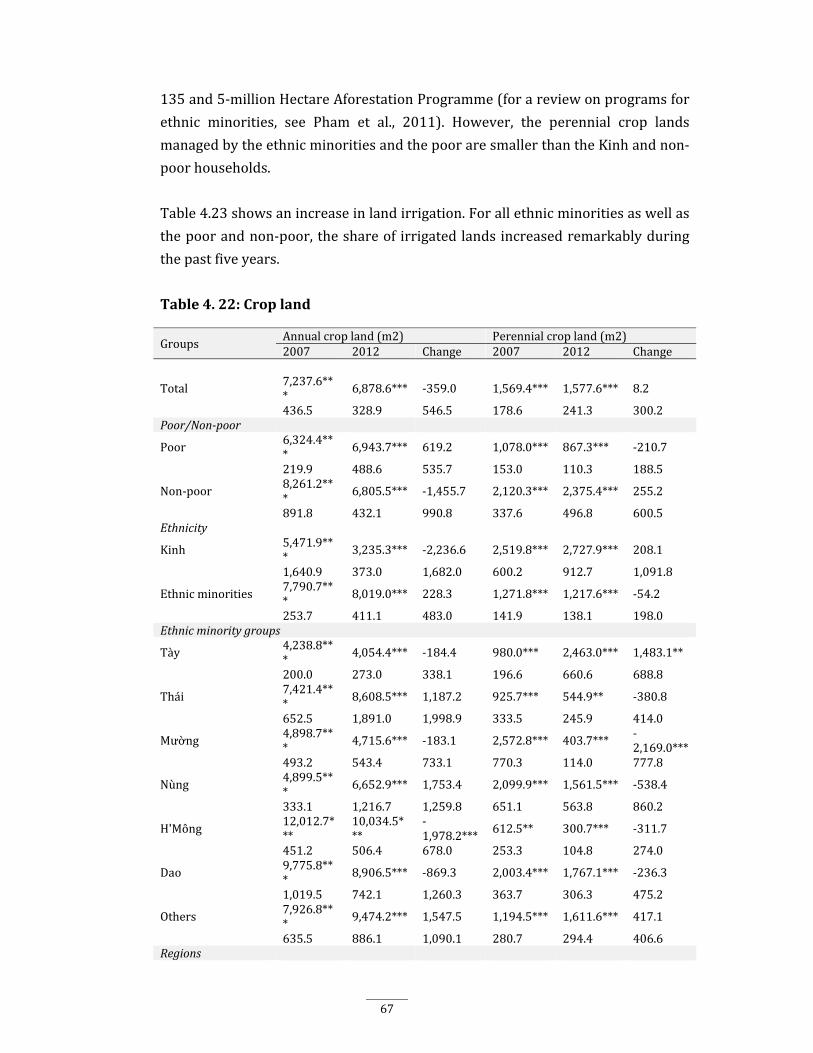
67
135and5‐millionHectareAforestationProgramme(forareviewonprogramsfor
ethnic minorities, see Pham et al., 2011). However, the perennial crop lands
managedbytheethnicminoritiesandthepooraresmallerthantheKinhandnon‐
poorhouseholds.
Table4.23showsanincreaseinlandirrigation.Forallethnicminoritiesaswellas
thepoorandnon‐poor,theshareof irrigatedlandsincreasedremarkablyduring
thepastfiveyears.
Table4.22:Cropland
GroupsAnnualcropland(m2) Perennialcropland(m2)2007 2012 Change 2007 2012 Change
Total 7,237.6***
6,878.6*** ‐359.0 1,569.4*** 1,577.6*** 8.2
436.5 328.9 546.5 178.6 241.3 300.2Poor/Non‐poor
Poor 6,324.4*** 6,943.7*** 619.2 1,078.0*** 867.3*** ‐210.7
219.9 488.6 535.7 153.0 110.3 188.5
Non‐poor 8,261.2***
6,805.5*** ‐1,455.7 2,120.3*** 2,375.4*** 255.2
891.8 432.1 990.8 337.6 496.8 600.5Ethnicity
Kinh 5,471.9*** 3,235.3*** ‐2,236.6 2,519.8*** 2,727.9*** 208.1
1,640.9 373.0 1,682.0 600.2 912.7 1,091.8
Ethnicminorities7,790.7*** 8,019.0*** 228.3 1,271.8*** 1,217.6*** ‐54.2
253.7 411.1 483.0 141.9 138.1 198.0Ethnicminoritygroups
Tày 4,238.8***
4,054.4*** ‐184.4 980.0*** 2,463.0*** 1,483.1**
200.0 273.0 338.1 196.6 660.6 688.8
Thái7,421.4*** 8,608.5*** 1,187.2 925.7*** 544.9** ‐380.8
652.5 1,891.0 1,998.9 333.5 245.9 414.0
Mường 4,898.7*** 4,715.6*** ‐183.1 2,572.8*** 403.7*** ‐
2,169.0***493.2 543.4 733.1 770.3 114.0 777.8
Nùng 4,899.5*** 6,652.9*** 1,753.4 2,099.9*** 1,561.5*** ‐538.4
333.1 1,216.7 1,259.8 651.1 563.8 860.2
H'Mông12,012.7***
10,034.5***
‐1,978.2*** 612.5** 300.7*** ‐311.7
451.2 506.4 678.0 253.3 104.8 274.0
Dao 9,775.8*** 8,906.5*** ‐869.3 2,003.4*** 1,767.1*** ‐236.3
1,019.5 742.1 1,260.3 363.7 306.3 475.2
Others 7,926.8*** 9,474.2*** 1,547.5 1,194.5*** 1,611.6*** 417.1
635.5 886.1 1,090.1 280.7 294.4 406.6Regions
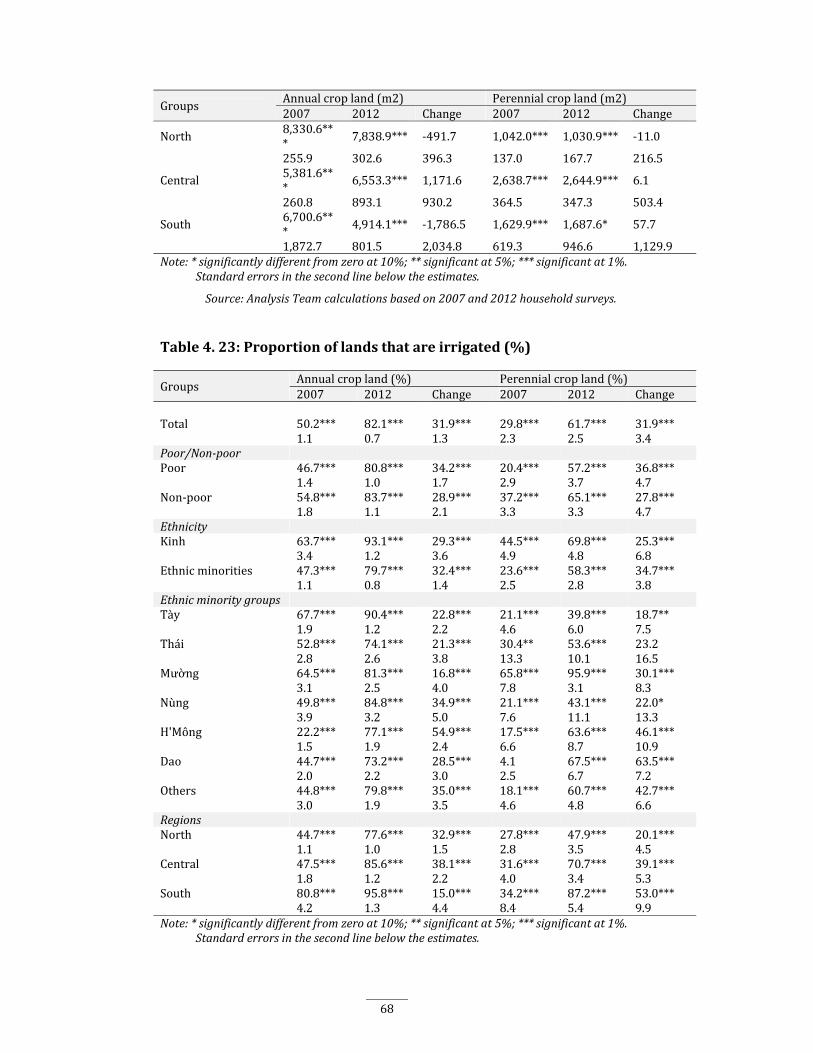
68
GroupsAnnualcropland(m2) Perennialcropland(m2)2007 2012 Change 2007 2012 Change
North 8,330.6*** 7,838.9*** ‐491.7 1,042.0*** 1,030.9*** ‐11.0
255.9 302.6 396.3 137.0 167.7 216.5
Central 5,381.6***
6,553.3*** 1,171.6 2,638.7*** 2,644.9*** 6.1
260.8 893.1 930.2 364.5 347.3 503.4
South 6,700.6*** 4,914.1*** ‐1,786.5 1,629.9*** 1,687.6* 57.7
1,872.7 801.5 2,034.8 619.3 946.6 1,129.9Note:*significantlydifferentfromzero at10%;**significant at5%;***significantat1%.
Standarderrorsinthesecondlinebelowtheestimates.
Source:AnalysisTeamcalculationsbasedon2007and2012householdsurveys.
Table4.23:Proportionoflandsthatareirrigated(%)
GroupsAnnualcropland(%) Perennialcropland(%)2007 2012 Change 2007 2012 Change
Total 50.2*** 82.1*** 31.9*** 29.8*** 61.7*** 31.9***1.1 0.7 1.3 2.3 2.5 3.4
Poor/Non‐poorPoor 46.7*** 80.8*** 34.2*** 20.4*** 57.2*** 36.8***
1.4 1.0 1.7 2.9 3.7 4.7Non‐poor 54.8*** 83.7*** 28.9*** 37.2*** 65.1*** 27.8***
1.8 1.1 2.1 3.3 3.3 4.7EthnicityKinh 63.7*** 93.1*** 29.3*** 44.5*** 69.8*** 25.3***
3.4 1.2 3.6 4.9 4.8 6.8Ethnicminorities 47.3*** 79.7*** 32.4*** 23.6*** 58.3*** 34.7***
1.1 0.8 1.4 2.5 2.8 3.8EthnicminoritygroupsTày 67.7*** 90.4*** 22.8*** 21.1*** 39.8*** 18.7**
1.9 1.2 2.2 4.6 6.0 7.5Thái 52.8*** 74.1*** 21.3*** 30.4** 53.6*** 23.2
2.8 2.6 3.8 13.3 10.1 16.5Mường 64.5*** 81.3*** 16.8*** 65.8*** 95.9*** 30.1***
3.1 2.5 4.0 7.8 3.1 8.3Nùng 49.8*** 84.8*** 34.9*** 21.1*** 43.1*** 22.0*
3.9 3.2 5.0 7.6 11.1 13.3H'Mông 22.2*** 77.1*** 54.9*** 17.5*** 63.6*** 46.1***
1.5 1.9 2.4 6.6 8.7 10.9Dao 44.7*** 73.2*** 28.5*** 4.1 67.5*** 63.5***
2.0 2.2 3.0 2.5 6.7 7.2Others 44.8*** 79.8*** 35.0*** 18.1*** 60.7*** 42.7***
3.0 1.9 3.5 4.6 4.8 6.6RegionsNorth 44.7*** 77.6*** 32.9*** 27.8*** 47.9*** 20.1***
1.1 1.0 1.5 2.8 3.5 4.5Central 47.5*** 85.6*** 38.1*** 31.6*** 70.7*** 39.1***
1.8 1.2 2.2 4.0 3.4 5.3South 80.8*** 95.8*** 15.0*** 34.2*** 87.2*** 53.0***
4.2 1.3 4.4 8.4 5.4 9.9Note:*significantlydifferentfromzero at10%;**significantat5%;***significantat1%.
Standarderrorsinthesecondlinebelowtheestimates.
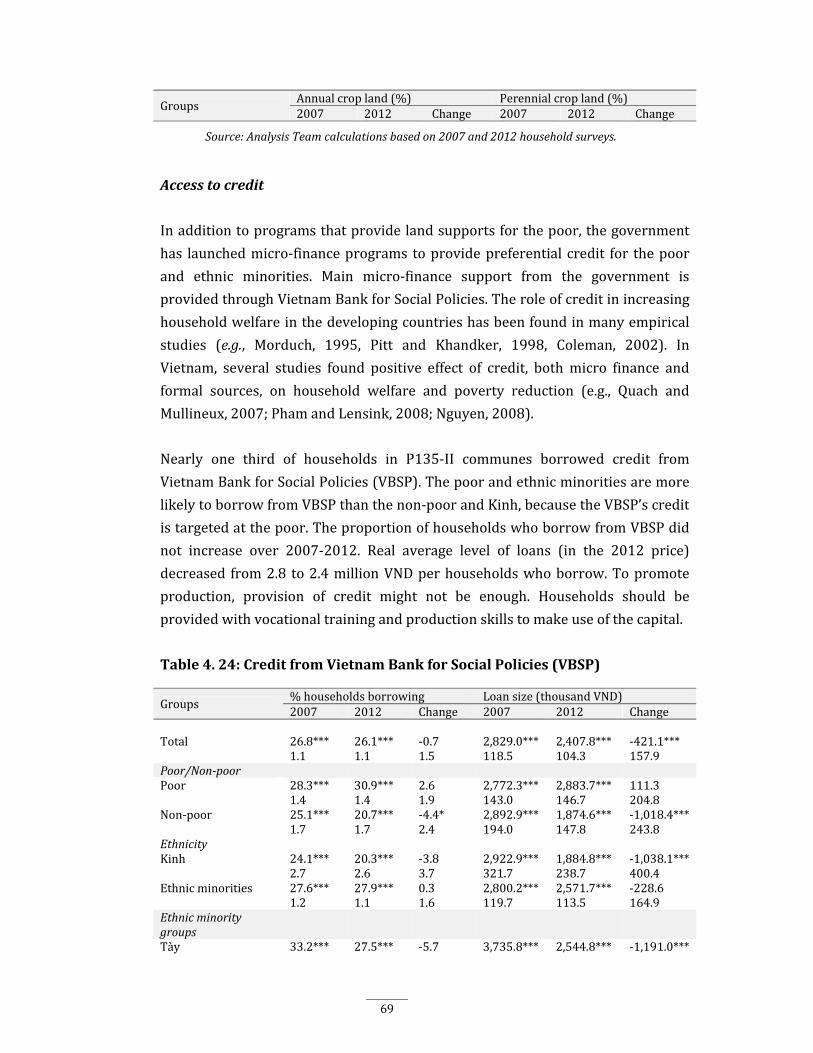
69
GroupsAnnualcropland(%) Perennialcropland(%)2007 2012 Change 2007 2012 Change
Source:AnalysisTeamcalculationsbasedon2007and2012householdsurveys.
Accesstocredit
Inadditiontoprogramsthatprovidelandsupportsforthepoor,thegovernment
has launchedmicro‐financeprograms toprovidepreferential credit for thepoor
and ethnic minorities. Main micro‐finance support from the government is
providedthroughVietnamBankforSocialPolicies.Theroleofcreditinincreasing
householdwelfareinthedevelopingcountrieshasbeenfoundinmanyempirical
studies (e.g., Morduch, 1995, Pitt and Khandker, 1998, Coleman, 2002). In
Vietnam, several studies found positive effect of credit, bothmicro finance and
formal sources, on household welfare and poverty reduction (e.g., Quach and
Mullineux,2007;PhamandLensink,2008;Nguyen,2008).
Nearly one third of households in P135‐II communes borrowed credit from
VietnamBankforSocialPolicies(VBSP).Thepoorandethnicminoritiesaremore
likelytoborrowfromVBSPthanthenon‐poorandKinh,becausetheVBSP’scredit
istargetedatthepoor.TheproportionofhouseholdswhoborrowfromVBSPdid
not increase over 2007‐2012. Real average level of loans (in the 2012 price)
decreased from2.8 to2.4millionVNDperhouseholdswhoborrow.Topromote
production, provision of credit might not be enough. Households should be
providedwithvocationaltrainingandproductionskillstomakeuseofthecapital.
Table4.24:CreditfromVietnamBankforSocialPolicies(VBSP)
Groups%householdsborrowing Loansize(thousandVND)2007 2012 Change 2007 2012 Change
Total 26.8*** 26.1*** ‐0.7 2,829.0*** 2,407.8*** ‐421.1***1.1 1.1 1.5 118.5 104.3 157.9
Poor/Non‐poorPoor 28.3*** 30.9*** 2.6 2,772.3*** 2,883.7*** 111.3
1.4 1.4 1.9 143.0 146.7 204.8Non‐poor 25.1*** 20.7*** ‐4.4* 2,892.9*** 1,874.6*** ‐1,018.4***
1.7 1.7 2.4 194.0 147.8 243.8EthnicityKinh 24.1*** 20.3*** ‐3.8 2,922.9*** 1,884.8*** ‐1,038.1***
2.7 2.6 3.7 321.7 238.7 400.4Ethnicminorities 27.6*** 27.9*** 0.3 2,800.2*** 2,571.7*** ‐228.6
1.2 1.1 1.6 119.7 113.5 164.9Ethnicminoritygroups Tày 33.2*** 27.5*** ‐5.7 3,735.8*** 2,544.8*** ‐1,191.0***

70
Groups%householdsborrowing Loansize(thousandVND)2007 2012 Change 2007 2012 Change2.6 2.5 3.6 332.2 261.2 422.3
Thái 26.2*** 33.4*** 7.2* 2,894.9*** 3,324.8*** 430.02.8 3.0 4.1 340.3 361.6 496.1
Mường 27.1*** 23.7*** ‐3.4 2,669.7*** 2,005.7*** ‐664.03.3 3.0 4.5 354.6 254.5 436.0
Nùng 21.6*** 29.7*** 8.2 2,455.3*** 2,905.0*** 449.73.2 4.0 5.1 405.0 449.6 604.3
H'Mông 35.6*** 21.1*** ‐14.6*** 2,867.7*** 1,976.7*** ‐891.0***2.7 2.1 3.4 238.1 210.3 317.5
Dao 26.0*** 23.7*** ‐2.3 2,731.0*** 2,155.3*** ‐575.82.6 2.5 3.6 290.4 245.9 380.3
Others 22.2*** 31.8*** 9.6** 2,383.4*** 2,834.8*** 451.32.7 2.8 3.9 248.9 251.7 353.9
RegionsNorth 28.7*** 23.8*** ‐4.9*** 2,837.8*** 2,251.1*** ‐586.7***
1.2 1.1 1.6 130.4 115.3 174.1Central 27.4*** 33.2*** 5.8** 3,235.1*** 3,018.5*** ‐216.6
1.7 1.8 2.5 213.7 188.6 285.0South 21.3*** 23.4*** 2.1 2,335.0*** 2,090.5*** ‐244.6
3.6 3.6 5.0 364.1 316.0 481.6Note:*significantlydifferentfromzero at10%;**significantat5%;***significantat1%.
Standarderrorsinthesecondlinebelowtheestimates.
Source:AnalysisTeamcalculationsbasedon2007and2012householdsurveys.
Thenon‐poorandKinhhavehigherborrowingratefromformalcredit.Borrowing
from formal credit often requires collateral but households can receive larger
amountof loan. In2012,34percentofhouseholdsborrowed fromformalcredit
sources. This figure for the poor and non‐poor households is 27.1 and 43.2
percent, respectively.TheKinhandnon‐poorhouseholdshavehigheramountof
loanthantheethnicminoritiesandpoorgroups,respectively.
Table4.25:Formalcredit
Groups%householdsborrowing Loansize(thousandVND)2007 2012 Change 2007 2012 Change
Total 22.5*** 34.3*** 11.8*** 13,662.4*10,038.7*** ‐3,623.7
1.2 1.2 1.7 7,200.1 1,095.8 7,282.5Poor/Non‐poorPoor 17.8*** 27.1*** 9.3*** 3,220.7*** 5,798.6*** 2,577.8***
1.4 1.5 2.1 479.3 729.0 872.3
Non‐poor 27.7*** 42.3*** 14.6*** 25,452.8* 14,791.1*** ‐10,661.7
1.9 2.0 2.8 15,313.4 2,140.8 15,459.5Ethnicity
Kinh 40.5*** 54.0*** 13.5*** 47,821.9 23,814.2*** ‐24,007.8
3.4 3.3 4.7 30,694.1 4,214.7 30,966.4Ethnicminorities 16.8*** 28.1*** 11.3*** 3,214.8*** 5,723.8*** 2,509.0***
1.0 1.2 1.5 286.8 307.8 420.7
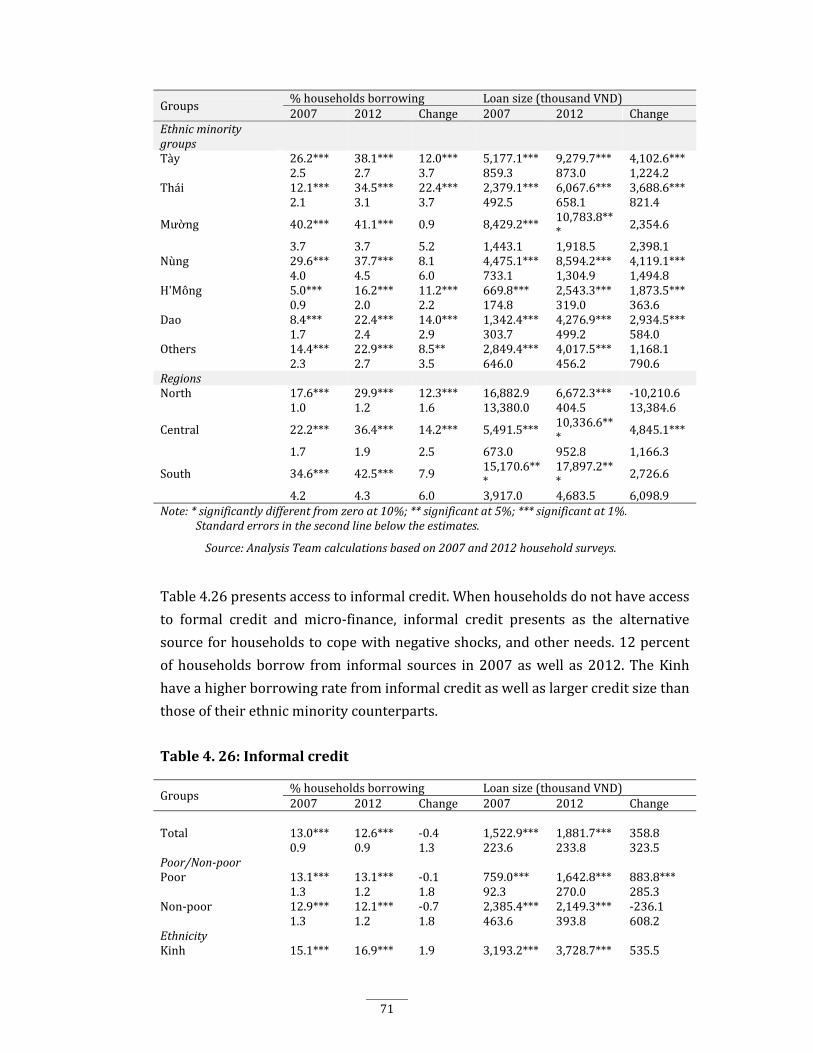
71
Groups%householdsborrowing Loansize(thousandVND)2007 2012 Change 2007 2012 Change
Ethnicminoritygroups Tày 26.2*** 38.1*** 12.0*** 5,177.1*** 9,279.7*** 4,102.6***
2.5 2.7 3.7 859.3 873.0 1,224.2Thái 12.1*** 34.5*** 22.4*** 2,379.1*** 6,067.6*** 3,688.6***
2.1 3.1 3.7 492.5 658.1 821.4
Mường 40.2*** 41.1*** 0.9 8,429.2*** 10,783.8*** 2,354.6
3.7 3.7 5.2 1,443.1 1,918.5 2,398.1Nùng 29.6*** 37.7*** 8.1 4,475.1*** 8,594.2*** 4,119.1***
4.0 4.5 6.0 733.1 1,304.9 1,494.8H'Mông 5.0*** 16.2*** 11.2*** 669.8*** 2,543.3*** 1,873.5***
0.9 2.0 2.2 174.8 319.0 363.6Dao 8.4*** 22.4*** 14.0*** 1,342.4*** 4,276.9*** 2,934.5***
1.7 2.4 2.9 303.7 499.2 584.0Others 14.4*** 22.9*** 8.5** 2,849.4*** 4,017.5*** 1,168.1
2.3 2.7 3.5 646.0 456.2 790.6RegionsNorth 17.6*** 29.9*** 12.3*** 16,882.9 6,672.3*** ‐10,210.6
1.0 1.2 1.6 13,380.0 404.5 13,384.6
Central 22.2*** 36.4*** 14.2*** 5,491.5*** 10,336.6*** 4,845.1***
1.7 1.9 2.5 673.0 952.8 1,166.3
South 34.6*** 42.5*** 7.9 15,170.6***
17,897.2*** 2,726.6
4.2 4.3 6.0 3,917.0 4,683.5 6,098.9Note:*significantlydifferentfromzero at10%;**significantat5%;***significantat1%.
Standarderrorsinthesecondlinebelowtheestimates.
Source:AnalysisTeamcalculationsbasedon2007and2012householdsurveys.
Table4.26presentsaccesstoinformalcredit.Whenhouseholdsdonothaveaccess
to formal credit and micro‐finance, informal credit presents as the alternative
sourceforhouseholdstocopewithnegativeshocks,andotherneeds.12percent
ofhouseholdsborrow from informal sources in2007aswell as2012.TheKinh
haveahigherborrowingratefrominformalcreditaswellaslargercreditsizethan
thoseoftheirethnicminoritycounterparts.
Table4.26:Informalcredit
Groups%householdsborrowing Loansize(thousandVND)2007 2012 Change 2007 2012 Change
Total 13.0*** 12.6*** ‐0.4 1,522.9*** 1,881.7*** 358.80.9 0.9 1.3 223.6 233.8 323.5
Poor/Non‐poorPoor 13.1*** 13.1*** ‐0.1 759.0*** 1,642.8*** 883.8***
1.3 1.2 1.8 92.3 270.0 285.3Non‐poor 12.9*** 12.1*** ‐0.7 2,385.4*** 2,149.3*** ‐236.1
1.3 1.2 1.8 463.6 393.8 608.2EthnicityKinh 15.1*** 16.9*** 1.9 3,193.2*** 3,728.7*** 535.5

72
Groups%householdsborrowing Loansize(thousandVND)2007 2012 Change 2007 2012 Change2.3 2.7 3.6 848.5 754.1 1,134.6
Ethnicminorities 12.4*** 11.3*** ‐1.1 1,012.0*** 1,303.1*** 291.10.9 0.7 1.2 136.2 194.1 237.1
Ethnicminoritygroups Tày 13.5*** 15.4*** 1.9 1,095.1*** 1,709.5*** 614.4
1.9 2.1 2.8 213.6 367.2 424.5Thái 9.7*** 9.1*** ‐0.6 672.5*** 736.9*** 64.3
1.8 1.7 2.5 167.1 180.7 246.0Mường 19.7*** 16.7*** ‐3.1 1,080.1*** 1,502.8*** 422.7
3.1 2.8 4.2 226.2 375.1 437.5Nùng 20.4*** 17.2*** ‐3.2 1,194.1*** 5,612.6* 4,418.5
3.4 3.9 5.2 266.6 2,958.9 2,967.0H'Mông 3.8*** 2.9*** ‐0.9 467.0* 199.4** ‐267.5
1.3 0.7 1.5 276.5 79.6 287.6Dao 7.5*** 16.9*** 9.4*** 529.3*** 1,947.5*** 1,418.2***
1.4 2.3 2.7 126.1 521.7 536.4Others 16.2*** 11.1*** ‐5.1* 1,588.0*** 1,111.7*** ‐476.3
2.5 1.5 2.9 402.2 315.2 510.8RegionsNorth 12.8*** 12.1*** ‐0.6 1,042.5*** 1,710.5*** 668.0**
0.9 0.9 1.3 122.5 276.6 302.5Central 11.1*** 12.9*** 1.8 2,331.8*** 2,314.8*** ‐17.0
1.2 1.3 1.8 700.6 570.3 903.1South 15.8*** 13.6*** ‐2.3 1,774.4*** 1,802.6*** 28.2
3.2 3.1 4.4 567.2 517.7 767.1Note:*significantlydifferentfromzero at10%;**significantat5%;***significantat1%.
Standarderrorsinthesecondlinebelowtheestimates.
Source:AnalysisTeamcalculationsbasedon2007and2012householdsurveys.
4.3 Povertydynamicsofethnicminorities
Dynamicsofpoverty
Analysis of poverty dynamics often requires long panel data. Basically, the
chronicallypoorarehouseholdswhoselivingstandardisbelowadefinedpoverty
line for a number of years, while the transiently poor experience some non‐
povertyyearsduringthatperiod(HulmeandShepherd,2003).JalanandRavallion
(2000) decompose poverty into two components: transient poverty due to the
inter‐temporal variability in consumption, and chronic poverty determined by
mean consumption overtime. However this method requires longitudinal data
withatleastthreerepeatedobservations.Inthisstudy,weuseasimpleapproach
toexaminethedynamicsofpoverty inP135‐IIcommunes.Weusepaneldata to
classify households into four groups: persistently poor – households that were
poorinboth2007and2012;thoseescapingpoverty–householdsthatwerepoor
in2007butnon‐poor in2012; thosefalling intopoverty–householdsthatwere

73
non‐poor in 2007 but became poor in 2012; and persistently non‐poor –
householdsthatwerenon‐poorinboth2007and2012.Householdswhoescaped
frompovertyandthosewho fell intopovertycanberegardedas the transiently
poor.
Table4.27:Povertytransitionduring2007‐2012
Groups
Persistentlypoor:Poorinboth2007and2012
Escapedpoverty:Poorin2007,andnon‐poorin2012
Fellintopoverty:Non‐poorin2007,andpoorin2012
Persistentlynon‐poor:Non‐poorinboth2007and2012
Total
Allhouseholds 35.0 22.1 14.3 28.6 100.0(1.2) (1.0) (1.0) (1.2)
EthnicminoritiesKinh&Hoa 16.7 18.1 15.3 49.9 100.0
(3.2) (2.9) (3.3) (3.8)Ethnicminorities 39.5 23.1 14.0 23.4 100.0
(1.3) (1.1) (0.9) (1.1)EthnicminoritygroupsTay 32.4 24.2 11.3 32.2 100.0
(2.7) (2.5) (1.8) (2.7)Thai 41.0 15.6 21.9 21.5 100.0
(3.4) (2.4) (3.0) (2.7)Mường 32.8 13.4 15.6 38.3 100.0
(3.6) (2.6) (2.8) (3.8)Nùng 33.3 26.3 8.2 32.1 100.0
(4.1) (3.7) (2.0) (4.4)H'Mông 51.5 31.5 7.8 9.2 100.0
(3.0) (2.9) (1.6) (1.7)Dao 38.2 23.1 17.7 21.0 100.0
(3.0) (2.6) (2.5) (2.4)Otherethnicminorities 35.7 22.6 15.0 26.7 100.0
(2.6) (2.3) (2.1) (2.7)RegionsNorth 39.2 24.7 11.5 24.6 100.0
(1.4) (1.3) (0.9) (1.2)Central 37.7 18.7 16.5 27.0 100.0
(2.0) (1.6) (1.6) (1.8)South 18.3 18.4 19.9 43.3 100.0
(4.0) (3.5) (3.9) (4.5)Note:Standarderrorsinthesecondlinebelowtheestimates.
Source:AnalysisTeamcalculationsbasedon2007and2012householdsurveys.
Table 4.27 presents the proportion of households falling into four poverty
categories.35percentofhouseholdswerepoorinbothyears.Therewerealarge

74
proportionofhouseholdsintransientpoverty.22.1percentofhouseholdsescaped
frompoverty,but14.3percentofhouseholdfellintopoverty.Kinhhouseholdsare
more likely to be transiently poor, while ethnic minority households are more
likelytobepersistentlypoor.AlthoughKinhpoorhouseholdsweremorelikelyto
escapepoverty,thereisalsoalargeproportionofnon‐poorhouseholdsfromthe
Kinhgroupfallingintopovertyin2012.Byethnicity,thereisahighproportionof
chronicpovertyamongThai,H’MongandDaogroups.H’Mong,Nung,TayandDao
are those who were more likely to escape from poverty than other ethnic
minorities.ThaiandDaogroupsweremorevulnerabletopoverty:21percentof
Thaihouseholdsand18percentofDaohouseholdsfellintopovertyin2012.
Determinantsofpoverty
Toexaminedeterminantsofpovertystatus,weuseastandardmultinomial logitmodel.12Inourstudy,householdscanfallintooneofthefourmutuallyexclusivepoverty statuses: persistently poor; escaped poverty; fell into poverty; andpersistentlypoor.Themethodologyispresentedinappendix. Table4.28presentsmarginaleffectsofexplanatoryvariablesontheprobabilityof
householdsbeinginthefourpovertystatuses.Ageofhouseholdheadhasexpected
effectonchronicpoverty:householdswithayoungoranoldhouseholdheadare
more likelytofall inpersistentpoverty.Householdswithmiddle‐ageheadshave
lowerprobabilityofbeingpersistentlypoor.Householdswith femaleheadstend
tohavelowerprobabilityofbeingpersistentlypoor.Higheducationofhousehold
headsispositivelycorrelatedwiththeprobabilityofbeingpersistentlynon‐poor
and negatively correlated with the probability of being persistently poor.
Householdswithlargesizeandhighproportionofchildrenandelderlyaremore
likely tobepersistentlypoor.Onthecontrary,persistentlynon‐poorhouseholds
tend to have a smaller household size and smaller proportion of children and
elderly.
Ethnic minorities also matter to poverty dynamics. Compared with Kinh
households (base group), Tay and Muong households are more likely to be
chronically poor. Thai households tend to fall into poverty, while H’Mong
householdstendtoescapefrompoverty.
12Multinomial logit models are presented in most econometrics textbooks such as Wooldridge (2001).

75
Assetownershipisanimportantforhouseholdsnottofallintopersistentpoverty
Householdswithlargelivingareas,croplands,andreceivingremittancesareless
likely to be persistently poor. However, asset is not the most significant factor
makinghouseholdsescapeorfallintopoverty.
Table4.28:Marginaleffectinmultinomiallogitregression
Explanatoryvariables
DependentvariablePersistentlypoor:Poorinboth2007and2012
Escapedpoverty:Poorin2007,andnon‐poorin2012
Fellintopoverty:Non‐poorin2007,andpoorin2012
Persistentlynon‐poor:Non‐poorinboth2007and2012
Agehead ‐0.0196*** ‐0.0035 0.0019 0.0212***(0.0063) (0.0065) (0.0051) (0.0076)
Ageheadsquared 0.0002** 0.0001 ‐0.0000 ‐0.0002***(0.0001) (0.0001) (0.0001) (0.0001)
Headismale 0.1032** 0.0059 ‐0.0218 ‐0.0873(0.0421) (0.0523) (0.0331) (0.0660)
Schoolingyearsofhead ‐0.0305*** ‐0.0041 ‐0.0011 0.0357***
(0.0043) (0.0040) (0.0033) (0.0047)Kinh OmittedTày 0.1313** ‐0.0107 0.0402 ‐0.1609***
(0.0663) (0.0537) (0.0478) (0.0526)Thái 0.0707 ‐0.0633 0.1441** ‐0.1515***
(0.0617) (0.0491) (0.0628) (0.0504)Mường 0.1544** ‐0.1048** 0.0710 ‐0.1206**
(0.0642) (0.0411) (0.0535) (0.0546)Nùng 0.0705 0.0401 ‐0.0125 ‐0.0981
(0.0658) (0.0582) (0.0514) (0.0646)H'Mông 0.0571 0.1524** 0.0172 ‐0.2266***
(0.0693) (0.0738) (0.0467) (0.0539)Dao 0.0167 ‐0.0057 0.1369* ‐0.1479***
(0.0612) (0.0626) (0.0785) (0.0554)Otherethnicminorities 0.0273 0.0895** ‐0.0110 ‐0.1059
(0.0734) (0.0440) (0.0296) (0.0749)North OmittedCentral ‐0.0620 ‐0.0660 0.1257*** 0.0023
(0.0414) (0.0465) (0.0453) (0.0548)South ‐0.0505 ‐0.0963* 0.1412*** 0.0056
(0.0713) (0.0496) (0.0543) (0.0825)Householdsize 0.0393*** 0.0084 ‐0.0198*** ‐0.0278**
(0.0076) (0.0092) (0.0070) (0.0116)Proportionofchildren 0.2942** ‐0.0068 ‐0.1072* ‐0.1802**
(0.1179) (0.0627) (0.0630) (0.0740)Proportionofelderly 0.2422*** ‐0.1986* ‐0.0167 ‐0.0270
(0.0921) (0.1094) (0.0795) (0.1059)Proportionoffemalemembers
0.0714 0.0148 ‐0.0754 ‐0.0108(0.0757) (0.0701) (0.0495) (0.0938)
Percapitalivingarea ‐0.0077*** ‐0.0049* 0.0033** 0.0092***
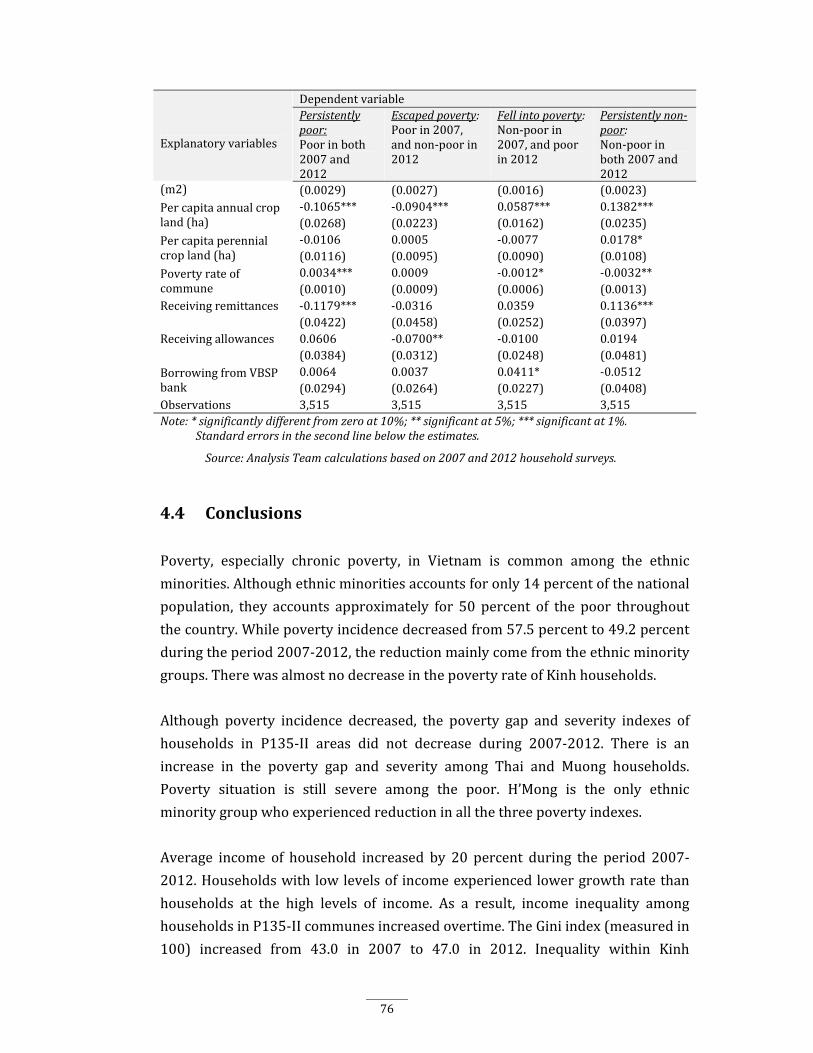
76
Explanatoryvariables
DependentvariablePersistentlypoor:Poorinboth2007and2012
Escapedpoverty:Poorin2007,andnon‐poorin2012
Fellintopoverty:Non‐poorin2007,andpoorin2012
Persistentlynon‐poor:Non‐poorinboth2007and2012
(m2) (0.0029) (0.0027) (0.0016) (0.0023)Percapitaannualcropland(ha)
‐0.1065*** ‐0.0904*** 0.0587*** 0.1382***(0.0268) (0.0223) (0.0162) (0.0235)
Percapitaperennialcropland(ha)
‐0.0106 0.0005 ‐0.0077 0.0178*(0.0116) (0.0095) (0.0090) (0.0108)
Povertyrateofcommune
0.0034*** 0.0009 ‐0.0012* ‐0.0032**(0.0010) (0.0009) (0.0006) (0.0013)
Receivingremittances ‐0.1179*** ‐0.0316 0.0359 0.1136***(0.0422) (0.0458) (0.0252) (0.0397)
Receivingallowances 0.0606 ‐0.0700** ‐0.0100 0.0194(0.0384) (0.0312) (0.0248) (0.0481)
BorrowingfromVBSPbank
0.0064 0.0037 0.0411* ‐0.0512(0.0294) (0.0264) (0.0227) (0.0408)
Observations 3,515 3,515 3,515 3,515Note:*significantlydifferentfromzero at10%;**significantat5%;***significantat1%.
Standarderrorsinthesecondlinebelowtheestimates.
Source:AnalysisTeamcalculationsbasedon2007and2012householdsurveys.
4.4 Conclusions
Poverty, especially chronic poverty, in Vietnam is common among the ethnic
minorities.Althoughethnicminoritiesaccountsforonly14percentofthenational
population, they accounts approximately for 50 percent of the poor throughout
thecountry.Whilepovertyincidencedecreasedfrom57.5percentto49.2percent
duringtheperiod2007‐2012,thereductionmainlycomefromtheethnicminority
groups.TherewasalmostnodecreaseinthepovertyrateofKinhhouseholds.
Although poverty incidence decreased, the poverty gap and severity indexes of
households in P135‐II areas did not decrease during 2007‐2012. There is an
increase in the poverty gap and severity among Thai and Muong households.
Poverty situation is still severe among the poor. H’Mong is the only ethnic
minoritygroupwhoexperiencedreductioninallthethreepovertyindexes.
Average income of household increased by 20 percent during the period 2007‐
2012.Householdswithlowlevelsof incomeexperiencedlowergrowthratethan
households at the high levels of income. As a result, income inequality among
householdsinP135‐IIcommunesincreasedovertime.TheGiniindex(measuredin
100) increased from 43.0 in 2007 to 47.0 in 2012. Inequality within Kinh

77
households as well as within ethnic minority households also increased during
this period. A large proportion of the total inequality is due to within‐group
inequality. The between‐group inequality component accounts for less than 10
percentofthetotalinequality.
The decomposition analysis shows that poverty reduction of the households in
P135‐IIcommunesresultedfromincomegrowth.Povertyissensitivetoeconomic
growth.However,theelasticityofpovertywithrespecttoincomegrowthtendsto
decrease overtime, which means that income redistribution plays a very
importantroleindecreasingpovertygapandpovertyseverity.
Households in Program135‐II communes remain heavily reliant on agricultural
income whereby agricultural activities generate nearly 60 percent of total
households’ income.Nevertheless, therehasbeena shift from farm tonon‐farm
activities leading to an increasing share of income from wage. However, this
transition is takingplace at a slow rate,which is reflectedby a limited shareof
non‐farmincomeofaround5percent.
Therewerealargeproportionofhouseholdsintransientpoverty.22.1percentof
householdsescapedfrompoverty,but14.3percentofhouseholdfellintopoverty.
Kinh households are more likely to be transiently poor, while ethnic minority
households are more likely to be persistently poor. Although Kinh poor
householdsweremorelikelytoescapepoverty,alargeproportionofnon‐poorfell
intopovertyin2012.
78
CHAPTER5
CAPACITY,DECENTRALIZATION,PARTICIPATIONANDIMPACTSOFP135‐IIONOUTCOMES
5.1 Introduction
OnecoredevelopmentofProgram135PhaseII(P135‐II) isthestrongemphasis
on capacity‐building through decentralization, and participation. Rural
development and rural poverty alleviation experience has shown that
decentralizationandparticipationarepowerful tools for sustainable community
and economic development. Decentralization is the democratic process of
engagingcommunitiesoverthedecisionsthatshapetheirfuture.Decentralization
is said to be accompanied by participation, empowerment, transparency and
accountability. In particular, decentralization facilitates participation, which is
seen as a process throughwhich stakeholders influence and share control over
developmentinitiativesandthedecisionsandresourceswhichaffectthem(World
Bank, 1994). Through participation, people become actors in their own
development rather than just passive beneficiaries. These advantages of
decentralizationandparticipationareconditionalonthelocalauthorities’aswell
asthecommunity’scapacitytotakechargeofthewholeprocessfromengagingthe
targetedpopulationinplanningstage,implementationandfinancialmanagement
to project operation and maintenance. Recognizing the importance of
participatoryapproach,Program135PhaseIIhasintegratedcapacitybuildingas
oneoftheProgram’sfourcomponents.Likewise,“decentralization,empowerment
and participation” is designed as Policy Area II in four key Policy Areas of the
PolicyMatrix.
This chapter provides a comprehensive analysis of the extent towhich capacity
strengtheninghasbeenenforcedat local level.Thisgoal isassessed through the
perspectiveofbothlocalauthoritiesandthebeneficiaries.Thefirst,itdescribesin‐
depth capacity building at local authorities through assessment of local training
activities and then provides an insight into project management capacity and
79
decentralization at local authorities. The outcomes of commune investment
ownership and measurement of household participation in planning and
implementation stages are presented before the detail results of impact
measurementontheexpectedoutcomesforbeneficiaryhouseholdsofbothethnic
minority and majority. The conclusion is presented in the last section of this
chapter.
5.2 CapacitystrengtheningandProjectManagement
5.2.1 Capacitystrengtheningthroughtrainingactivitiesatcommunelevel
P135‐II is the only National Targeted Program that has strongly enforced
decentralizationtocommunelevelwiththeintroductionofcommuneinvestment
ownership.Inordertofacilitatethedecentralizationprocess,capacitybuildingat
the local level is essential. Phase II has shown the importance of local‐level
institutional capacity‐building with more than 7 percent of the Program’s total
fundingallocatedforthisactivity,a6percentincreasefromPhaseI.Throughout
the Program, a number of decentralization policies have been presented to
enhance autonomy and accountability of local government in targeted areas.
Shiftinginvestmentownershipresponsibilitiesfromprovincialanddistrictlevels
to communes require the communes’ strong capacity in administrative and
financialplanningaswellasprojectmanagement.Localstafftrainingisoneofthe
key capacity strengthening activities at commune level. Local authorities have
organizedtrainingonadministration,financialandprojectmanagementskillsfor
178,000 commune staffs and village staffs. Training is delivered in the form of
short‐termcourses,whichlastapproximately5–6dayspercourse.
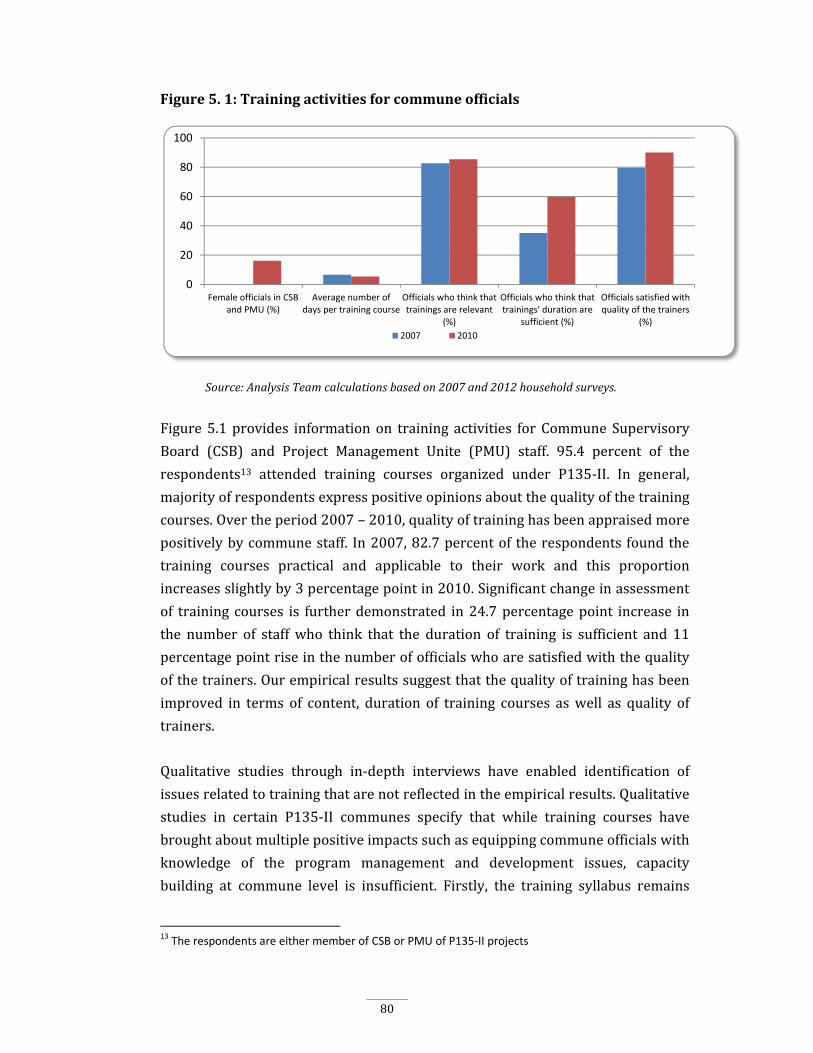
80
Figure5.1:Trainingactivitiesforcommuneofficials
Source:AnalysisTeamcalculationsbasedon2007and2012householdsurveys.
Figure 5.1provides informationon training activities forCommune Supervisory
Board (CSB) and Project Management Unite (PMU) staff. 95.4 percent of the
respondents13 attended training courses organized under P135‐II. In general,
majorityofrespondentsexpresspositiveopinionsaboutthequalityofthetraining
courses.Overtheperiod2007–2010,qualityoftraininghasbeenappraisedmore
positivelybycommunestaff. In2007,82.7percentof therespondents foundthe
training courses practical and applicable to their work and this proportion
increasesslightlyby3percentagepointin2010.Significantchangeinassessment
of training courses is furtherdemonstrated in24.7percentagepoint increase in
the number of staffwho think that the duration of training is sufficient and 11
percentagepointriseinthenumberofofficialswhoaresatisfiedwiththequality
ofthetrainers.Ourempiricalresultssuggestthatthequalityoftraininghasbeen
improved in terms of content, duration of training courses aswell as quality of
trainers.
Qualitative studies through in‐depth interviews have enabled identification of
issuesrelatedtotrainingthatarenotreflectedintheempiricalresults.Qualitative
studies in certain P135‐II communes specify that while training courses have
broughtaboutmultiplepositiveimpactssuchasequippingcommuneofficialswith
knowledge of the program management and development issues, capacity
building at commune level is insufficient. Firstly, the training syllabus remains
13 The respondents are either member of CSB or PMU of P135‐II projects
0
20
40
60
80
100
Female officials in CSBand PMU (%)
Average number ofdays per training course
Officials who think thattrainings are relevant
(%)
Officials who think thattrainings' duration are
sufficient (%)
Officials satisfied withquality of the trainers
(%)
2007 2010
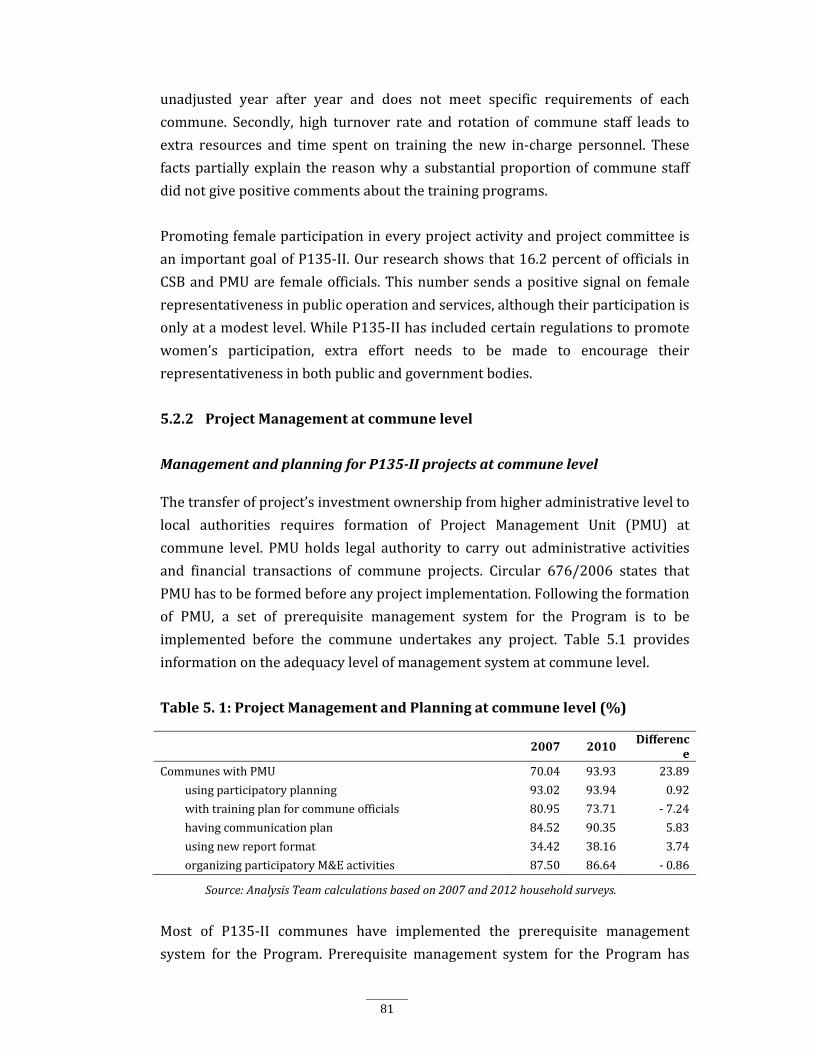
81
unadjusted year after year and does not meet specific requirements of each
commune. Secondly, high turnover rate and rotation of commune staff leads to
extra resources and time spent on training the new in‐charge personnel. These
factspartiallyexplainthereasonwhyasubstantialproportionofcommunestaff
didnotgivepositivecommentsaboutthetrainingprograms.
Promotingfemaleparticipationineveryprojectactivityandprojectcommitteeis
animportantgoalofP135‐II.Ourresearchshowsthat16.2percentofofficials in
CSBandPMUarefemaleofficials.Thisnumbersendsapositivesignalon female
representativenessinpublicoperationandservices,althoughtheirparticipationis
onlyatamodestlevel.WhileP135‐IIhasincludedcertainregulationstopromote
women’s participation, extra effort needs to be made to encourage their
representativenessinbothpublicandgovernmentbodies.
5.2.2 ProjectManagementatcommunelevel
ManagementandplanningforP135‐IIprojectsatcommunelevel
Thetransferofproject’sinvestmentownershipfromhigheradministrativelevelto
local authorities requires formation of Project Management Unit (PMU) at
commune level. PMUholds legal authority to carry out administrative activities
and financial transactions of commune projects. Circular 676/2006 states that
PMUhastobeformedbeforeanyprojectimplementation.Followingtheformation
of PMU, a set of prerequisite management system for the Program is to be
implemented before the commune undertakes any project. Table 5.1 provides
informationontheadequacylevelofmanagementsystematcommunelevel.
Table5.1:ProjectManagementandPlanningatcommunelevel(%)
2007 2010 Difference
CommuneswithPMU 70.04 93.93 23.89
usingparticipatoryplanning 93.02 93.94 0.92
withtrainingplanforcommuneofficials 80.95 73.71 ‐7.24
havingcommunicationplan 84.52 90.35 5.83
usingnewreportformat 34.42 38.16 3.74
organizingparticipatoryM&Eactivities 87.50 86.64 ‐0.86
Source:AnalysisTeamcalculationsbasedon2007and2012householdsurveys.
Most of P135‐II communes have implemented the prerequisite management
system for the Program. Prerequisite management system for the Program has

82
alsobeenbetterestablishedin2010ascomparedto2007sinceanadditional23.9
percentofcommuneshaveformedPMU,makinguptheproportionofcommunes
with PMU to a significant 93.9 percent. The regulation stipulating that every
investment‐owned commune must have a commune PMU leads to the
requirement that every commune have a PMU by the end of the Program.
However,6.1percentofcommunesstilldonothaveseparatePMUstomanagethe
Program’sactivities.
For communes where PMUs are established, the application of participatory
planning is extensive. The percentage of communeswith participatory planning
stands at 93 percent in both 2007 and 2010.While the numbers of communes
having communication plan and organizing participatoryM&E activities remain
relativelyhighinbothyears,theapplicationofnewreportingformathasnotbeen
well established at commune level. Despite an improvement in the use of new
reportingformatfrom2007to2010,onlylessthan40percentofthecommunes
usethisonein2010.
PublicFinancialManagement&Transparency
In the period 2011 – 2020, a reform strategy for Public Sector is underway, in
which Public Financial Management System is the center of the reform. The
reform,withtheemphasisondecentralization,istakingstepstowardsenhancing
transparencyandaccountabilityarrangementsofthesystem.Whiledevelopment
partnersshareconcernsaboutthesystemthroughwhichresourcesarechanneled
to the poor, P135‐II’s objective addresses this concern and matches the
Government’s interest in promoting a more transparent and effective Public
FinancialManagement System.This share of interest is shown in the Program’s
PolicyMatrixwith‘FiduciaryTransparencyandAccountability’beingoneofthekey
fourpolicyareas.
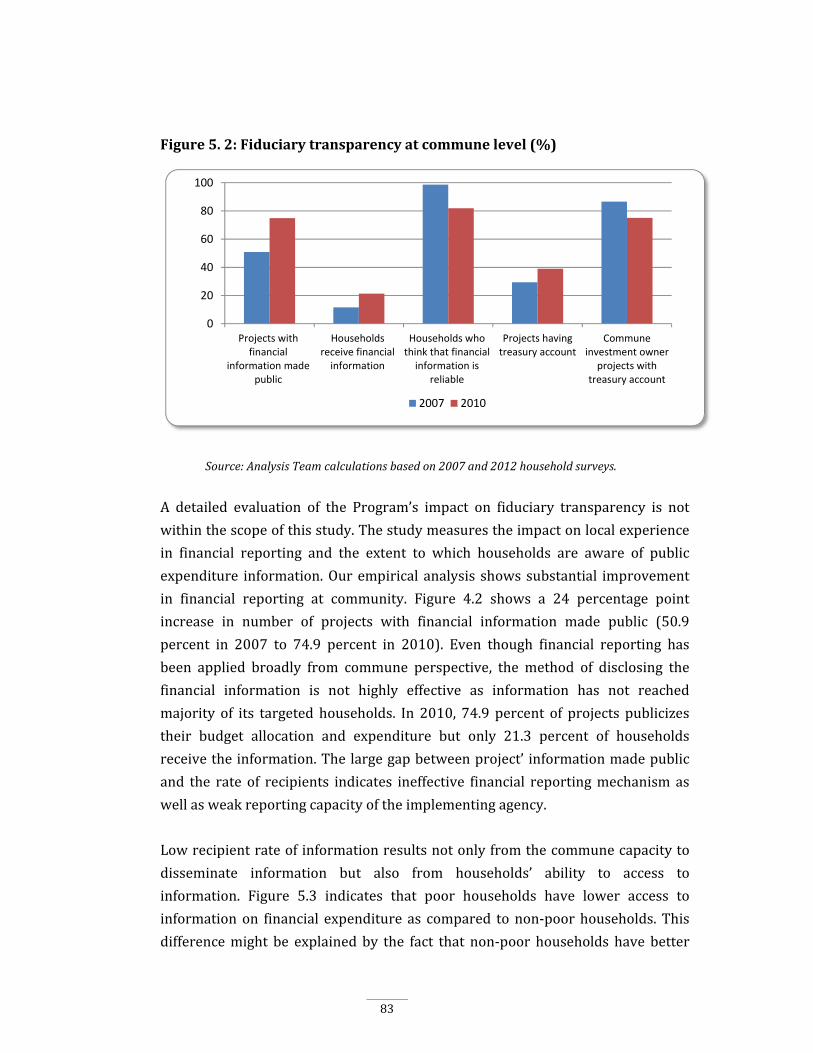
83
Figure5.2:Fiduciarytransparencyatcommunelevel(%)
Source:AnalysisTeamcalculationsbasedon2007and2012householdsurveys.
A detailed evaluation of the Program’s impact on fiduciary transparency is not
withinthescopeofthisstudy.Thestudymeasurestheimpactonlocalexperience
in financial reporting and the extent to which households are aware of public
expenditure information.Ourempirical analysis showssubstantial improvement
in financial reporting at community. Figure 4.2 shows a 24 percentage point
increase in number of projects with financial information made public (50.9
percent in 2007 to 74.9 percent in 2010). Even though financial reporting has
been applied broadly from commune perspective, the method of disclosing the
financial information is not highly effective as information has not reached
majority of its targeted households. In 2010, 74.9 percent of projects publicizes
their budget allocation and expenditure but only 21.3 percent of households
receivetheinformation.Thelargegapbetweenproject’ informationmadepublic
and the rate of recipients indicates ineffective financial reportingmechanismas
wellasweakreportingcapacityoftheimplementingagency.
Lowrecipientrateofinformationresultsnotonlyfromthecommunecapacityto
disseminate information but also from households’ ability to access to
information. Figure 5.3 indicates that poor households have lower access to
informationon financial expenditure as compared tonon‐poorhouseholds. This
differencemight be explainedby the fact that non‐poor households have better
0
20
40
60
80
100
Projects withfinancial
information madepublic
Householdsreceive financialinformation
Households whothink that financialinformation is
reliable
Projects havingtreasury account
Communeinvestment owner
projects withtreasury account
2007 2010

84
means to access to multiple channels of information; and with better level of
general knowledge and understanding, they are more connected to community
activities.Similarly, thepercentageofKinhhouseholdsawareofprojectfinancial
expenditure is 14 percentage points higher than their ethnic minority
counterparts in 2010. This phenomenon suggests that ethnic minorities have
relatively limited access to information, in which language barrier might
considerablycontributetotheoutcome.Nevertheless, it isundeniable that there
hasbeenconsiderableimprovementininformationaccessasadoubleincreasein
the percentage of households receiving financial information has been recorded
overtheperiod2007–2010.Amongthosewhoreceivefinancialinformation,81
percent in2010 think that financial information is reliable.This indicatesa16.8
percentagepointdecreasefrom2007,whichimpliesthathouseholdshavebecome
more cautious in evaluating the reliability of financial information that they
receive.
Figure5.3:Household receive information about financial expenditureofinfrastructureprojects(%)
Source:AnalysisTeamcalculationsbasedon2007and2012householdsurveys.
In the process ofmodernizing and strengthening Project FinancialManagement
(PFM) system with decentralization to local level, P135‐II has introduced new
regulation(s)on financialmanagementof thegovernment’sanddonors’ funding.
Circular676statesthatdirectfundingforP135fromgovernmentbudgethastobe
transacted through theNationalBank. In order to facilitate the funding transfer
andtoallowforeffectivemanagementofpublicfunding,communeofficesneedto
opentreasuryaccountforeachproject.Thepercentageofprojectshavingtreasury
0
5
10
15
20
25
30
Total Poor households Non‐poorhouseholds
Kinh Ethnic Minorities
2007 2012
85
accounthasincreasedby10percentovertheperiod2007–2010butremainsata
modestlevel(39.1percentin2010).
By theendof theProgram, communeofficehas adopteda fairly comprehensive
prerequisitemanagementsystemtofacilitatecommunity‐drivenmechanisminits
planning and management process. More intensive application of participatory
approach has been adopted. The Program shows an increase in the number of
communePMUs,ariseinplanningactivitiesthatintegrateparticipatoryapproach
such as in planning, reporting, M&E, communication plan. Commune office has
actively promoted financial transparency and information dissemination to
grassroots level. As such, public and financial transparency has been improved,
which is demonstrated by an increase in projects publicizing expenditure
informationaswellasthenumberofhouseholdsreceivingtheinformation.Even
though progress has made been, there is big room for improvement on
informationdisseminationtohouseholdlevelandonpublicfinancialmanagement
systematcommunelevel.
5.2.3 OwnershipofP135‐IIinvestmentprojects
DecentralizationispushedforwardinP135‐IIwiththeintroductionofcommune
investment ownership whereby commune office is given the responsibility for
takeleadingofsmallandmediuminfrastructureprojectsincludingadministrative
andtechnicalprocedures.WhilealloftheprojectsinPhaseIwereundertakenat
districtlevelwhichwasbelievedtohavesufficientcapacitytocarryoutthework,
thisnewpolicyinPhaseIIisconsideredachallengingbutnecessarysteptowards
the success of community‐driven approach; that is to build up institutional
capacityatcommunelevel.
Taking up the responsibilities of an investment owner, the commune has to
mastertheprocessofpreparingprofiledesignforconstruction,budgetestimate,
organizing bidding and selecting the contractor as well as supervising project
implementation and handing over the completed project to beneficiaries. All of
these activities require thorough understanding of the procedure as well as
technicalknowledgeeven forsmall‐scaleprojects.This requirement leads to the
lowproportionofP135‐IIcommune‐ownedprojectsin2007(21.5percent).With
rigorouscapacitybuilding,includingprovisionoftechnicalassistanceandtraining
courses for commune level, thenumberof commune‐ownedprojectsdoubled in
2010(45.9percent).Withthetargetof100percentcommunesbeinginvestment

86
owners, this figure seems to indicate that the former goal is far from being
achieved. Despite the modest number of commune‐owned projects, the double
increase in the number of projects over the period 2007 – 2010 demonstrates
significant improvement in the ability of communes to become investment
owners.Togetherwith the increase innumberof commune‐ownedprojects, the
numberofhouseholdsbenefiting fromeach investment‐ownedproject increases
slightlyby10households.Thisimprovementindicatesthatnotonlymoreprojects
can be owned by communes but the positive impact of each commune‐owned
projectisalsomorewidespreadbytheendoftheProgram.
Table5.2:OwnershipofP135‐IIinfrastructureprojects
2007 2010 Difference
Infrastructure projects where communes are investment owners (%)
21.54 45.95 24.41
Households benefiting from each investment‐own projects (no of households)
421.3 432.1 10.8
Communes think that it is better for communes to be investment owners (%)
97.44 96.11 ‐1.33
Projects with CIO encounter slow funding (%) 57.35 45.33 ‐12.02
Projects with CIO encounter weak capacity of commune officials (%) 17.65 17 ‐0.65
Projects with CIO encounter weak capacity of the contractors (%) 5.88 5.38 ‐0.5
Source:AnalysisTeamcalculationsbasedon2007and2012householdsurveys.
Table 5.2 shows problems encountered by investment‐owning communes. The
majority of investment‐owning communes do not encounter serious problems
duringimplementationprocess.Inbothyears,morethan96percentofcommune
staff interviewedexpresses theirpreference tobe the investmentowners rather
than having the projects owned by higher authorities. The former option gives
themmore autonomy in planning and implementing the projects; therefore the
projectwouldbestmeettheneedofcommunity.Duringimplementationprocess,
thebiggestproblemencounteredbyprojectswithCIO is slowdisbursement. 12
percent decrease in number of projects experiencing slow funding seems to
indicatethat theproblemhasalleviatedbutremainsdominantby theendofthe
Program as a significant proportion of 45.3 percent still encounters this issue.
Slowfundingindicatesinefficiencyinpublicfinancialsystemandposeschallenges
for contractors who have to carry out the construction work without timely
financialpayout.Thesecondmostprevailingissue,andequallyimportant,isweak
capacity building of investment owners. 17.7 percent of projects with CIO has

87
problemwithweak capacity of commune officials.Worryingly, thisweight does
notseemtosignificantlydecreasein2010(17percent)whilethetotalnumberof
investment‐owned projects has increased substantially. Capacity at commune
level has been the biggest concern in the decentralization process to grassroots
levelbecausesuccessofcommuneinvestment‐ownedprojectshighlydependson
communes’ capacity. This is the reason why the Program has invested
considerablyoncapacitybuildingatlocallevel.Itis,ontheotherhand,difficultto
measure the effectiveness and quality of capacity building through training
courses.Weakcapacityofcontractorsdoesnotseemtobeanotableproblemfor
commune‐owned projects. Less than 6 percent of projects in P135‐II face this
problem.
5.2.4 Capacitystrengtheningatcommunity–HouseholdParticipation
Rural development and rural poverty reduction experience have shown that
empowering local governments to engage in a constructive dialogue with civil
society is one of the most cost‐effective and insightful medium for sustainable
community development. Participation is seen as a process of empowerment,
which aims to improve democracy, independence and self‐reliance of the rural
population (Ghai, 1990). Recognizing the importance of participatory approach,
P135‐IIhasstronglypromotedinformedpublicparticipationinprogramplanning
andmanagement.ThissectionmeasurestheimpactoftheProgramonhousehold
participation level throughout theselection,planningand implementationstages
of infrastructure projects. The participation level is assessed through the
perspectivesof communeoffice (the implementingagency) andhouseholds (the
targetedpopulation).
HouseholdparticipationinselectionofP135‐IIinfrastructureprojects
Householdparticipationintheselectionstageofinfrastructureprojectsiscritical
for project planning at grassroots level. Active and effective household
participation in project selection determineswhether their ideas and needs are
well reflected in the choice of construction projects at their locality. At village
level, selection meetings to get direct beneficiaries’ opinion are organized by
PlanningBoard.
According to local participatory scheme, all households are informed about
selection meetings and each would appoint one representative to attend the

88
meeting.After collecting community opinionsduring the selectionmeetings, the
Planning Board and village headwould then build an investment project list in
order of importance. With strong emphasis and close guidance of higher
administrativeauthorities, theProgramhassucceededinencouraginghousehold
to participate in project. In 2010, around 85 percent of P135‐II projects have
organizedlocalselectionmeetings;whiletheproportionsofhouseholdsawareof
themeetings are 56.1 percent and 79.3 percent in 2007 and 2010 respectively.
Thesefiguresfirstshowanimprovementinhouseholdawarenessovertheperiod
2007 – 2010, indicating better information dissemination at village level.
Nevertheless, the gapbetween household awareness rate and the actual rate of
meetings organized persists. With an increase in awareness about selection
meeting, attendance rate in selectionmeeting has climbed accordingly from 49
percent in 2007 to 73.9 percent in 2010, in which only 51 percent of poor
householdsattendselectionmeetingin2010.Thismeansthat49percentofpoor
householdshavebeenoverlookedinprojectselectionstage.
By ethnicities, our numerical findings indicate that Kinh&Hoa, Tay and Nung
groupsaremoreawareofselectionmeetings,thereforetheirparticipationratesin
selection meetings are the highest among all those of ethnic groups. Another
notable change is the tremendous increase in household awareness and in
participationlevelofThaigroupinprojectselectionovertheperiod2007–2010.
Informationaboutselectionmeetinghasbecomeknowntomorethan56percent
of Thai population in 2010, resulting from an increase in 50.6 percentage point
from2007.H’Monggrouphasthelowestparticipationrate.Householdswithmale
headparticipatemorethanhouseholdswithfemaleheadin2010.Figure5.4also
displayaninterestingtrendinhouseholdparticipationbyregion.AttheProgram’s
onset, the Northern region has the highest participation rate and the Southern
regionhasthelowestrate.Thistrendhasreversedin2010:Northernregionhas
thelowestparticipationlevelwhiletheothertworegionsdemonstratesignificant
improvement.ThisphenomenonsuggeststhattheSouthernandCentralcommune
authoritieshavescoredbetterintermsofimplementingparticipatoryapproachas
comparedtotheirNortherncounterpart.

89
Figure5.4:Householdparticipationrateinselectionmeeting(%)
Source:AnalysisTeamcalculationsbasedon2007and2012householdsurveys.
Even thoughhouseholds have become increasingly involved in project selection
meeting,themajorityremainsinactiveduringselectionmeetings’discussion.Our
empirical results indicate an almost triple increase in the percentage of
households who voice their opinions during project selection meeting but the
figure remains low at 36.1 percent, out of 76.6 percent joining the meeting in
2010. Qualitative analyses indicate a number of important reasons thatmake it
difficult to obtain households’ opinion: languagebarrier for the ethnicminority,
lackofpreparationandineffectivenessincollectionofsocio‐economicinformation
at village board. First, most ethnic minority groups use their native language
during group discussion while written guidance and relevant documents are
written in Kinh language. This language barrier prevents the ethnic minorities
fromexpressingtheiropinionsinaclearmanner.Second,attendantsaresupposed
tobeequippedwithcertainsocio‐economicbackgroundinformationforeffective
participationbut the informationhasnotbeenproperly collectedbyvillageand
commune.Therefore,attendantsarenotwell‐informedpriortothemeeting.Asa
result,selectionprocesshasnotwellreflectedhouseholdopinionsbutthoseofthe
upperadministrativelevels.
Classification by ethnic minorities and household characteristics provides
prominentpatterns.Threeethnicgroups:Kinh&Hoa,Tay,andThaiarethemost
activeinsharingtheirideasduringselectionmeetingsin2010.MuongandH’Mong
groups seem to be the most “reticent” groups. By 2010, the percentage of
householdswithmaleheadsharingtheiropinionsdoublesthatofhouseholdswith
femalehead.Themajorityofhouseholdrepresentativesinselectionmeetingsare
0
20
40
60
80
100
Total Householdwith malehead
Householdwith female
head
North Central South
2007 2010
90
household heads; therefore, the noted discrepancy reflects gender difference as
maleparticipantsseemtobemoreconfidentinsharingtheiropinionsthantheir
femalecounterparts.Thisphenomenonisparticularlytrueintheruralandremote
setting where male is given priority in education and in the decision‐making
process.
Amongthosewhovoiceouttheiropinions,25.8percentofhouseholdshavetheir
ideas taken, three times higher than the corresponding figure in 2007 (8.2
percent).Eventhoughonlyasmallnumberofhouseholdshavingtheirideastaken,
themajority of households interviewedare satisfiedwithproject selection.This
canbeattributedtothefactthatthelivingconditionandsocio‐economicstatusat
treated areas are extremely inadequate, so any additional construction project
wouldsignificantlyimprovetheirlivingconditionandlivelihood.
HouseholdcontributiontoimplementationstageofP135‐IIinfrastructure
projects
Communitycontribution
Communitycontributionforpublicinvestmentdoesnotonlyincludefinancialand
laborsupportto infrastructureproject implementationbutalsoaimstopromote
public accountability in project management and future maintenance of public
services. Local contribution comes under the formof cash or in‐kind labor. The
number of households making contribution to infrastructure projects increases
significantly by 14.2 percent over the period 2007 – 2010. One big concern of
communitycontributioninpoorcommunesisthatthisstrategymightposedirect
taxationtohouseholds’ limitedincomeorreducetheirtimeavailabilityforother
income‐generatingactivities.Thisconcerndoesappeartobeaproblemaccording
toourfindingasthecontributionrateofthepoorisrelativelyhigherthanthatof
thenon‐poor forboth2007and2010.Table5.3 shows consistent improvement
regarding community contribution in terms of household number as well as
contributionvalueincashandin‐kindlabor.Forinstance,theaveragenumberof
labordayscontributedbyeachhouseholdincreasessignificantlyfrom1.1in2007
to 6.27 in 2010. Value of contribution per household for each project also rises
greatly by 10 times. In general, household contributions still represent a small
percentageofthetotalvalueoftheprojects,thesecontributionsare,nevertheless,
importantinpromotingcommunityresponsibilityforpublicservicesfromwhich
they are the direct beneficiaries. Households have demonstrated their

91
responsibility as well as recognized the importance of these infrastructure
projects to their livingconditionand livelihood. In thisrespect, theProgramhas
succeeded in promoting households’ accountability in construction of public
projects,albeittoacertainextent.
Table5.3:CommunitycontributionforP135‐IIinfrastructureprojects(%)
2007 2010 Difference
Householdscontributingtoconstructionoftheproject(2) 21.8 35.9 14.1
Averageamountofcontributionincash(1000Dong)perhousehold(2)
12.2 135.42 123.2
Averageamountofhouseholdcontributionincashperproject(1000Dong)(1)
4,136.2 5,713.5 1,577.3
Averagenumberoflabordayperhousehold(2) 1.07 6.27 5.2
Averagenumberoflabordaycontributedbyhouseholdperproject(1)
100.2 122.5 22.3
Source:AnalysisTeamcalculationsbasedon2007and2012householdsurveys.
Jobcreation(byalllocalinfrastructureprojects)
Infrastructure development can create job opportunities and generate a
temporary source of income for local people living in the areas where the
constructionprojectsarecarriedout.P135‐IIandmanyotherpovertyreduction
projectshaveconnectedinfrastructuredevelopmentwithjobcreationandincome
generationfor localpeople.Thisstrategyalsopromotescommunity“ownership”
withrespecttoinfrastructureprojects.
Table5.4:Jobcreationopportunitiesforhouseholdsinlocalinfrastructureprojects
2007 2010 DifferenceHouseholdshavingmembersworkingforlocalinfrastructureprojects(%) 31.1 27.1 ‐4.0
Participantsininfrastructureprojectshavingsignedcontractswithemployers(%) 2.9 1.8 ‐1.1
Averagenumberofworkingdaysperprojectparticipantinthepast12months 6.5 7.2 0.7
Participantsgetpaidfromworkingforinfrastructureprojects(%) 4.4 9.1 4.7
Source:AnalysisTeamcalculationsbasedon2007and2012householdsurveys.
Theleveloflocaljobcreatedfromalllocalinfrastructureprojectsremainslowand
seems to slightly decrease over the period 2007 – 2010. In the setting that
households’ laborcontributionforall local infrastructureprojectshavetendency
todecline(by4percentagepointasshowninTable5.4),P135‐IIhasdoneagood
92
job in attractingmore localworkers (as shown inTable5.3). Thepercentageof
households having members working for local infrastructure projects stays
around30percent, inwhichonly less than3percenthave signed contractwith
employers. Most local members work informally for infrastructure projects
without legal obligation. This situation seems toworsen in 2010, demonstrated
througha1.1percentagepoint(40percent)drop incontractsigningrate.When
nolegalbindingagreementismadebetweenthecontractorandtheworkers,both
partiesarenotobligedtotakeresponsibilityfortheotherandthismightaffectthe
qualityaswellasprogressofanyproject.
Intermsoflaborcontribution,thereisanincreaseinaveragenumberofworking
days per project per participant (6.5 to 7.2) and the percentage of households
gettingpaiddoubles (4.4percent to9.1percent)despite its remaining lowover
the period 2007 – 2010. This phenomenon implies that infrastructure projects
haveprovidedmorepaidworktolocalworkersintheyear2010butmajorityof
households still do unpaid or voluntarywork for local construction projects. In
theory, infrastructure development seems to be a good opportunity to generate
income for the local, but in reality project contractors encounter considerable
difficulty in recruiting qualified and available local workers. This phenomenon
explains the lowparticipation of localworkers.Firstly, localworkers could only
take up simple‐skill work while certain construction stages require skilled
workers so the contractors enduphiring outsideworkers.Secondly,many local
workers,especially theethnicminorityworkers,preferworkingonadailybasis
and they arenotwilling toworkovertimeor atweekendwhen required.These
constraints adversely affect the effectiveness of job creation from infrastructure
developmentprojects.
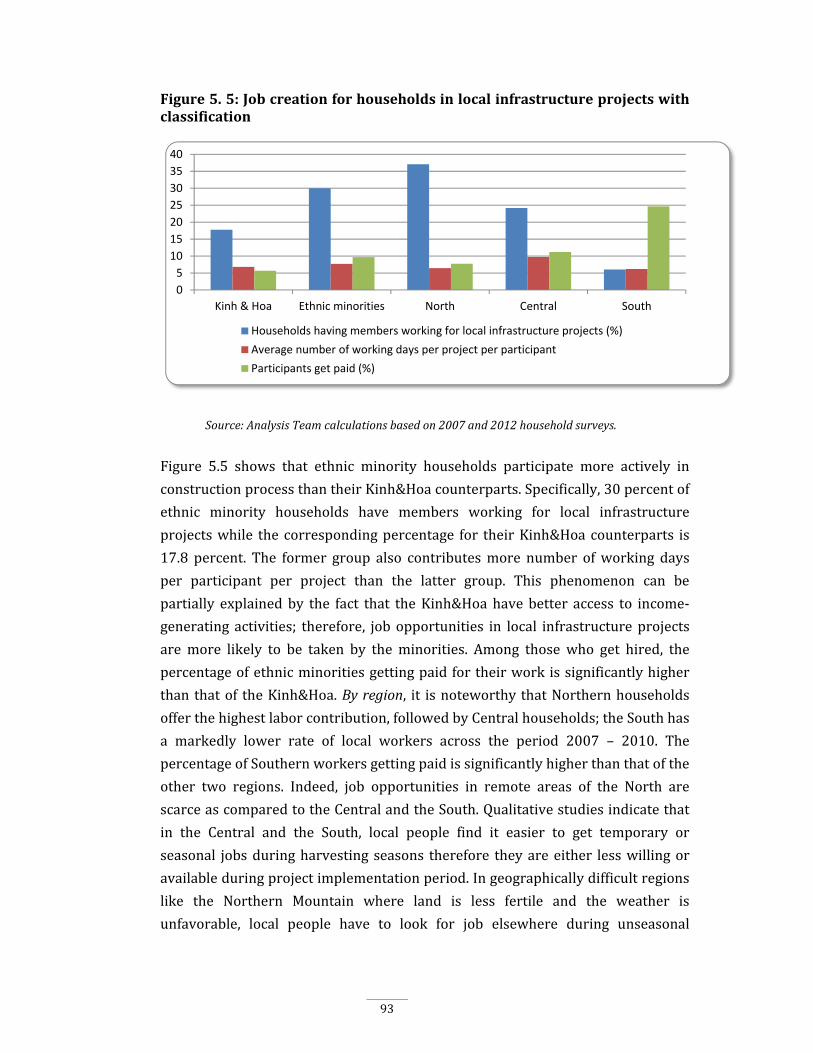
93
Figure5.5:Jobcreationforhouseholdsinlocalinfrastructureprojectswithclassification
Source:AnalysisTeamcalculationsbasedon2007and2012householdsurveys.
Figure 5.5 shows that ethnic minority households participate more actively in
constructionprocessthantheirKinh&Hoacounterparts.Specifically,30percentof
ethnic minority households have members working for local infrastructure
projectswhile the correspondingpercentage for theirKinh&Hoacounterparts is
17.8 percent. The former group also contributesmore number ofworking days
per participant per project than the latter group. This phenomenon can be
partially explainedby the fact that theKinh&Hoahave better access to income‐
generating activities; therefore, jobopportunities in local infrastructureprojects
aremore likely to be taken by theminorities. Among those who get hired, the
percentageofethnicminoritiesgettingpaidfortheirworkissignificantlyhigher
thanthatof theKinh&Hoa.Byregion, it isnoteworthy thatNorthernhouseholds
offerthehighestlaborcontribution,followedbyCentralhouseholds;theSouthhas
a markedly lower rate of local workers across the period 2007 – 2010. The
percentageofSouthernworkersgettingpaidissignificantlyhigherthanthatofthe
other two regions. Indeed, job opportunities in remote areas of the North are
scarceascomparedtotheCentralandtheSouth.Qualitativestudiesindicatethat
in the Central and the South, local people find it easier to get temporary or
seasonal jobsduringharvesting seasons therefore theyareeither lesswillingor
availableduringprojectimplementationperiod.Ingeographicallydifficultregions
like the Northern Mountain where land is less fertile and the weather is
unfavorable, local people have to look for job elsewhere during unseasonal
0
5
10
15
20
25
30
35
40
Kinh & Hoa Ethnic minorities North Central South
Households having members working for local infrastructure projects (%)
Average number of working days per project per participant
Participants get paid (%)
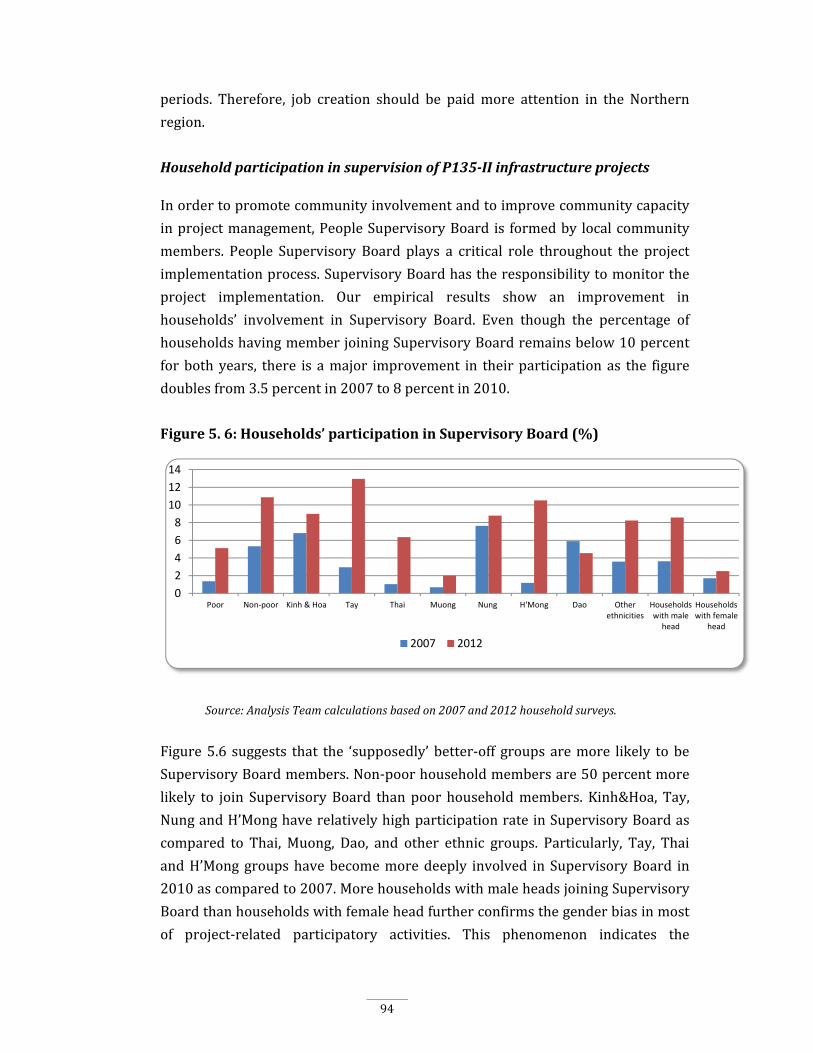
94
periods. Therefore, job creation should be paidmore attention in the Northern
region.
HouseholdparticipationinsupervisionofP135‐IIinfrastructureprojects
Inordertopromotecommunityinvolvementandtoimprovecommunitycapacity
inprojectmanagement,PeopleSupervisoryBoard is formedby localcommunity
members. People Supervisory Board plays a critical role throughout the project
implementationprocess.SupervisoryBoardhastheresponsibilitytomonitorthe
project implementation. Our empirical results show an improvement in
households’ involvement in Supervisory Board. Even though the percentage of
householdshavingmemberjoiningSupervisoryBoardremainsbelow10percent
forbothyears, there is amajor improvement in theirparticipationas the figure
doublesfrom3.5percentin2007to8percentin2010.
Figure5.6:Households’participationinSupervisoryBoard(%)
Source:AnalysisTeamcalculationsbasedon2007and2012householdsurveys.
Figure5.6 suggests that the ‘supposedly’ better‐off groups aremore likely tobe
SupervisoryBoardmembers.Non‐poorhouseholdmembersare50percentmore
likely to join SupervisoryBoard thanpoor householdmembers. Kinh&Hoa, Tay,
NungandH’MonghaverelativelyhighparticipationrateinSupervisoryBoardas
compared to Thai, Muong, Dao, and other ethnic groups. Particularly, Tay, Thai
andH’Monggroupshavebecomemoredeeply involved inSupervisoryBoard in
2010ascomparedto2007.MorehouseholdswithmaleheadsjoiningSupervisory
Boardthanhouseholdswithfemaleheadfurtherconfirmsthegenderbiasinmost
of project‐related participatory activities. This phenomenon indicates the
0
2
4
6
8
10
12
14
Poor Non‐poor Kinh & Hoa Tay Thai Muong Nung H'Mong Dao Otherethnicities
Householdswith malehead
Householdswith female
head
2007 2012
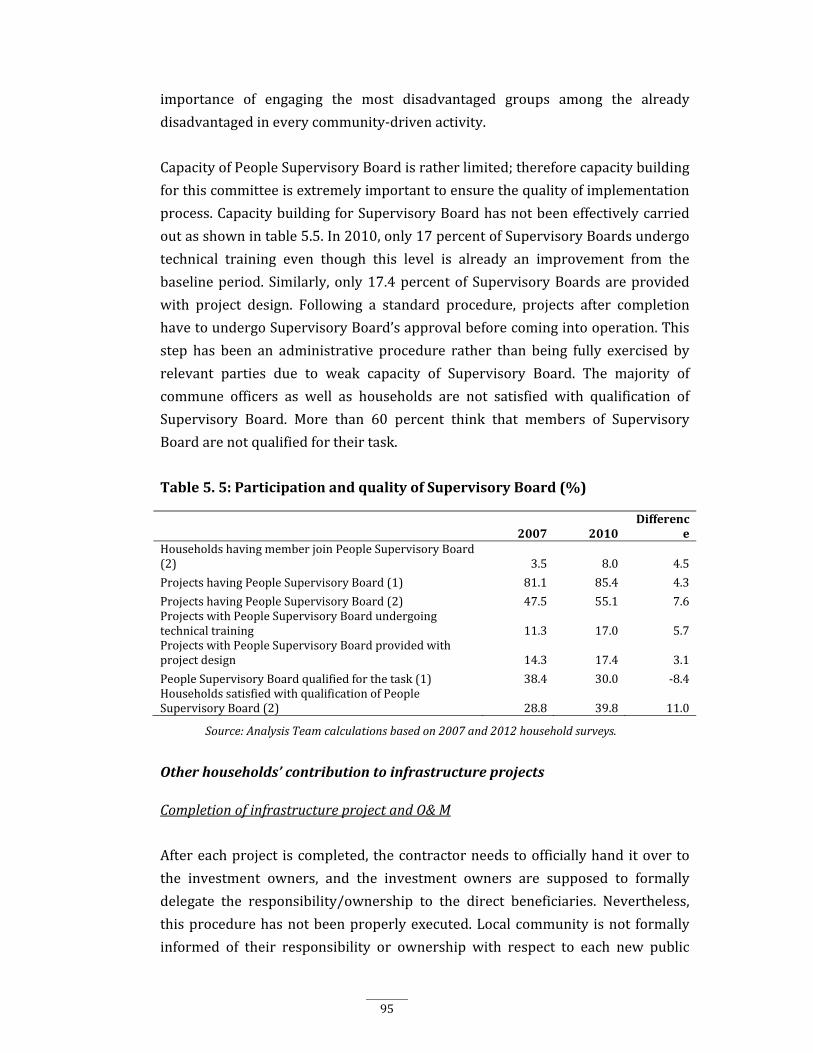
95
importance of engaging the most disadvantaged groups among the already
disadvantagedineverycommunity‐drivenactivity.
CapacityofPeopleSupervisoryBoardisratherlimited;thereforecapacitybuilding
forthiscommitteeisextremelyimportanttoensurethequalityofimplementation
process.CapacitybuildingforSupervisoryBoardhasnotbeeneffectivelycarried
outasshownintable5.5.In2010,only17percentofSupervisoryBoardsundergo
technical training even though this level is already an improvement from the
baselineperiod.Similarly,only17.4percentofSupervisoryBoardsareprovided
with project design. Following a standard procedure, projects after completion
havetoundergoSupervisoryBoard’sapprovalbeforecomingintooperation.This
step has been an administrative procedure rather than being fully exercised by
relevant parties due to weak capacity of Supervisory Board. The majority of
commune officers as well as households are not satisfied with qualification of
Supervisory Board. More than 60 percent think that members of Supervisory
Boardarenotqualifiedfortheirtask.
Table5.5:ParticipationandqualityofSupervisoryBoard(%)
2007 2010Differenc
eHouseholdshavingmemberjoinPeopleSupervisoryBoard(2) 3.5 8.0 4.5
ProjectshavingPeopleSupervisoryBoard(1) 81.1 85.4 4.3
ProjectshavingPeopleSupervisoryBoard(2) 47.5 55.1 7.6ProjectswithPeopleSupervisoryBoardundergoingtechnicaltraining 11.3 17.0 5.7ProjectswithPeopleSupervisoryBoardprovidedwithprojectdesign 14.3 17.4 3.1
PeopleSupervisoryBoardqualifiedforthetask(1) 38.4 30.0 ‐8.4HouseholdssatisfiedwithqualificationofPeopleSupervisoryBoard(2) 28.8 39.8 11.0
Source:AnalysisTeamcalculationsbasedon2007and2012householdsurveys.
Otherhouseholds’contributiontoinfrastructureprojects
CompletionofinfrastructureprojectandO&M
Aftereachproject iscompleted, thecontractorneedstoofficiallyhand itoverto
the investment owners, and the investment owners are supposed to formally
delegate the responsibility/ownership to the direct beneficiaries. Nevertheless,
thisprocedurehasnotbeenproperlyexecuted.Localcommunity isnot formally
informed of their responsibility or ownership with respect to each new public
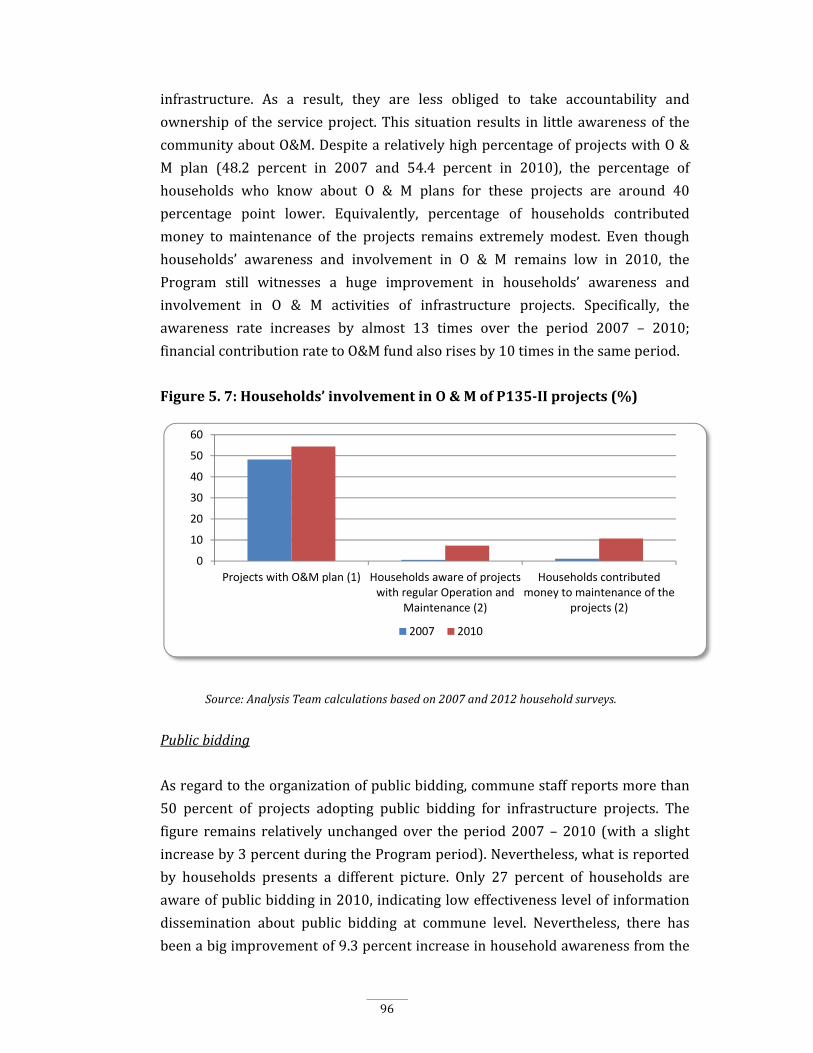
96
infrastructure. As a result, they are less obliged to take accountability and
ownershipof theserviceproject.This situationresults in littleawarenessof the
communityaboutO&M.DespitearelativelyhighpercentageofprojectswithO&
M plan (48.2 percent in 2007 and 54.4 percent in 2010), the percentage of
households who know about O & M plans for these projects are around 40
percentage point lower. Equivalently, percentage of households contributed
money to maintenance of the projects remains extremely modest. Even though
households’ awareness and involvement in O & M remains low in 2010, the
Program still witnesses a huge improvement in households’ awareness and
involvement in O & M activities of infrastructure projects. Specifically, the
awareness rate increases by almost 13 times over the period 2007 – 2010;
financialcontributionratetoO&Mfundalsorisesby10timesinthesameperiod.
Figure5.7:Households’involvementinO&MofP135‐IIprojects(%)
Source:AnalysisTeamcalculationsbasedon2007and2012householdsurveys.
Publicbidding
Asregardtotheorganizationofpublicbidding,communestaffreportsmorethan
50 percent of projects adopting public bidding for infrastructure projects. The
figure remains relatively unchangedover the period2007 – 2010 (with a slight
increaseby3percentduringtheProgramperiod).Nevertheless,whatisreported
by households presents a different picture. Only 27 percent of households are
awareofpublicbiddingin2010,indicatingloweffectivenesslevelofinformation
dissemination about public bidding at commune level. Nevertheless, there has
beenabigimprovementof9.3percentincreaseinhouseholdawarenessfromthe
0
10
20
30
40
50
60
Projects with O&M plan (1) Households aware of projectswith regular Operation and
Maintenance (2)
Households contributedmoney to maintenance of the
projects (2)
2007 2010
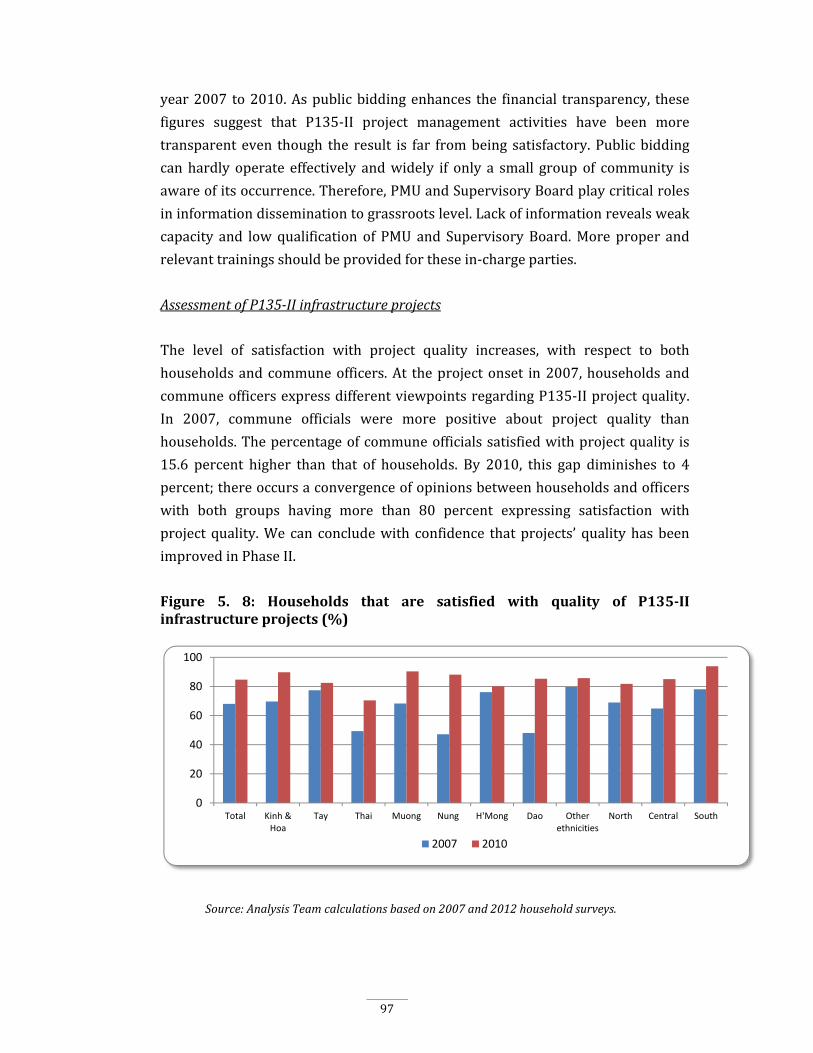
97
year2007 to2010.Aspublicbiddingenhances the financial transparency, these
figures suggest that P135‐II project management activities have been more
transparent even though the result is far frombeing satisfactory.Publicbidding
canhardly operate effectively andwidely if only a small group of community is
awareofitsoccurrence.Therefore,PMUandSupervisoryBoardplaycriticalroles
ininformationdisseminationtograssrootslevel.Lackofinformationrevealsweak
capacity and lowqualification of PMU and SupervisoryBoard.More proper and
relevanttrainingsshouldbeprovidedforthesein‐chargeparties.
AssessmentofP135‐IIinfrastructureprojects
The level of satisfaction with project quality increases, with respect to both
householdsandcommuneofficers.At theprojectonset in2007,householdsand
communeofficersexpressdifferentviewpointsregardingP135‐IIprojectquality.
In 2007, commune officials were more positive about project quality than
households.Thepercentageofcommuneofficialssatisfiedwithprojectquality is
15.6 percent higher than that of households. By 2010, this gap diminishes to 4
percent;thereoccursaconvergenceofopinionsbetweenhouseholdsandofficers
with both groups having more than 80 percent expressing satisfaction with
projectquality.We can concludewith confidence thatprojects’ qualityhasbeen
improvedinPhaseII.
Figure 5. 8: Households that are satisfied with quality of P135‐IIinfrastructureprojects(%)
Source:AnalysisTeamcalculationsbasedon2007and2012householdsurveys.
0
20
40
60
80
100
Total Kinh &Hoa
Tay Thai Muong Nung H'Mong Dao Otherethnicities
North Central South
2007 2010

98
Figure5.8 providesacloser look intohouseholds’evaluationwithclassification
by ethnicity and region. All ethnicities express an increase in the level of
satisfactionwithqualityoftheproject,especiallyNungandDaowith41.0percent
and37.2percent increase respectively.Households from the South showhigher
satisfactionwiththeprojectquality,ascomparedtotheNorthandCentralregions.
BeneficiariesofP135‐IIinfrastructureprojects
Increase in satisfaction level can be related to the increase in beneficiary
population per each infrastructure project. P135‐II Infrastructure projects have
successfullyextendeditsreachforgreaterimpact.Bytheendof2010,thereisa10
percent increase in number of household benefiting fromP135‐II infrastructure
projects,makingup94.6percentof the totalhouseholdnumberbenefiting from
the project. Half of the beneficiary population is poor households. This
phenomenonindicatesthatP135‐IIhasfairlysucceededintargetingthepoor.
Table5.6:HouseholdsbenefitfromP135‐IIinfrastructureprojects
2007 2010 Difference
Total 84.90 94.59 9.70
Ethnicities
Kinh&Hoa 85.92 96.95 11.03
Tay 84.83 92.34 7.51
Thai 71.65 94.70 23.04
Muong 89.60 96.77 7.17
Nung 75.86 99.56 23.71
H'Mong 90.50 89.47 ‐1.02
Dao 76.01 91.20 15.19
Otherethnicities 92.47 93.31 0.84
Region
North 85.83 92.49 6.66
Central 83.71 96.21 12.50
South 84.04 97.38 13.34
Source:AnalysisTeamcalculationsbasedon2007and2012householdsurveys.
Benefitfrominfrastructureprojectsisdistributedrelativelyequallyamongethnic
groupsandacrossthreemaingeographicalregions.Formostoftheethnicgroups,
thepopulationbenefiting fromP135‐II infrastructureprojectsremainsabove90
percent of the whole population, except for H’Mong with 89.5 percent (2010).
NungandThaigroupsshowthehighestaugmentationinthebenefitedpopulation
from P135‐II infrastructure projects (23.7 percent and 23.04 percent
99
respectively). Apart fromNung and Thai groups, Kinh&Hoa andDao are among
thegroupswithsignificantriseinnumberofhouseholdsbenefittingfromP135‐II
infrastructure projects. By region, households from the South benefit the most
from P135‐II infrastructure projects (97.4 percent), followed by Central region
(96.2percent),andNorthregion(92.5percent).
5.3 ImpactofP135‐IIonoutcomes
5.3.1P135‐IIImpactsonKeyResponseVariables
Higher level outcomes appear in the lower half of Figure 3.2 (Causal Chain
Hypothesis). These include measures of agricultural production, household
income,householdpovertystatus,andsoon.Inthissectionwedefineseveralkey
responsevariablesandreporttheestimatedimpactsofP135‐IIonthem.Wefocus
heavily onmeasures of agricultural productivity because important elements of
P135‐IItargetagriculturalproductivity.Thedetaildefinitionof thekeyresponse
variables,includingthecalculationmethod,ispresentedintheappendix
5.3.2 ControlVariables
Control variables for the household income regressions include: education and
education squared of the best‐educatedworking‐agemember of the household;
age,agesquared,andgenderof thehouseholdhead;sizeof thehousehold; total
landareaheldby thehousehold;annual remittances receivedby thehousehold;
an indicator for the number of negative shocks experienced by the household
during the past few years; and a dummy variable for the year (2007 or 2012).
Workingageisdefinedas15≤age≤65forbothmenandwomen.Weranseparate
regressions for minority and non‐minority households that aims to the impact
leveloftheProgramonthedifferentmajorbeneficiaryhouseholdgroups.
5.3.3 Estimation
Fixed‐effects estimation was implemented via the xtreg command in STATA;
estimationaccountedforthecomplexsampledesign(stratification,clustering,and
weighting). Outliers, defined as observations with values greater than four
standarddeviationsfromthemean,weredeletedpriortoestimation. Thesetof
control variableswasnarrowed‐downby stepwisedeletion: the least significant
variablewasdeletedandthemodelre‐estimateduntilallremainingcontrolswere
100
significantat the40% level. Thehighsignificance level isused toguardagainst
Type II error,whichwould lead to omitted variables bias. Results are given in
Table5.7below.
EstimatedP135‐IIimpactappearsincolumnsheadedbyDIDFE/X(difference‐in‐
differences, fixed‐effects, with controls). T‐ratios for the hypothesis that the
impact is no greater than zeroare given, asare one‐tail p‐values for testing the
hypothesis. Impacts are given forminority and non‐minority households. The
panelsontheright‐handsideofthetableshowthesampleaveragevaluesofthe
outcomevariables,whicharehelpfulforinterpretingtheestimatedimpacts.Itis
essential tokeep inmindtheroleof thecounterfactual(comparisoncommunes)
forinterpretingtheestimatedimpacts.
Forexample,theestimatedimpactonassetindexforminoritiesis0.38.However,
the samplemeans show the following: between 2007 and 2012 the asset index
amongcomparisonhouseholdsdecreasedfrom2.43to2.09(in2007households
had2.43assetitems,onaverage;thisdeclinedto2.09by2012).Thus,thechange
overtimewas‐0.34.Overthesametimespanassetitemsownedbyhouseholdsin
treatmentcommunesincreasedfrom2.30to2.33,andincreaseof0.03.Werewe
to use these data to calculate the difference‐in‐differences estimator, the
calculationwouldbe[(2.33–2.30)–(2.09–2.43)]=0.37. Thus, thesignificant
positiveimpactdoesnotnecessarilymeanthathouseholdsinthetreatmentarea
weremuchbetteroff in2012 than theywere in2007. Theestimated impact in
thiscaseshouldbe interpretedas follows: intheabsenceof treatment, theasset
indexof treatmenthouseholdswouldhavedecreasedby thesameamountas for
thecomparisonhouseholds. Finally,weseeinthiscasethatthecontrolsdidnot
playaveryimportantrole:theestimatedimpactisquiteclosetotheordinaryDID
calculation.
For further illustration,examinetheresults for incomefrombusinesses fornon‐
minorities. The large negative impact (‐22,536) appears to indicate that
households in the treatment communes are much worse off. Again, the key
interpretation is relative: households in the treatment communes saw their
incomes from businesses rise from 22,988 to 28,703 between 2007 and 2012.
However, households in the comparison communes enjoyed a much larger
averageincrease:from21,912to48,759.Thus,businessincomesofhouseholdsin
the treatment communes failed to grow as rapidly as business incomes of
counterparthouseholdsincomparisoncommunes.
101
Minority households recorded statistically significant positive impacts due to
P135‐II for several important variables: productive assetownership, household
durables ownership, and rice productivity. Amonghigher‐order outcomes, they
enjoyedpositiveimpactsinincomefromagriculture,householdtotalincome,and
household per‐capita income. A particularly important result is that poverty
amongminority households in treatment communesdeclined significantlymore
than it declined in comparison communes. Specifically, for ethnic minority
households, P135‐ II increased the rice productivity about 10%, agriculture
incomeabout17%,totalincomeofthesehouseholdsabout16%,andthenreduce
thepovertyof ethnicminority about10%. Inaddition,Programhelps to reduce
thetraveltimeofethnicminorityhouseholdstohealthfacilitiesabout 12%.
Inonly two instanceswereestimated impacts forminorityhouseholdsnegative.
First, the value of their corn productivity among households in treatment
communesincreasedlessthanthatincomparisoncommunes.butitdidincrease
(from770VNDpersquaremeterto1,590VNDpersquaremetercomparedtoan
increasefrom0.94VNDpersquaremeterto1,940VNDpersquaremeter).Inthis
casewe see not only did comparison households enjoy a larger increase in the
valueoftheircornproductivity,theystartedoffatahighervalueaswell.Asimilar
description isappropriateforthenegative impactrecordedfortheshareof land
allocatedtoindustrialcrops.
Statistically significant positive impacts were recorded for non‐minority
households for their household durables index and for their corn, cassava, and
industrialcropsproductivities. While the industrial cropproductivity increased,
the share of land allocated to industrial crops decreased. Perhaps both results
weredrivenbytakingtheleast‐productivelandoutofindustrialcropsproduction.
Non‐minority households in treatment areas saw their agricultural incomes
decline while those in comparison areas saw theirs increase: this contrast is
reflected in the statistically significant impact on income from agriculture. The
statisticallysignificantimpactonincomefrombusinesseswasdiscussedabove.
Finally, the measured travel time to health facilities in treatment communes
increased.Whileitseemsunlikelythattraveltimestospecificfacilitiesincreased,
thisresultcouldbedrivenbyashiftinthemixofhealthfacilitiesvisited.
102
Theright‐handpanelsofTable5.7supporttwoimportantgeneralizations.First,
inalmostallmeasuresthetreatmentcommuneswereworseoffin2007thanthe
comparison communes. This is consistent with authorities directing P135‐II
resourcestocommunesmostinneed.
Second, non‐minority households are better off than minority households in
severalveryimportantrespects.Inparticulartheyhavelowerincomesandlower
schoolenrollments.Forbothofthese,thereisevidenceofimprovement.Incomes
increased,butnotasmuchasnon‐minorities.Enrollmentsalsoincreased,andby
largerpercentagesthanfornon‐minorities.
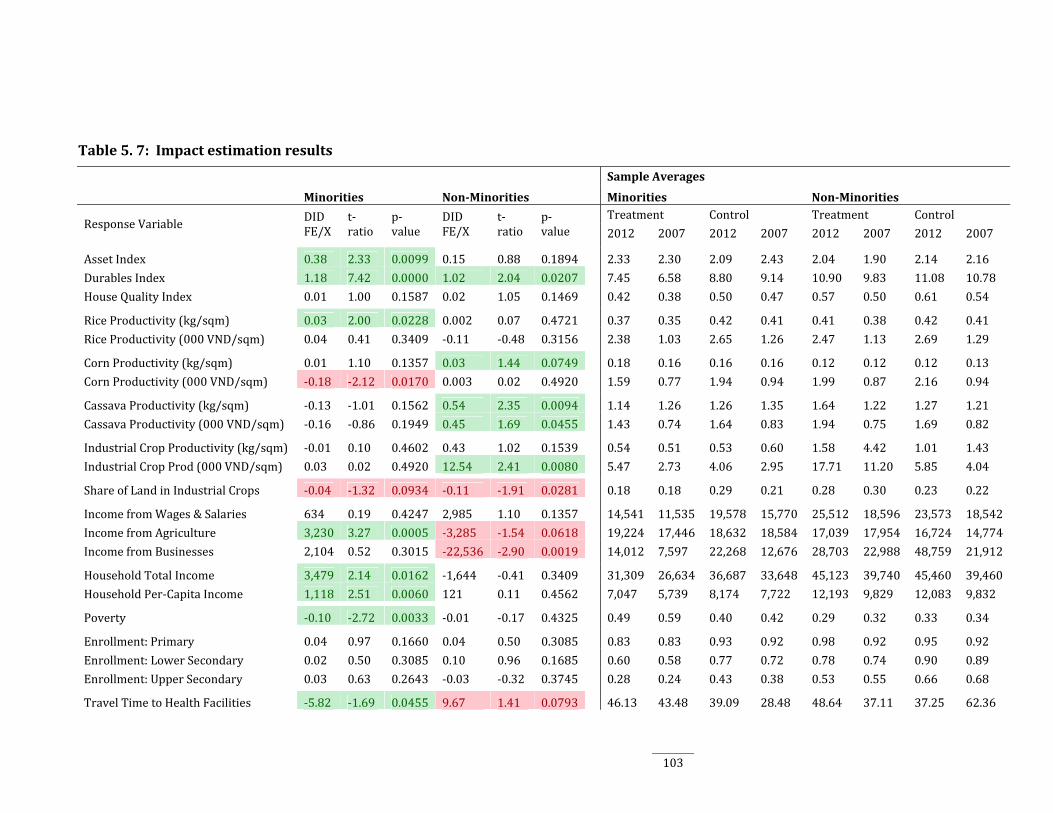
103
Table5.7:Impactestimationresults
SampleAverages
Minorities Non‐Minorities Minorities Non‐Minorities
ResponseVariable DIDFE/X
t‐ratio
p‐value
DIDFE/X
t‐ratio
p‐value
Treatment Control Treatment Control
2012 2007 2012 2007 2012 2007 2012 2007
AssetIndex 0.38 2.33 0.0099 0.15 0.88 0.1894 2.33 2.30 2.09 2.43 2.04 1.90 2.14 2.16
DurablesIndex 1.18 7.42 0.0000 1.02 2.04 0.0207 7.45 6.58 8.80 9.14 10.90 9.83 11.08 10.78
HouseQualityIndex 0.01 1.00 0.1587 0.02 1.05 0.1469 0.42 0.38 0.50 0.47 0.57 0.50 0.61 0.54
RiceProductivity(kg/sqm) 0.03 2.00 0.0228 0.002 0.07 0.4721 0.37 0.35 0.42 0.41 0.41 0.38 0.42 0.41
RiceProductivity(000VND/sqm) 0.04 0.41 0.3409 ‐0.11 ‐0.48 0.3156 2.38 1.03 2.65 1.26 2.47 1.13 2.69 1.29
CornProductivity(kg/sqm) 0.01 1.10 0.1357 0.03 1.44 0.0749 0.18 0.16 0.16 0.16 0.12 0.12 0.12 0.13
CornProductivity(000VND/sqm) ‐0.18 ‐2.12 0.0170 0.003 0.02 0.4920 1.59 0.77 1.94 0.94 1.99 0.87 2.16 0.94
CassavaProductivity(kg/sqm) ‐0.13 ‐1.01 0.1562 0.54 2.35 0.0094 1.14 1.26 1.26 1.35 1.64 1.22 1.27 1.21
CassavaProductivity(000VND/sqm) ‐0.16 ‐0.86 0.1949 0.45 1.69 0.0455 1.43 0.74 1.64 0.83 1.94 0.75 1.69 0.82
IndustrialCropProductivity(kg/sqm) ‐0.01 0.10 0.4602 0.43 1.02 0.1539 0.54 0.51 0.53 0.60 1.58 4.42 1.01 1.43
IndustrialCropProd(000VND/sqm) 0.03 0.02 0.4920 12.54 2.41 0.0080 5.47 2.73 4.06 2.95 17.71 11.20 5.85 4.04
ShareofLandinIndustrialCrops ‐0.04 ‐1.32 0.0934 ‐0.11 ‐1.91 0.0281 0.18 0.18 0.29 0.21 0.28 0.30 0.23 0.22
IncomefromWages&Salaries 634 0.19 0.4247 2,985 1.10 0.1357 14,541 11,535 19,578 15,770 25,512 18,596 23,573 18,542
IncomefromAgriculture 3,230 3.27 0.0005 ‐3,285 ‐1.54 0.0618 19,224 17,446 18,632 18,584 17,039 17,954 16,724 14,774
IncomefromBusinesses 2,104 0.52 0.3015 ‐22,536 ‐2.90 0.0019 14,012 7,597 22,268 12,676 28,703 22,988 48,759 21,912
HouseholdTotalIncome 3,479 2.14 0.0162 ‐1,644 ‐0.41 0.3409 31,309 26,634 36,687 33,648 45,123 39,740 45,460 39,460
HouseholdPer‐CapitaIncome 1,118 2.51 0.0060 121 0.11 0.4562 7,047 5,739 8,174 7,722 12,193 9,829 12,083 9,832
Poverty ‐0.10 ‐2.72 0.0033 ‐0.01 ‐0.17 0.4325 0.49 0.59 0.40 0.42 0.29 0.32 0.33 0.34
Enrollment:Primary 0.04 0.97 0.1660 0.04 0.50 0.3085 0.83 0.83 0.93 0.92 0.98 0.92 0.95 0.92
Enrollment:LowerSecondary 0.02 0.50 0.3085 0.10 0.96 0.1685 0.60 0.58 0.77 0.72 0.78 0.74 0.90 0.89
Enrollment:UpperSecondary 0.03 0.63 0.2643 ‐0.03 ‐0.32 0.3745 0.28 0.24 0.43 0.38 0.53 0.55 0.66 0.68
TravelTimetoHealthFacilities ‐5.82 ‐1.69 0.0455 9.67 1.41 0.0793 46.13 43.48 39.09 28.48 48.64 37.11 37.25 62.36
104
5.4 Conclusion
Program 135‐II has harvested significant success in implementing participatory
approach from central to grassroots level. First, remarkable progress has been
made by commune office in the implementation process. Notably, the Program
experiences 24 percentage point increase in the number of commune‐owned
projects, 23 percentage point increase in that of commune PMUs, and 10
percentagepointincreaseinthatofprojectshavingtreasuryaccount.Second,huge
improvement inhouseholdparticipation level in every stage including selection,
planningandimplementationhasbeenwitnessedtowardstheendoftheProgram:
24.8 percentage point increase in selection meeting attendance, 23 percentage
point increase in thenumberofhouseholds sharing their viewpointsduring the
meeting,24percentagepointincreaseinhouseholds’contributiontoconstruction
projectsand9‐timeincreaseinhouseholdcontributiontowardsO&Mfunds.Third,
enhancementinfinancialtransparencyhasbeenachievedtoacertainextent.More
than24percentofprojectshaveitsfinancial informationpublicizedandtherate
ofhouseholdsreceivingfinancialinformationalsodoublesovertheperiod2007‐
2010.TheProgramhasexpandeditscoveragetoagreaterbeneficiarygroup.By
2010,94.6percentofhouseholdsbenefitfromeachinfrastructureproject.
Eventhoughhugeprogresshasbeenmade,thetargetof100percentofcommunes
becominginvestmentownershasnotbeenachievedandthisisstillconsidereda
highly challenging task given weak capacity building at local level. Significant
improvement in every implementation activity has been made but the level of
achievementincapacitybuildingatlocalauthoritiesandcommunityremainslow.
Thissituationisfirstdisplayedthroughweakimplementationatcommunelevel:
46 percent of commune‐owned infrastructure projects, 54.2 percent of projects
withpublicbidding,39.1percentofprojectswithtreasuryaccounts,54.4projects
with O&M plan. On the other hand, community participation is still limited in
certain stage such as: only 36.1 households voice their opinion during selection
meeting,8percent joinPeopleSupervisionBoard.Participation level alsovaries
greatly by different beneficiaries groups, with the most disadvantaged groups
including ethnic minorities and female should be given more attention. With a
“low” starting point of local authorities, the implementation process has
encountered multiple difficulties. Impact of commune investment ownership is
nothighlysignificantandclear.Commune‐ownedprojectsstillfacewithproblems
during implementation period such as slow disbursement andweak capacity of
communeofficials.ParticipationinprojectsupervisionandO&Mactivitiesreceive

105
the least attention. Our finding also specifies the importance of an effective
information dissemination mechanism to ensure high level of informed public
participation. Communication mechanism needs to receive additional attention
from the Program because access to information is highly correlated to the
effectivenessofcommunity‐drivenimplementation.
Thesuccessofparticipatoryapproachrequirestremendouseffortsfromcentralto
localauthoritiesinengaginglocalcommunityintoeveryprojectactivity.Toensure
an effective participation, local community needs to be equippedwith sufficient
information, knowledge, and understanding in the operation of each activity as
well as understanding the importanceof their participationprior to their active
involvement. Also, institutional capacity building needs to precede that at local
community. Apart from providing a systematic participatory framework, the
Program should focus on improving each and every activity of the project
implementation.Ouranalysishas identifiedkey strengthaswell asweakness in
projectmanagementandcapacity strengtheningprocess.Participatoryapproach
is the way to sustainable community development but reliant upon adequate
management capacity and effective capacity building at both institutional and
communitylevels.
Theestimatedimpactsonkeyresponsevariablesforminorityhouseholdsareon
balance very positive. The most important results are large and statistically
significant impacts on total income, per‐capita household income, and poverty
status. Results for non‐minority households appearmixed, but impacts on the
most importantmeasures (total income, per‐capita income, andpoverty status),
areneitherlargenorstatisticallysignificant.
School enrollment is critically important to households and their communities.
Enrollment rates of minority children are lower than those of non‐minorities,
especially for upper‐secondary school. However, enrollments improved among
households in treatment and in comparison communes. In all cases but one,
enrollments in treatment communes increased more than in comparison
communes,buttheimpactswerenotstatisticallysignificant.
The analysis shows two important facts. First, treatment communes were
generally worse off than comparison communes in 2007, indicating that the
authorities’ targeting of most needy communes was accurate. Second, even
though they comprise only 31% of the population represented by our sample,
106
non‐minorityhouseholdsaresubstantiallybetter‐offthanminorityhouseholdsin
key respects. The right‐hand panels of Table 5.7 indicate that substantial
disparitiespersistbetweenminoritiesandnon‐minoritiesintotalincome,income
per‐capita,andschoolenrollments.

107
CHAPTER6
CONCLUSIONANDRECOMMENDATION
This report aims to evaluate the effectiveness of P135‐II and to identify its
limitations. The goal is to provide information that can be used to enhance the
designof futuregovernmentprograms.Wereport the impactsofP135‐IIon the
expectedoutcomes of householdwelfare indicators. In particular,we report the
impacts on poverty, income, agricultural production, housing conditions, and
accesstobasicpublicservices.Ouranalysis isbasedonBLS2007andELS2012,
themostcomprehensiveandreliablepaneldatasetfocusingonethnicminorities
whooftenliveunderdifficultconditionsandoftenthatfacethedeepestpovertyin
Vietnam. This data set enabled us to implement the appropriate methods for
measuringtheprogramimpactsandtomeasuretheprogressinpovertyreduction
and gains in socio‐economic status of ethnicminority communities. In addition,
this large well‐designed panel data set provides reliable baseline data for
designingfuturegovernmentpovertyreductionprograms.Basedonouranalysis
usingthispaneldataset,wecameupwiththefollowingmajorfindingsandpolicy
implications.
P135‐II isthefirst largegovernmentprogramthathasadoptedasystematicand
professional evaluation procedure. It meets the highest professional standards,
notonlyforthesakeoftheP135‐II,butalsoasanillustrationofthevalueadded
thatgoodevaluationscanprovide.Itdemonstratesthemethodologythatcouldbe
usedtodrawlessonsforupcominggovernmentprogramsincludingtheNewRural
Development Program and Program 30A. BLS 2007 and ELS 2012 provide rich
andhigh‐qualityinformationthatenablesustoanswermanyimportantquestions
thatwecannotaddressforothergovernmentprograms.
During the implementation of P135‐II, some communes in the treatment groupgraduated from theprogramand some communes from the control groupwerebrought into the treatment group. These reassignments were not part of theoriginal program design and they complicated the impact evaluation task. Wewere compelled to omit communes that had been reassigned; this reduced thesample size, reduced the precision of the estimated impacts, and reduced thepower of the necessary statistical tests. In addition, we found that the budgetallocationsofP135‐IIcommunesandcomparisoncommuneswerenotstatisticallydifferent. While the treatment communes did receive substantially more P135

108
funds than the control communes received, they also received substantially lessnon‐P135 support. This pattern is consistent with the hypothesis ofcompensatoryreallocationofnon‐P135fundsbythelocalauthorities(districtandprovince),whichhasbeenconfirmedbyourrecentstudy.14Thepotential impactof P135‐II depends on the degree to which it enhances resource availability totargetcommunes.Thereallocationnon‐P135fundsfromP135communestonon‐P135communestocompensatethelatterbecausetheywerenotincludedinP135createdamajordifficultyforidentifyingP135impactsandverylikelyresultedinunderestimating the program impacts. The fact that the P135‐II communesactuallydidnotreceivemorefundingthanothercommunesunderminedthegoalsof P135: to reduce the widening gap between P135‐II communes and othercommunes,thegapbetweenpoorandnon‐poorhouseholds,andthegapbetweenethnic minorities and Kinh households. These issues should be addressed andmonitoredinfutureprogramstoensurethatthefundswillbeallocatedtotargetgroups and that it doesnot affect thedecisionsof local authoritieson theotherresourceallocations.
P135‐IIachievedsignificantsuccessinimplementingaparticipatoryapproachto
implementation,withremarkablecorrespondingprogressindecentralization.The
numberofcommune‐ownedprojectsincreasedsubstantiallyfrom21.5%in2006
to46%in2011.Thenumberofprojectshavingtreasuryaccountsisincreasedby
about 10 percentage points. These changes represent large improvements
comparedtothefirstphaseofP135andotherprograms.Beneficiaryhouseholds
participated in every stage of the project including selection, implementation,
supervisionandcontributionstotheoperationandmaintenancefunds.Financial
transparencyalsoimprovedtoacertainextent.Morethan24percentofthelocal
projects undertaken through P135‐II have had their financial statements
publicizedanddistributedtobeneficiaryhouseholds.
Even though progress has been made, the target of 100 percent of communes
becominginvestmentownershasnotbeenachievedandthisisstillconsidereda
highly challenging task given weak management capacity at local levels. In
contracttothetarget,morethan50%ofinfrastructureprojectsaredistrict‐owned
projects,nearly50%ofprojectswereundertakenwithoutpublicbidding,andonly
40% of projects have treasury accounts. Community participation is low and
varies greatly by beneficiary group; ethnic minorities and women’s groups are
14Effectiveness of Targeted Budget Support in Program 135 Phase II‐ An Aid Effectiveness Evaluation Report. Indochina Research and Consulting, 2011.
109
under‐represented.Inaddition,commune‐ownedprojectsstillfaceproblemssuch
as slow funds disbursement and weak capacity among commune officials.
Participation in project supervision and operations and maintenance activities
receive the least attention. The success of the participatory approach requires
tremendous efforts from central and local authorities in engaging local
communities in every project activity. Therefore, local communities need to be
equippedwith sufficient information, knowledge, and understanding to execute
eachactivity.Theseissuesshouldbeconsideredandaddressedindesigningfuture
programs, especially programswhich addressdecentralization andparticipation
ofthecommunity.
The living standards of households in P135‐II improved in every measured
respectforallethnicgroups.Theaveragehouseholdincomeincreasedabout20%,
andthepovertyratedecreasedfrom57.5%to49.2%.Thehousingandsanitation
conditionsalsoimprovedformostethnicgroups.However,povertyremainshigh
and the living standard of the households in these communes is still very low
compared to the national average. The poorer households experienced lower
income growth rates than the better‐off households. Therefore, inequality
increased,withalargeproportionoftheinequalityduetoinequalitywithineach
ethnic group (more than 90%). The poverty gap and severity indexes of
householdsintheProgram135‐IIareasdidnotdecrease,sothelivingstandards
ofthehouseholdsthatremainedpoorarelessimprovedthanothersandthegapis
wideningbetweenpoorandnon‐poorhouseholdsinthesecommunes.
Our results also show thatpoverty reductionat the commune level ispositively
correlated with income growth and that inequality is slightly correlated with
poverty.Moreover,theelasticityofpovertywithrespecttoincomegrowthtends
to decrease overtime, which suggests that income redistribution plays a very
important role in decreasing the poverty gap and alleviating the severity of
poverty. In addition, part of themeasured poverty is transitory: 22.1% of poor
householdsescapedfrompovertyduringourperiodofanalysis,but14.3percent
ofhouseholds that initiallywerenotpoor fell intopoverty.Kinhhouseholdsare
more likely to be transiently poor, while ethnic minority households are more
likely to be persistently poor. This implies that the poverty reduction in these
communesismoredifficulttosustain,partlyduetothehighlevelofdependency
on agricultural income and a low rate of transition from farm to non‐farm
economicactivities.
110
The program significantly improved the living standards of certain beneficiary
householdsinthetargetedcommunes.Whiletheprogramimpactonincomeand
poverty of the Kinh &Hoa ethnic groups is neither large nor statistically
significant, it has large and statistically significant impacts on the income and
povertyratesofethnicminoritygroups.Thus, theprogramsuccessfully targeted
the most disadvantaged groups in the treatment communes. According to the
baseline data, the treatment communes were generally worse off than control
communes in 2007, indicating that targeting the program on the most needy
communes was accurate. In addition, the Kinh & Hoa households were
substantially better‐off than the ethnic minority households in most key
dimensions of living conditions, including income, housing, sanitation, and
education.Educationiscriticallyimportanttohouseholdsandtheircommunities.
Enrollment rates of minority children are lower than those of non‐minorities,
especially for upper‐secondary school. However, enrollments improved among
households in treatment and in comparisoncommunesand inall casesbutone,
enrollments in treatment communes increased more than in comparison
communes,buttheimpactswerenotstatisticallysignificant.
AspointedoutintheBaselineReport,therewasabiggapbetweenthe“baseline”
outcomesandtheP135‐IItargets,whichimpliesabigchallengefortheprogramto
achieve its ambitious targets.15 Our results show that the program only partly
achievedof its targets. Itreducedthepovertyratefrom57.5%to49.2%,though
thetargetratewas30%.Only41%ofhouseholdshaveannualincomepercapita
of over 3.5 million VND, while the target is 70%. Net primary enrollment and
lower secondaryenrollment in the targetedcommunesdid improvebutarestill
far behind the goals (85.4% compared to 95% and 70.9% compared to 75%,
respectively). About 28% of the households reported that they lacked of food
sometimein2012.Inaddition,progresstowardachievementofthetargetsvaries
among different ethnic groups. While sustained improvements in income and
povertywerefoundinTay,Nung,Dao,andH’monggroups,lessimprovementwas
seen among other ethnic groups, especially the Thai. The fact that program
benefitswerenotequallydistributedamongdifferentethnicgroupssuggeststhat
future support to these communes shouldbebetterdesigned to account for the
specificconditions,needs,andcultureofeachethnicgroup.
15Chapter8‐AnalysisoftheP135‐IIBaselineSurvey
111
Thisreportaimstomeasuretheimpactoftheprogramonexpectedoutcomesof
keyvariablesandtheoverallprogresstowardspecifictargets.Disaggregatingthe
impacts, to explain why the program had different impacts on different ethnic
groups and regions requires further study. In addition, analysis of the reasons
somepoorhouseholdsremainpoorinspiteoftheprogramandwhysomeofthe
major targetswerenotachievedrequiresanadditionalstudy.Suchstudieshave
thepotentialtoaddvaluableinformationforbetterdesignoffutureprogramsto
supportsthetargethouseholdsandtheircommunities.

112
REFERENCES
Alderman,H.andHaque,T. (2006) ‘CountercyclicalSafetyNets for thePoorand
Vulnerable’,FoodPolicy31(4):372‐383.
Coleman, B. E. (2002), "Microfinance in Northeast Thailand: Who benefits and
How much?" Asian Development Bank ‐ Economics and Research Department
WorkingPaper9.
Datt, G. and Ravallion, M. (1991), “Growth and Redistribution Components of
Changes in PovertyMeasures: A Decompositionwith Applications to Brazil and
Indiainthe1980s”,LivingStandardMeasurementStudy,WorkingPaperNo.83.
Deaton Angus (1997), “The Analysis of Household Surveys”, the Johns Hopkins
UniversityPress,Baltimore,Maryland,U.S.A.
Farrington, J. and Slater, R. (2006) ‘Introduction: Cash Transfers: Panacea forPovertyReductionorMoneyDowntheDrain?’,DevelopmentPolicyReview24(5):499–511
Farrington, J. and Slater, R. (2006) ‘Introduction: Cash Transfers: Panacea for
PovertyReductionorMoneyDowntheDrain?’,DevelopmentPolicyReview24(5):
499–511
Finan, F., Sadoulet E., De Janvry A., 2005. Measuring the poverty reduction
potentialoflandinruralMexico.JournalofDevelopmentEconomics77:27–51.
Foster, J., J. Greer, E. Thorbecke (1984), “A Class of Decomposable Poverty
Measures”,Econometrica,52,761‐765.
Haughton Jonathan, Shahidur R. Khandker (2009), Handbook on Poverty and
Inequality,TheWorldBank,1818HStreet,NW,Washington,DC,theUSA.
Hulme, D., and Shepherd, A. (2003), “Conceptualizing Chronic Poverty”,World
Development,Vol.31,No3.
Jalan, J., and Ravallion,M. (2000), “Is Transient Poverty Different? Evidence for
RuralChina”,JournalofDevelopmentStudies(SpecialIssue)(August).

113
LagardeM,HainesA,PalmerN(2009),“Theimpactofconditionalcashtransfers
onhealthoutcomesanduseofhealthservicesinlowandmiddleincomecountries
(Review)”,TheCochraneCollaboration.PublishedbyJohnWiley&Sons,Ltd.
Lanjouw,J.O.andP.Lanjouw.1995.Ruralnonfarmemployment:Asurvey.Policy
ResearchWorkingPaper,1463.TheWorldBank.
Lanjouw,P.1998.Ecuador’sruralnonfarmsectorasarouteoutofpoverty.Policy
ResearchWorkingPaper,1094.TheWorldBank.
Lipton,M.1985.Landassetsandruralpoverty.WorldBankStaffWorkingPapers,
No.744.
Lloyd‐Sherlock, P. (2006) ‘Simple Transfers, ComplexOutcomes: The Impacts ofPensionsonPoorHouseholdsinBrazil’,DevelopmentandChange37(5):969‐995.
M. H. Quach and a. W. Mullineux (2007), “The Impact of Access to Credit on
Household Welfare oin Rural Vietnam”, Research In Accounting In Emerging
EconomiesVol.7,pp:279–307.
Morduch, J. (1995),"IncomeSmoothingandConsumptionSmoothing", Journalof
EconomicPerspectives9(3):103‐14.
Nguyen,V.C. (2008),“IsaGovernmentalMicrocreditProgramforthePoorreally
Pro‐poor? Evidence fromVietnam”,TheDevelopingEconomies 46 (2), pp: 151 –
187.
Pham, T., and Lensink, R. (2008), “IsMicrofinance an Important Instrument for
Poverty Alleviation? The Impact of Microcredit Programs on Self‐employment
Profits in Vietnam”, The Faculty of Economics and Business, University of
Groningen,TheNetherlands.
Pham.H., Le.T,NguyenC. (2011), “Povertyof theEthnicMinorities inVietnam:
SituationandChallengesfromtheP135‐IICommunes”,Researchreport forState
Committee for Ethnic Minority Affairs of Vietnam and United Nations
DevelopmentProgram,Hanoi,Vietnam.
114
Pitt,M.,andKhandker,S.(1998),"TheImpactofGroup‐BasedCreditProgramson
PoorHouseholdsinBangladesh:DoestheGenderofParticipantsMatter?",Journal
ofPoliticalEconomy106(5):958‐995.
RubenRandM.vandenBerg.2001.Nonfarmemploymentandpovertyalleviation
ofruralfarmhouseholdsinHonduras.WorldDevelopment29(3):549‐560.
UND(2006),HumanDevelopmentReport2006.
WHO (2004), Meeting the MDG Drinking Water and Sanitation: A Mid‐ Term
AssessmentofProgress.Geneva:WHO,ISBN9241562781.
WooldridgeJ.M.(2001).EconometricAnalysisofCrossSectionandPanelData.The
MITPress,Cambridge,MassachusettsLondon,England.
WorldBank (2012), “WellBegun,NotYetDone:Vietnam'sRemarkableProgress
onPovertyReductionandtheEmergingChallenges”,TheWorkBank.
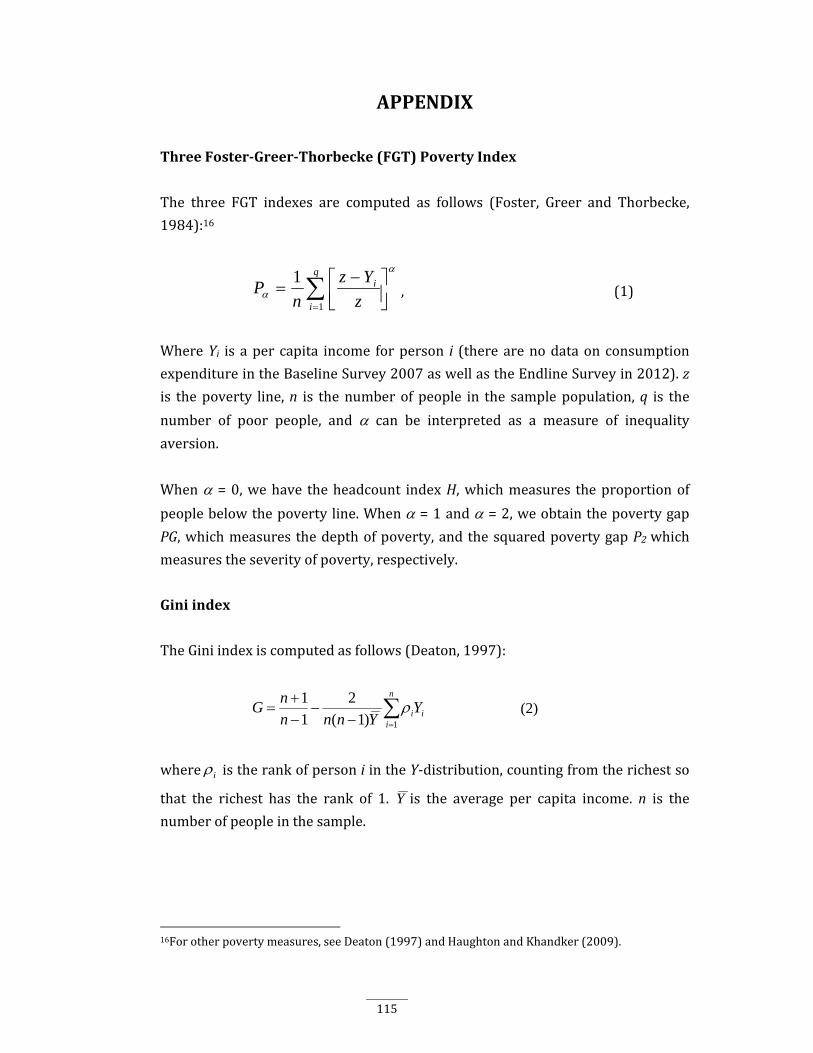
115
APPENDIX
ThreeFoster‐Greer‐Thorbecke(FGT)PovertyIndex
The three FGT indexes are computed as follows (Foster, Greer and Thorbecke,
1984):16
q
i
i
z
Yz
nP
1
1
, (1)
WhereYi is aper capita income forperson i (therearenodataonconsumption
expenditureintheBaselineSurvey2007aswellastheEndlineSurveyin2012).z
is thepoverty line,n is thenumberofpeople in the samplepopulation,q is the
number of poor people, and can be interpreted as a measure of inequalityaversion.
When =0,wehave theheadcount indexH,whichmeasures theproportionofpeoplebelowthepovertyline.When=1and=2,weobtainthepovertygapPG,whichmeasuresthedepthofpoverty,andthesquaredpovertygapP2which
measurestheseverityofpoverty,respectively.
Giniindex
TheGiniindexiscomputedasfollows(Deaton,1997):
n
iiiYYnnn
nG
1)1(
2
1
1 (2)
where i istherankofpersoniintheY‐distribution,countingfromtherichestso
that the richest has the rank of 1. Y is the average per capita income. n is the
numberofpeopleinthesample.
16Forotherpovertymeasures,seeDeaton(1997)andHaughtonandKhandker(2009).
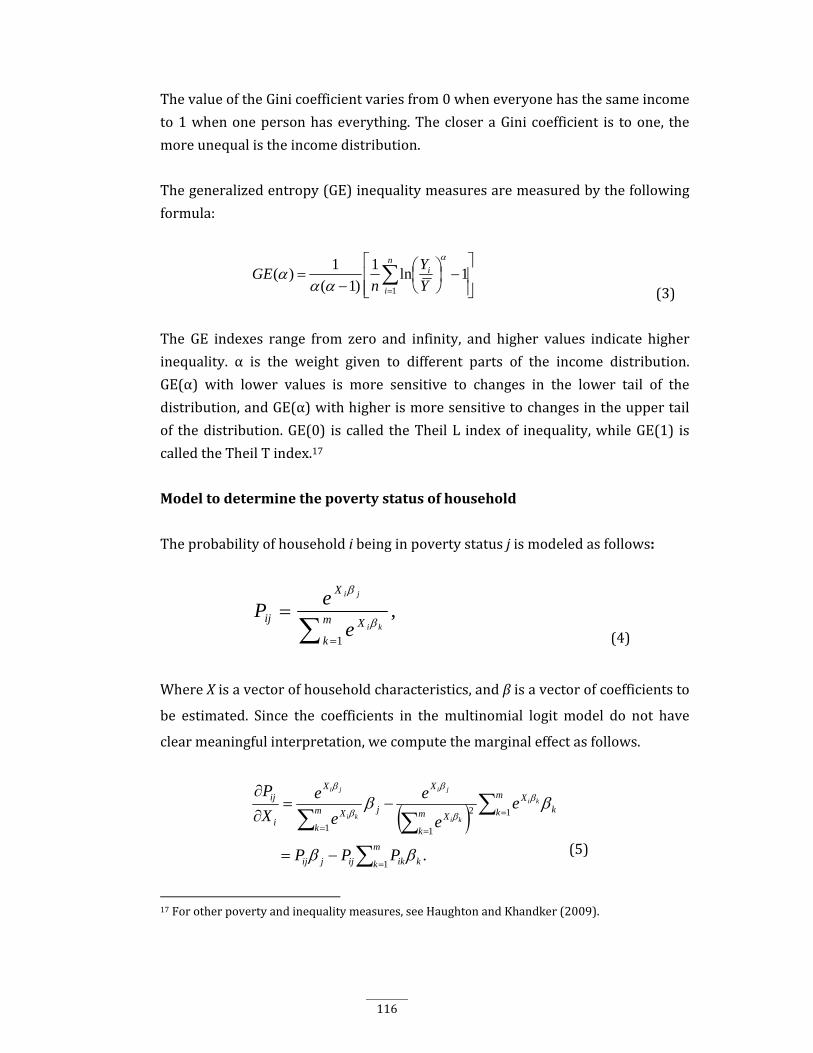
116
ThevalueoftheGinicoefficientvariesfrom0wheneveryonehasthesameincome
to1whenonepersonhaseverything.ThecloseraGinicoefficient is toone, the
moreunequalistheincomedistribution.
Thegeneralizedentropy(GE)inequalitymeasuresaremeasuredbythefollowing
formula:
1ln1
)1(
1)(
1
n
i
i
Y
Y
nGE
(3)
The GE indexes range from zero and infinity, and higher values indicate higher
inequality. α is the weight given to different parts of the income distribution.
GE(α) with lower values is more sensitive to changes in the lower tail of the
distribution,andGE(α)withhigherismoresensitivetochangesintheuppertail
of thedistribution.GE(0) is called theTheilL indexof inequality,whileGE(1) is
calledtheTheilTindex.17
Modeltodeterminethepovertystatusofhousehold
Theprobabilityofhouseholdibeinginpovertystatusjismodeledasfollows:
,1
m
k
X
X
ijki
ji
e
eP
(4)
WhereXisavectorofhouseholdcharacteristics,andβisavectorofcoefficientsto
be estimated. Since the coefficients in themultinomial logit model do not have
clearmeaningfulinterpretation,wecomputethemarginaleffectasfollows.
.
1
12
11
m
k kikijjij
k
m
k
X
m
k
X
X
jm
k
X
X
i
ij
PPP
ee
e
e
e
X
Pki
ki
ji
ki
ji
(5)
17Forotherpovertyandinequalitymeasures,seeHaughtonandKhandker(2009).
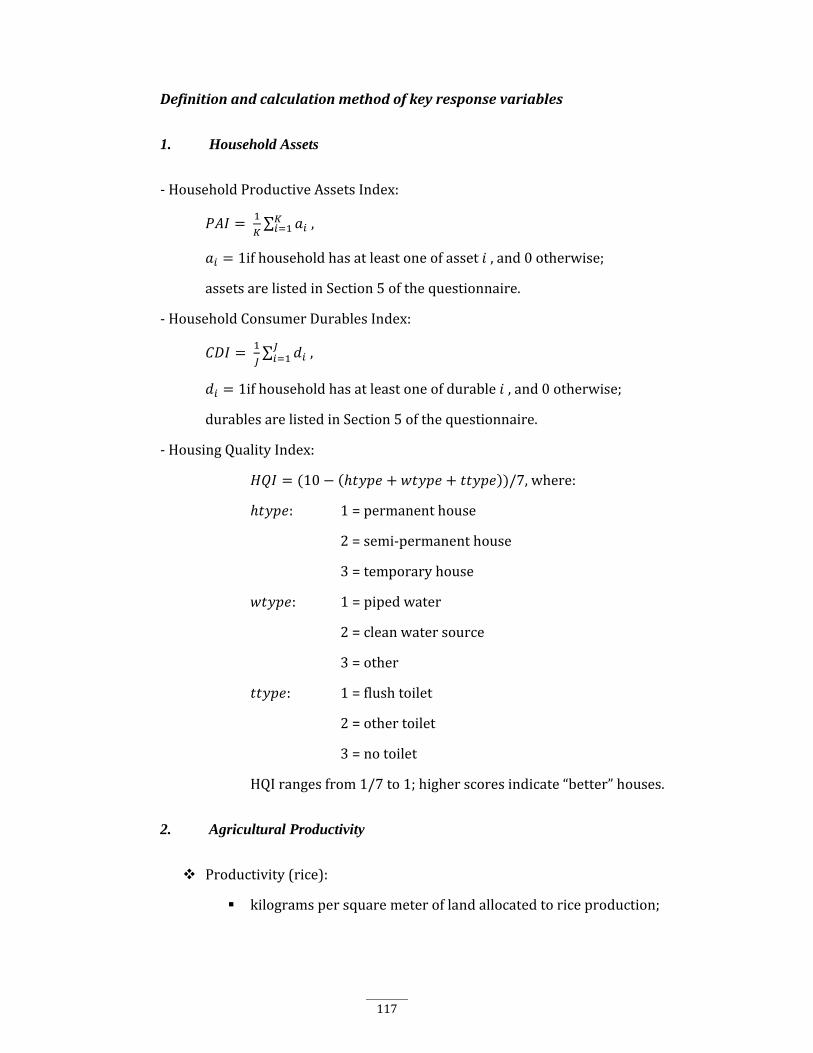
117
Definitionandcalculationmethodofkeyresponsevariables
1. Household Assets
‐HouseholdProductiveAssetsIndex:
∑ ,
1ifhouseholdhasatleastoneofasset ,and0otherwise;
assetsarelistedinSection5ofthequestionnaire.
‐HouseholdConsumerDurablesIndex:
∑ ,
1ifhouseholdhasatleastoneofdurable ,and0otherwise;
durablesarelistedinSection5ofthequestionnaire.
‐HousingQualityIndex:
10 /7,where:
: 1=permanenthouse
2=semi‐permanenthouse
3=temporaryhouse
: 1=pipedwater
2=cleanwatersource
3=other
: 1=flushtoilet
2=othertoilet
3=notoilet
HQIrangesfrom1/7to1;higherscoresindicate“better”houses.
2. Agricultural Productivity
Productivity(rice):
kilogramspersquaremeteroflandallocatedtoriceproduction;
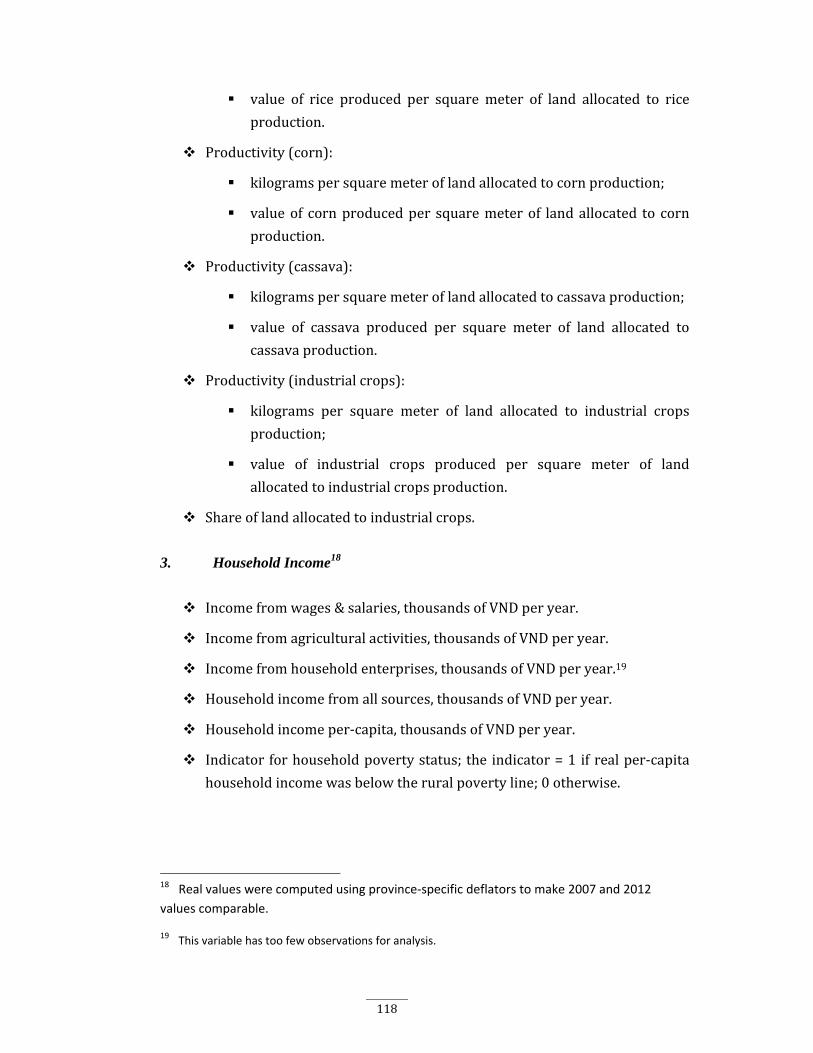
118
value of rice produced per square meter of land allocated to rice
production.
Productivity(corn):
kilogramspersquaremeteroflandallocatedtocornproduction;
valueof cornproducedper squaremeterof landallocated to corn
production.
Productivity(cassava):
kilogramspersquaremeteroflandallocatedtocassavaproduction;
value of cassava produced per square meter of land allocated to
cassavaproduction.
Productivity(industrialcrops):
kilograms per square meter of land allocated to industrial crops
production;
value of industrial crops produced per square meter of land
allocatedtoindustrialcropsproduction.
Shareoflandallocatedtoindustrialcrops.
3. Household Income18
Incomefromwages&salaries,thousandsofVNDperyear.
Incomefromagriculturalactivities,thousandsofVNDperyear.
Incomefromhouseholdenterprises,thousandsofVNDperyear.19
Householdincomefromallsources,thousandsofVNDperyear.
Householdincomeper‐capita,thousandsofVNDperyear.
Indicatorforhouseholdpovertystatus;the indicator=1 ifrealper‐capita
householdincomewasbelowtheruralpovertyline;0otherwise.
18 Real values were computed using province‐specific deflators to make 2007 and 2012
values comparable.
19 This variable has too few observations for analysis.

119
4. Other Indicators
Primary school enrollment rate: the proportion of household’s primary‐
agedchildrenenrolledinschool.
Lower secondary school enrollment rate: the proportion of household’s
lowersecondary‐agedchildrenenrolledinschool.
Upper secondary school enrollment rate: the proportion of household’s
uppersecondary‐agedchildrenenrolledinschool.
Traveltimestoschools.20
Traveltimestohealthfacilities:weightedaverageoftraveltimestovarious
facilities,withweightsproportionaltothenumbersofvisitsbyhousehold
memberstoeachtypeoffacility.
20 These variables had insufficient numbers of observations for analysis.