of pike floodplain using cmrset data · it results in evapoconcentration of salts in the...
TRANSCRIPT

Evapotranspiration Study of Pike Floodplain Using CMRSET Data
DEWNR Technical note 2016/10

Evapotranspiration Study of Pike Floodplain
Using CMRSET Data
Cameron Wood, Ben Plush and Virginia Riches
Department of Environment, Water and Natural Resources
March, 2016
DEWNR Technical note 2016/10

DEWNR Technical note 2016/10 i
Department of Environment, Water and Natural Resources
GPO Box 1047, Adelaide SA 5001
Telephone National (08) 8463 6946
International +61 8 8463 6946
Fax National (08) 8463 6999
International +61 8 8463 6999
Website www.environment.sa.gov.au
Disclaimer
The Department of Environment, Water and Natural Resources and its employees do not warrant or make any representation
regarding the use, or results of the use, of the information contained herein as regards to its correctness, accuracy, reliability,
currency or otherwise. The Department of Environment, Water and Natural Resources and its employees expressly disclaims all
liability or responsibility to any person using the information or advice. Information contained in this document is correct at the
time of writing.
This work is licensed under the Creative Commons Attribution 4.0 International License.
To view a copy of this license, visit http://creativecommons.org/licenses/by/4.0/.
© Crown in right of the State of South Australia, through the Department of Environment, Water and Natural Resources 2016
ISBN 978-1-925369-60-1
Preferred way to cite this publication
Wood C, Plush B and Riches V, 2016, Evapotranspiration Study of Pike Floodplain Using CMRSET Data, DEWNR Technical note
2016/10, Government of South Australia, through the Department of Environment, Water and Natural Resources, Adelaide
Download this document at: http://www.waterconnect.sa.gov.au

DEWNR Technical note 2016/10 ii
Acknowledgements
Juliette Woods and Graham Green (DEWNR) provided useful discussion, comments and input to this project at various stages.
Juliette Woods is thanked for providing final peer review. Colin Cichon (DEWNR) is thanked for copy editing.
David Thompson (DEWNR) sourced the CMRSET data used in this report, as well as MODIS derived NDVI data for supporting
information. David also provided much useful advice on analysis methods in the early parts of this project. Tanya Doody
(CSIRO) is thanked for making the CMRSET data available.
Carl Purczel (DEWNR) provided outputs from the Pike groundwater model while still under development, and providing useful
discussion on the trends that emerged form CMRSET data during this project.
Ian Schneider (DEWNR) assisted in the field accessing parts of Pike floodplain while looking for potential weather station
locations, and for help installing the weather stations.
Jeremy Nelson (DEWNR/Natural Resources SA Murray-Darling Basin) provided useful discussion on the SAMDB weather station
network, and for his help installing two weather stations on Pike floodplain.
Roger Cranswick is thanked for assisting with Figure editing and report editing.

DEWNR Technical note 2016/10 iii
Contents
Acknowledgements ii
Contents iii
Summary 1
1 Introduction 2
1.1 Background 2
1.2 Aims and objectives 4
1.3 Definitions 4
2 Data sources and analysis approach 7
2.1 Weather station data 7
2.2 CMRSET AET 7
2.3 Analysis approach 7
3 Results 10
3.1 Climate 10
3.2 Spatial trends in floodplain AET (CMRSET) 10
3.3 Temporal trends in floodplain AET (CMRSET) 13
3.4 Development of ET zones 16
3.5 Comparison of CMRSET AET with other data 19
3.5.1 CMRSET based groundwater ET (AET minus rainfall) 19
3.5.2 Prior estimates of groundwater ET 20
3.5.3 Vegetation distribution 20
3.5.4 Weather station data 21
4 Weather station installation 24
4.1 Site selection 24
5 Conclusions and recommendations 26
5.1 Conclusions 26
5.2 Recommendations 26
6 References 28

DEWNR Technical note 2016/10 iv
List of figures
Figure 1. Pike Floodplain 3
Figure 2. Conceptual model of the hydrogeology of Pike floodplain (Peat et al. 2010) 4
Figure 3. Conceptual model of groundwater evapotranspiration 5
Figure 4. Location of weather stations in the study area 9
Figure 5. Average monthly rainfall, pan evaporation and potential evapotranspiration 10
Figure 6. Average summer (December – February) evapotranspiration on the Pike floodplain, 2001–12 11
Figure 7. Average winter (June – August) evapotranspiration on the Pike floodplain, 2001–12 12
Figure 8. Average seasonal (A) summer and (B) winter AET – both showing zones of higher AET in the vicinity of
Tanyacka Creek and in the mid Pike River on the eastern margin of the floodplain 13
Figure 9. Time series of CMRSET derived evapotranspiration at four locations on the Pike floodplain 15
Figure 10. Annual rainfall at Renmark for the period of CMRSET data available 16
Figure 11. ET zones derived from CMRSET 17
Figure 12. ET zones and monthly CMRSET AET data for three summer months 18
Figure 13. Time series of CMRSET derived groundwater ET (total ET minus rainfall at a ‘low ET’ site (see Figure 9 for
locations) 19
Figure 14. Time series of CMRSET derived groundwater ET (total ET minus rainfall) at a ‘high ET’ site (see Figure 9 for
locations) 20
Figure 15. ET zones and vegetation distribution on Pike floodplain 21
Figure 16. Location of the Yamba, Lyrup Flats and Bookpurnong weather stations operated by Natural Resources SA
Murray-Darling Basin 22
Figure 17. Weather station derived potential ET and CMRSET derived actual ET for three irrigated locations near the Pike
floodplain 23
Figure 18. Difference (each month) between CMRSET derived actual ET and weather station (short crop reference)
potential ET 23
Figure 19. Location of weather stations installed on Pike floodplain 24
Figure 20. Weather station sites 1 and 2 on Pike floodplain (photos taken 10 December 2015) 25
List of tables
Table 1. Evapotranspiration terminology used in this report 6

DEWNR Technical note 2016/10 1
Summary
Evapotranspiration (ET) is a critical process in the floodplains of the SA River Murray. It results in evapoconcentration of salts in
the groundwater and soil, impacting the health of vegetation. It also controls the watertable height and hence the interaction
between the surface water and groundwater, influencing (i) the location and extent of freshwater lenses and (ii) the flux of
saline groundwater to the river and its anabranches. It has been estimated to be the single largest component of the
groundwater balance for both Pike Floodplain and Katarapko Floodplain (Woods et al., 2014). Yet despite its importance to
floodplain ecological health and in-river salinity, ET data for the SA floodplains has been scarce. Potential ET is estimated at
weather stations but actual ET (AET) has been measured only a few studies (O’Grady et al., 2009).
This study provides a concise investigation of a newly-available and extensive AET dataset. This is the satellite-derived
estimates of AET developed by CSIRO, as part of a national data set, the CSIRO MODIS reflectance based scaling
evapotranspiration (CMRSET) data set (Guerschman et al. 2009). The investigation focuses on the Pike floodplain, and was
largely performed by analysing monthly CMRSET estimates of AET for the period 2000-2012.
The satellite dataset is an estimate of AET from all sources, including surface water, the unsaturated zone, and groundwater.
The data are analysed to provide insight regarding AET specifically from groundwater.
The main findings of this study are:
Clear patterns of high and low AET are apparent across the Pike floodplain. These patterns can be observed monthly,
seasonally, and across a range of climate conditions (during drought years as well as above average rainfall years).
Analysis of seasonal trends and patterns in floodplain AET led to delineation of ET zones for the Pike floodplain.
Patterns of high and low AET show some relationship with vegetation type (e.g. higher AET in the riparian zone where
river red gums are present) however there is not a clear correlation between spatial variation in vegetation and AET
across the entire floodplain.
The difference in temporal trends for high and low AET zones suggests groundwater (specifically depth to
groundwater) is an important factor influencing ET trends, by providing a consistent source of water for ET in some
locations during drought years.
As part of this project, two weather stations were installed on Pike floodplain to measure potential ET (PET). However due to
time constraints, no data was reported back. It is recommended that ongoing measurement of weather data at these sites be
carried out. Further recommendations have been made in Chapter 5 of this report.
This study has greatly improved our understanding of ET on Pike floodplain, and more broadly how floodplain ET may vary
spatially and temporally (and what it varies in response to). This new knowledge has been incorporated into the Pike
Groundwater model (Purczel et al., 2016) and will inform the way we model floodplain processes in future, thus feeding into
the decision support process.

DEWNR Technical note 2016/10 2
1 Introduction
1.1 Background
The South Australian Riverland Floodplains Integrated Infrastructure Program (SARFIIP) is a large-scale infrastructure project to
enable floodplain inundation for the South Australian Riverland region between the border and Lock 1 with particular focus on
the Pike and Katarapko floodplains. SARFIIP aims to improve the condition of salinity-affected floodplains and promote the
health of floodplain vegetation along the River Murray in South Australia. SARFIIP involves the construction and operation of
new infrastructure to deliver water to these floodplains in order to supplement and enhance natural flooding, while minimising
the salinity risk to the River Murray and its floodplain.
SARFIIP is being delivered for the Australian Government’s Murray Darling Basin Authority (MDBA) by the River Murray
Operations and Major Projects (RMOMP) Branch of the Department of Environment, Water and Natural Resources (DEWNR), in
partnership with the Science, Monitoring and Knowledge (SMK) Branch and Natural Resources SA Murray-Darling Basin
Management Board (NRSAMDB). SMK will support RMOMP through the delivery of scientific and technical services to assist
with the assessment of floodplain and salinity management options, including data management, field investigations and
modelling. Collectively these tasks are referred to as the SARFIIP Science Program.
The initial focus of the SARFIIP project is the Pike Floodplain, approximately 5 km south-east of Renmark (Figure 1). One of the
key components of the project is development of a groundwater flow and solute transport model of the Pike Floodplain
(Purczel et al., 2016). The model will be used to test a number of management scenarios in terms of floodplain manipulation,
which will help inform project decisions.
The hydrogeology of Pike floodplain is extensively described in Woods et al. (2014). Figure 2 provides a conceptual model,
identifying the relevant aquifer units. Across the Pike Floodplain, groundwater is generally shallow and evapotranspiration (ET)
is thought to be a significant component of the groundwater balance (Woods et al., 2014). ET results in evapoconcentration of
salts in the groundwater and soil, impacting the health of vegetation. It also controls the watertable height and hence the
interaction between the surface water and groundwater, influencing (i) the location and extent of freshwater lenses and (ii) the
flux of saline groundwater to the river and its anabranches. However, despite its importance to the floodplain, little is known
about evapotranspiration on Pike Floodplain.
Until recently, the main source of information of ET on the River Murray floodplain were studies of uptake by red gums and
black box (summarised in O’Grady et al. (2009)). These studies had limited spatial and temporal extents. However, the ‘CSIRO
MODIS reflectance based scaling evapotranspiration’ (CMRSET) dataset has recently become available. This is derived from
satellite data and has greater spatial and temporal extent than was possible with tree-based studies.
Gonzalez (2015) conducted a preliminary study of ET on the Pike Floodplain and surrounding areas using the CMRSET data.
Mean annual actual ET estimates were used to investigate whether actual ET correlated with soil, vegetation and/or watertable
depth (where watertable depth was based on modelled groundwater level). No clear relationships between mean annual AET
and vegetation, soil or watertable depth were observed in the study. However Gonzalez made a number of key
recommendations for further analysis of AET and validation of CMRSET in the region, including:
Comparison between CMRSET data and weather station data from the South Australian Murray Darling Basin
(SAMDB) weather station network.
Analysis of CMRSET data at a finer temporal resolution (i.e. monthly).
Analysis of monthly and seasonal averages over both dry years (e.g. 2006) and wet years (e.g. 2010).
Comparison between CMRSET data and AET derived from the Calperum flux tower located in mallee vegetation
20 km north of Renmark.
This study undertakes some of these recommendations, in order to support the development of the SARFIIP Pike Floodplain
groundwater model. Understanding groundwater AET should improve the design and calibration of groundwater models of
River Murray floodplains.

DEWNR Technical note 2016/10 3
Figure 1. Pike Floodplain

DEWNR Technical note 2016/10 4
Figure 2. Conceptual model of the hydrogeology of Pike floodplain (Peat et al. 2010)
1.2 Aims and objectives
The aim of this project is to improve understanding of the spatial and temporal variability in actual evapotranspiration (AET)
from the Pike Floodplain. Specifically the project objectives are to:
Obtain the CMRSET monthly data for the Pike Floodplain area.
Analyse the data to develop representative ET zones on the Pike Floodplain.
Compare CMRSET AET values with other relevant data sets, including vegetation distribution and existing estimates of
vegetation water use, and weather station data.
Purchase and install two weather stations on the Pike Floodplain for ongoing monitoring of potential
evapotranspiration.
The CMRSET dataset is an estimate of AET from all sources, including surface water, the unsaturated zone, and groundwater.
The data are analysed to provide insight regarding AET specifically from groundwater.
The study is intended as an early step at improving understanding of ET on the Pike Floodplain. Further work is recommended
as an outcome of this study.
1.3 Definitions
Evaporation refers to the direct conversion of liquid water to water vapour, while transpiration is the vapourisation (and
subsequent loss to the atmosphere) of liquid water contained in plant tissue (Allen et al., 1998). Evapotranspiration (ET) refers
to these combined processes. ET can draw from surface water, the unsaturated zone, and groundwater.
DEWNR Technical note 2016/10 5
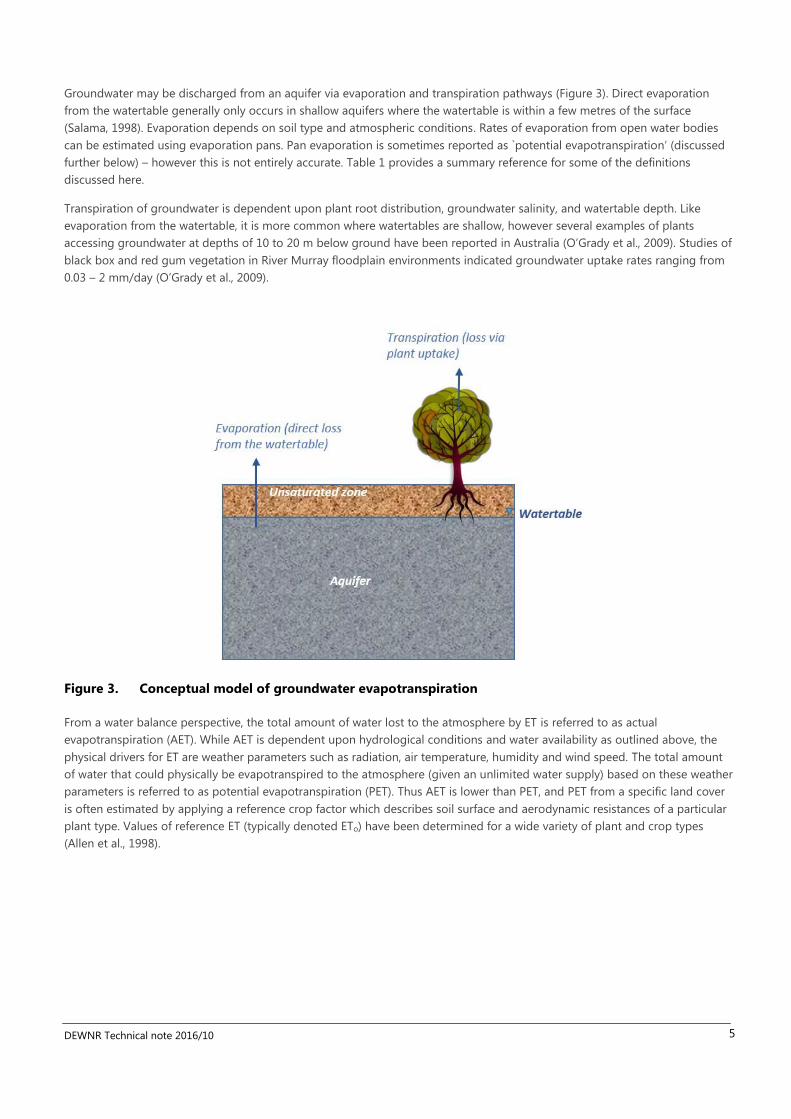
Groundwater may be discharged from an aquifer via evaporation and transpiration pathways (Figure 3). Direct evaporation
from the watertable generally only occurs in shallow aquifers where the watertable is within a few metres of the surface
(Salama, 1998). Evaporation depends on soil type and atmospheric conditions. Rates of evaporation from open water bodies
can be estimated using evaporation pans. Pan evaporation is sometimes reported as `potential evapotranspiration’ (discussed
further below) – however this is not entirely accurate. Table 1 provides a summary reference for some of the definitions
discussed here.
Transpiration of groundwater is dependent upon plant root distribution, groundwater salinity, and watertable depth. Like
evaporation from the watertable, it is more common where watertables are shallow, however several examples of plants
accessing groundwater at depths of 10 to 20 m below ground have been reported in Australia (O’Grady et al., 2009). Studies of
black box and red gum vegetation in River Murray floodplain environments indicated groundwater uptake rates ranging from
0.03 – 2 mm/day (O’Grady et al., 2009).
Figure 3. Conceptual model of groundwater evapotranspiration
From a water balance perspective, the total amount of water lost to the atmosphere by ET is referred to as actual
evapotranspiration (AET). While AET is dependent upon hydrological conditions and water availability as outlined above, the
physical drivers for ET are weather parameters such as radiation, air temperature, humidity and wind speed. The total amount
of water that could physically be evapotranspired to the atmosphere (given an unlimited water supply) based on these weather
parameters is referred to as potential evapotranspiration (PET). Thus AET is lower than PET, and PET from a specific land cover
is often estimated by applying a reference crop factor which describes soil surface and aerodynamic resistances of a particular
plant type. Values of reference ET (typically denoted ETo) have been determined for a wide variety of plant and crop types
(Allen et al., 1998).
DEWNR Technical note 2016/10 6
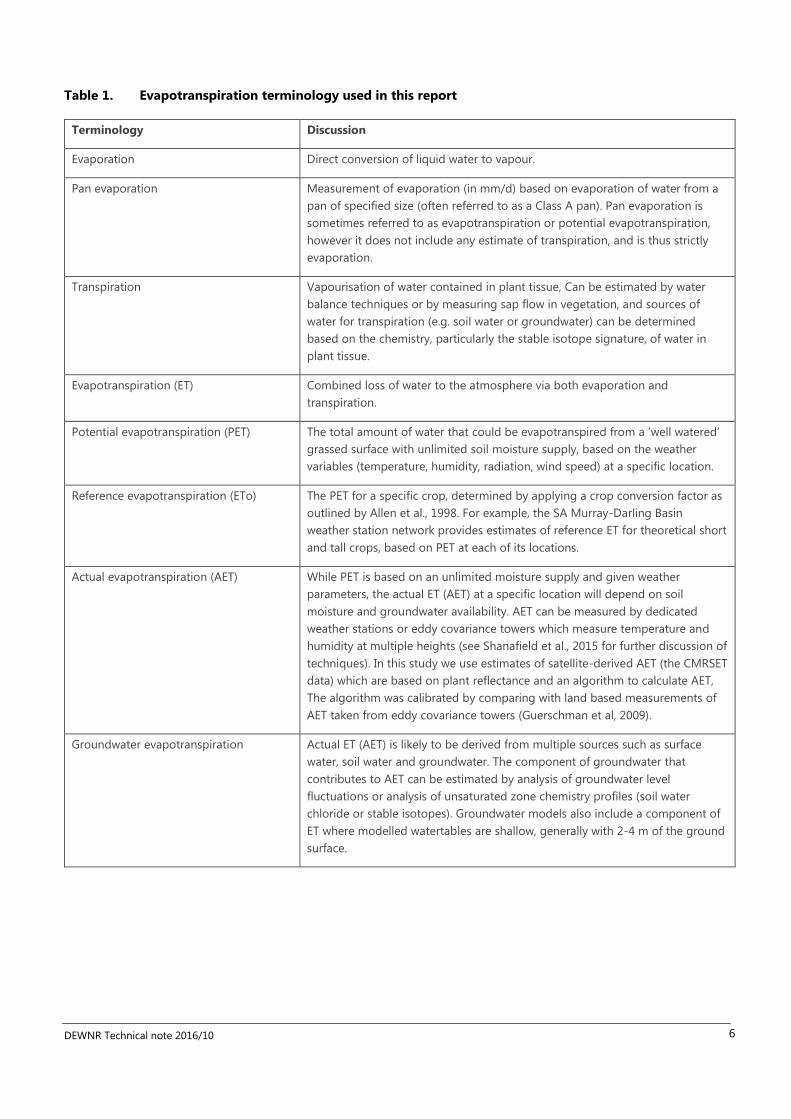
Table 1. Evapotranspiration terminology used in this report
Terminology Discussion
Evaporation Direct conversion of liquid water to vapour.
Pan evaporation Measurement of evaporation (in mm/d) based on evaporation of water from a
pan of specified size (often referred to as a Class A pan). Pan evaporation is
sometimes referred to as evapotranspiration or potential evapotranspiration,
however it does not include any estimate of transpiration, and is thus strictly
evaporation.
Transpiration Vapourisation of water contained in plant tissue, Can be estimated by water
balance techniques or by measuring sap flow in vegetation, and sources of
water for transpiration (e.g. soil water or groundwater) can be determined
based on the chemistry, particularly the stable isotope signature, of water in
plant tissue.
Evapotranspiration (ET) Combined loss of water to the atmosphere via both evaporation and
transpiration.
Potential evapotranspiration (PET) The total amount of water that could be evapotranspired from a ‘well watered’
grassed surface with unlimited soil moisture supply, based on the weather
variables (temperature, humidity, radiation, wind speed) at a specific location.
Reference evapotranspiration (ETo) The PET for a specific crop, determined by applying a crop conversion factor as
outlined by Allen et al., 1998. For example, the SA Murray-Darling Basin
weather station network provides estimates of reference ET for theoretical short
and tall crops, based on PET at each of its locations.
Actual evapotranspiration (AET) While PET is based on an unlimited moisture supply and given weather
parameters, the actual ET (AET) at a specific location will depend on soil
moisture and groundwater availability. AET can be measured by dedicated
weather stations or eddy covariance towers which measure temperature and
humidity at multiple heights (see Shanafield et al., 2015 for further discussion of
techniques). In this study we use estimates of satellite-derived AET (the CMRSET
data) which are based on plant reflectance and an algorithm to calculate AET,
The algorithm was calibrated by comparing with land based measurements of
AET taken from eddy covariance towers (Guerschman et al, 2009).
Groundwater evapotranspiration Actual ET (AET) is likely to be derived from multiple sources such as surface
water, soil water and groundwater. The component of groundwater that
contributes to AET can be estimated by analysis of groundwater level
fluctuations or analysis of unsaturated zone chemistry profiles (soil water
chloride or stable isotopes). Groundwater models also include a component of
ET where modelled watertables are shallow, generally with 2-4 m of the ground
surface.
DEWNR Technical note 2016/10 7
2 Data sources and analysis approach
Existing ET data sources were compiled for the Pike Floodplain and surrounds. These consisted of weather station data and
CRMSET data. The data sources were then analysed and compared.
The LANDSAT Data Cube is another possible source of information. It provides satellite imagery at high resolution (25 m x
25 m) but at this point in time it has not been processed to provide AET.
2.1 Weather station data
Figure 4 provides the location of weather stations close to Pike Floodplain. At the start of the project there were no weather
stations on the Pike floodplain, however there are several weather stations located in nearby highland irrigation areas. The
Bureau of Meteorology maintains weather stations at Paringa Lock 5 (station 024037) and Loxton Irrigation Centre (station
024024). Natural Resources South Australian Murray-Darling Basin (SAMDB) also operate a network of weather stations across
the SAMDB region and report the data online (NRSAMDB, 2015). The closest SAMDB weather station to the Pike floodplain is
located at Yamba. These weather stations make agro-meteorological measurements (temperature, humidity, windspeed,
radiation and soil temperature) and use an abridged Penman-Monteith equation to calculate reference ET for ‘short’ and ‘tall’
crops (Jeremy Nelson, pers comm., August 2015).
2.2 CMRSET AET
The ‘CSIRO MODIS reflectance based scaling evapotranspiration’ (CMRSET) data set was developed by Guerschman et al.,
(2009). In brief, the CMRSET algorithm uses reflectance data from the MODIS satellite to calculate ET across the Australian
continent. Actual ET (AET) is calculated from potential ET (PET) by applying a ‘crop factor’ which incorporates the enhanced
vegetation index (EVI) and global vegetation moisture index (GVMI). The algorithm was calibrated by comparing estimated AET
with measured AET from seven eddy covariance towers around Australia covering a variety of landscapes (forest, savannah,
grassland, floodplain and lake). CMRSET was further validated by comparing estimated AET with ‘surrogate AET’ (precipitation
minus streamflow) in 227 unimpaired catchments around Australia.
CMRSET was originally generated for a 1 km x 1 km grid cell extent for the entire Australian continent on 16 day intervals. It has
since been regenerated for a 250 m cell size. In this study, monthly 250 m x 250 m data for the period February 2000 – June
2012 was obtained. The flux towers used to calibrate the CMRSET algorithm are located in eastern and northern Australia, and
at the time of the original study there were no towers in the South Australian Murray Darling Basin area. Also, as the River
Murray in South Australia is heavily regulated, it was not considered to be an `unimpaired catchment’ (Peel et al., 2000) and
hence not included in the CMRSET validation process. Thus the CMRSET data set has not explicitly been validated for the area
of interest in this study.
2.3 Analysis approach
The analysis considers: climate observations from weather stations, spatial trends in CMRSET AET, and temporal trends in
CMRSET AET. ET zones are then developed for Pike Floodplain. The CMRSET data is also compared with other data sources,
including the weather station data. A direct correlation between weather station-derived reference ET and CMRSET-derived
actual ET is not expected. Reference ET is essentially an expression of potential ET, but for a specific plant or crop type. Thus
the reference ET is expected to exceed actual ET. However the aim of the comparison is to correlate periods of high/low ET and
thus validate the trends observed in the CMRSET data.
Analysis of the data was performed in ArcGIS version 10. The data was clipped to the spatial extent of the floodplain and areas
of irrigation shown in land use maps (which show consistently high evapotranspiration in summer) were removed. Following
the recommendations of Gonzalez (2015), analysis of seasonal averages was performed by grouping summer months
(December to February) and winter months (June to August) for the years of data availability. These average datasets were

DEWNR Technical note 2016/10 8
created using the “Raster Calculator” tool. Various combinations of seasonal averages were compared to each other, as well as
differences between summer and winter averages. Qualitative spatial comparisons between were made between seasonal
averages of CMRSET data and vegetation and soil data, as well as groundwater model ET.

DEWNR Technical note 2016/10 9
Figure 4. Location of weather stations in the study area
DEWNR Technical note 2016/10 10
3 Results
3.1 Climate
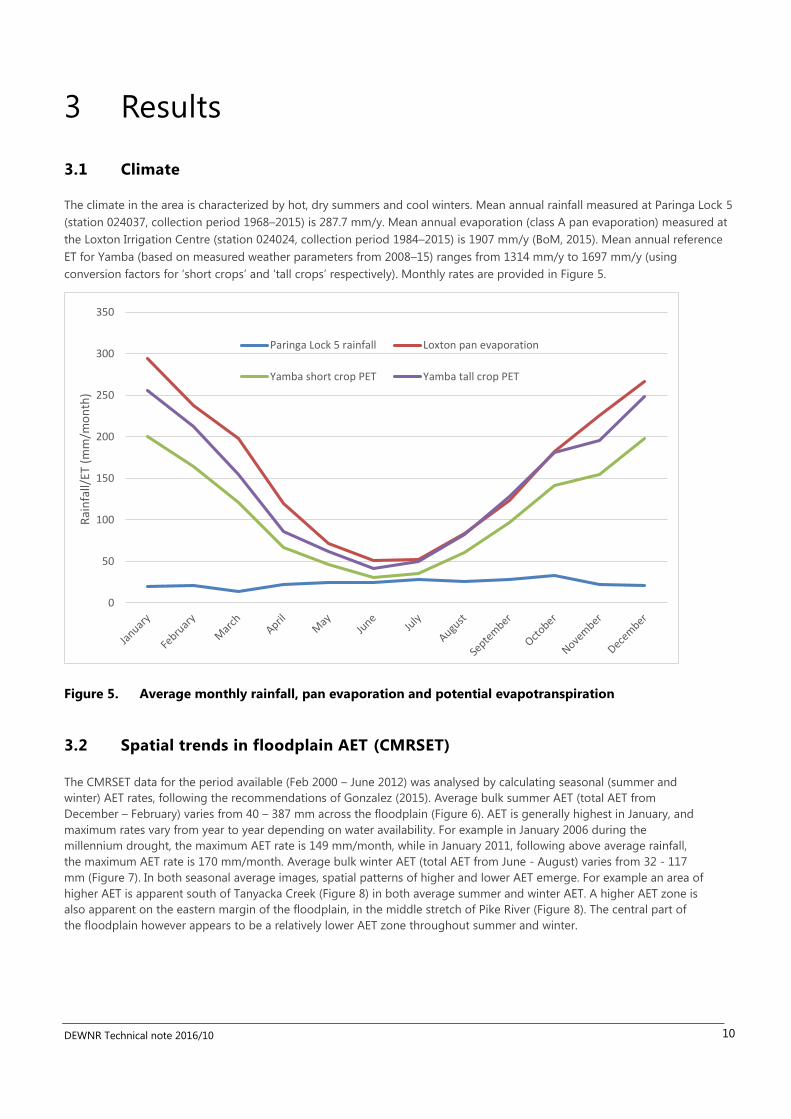
The climate in the area is characterized by hot, dry summers and cool winters. Mean annual rainfall measured at Paringa Lock 5
(station 024037, collection period 1968–2015) is 287.7 mm/y. Mean annual evaporation (class A pan evaporation) measured at
the Loxton Irrigation Centre (station 024024, collection period 1984–2015) is 1907 mm/y (BoM, 2015). Mean annual reference
ET for Yamba (based on measured weather parameters from 2008–15) ranges from 1314 mm/y to 1697 mm/y (using
conversion factors for ‘short crops’ and ‘tall crops’ respectively). Monthly rates are provided in Figure 5.
Figure 5. Average monthly rainfall, pan evaporation and potential evapotranspiration
3.2 Spatial trends in floodplain AET (CMRSET)
The CMRSET data for the period available (Feb 2000 – June 2012) was analysed by calculating seasonal (summer and
winter) AET rates, following the recommendations of Gonzalez (2015). Average bulk summer AET (total AET from
December – February) varies from 40 – 387 mm across the floodplain (Figure 6). AET is generally highest in January, and
maximum rates vary from year to year depending on water availability. For example in January 2006 during the
millennium drought, the maximum AET rate is 149 mm/month, while in January 2011, following above average rainfall,
the maximum AET rate is 170 mm/month. Average bulk winter AET (total AET from June - August) varies from 32 - 117
mm (Figure 7). In both seasonal average images, spatial patterns of higher and lower AET emerge. For example an area of
higher AET is apparent south of Tanyacka Creek (Figure 8) in both average summer and winter AET. A higher AET zone is
also apparent on the eastern margin of the floodplain, in the middle stretch of Pike River (Figure 8). The central part of
the floodplain however appears to be a relatively lower AET zone throughout summer and winter.
0
50
100
150
200
250
300
350
Rai
nfa
ll/ET
(m
m/m
on
th)
Paringa Lock 5 rainfall Loxton pan evaporation
Yamba short crop PET Yamba tall crop PET

DEWNR Technical note 2016/10 11
Figure 6. Average summer (December – February) evapotranspiration on the Pike floodplain, 2001–12

DEWNR Technical note 2016/10 12
Figure 7. Average winter (June – August) evapotranspiration on the Pike floodplain, 2001–12
DEWNR Technical note 2016/10 13
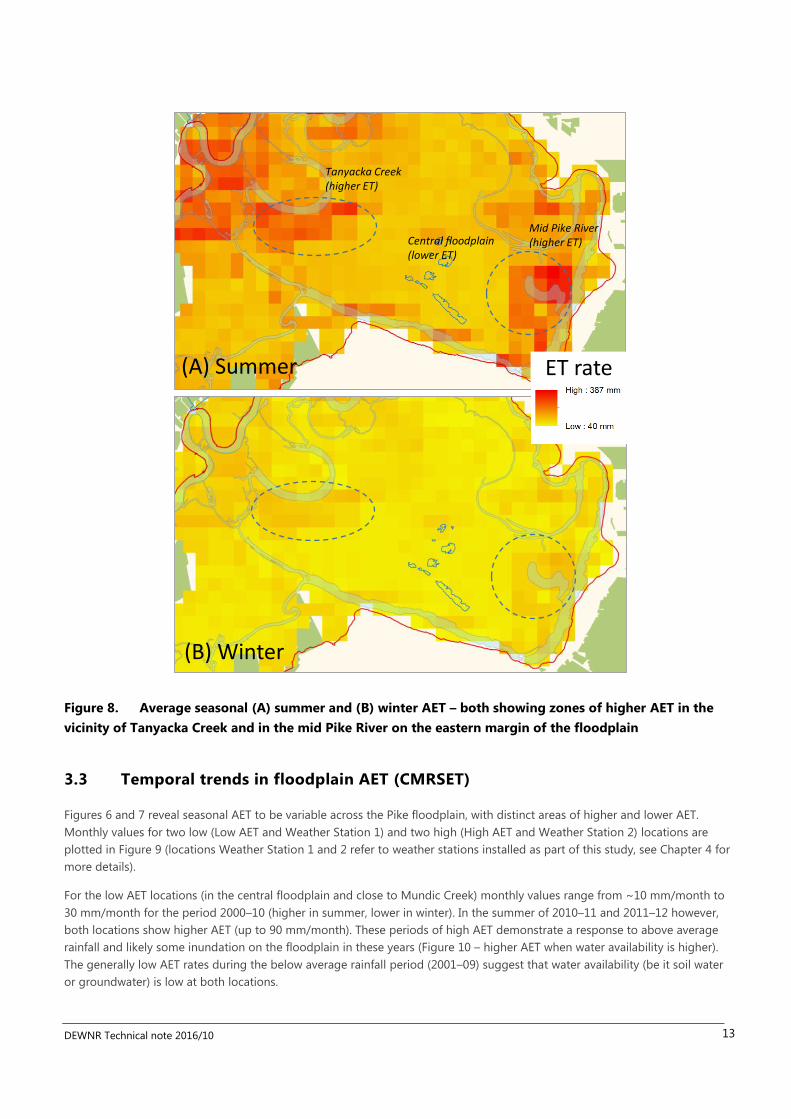
Figure 8. Average seasonal (A) summer and (B) winter AET – both showing zones of higher AET in the
vicinity of Tanyacka Creek and in the mid Pike River on the eastern margin of the floodplain
3.3 Temporal trends in floodplain AET (CMRSET)
Figures 6 and 7 reveal seasonal AET to be variable across the Pike floodplain, with distinct areas of higher and lower AET.
Monthly values for two low (Low AET and Weather Station 1) and two high (High AET and Weather Station 2) locations are
plotted in Figure 9 (locations Weather Station 1 and 2 refer to weather stations installed as part of this study, see Chapter 4 for
more details).
For the low AET locations (in the central floodplain and close to Mundic Creek) monthly values range from ~10 mm/month to
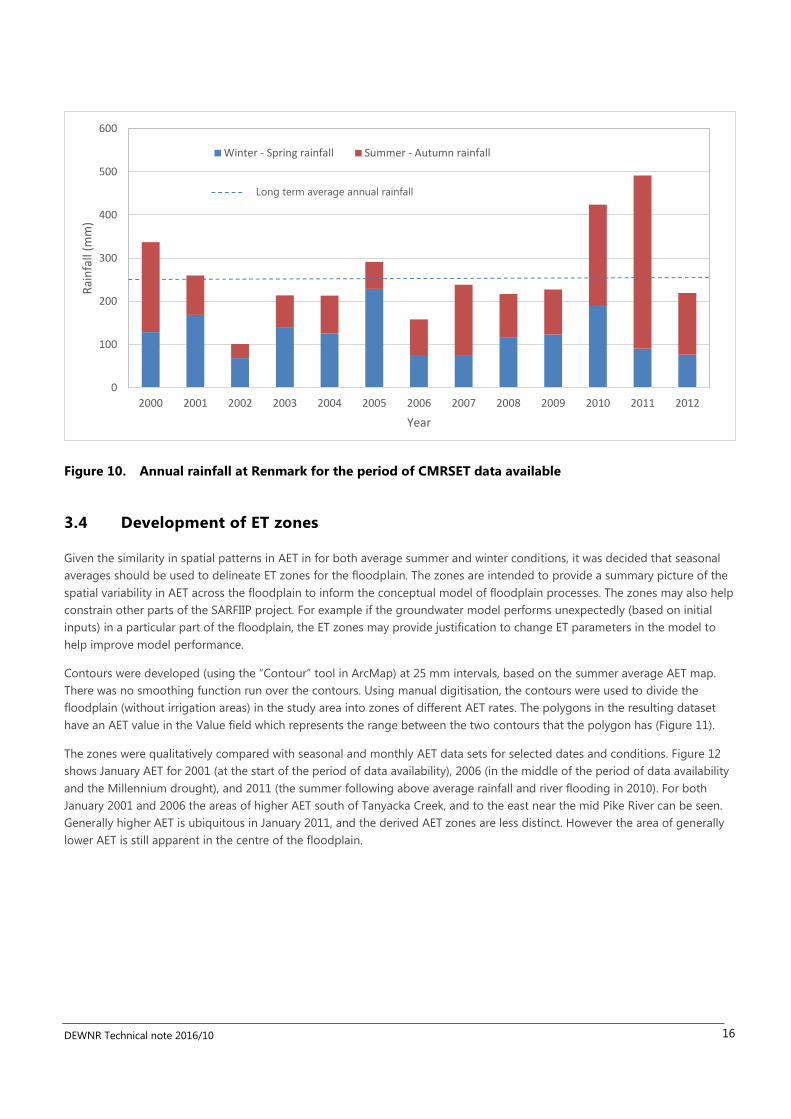
30 mm/month for the period 2000–10 (higher in summer, lower in winter). In the summer of 2010–11 and 2011–12 however,
both locations show higher AET (up to 90 mm/month). These periods of high AET demonstrate a response to above average
rainfall and likely some inundation on the floodplain in these years (Figure 10 – higher AET when water availability is higher).
The generally low AET rates during the below average rainfall period (2001–09) suggest that water availability (be it soil water
or groundwater) is low at both locations.
Tanyacka Creek (higher ET)
Mid Pike River(higher ET)Central floodplain
(lower ET)
(A) Summer
(B) Winter
ET rate

DEWNR Technical note 2016/10 14
For high AET locations, seasonal variations in monthly AET rates are relatively consistent, in the range of ~20–120 mm/month
(from winter to summer). While there is a small increase in the amount of summer AET in 2011 at the site labelled Weather
Station 2 (on Figure 9), seasonal variability is relatively consistent over the period 2000–12. This suggests that AET at these
locations is supported by a relatively persistent source of water, presumed to be groundwater (data from bore PAG080 south
of Tanyacka Creek shows that groundwater fluctuates ~1.1 to 2.3 m below the ground surface).

DEWNR Technical note 2016/10 15
Figure 9. Time series of CMRSET derived evapotranspiration at four locations on the Pike floodplain
DEWNR Technical note 2016/10 16
Figure 10. Annual rainfall at Renmark for the period of CMRSET data available
3.4 Development of ET zones
Given the similarity in spatial patterns in AET in for both average summer and winter conditions, it was decided that seasonal
averages should be used to delineate ET zones for the floodplain. The zones are intended to provide a summary picture of the
spatial variability in AET across the floodplain to inform the conceptual model of floodplain processes. The zones may also help
constrain other parts of the SARFIIP project. For example if the groundwater model performs unexpectedly (based on initial
inputs) in a particular part of the floodplain, the ET zones may provide justification to change ET parameters in the model to
help improve model performance.
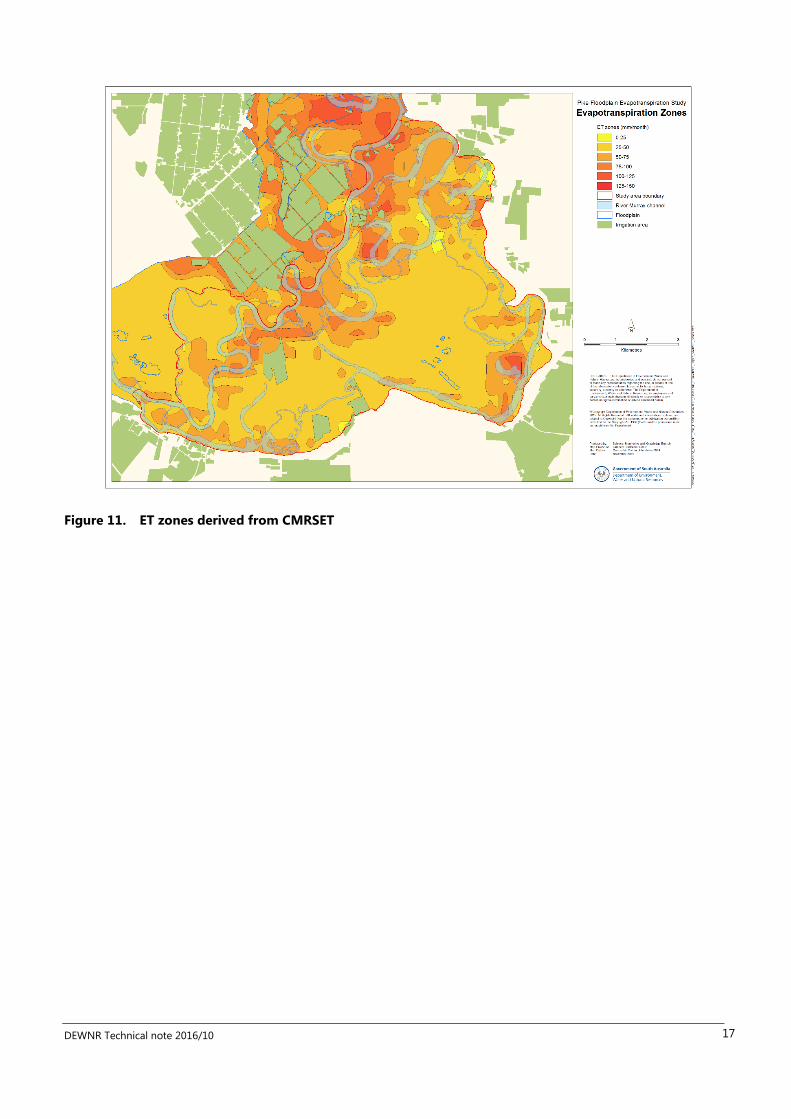
Contours were developed (using the “Contour” tool in ArcMap) at 25 mm intervals, based on the summer average AET map.
There was no smoothing function run over the contours. Using manual digitisation, the contours were used to divide the
floodplain (without irrigation areas) in the study area into zones of different AET rates. The polygons in the resulting dataset
have an AET value in the Value field which represents the range between the two contours that the polygon has (Figure 11).
The zones were qualitatively compared with seasonal and monthly AET data sets for selected dates and conditions. Figure 12
shows January AET for 2001 (at the start of the period of data availability), 2006 (in the middle of the period of data availability
and the Millennium drought), and 2011 (the summer following above average rainfall and river flooding in 2010). For both
January 2001 and 2006 the areas of higher AET south of Tanyacka Creek, and to the east near the mid Pike River can be seen.
Generally higher AET is ubiquitous in January 2011, and the derived AET zones are less distinct. However the area of generally
lower AET is still apparent in the centre of the floodplain.
0
100
200
300
400
500
600
2000 2001 2002 2003 2004 2005 2006 2007 2008 2009 2010 2011 2012
Rai
nfa
ll (m
m)
Year
Winter - Spring rainfall Summer - Autumn rainfall
Long term average annual rainfall
DEWNR Technical note 2016/10 17
Figure 11. ET zones derived from CMRSET

DEWNR Technical note 2016/10 18
Figure 12. ET zones and monthly CMRSET AET data for three summer months
DEWNR Technical note 2016/10 19
3.5 Comparison of CMRSET AET with other data
Following the work of Gonzalez (2015), comparisons were made between CMRSET data and other relevant data sets. Soil type
is likely to have an influence on ET, however no comparison is made here, as the soil mapping data available for Pike was not at
a sufficient scale to be of use (Jan Rowland, pers. comm.).
3.5.1 CMRSET based groundwater ET (AET minus rainfall)
To constrain the CMRSET data for comparison, a dataset was created that subtracted the monthly rainfall (taken from Paringa
Lock 5 rainfall station) from the monthly CMRSET AET value. The assumption is that subtracting rainfall will account for any
surface moisture and soil ET that is picked up in the CMRSET data, and the residual may give a better indication of
groundwater ET.
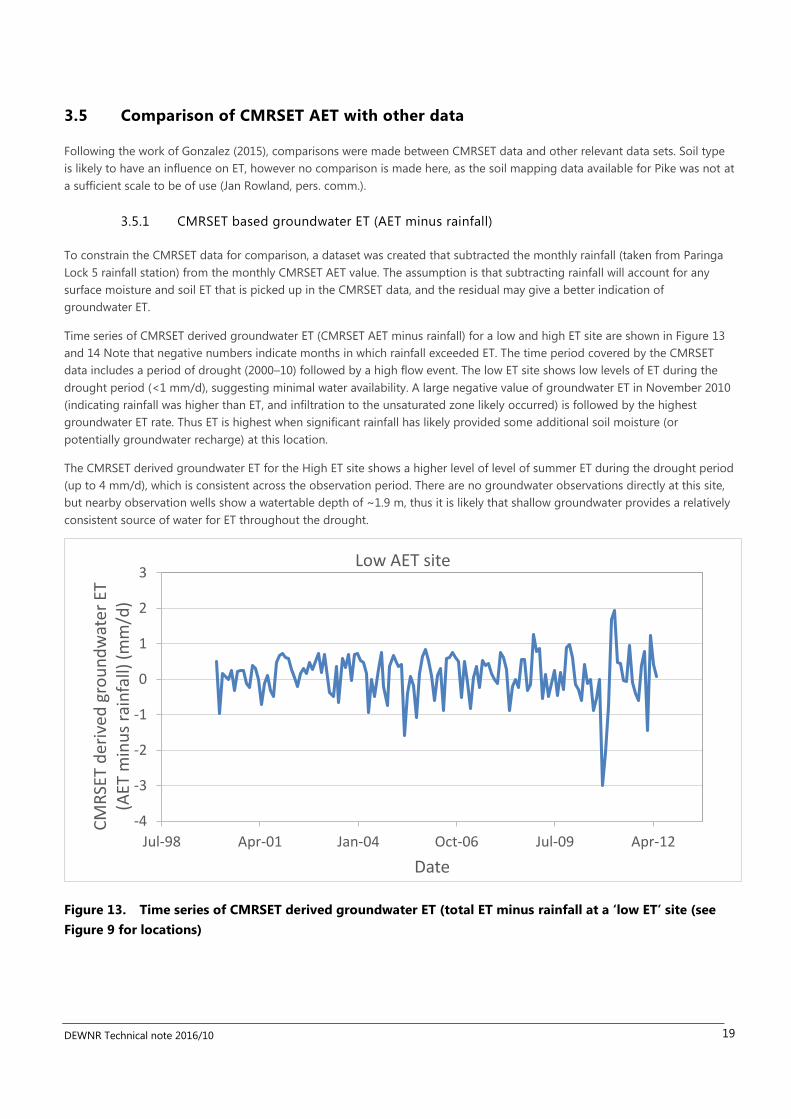
Time series of CMRSET derived groundwater ET (CMRSET AET minus rainfall) for a low and high ET site are shown in Figure 13
and 14 Note that negative numbers indicate months in which rainfall exceeded ET. The time period covered by the CMRSET
data includes a period of drought (2000–10) followed by a high flow event. The low ET site shows low levels of ET during the
drought period (<1 mm/d), suggesting minimal water availability. A large negative value of groundwater ET in November 2010
(indicating rainfall was higher than ET, and infiltration to the unsaturated zone likely occurred) is followed by the highest
groundwater ET rate. Thus ET is highest when significant rainfall has likely provided some additional soil moisture (or
potentially groundwater recharge) at this location.
The CMRSET derived groundwater ET for the High ET site shows a higher level of level of summer ET during the drought period
(up to 4 mm/d), which is consistent across the observation period. There are no groundwater observations directly at this site,
but nearby observation wells show a watertable depth of ~1.9 m, thus it is likely that shallow groundwater provides a relatively
consistent source of water for ET throughout the drought.
Figure 13. Time series of CMRSET derived groundwater ET (total ET minus rainfall at a ‘low ET’ site (see
Figure 9 for locations)
-4
-3
-2
-1
0
1
2
3
Jul-98 Apr-01 Jan-04 Oct-06 Jul-09 Apr-12
CM
RSE
T d
eriv
ed g
rou
nd
wat
er E
T (A
ET m
inu
s ra
infa
ll) (
mm
/d)
Date
Low AET site

DEWNR Technical note 2016/10 20
Figure 14. Time series of CMRSET derived groundwater ET (total ET minus rainfall) at a ‘high ET’ site (see
Figure 9 for locations)
3.5.2 Prior estimates of groundwater ET
While there have been no direct studies of ET on the Pike floodplain, studies of plant water use on similar floodplains have
been conducted, with a focus on groundwater use by plants. O’Grady et al. (2009) provide a summary of these studies which
show that rates of groundwater uptake by black box trees on floodplains generally range from 0.03–0.4 mm/d, while
groundwater uptake by river red gums is in the range of 1–2 mm/d. The rates depend on soil moisture salinity in the root
zone, with greater transpiration occurring where the water is fresher. Estimated groundwater ET rates derived from CMRSET
(CMRSET ET minus rainfall) are generally in the range of 0–4 mm/d. Given the uncertainty in how groundwater ET is derived
from CMRSET, that is by subtracting monthly rainfall from a monthly estimate of AET from interpreted satellite data, these rates
of CMRSET derived groundwater ET and estimated plant groundwater use can be considered broadly in the same range;
however more work is required here.
3.5.3 Vegetation distribution
Gonzalez (2015) examined the relationship between annual AET from CMRSET and vegetation distribution in the SAMDB, and
found no significant correlation between annual AET and vegetation type. Following this Gonzalez (2015) noted that the
relevance of trying to determine any such relationship should be considered. While vegetation maps provide a useful guide to
landscape types on the floodplain, additional vegetation data (e.g. Vegetation health, leaf area index) not captured in the
mapping will influence the amount of ET for a given vegetation type. Consequently we did not perform a detailed geo-
statistical analysis of the relationship between CMRSET derived AET and vegetation type on the Pike floodplain.
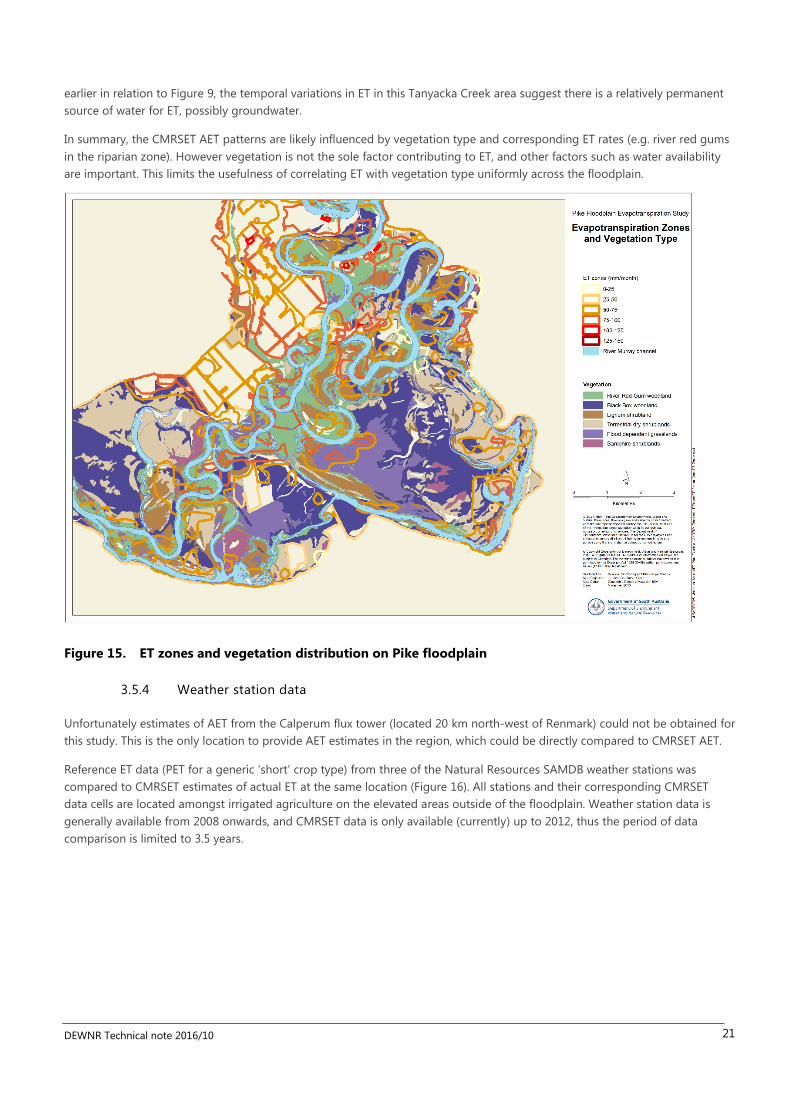
Qualitative comparisons with vegetation type were made by overlying ET zones on maps of vegetation distribution (Figure 15).
Vegetation types were taken from functional group classifications described in DEWNR (2012). The zoning and time series
maps in Figure 12 reveal somewhat of a riparian corridor of higher AET along the River Murray, which likely relates to ET from
river red gums which line the river, and likely also direct evaporation from surface water in the river.
However elsewhere clear relationships between vegetation type and ET are not apparent. For example, the high ET zone south
of Tanyacka Creek corresponds with ‘flood dependent grasslands.’ However this vegetation type extends further into the lower
ET zone of the central floodplain (before grading into ‘black box woodlands’ which are generally lower in ET). As discussed
-2
-1
0
1
2
3
4
5
Jul-98 Apr-01 Jan-04 Oct-06 Jul-09 Apr-12CM
RSE
T d
eriv
ed g
rou
nd
wat
er E
T (A
ET m
inu
s ra
infa
ll) (
mm
/d)
Date
High AET site
DEWNR Technical note 2016/10 21
earlier in relation to Figure 9, the temporal variations in ET in this Tanyacka Creek area suggest there is a relatively permanent
source of water for ET, possibly groundwater.
In summary, the CMRSET AET patterns are likely influenced by vegetation type and corresponding ET rates (e.g. river red gums
in the riparian zone). However vegetation is not the sole factor contributing to ET, and other factors such as water availability
are important. This limits the usefulness of correlating ET with vegetation type uniformly across the floodplain.
Figure 15. ET zones and vegetation distribution on Pike floodplain
3.5.4 Weather station data
Unfortunately estimates of AET from the Calperum flux tower (located 20 km north-west of Renmark) could not be obtained for
this study. This is the only location to provide AET estimates in the region, which could be directly compared to CMRSET AET.
Reference ET data (PET for a generic ‘short’ crop type) from three of the Natural Resources SAMDB weather stations was
compared to CMRSET estimates of actual ET at the same location (Figure 16). All stations and their corresponding CMRSET
data cells are located amongst irrigated agriculture on the elevated areas outside of the floodplain. Weather station data is
generally available from 2008 onwards, and CMRSET data is only available (currently) up to 2012, thus the period of data
comparison is limited to 3.5 years.

DEWNR Technical note 2016/10 22
Figure 16. Location of the Yamba, Lyrup Flats and Bookpurnong weather stations operated by Natural
Resources SA Murray-Darling Basin
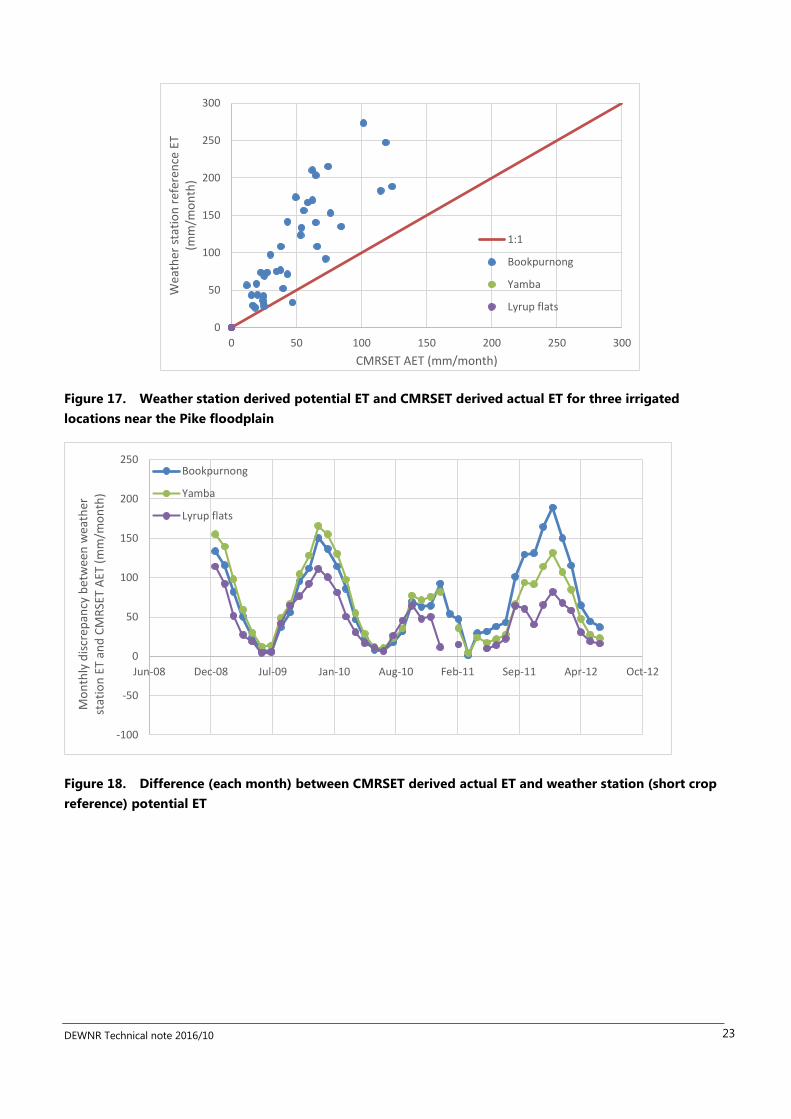
By definition, the reference ET should be higher than AET, as reference ET is essentially PET for a specific crop, thus assuming
an infinite source of moisture available, however there is still a broad positive correlation (R2 = 0.6) between the reference ET
and the CMRSET based AET estimates (Figure 17). The difference between reference ET and AET estimates is generally low in
winter, and peaks in mid-summer. Higher ET in summer is expected based on weather parameters, however water availability
(soil moisture or groundwater) may be more limited in summer, which may be the reason for this larger difference in summer
(less AET because of less moisture availability). This is also supported by the difference between reference ET and CMRSET
derived AET being higher in drier years (Figure 18).
The difference in summer reference ET and AET varies between sites and between years (Figure 18). This may reflect differences
in what is captured by the 250 m x 250 m CMRSET data cell due to different land use practices from year to year. Further
investigation of these differences is beyond the scope of this study. A more conclusive trend may be established if actual ET
were measured at the same location as potential ET (recommendations for measuring actual ET are discussed in Chapter 4
and 5).
DEWNR Technical note 2016/10 23
Figure 17. Weather station derived potential ET and CMRSET derived actual ET for three irrigated
locations near the Pike floodplain
Figure 18. Difference (each month) between CMRSET derived actual ET and weather station (short crop
reference) potential ET
0
50
100
150
200
250
300
0 50 100 150 200 250 300
Wea
ther
sta
tio
n r
efer
ence
ET
(mm
/mo
nth
)
CMRSET AET (mm/month)
1:1
Bookpurnong
Yamba
Lyrup flats
-100
-50
0
50
100
150
200
250
Jun-08 Dec-08 Jul-09 Jan-10 Aug-10 Feb-11 Sep-11 Apr-12 Oct-12
Mo
nth
ly d
iscr
epan
cy b
etw
een
wea
ther
st
atio
n E
T an
d C
MR
SET
AET
(m
m/m
on
th)
Bookpurnong
Yamba
Lyrup flats

DEWNR Technical note 2016/10 24
4 Weather station installation
4.1 Site selection
Based on the analysis of CMRSET data across the Pike floodplain, two sites were chosen as locations to install weather stations
on the Pike floodplain. The two sites represent high and low ET characteristics, based on analysis of the CMRSET data (see
Figure 9 for time series of CMRSET AET at the two locations). The low ET location (Weather Station Site 1) is located near black
box vegetation. The high ET location (Weather Station Site 2) is located near the high ET zone identified in the CMRSET data,
south of Tanyacka Creek (Figure 19). Vegetation at the high ET site is sparse and consists of flood dependent grasses.
Figure 19. Location of weather stations installed on Pike floodplain
DEWNR Technical note 2016/10 25
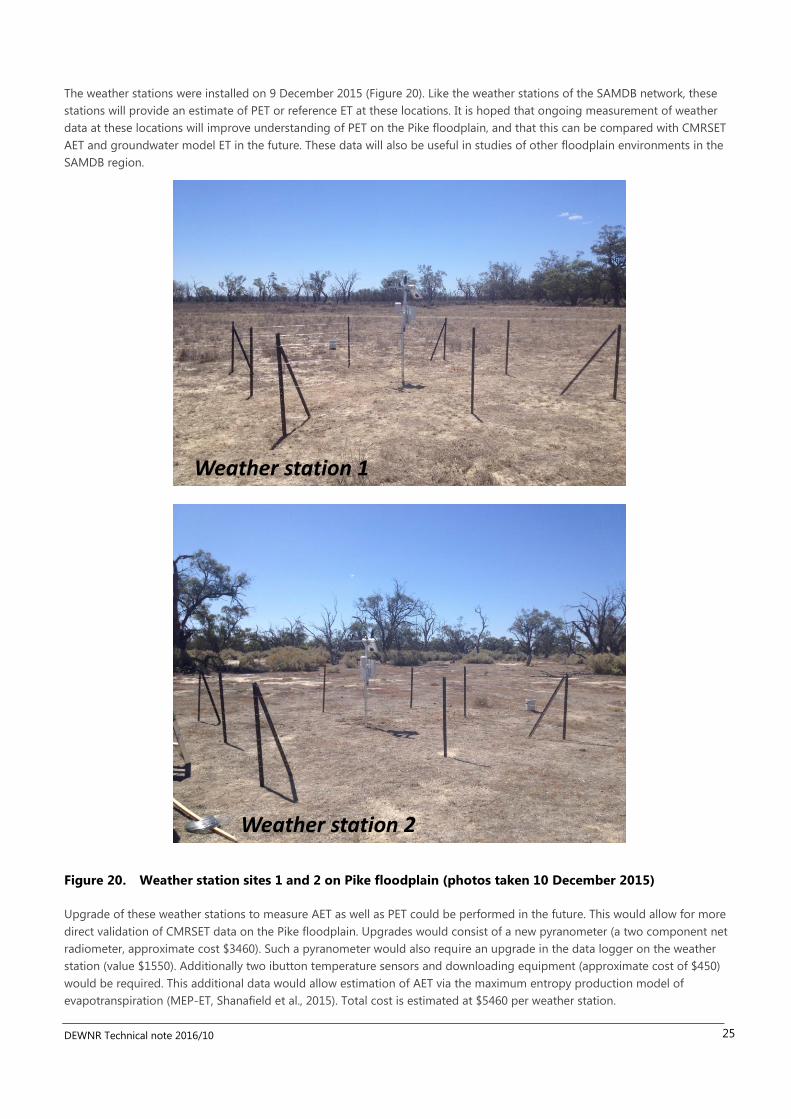
The weather stations were installed on 9 December 2015 (Figure 20). Like the weather stations of the SAMDB network, these
stations will provide an estimate of PET or reference ET at these locations. It is hoped that ongoing measurement of weather
data at these locations will improve understanding of PET on the Pike floodplain, and that this can be compared with CMRSET
AET and groundwater model ET in the future. These data will also be useful in studies of other floodplain environments in the
SAMDB region.
Figure 20. Weather station sites 1 and 2 on Pike floodplain (photos taken 10 December 2015)
Upgrade of these weather stations to measure AET as well as PET could be performed in the future. This would allow for more
direct validation of CMRSET data on the Pike floodplain. Upgrades would consist of a new pyranometer (a two component net
radiometer, approximate cost $3460). Such a pyranometer would also require an upgrade in the data logger on the weather
station (value $1550). Additionally two ibutton temperature sensors and downloading equipment (approximate cost of $450)
would be required. This additional data would allow estimation of AET via the maximum entropy production model of
evapotranspiration (MEP-ET, Shanafield et al., 2015). Total cost is estimated at $5460 per weather station.
Weather station 1
Weather station 2

DEWNR Technical note 2016/10 26
5 Conclusions and recommendations
Evapotranspiration (ET) is a critical process in the floodplains of the SA River Murray. It results in evapoconcentration of salts in
the groundwater and soil, impacting the health of vegetation. It also controls the watertable height and hence the interaction
between the surface water and groundwater, influencing (i) the location and extent of freshwater lenses and (ii) the flux of
saline groundwater to the river and its anabranches. It has been estimated to be the single largest component of the
groundwater balance for both Pike Floodplain and Katarapko Floodplain (Woods et al., 2014). Yet despite its importance to
floodplain ecological health and in-river salinity, ET data for the SA floodplains has been scarce.
5.1 Conclusions
Potential ET is estimated at weather stations but actual ET (AET) has been measured on the ground in only a few studies of the
River Murray floodplain (O’Grady et al., 2009). This study investigated a newly-available and extensive satellite-derived AET
dataset, CMRSET. Analysis of the CMRSET data, in conjunction with other information, has demonstrated:
Clear patterns of high and low AET are apparent across the Pike floodplain.
These patterns can be observed monthly, seasonally, and across a range of climate conditions (during drought years
as well as above average rainfall years).
Analysis of seasonal trends and patterns in floodplain AET has allowed the delineation of ET zones for the Pike
floodplain.
Patterns of high and low AET show some relationship with vegetation type (e.g. higher AET in the riparian zone where
river red gums are present) however there is not a clear correlation between spatial variation in vegetation and AET
across the floodplain.
Temporal trends in AET are different for ‘high’ and ‘low’ ET zones:
o In low ET zones, AET fluctuates a small amount seasonally (~10 – 20 mm difference between summer and
winter AET), but AET may increase dramatically (e.g. increase by 70 mm) in high rainfall years. This suggests
water availability (surface water, soil water and groundwater) is limited in these zones.
o In high ET zones, there is a large seasonal fluctuation in AET (~100 mm difference between summer and
winter) and no significant increase in high rainfall years. This suggests a relatively permanent source of water
is available in these areas to support consistent seasonal ET during the drought.
The difference in trends for high and low ET zones suggests groundwater (specifically depth to groundwater) is an
important factor influencing AET trends by providing a consistent source of water for ET during drought years.
This study has greatly improved the understanding of ET on Pike floodplain, and more broadly how floodplain ET may vary
spatially and temporally (and what it varies in response to). Availability of monthly CMRSET data has allowed this study to build
upon the findings of Gonzalez (2015). Also, given the specific spatial focus on ET variability, this study has improved the
conceptual model of Pike floodplain and ET processes. This new knowledge has been incorporated into the Pike Groundwater
model (Purczel et al., 2016) and will start to inform the way we model floodplain processes in future, thus feeding into the
decision support process.
5.2 Recommendations
The study has identified gaps in the understanding of floodplain ET. To address these gaps in future, it is recommended that:
CMRSET data should be compared to ET measured at the Calperum flux tower, located in mallee vegetation ~ 20 km
north-west of Renmark. This was a recommendation of Gonzalez (2015), however the Calperum ET data could not be
obtained during this study.

DEWNR Technical note 2016/10 27
Weather stations installed as part of this study should continue to be used for ongoing PET measurement on the Pike
floodplain. A longer term data record will provide: constraints on groundwater modelling, comparison between
CMRSET data and measured PET, and a comparison between highland and floodplain ET.
The weather stations should be upgraded to measure AET as well as PET, preliminarily costed at $5500 for each site
(plus installation).
The feasibility of performing more detailed field studies of ET on the Pike floodplain should be explored. Eddy
covariance towers should be considered. Rates and sources of plant water ET could be investigated, possibly through
sap flow and isotope techniques respectively.
Additional data sources should be identified that may be available to constrain estimates of AET on the Pike
floodplain, for example LIDAR data that may assist in improving vegetation mapping.
LANDSAT Data Cube imagery should be used to develop high-resolution AET data for the SA River Murray
floodplains. This should be ground-truthed against field estimates from eddy covariance towers and other sources.

DEWNR Technical note 2016/10 28
6 References
Allen, RG, Pereira, LS, Raes, D, Smith, M, 1998, Crop evapotranspiration – Guidelines for computing crop water requirements -
FAO Irrigation and drainage paper 56. Natural Resources and Environment, Food and Agricultural Organization of the United
Nations, Rome, Italy. Available: http://www.fao.org/docrep/x0490e/x0490e00.htm Accessed: 12 October 2015
BoM (2015) Bureau of Meteorology – Climate Data Online. Available: http://www.bom.gov.au/climate/data/ Accessed: 17
November 2015
DEWNR (2012) Riverine Recovery: Weir pool manipulation – vegetation and wetland inundation. Department of Environment,
Water and Natural Resources (DEWNR), Adelaide, South Australia.
Gonzalez, D, 2015, ‘Preliminary analysis of remotely sensed actual evapotranspiration data,’ in Woods, J (Eds), Modelling salt
dynamics on the River Murray in South Australia: Conceptual model, data review and salinity risk approaches. Goyder Institute
for Water Research Technical Report Series No. 15/x
Guerschman, JP, Van Dijk, AIJM, Mattersdorf, G, Beringer, J, Hutley, LB, Leuning, R, Pipunic, RC, Sherman, BS, 2009, Scaling of
potential evapotranspiration with MODIS data reproduces flux observations and catchment water balance observations across
Australia. Journal of Hydrology, 369: 107-119.
Harbaugh, AW, 2005, MODFLOW-2005 The US Geological Survey Modular Ground-Water Model – the Ground-Water Flow
Process. USGS Techniques and Methods 6-A16. Reston, Virginia.
NRSAMDB, 2015, Natural Resources SA Murray-Darling Basin Weatherstations:
http://aws.naturalresources.sa.gov.au/samurraydarlingbasin/ Accessed July 2015
O’Grady, A, Carter, J, Holland, K, 2009, Review of Australian Groundwater Discharge Studies of Terrestrial Systems. CSIRO:
Water for a Healthy Country National Research Flagship, Australia.
Peat, V, Nakai, T, Woods, J, Telfer, A, Burnell, R, Weir, Y, Evans, S, 2010, Pike Groundwater Model, Australian Water Environments
Technical Report.
Peel, MC, Chiew, FHS, Western, AW, McMahon, TA, 2000, Extension of Unimpaired Monthly Streamflow Data and
Regionalisation of Parameter Values to Estimate Streamflow in Ungauged Catchments. Report prepared for the Australian
National Land and Water Resources Audit., Centre for Environmental Applied Hydrology. The University of Melbourne.
Purczel, C., Li, C., Riches, V., Woods, J, 2016, SARFIIP – Pike Groundwater Model Technical Report. Draft report in progress
Salama, RB, 1998, Physical and Chemical Techniques for Discharge Studies, In: Zhang, L and Walker, G (eds) ‘Part 1 of The Basics
of Recharge and Discharge,’ CSIRO Publishing, Australia.
Shah, N, Nachabe, M, Ross, M, 2007, Extinction depth and evapotranspiration from ground water under selected land covers.
Ground Water, 45: 329-338.
Shanafield, M, Cook, PG, Gutierrez-Jurado, HA, Faux, R, Cleverly, J, Eamus, D, 2015, Field comparison of methods for estimating
groundwater discharge by evaporation and evapotranspiration in an arid-zone playa. Journal of Hydrology, 527: 1073-1083.
Woods, J, Li, C, Bushaway, K, Yan, W, 2014, Pike-Murtho Numerical Groundwater Model 2014 Volume 1: Report and Figures,
DEWNR Technical Report 2014/05, Government of South Australia, through Department of Environment, Water and Natural
Resources (DEWNR), Adelaide.
