of coaching... · web viewemc collected data on coach and teacher knowledge and practices for 5...
TRANSCRIPT
INFLUENCES OF COACHING KNOWLEDGE 1
Influences of Coaching Knowledge on Teacher Change
David A. Yopp
University of Idaho
Elizabeth A. Burroughs
Montana State University
John T. Sutton
RMC Research Corporation
Mark C. Greenwood
Montana State University
Author Note
David A. Yopp, Department of Mathematics and Curriculum and Instruction, University
of Idaho; Elizabeth A. Burroughs and Mark C. Greenwood, Department of Mathematical
Sciences, Montana State University; John T. Sutton, RMC Research Corporation, Denver,
Colorado.
This material is based upon work supported by the National Science Foundation under
Grant 0918326. Any opinions, findings, and conclusions or recommendations expressed in this
material are those of the author(s) and do not necessarily reflect the views of the National
Science Foundation.
Correspondence concerning this paper should be addressed to David A. Yopp,
Department of Mathematics and Curriculum and Instruction, University of Idaho, 313 Brink
Hall, Moscow, ID 83844. (208) 885-6220. E-mail: [email protected]
INFLUENCES OF COACHING KNOWLEDGE 2
Abstract
This study investigated what types of coaching knowledge among mathematics classroom
coaches are tied to features of teacher improvement among teachers who are coached.
Participants in this study were 51 school-based mathematics classroom coaches in the United
States and 180 teachers whom they coached between 2009 and 2014. This study found evidence
that improvements in coaches’ knowledge of predominant coaching models are related to
improvements in teachers’ mathematics content and pedagogical content knowledge. The study
also found that improvements in coaches’ self-assessment of their own coaching skills are related
to improvements in teachers’ mathematics content and pedagogical content knowledge,
practices, and self-efficacy. The study did not detect relationships between improvements in
coaches’ mathematics knowledge and changes in teachers’ knowledge or practices.
Keywords: professional development, mathematics education, elementary teacher
education, mentoring, coaching, teacher knowledge, teacher practice
INFLUENCES OF COACHING KNOWLEDGE 3
Influences of Coaching Knowledge on Teacher Change
Classroom coaching is a professional development method in which a coach works in the
classroom of a teacher to improve teaching practice. Many schools use coaching in an effort to
improve student outcomes. There is growing empirical evidence that coaching can be an
effective professional development component for improving teacher practice (Biancarosa &
Bryk, 2011; Powell & Diamond, 2011; Neuman & Wright, 2010; Ramey et al., 2011) and
student achievement (Campbell & Malkus, 2011; Biancarosa & Bryk, 2011; Powell & Diamond,
2011; Ramey et al., 2011). A natural question asks how coaches’ knowledge influences the
effectiveness of their coaching practices.
Studies that demonstrate how a coach’s knowledge influences effectiveness are few. All
of the studies cited above used coaches who were trained in both teaching and coaching, so the
effects of these trainings are not isolated as results in coaching alone. In mathematics coaching, a
study by Campbell and Malkus (2011) is of particular interest because the researchers found that
schools’ use of highly trained mathematics specialists, whose responsibilities included coaching,
had a modest positive effect on student achievement. Prior to their assignment as specialists,
each of these specialists obtained a master’s degree focused on both school mathematics teaching
and leadership. A study of the nature and extent of how variation in the coaches’ knowledge
influenced teaching or student outcomes was outside the scope of their research.
Establishing relationships between a coach’s knowledge or skill and teacher change is
critical for both research and practice in classroom coaching. Researchers must know what types
of knowledge are important in coaching in order to appropriately analyze the effectiveness of
teacher professional development initiatives that involve coaching. School districts that use
coaches are faced with hiring and training concerns. Our large-scale empirical study tested the
INFLUENCES OF COACHING KNOWLEDGE 4
hypotheses suggested in the literature, that a coach’s knowledge and practices influence
effectiveness. In this study, we sought to understand how school-based mathematics coaches’
knowledge or skills in two domains, coaching and mathematics content, influenced the coaches’
effectiveness.
Theoretical Framework
Coach Responsibilities and Associated Knowledge and Skills
Coaching knowledge is a construct that has not been widely studied. There are, however,
a number of published coaching texts that offer suggestions about the knowledge and skills that
effective coaches should hold. When this study began, we were aware of four prominent texts
widely used for mathematics coaching in the United States, where this study took place. There
are numerous coaching models and texts, some of which emerged after the onset of our project.
In this description we focus only on the four coaching texts (and the coaching methods they
describe) that guided the development of our study and its instruments: Cognitive Coaching
(Costa & Garmston, 2002); Instructional Coaching (Knight, 2007); Content-Focused Coaching
(West & Staub, 2003); and A Guide to Mathematics Coaching (Hull, Balka, & Miles, 2009).
These texts can differ in the knowledge and skills they suggest for coaches, but there are
common recommendations across texts.
All four of these coaching texts address a coach’s interaction with teachers about content.
Cognitive coaching relies heavily on coaches’ use of reflective questions to encourage teachers
to refine their professional knowledge bases (Costa & Garmston, 2002). Instructional coaching
suggests that coaches use structured co-planning to help teachers make connections among
concepts (Knight, 2007). Content-focused coaching features a coach who takes a direct approach
to improving teacher content knowledge by explicitly illustrating important content for the
INFLUENCES OF COACHING KNOWLEDGE 5
teacher (West & Staub, 2003). In mathematics coaching, coaches interweave information about
instructional strategies and content knowledge in coaching sessions with teachers (Hull et al.,
2009). Within all of the texts are underlying assumptions about a knowledge base or skill set for
asking questions that are challenging enough to bring about teacher change. Some of the
differences in how these texts recommend addressing teachers’ understandings of content result
from their different assumptions about the knowledge base of the coach.
Not all of the texts make the same assumptions about an effective coach’s knowledge of
mathematics. Instructional coaching (Knight, 2007) and cognitive coaching (Costa & Garmston,
2002) make no assumption that the coach is more knowledgeable about the content than the
teacher being coached. In contrast, content-focused coaching (West & Staub, 2003) and the
mathematics coaching model (Hull et al., 2009) assume that the coach has a high level of content
knowledge and is more experienced than the teacher. Content-focused coaching acknowledges
that a coach might work with a teacher who has higher content knowledge than the coach, but
this model does assume that the coach has more teaching experience than the teacher being
coached. When coaches address teacher content knowledge in mathematics, this can include both
a teacher’s own mathematics content knowledge and a teacher’s understanding of students’
mathematics content knowledge (Sutton, Burroughs, & Yopp, 2011).
The four coaching texts are most similar in their emphasis on promoting professional
relationships. All four texts acknowledge that a coach must be a leader for change but at the
same time establish collegial rapport with teachers. Instructional coaching and mathematics
coaching assert that coaches should have knowledge of adult learning. They suggest that a coach
should facilitate coaching sessions in a manner that attends to personal relationships with
INFLUENCES OF COACHING KNOWLEDGE 6
teachers, while ensuring that these relationships are based on professional objectives, such as
instructional improvement. In these models, the coach is an agent of change in the school.
There is a tension between building rapport and facilitating teacher change. Positive,
professional relationships should be developed around mathematics, mathematics teaching, and
student learning (West & Staub, 2003), but at the same time the relationships must allow for the
coach to have difficult conversations with teachers that may cause some cognitive disequilibrium
(Knight, 2007). The texts suggest that focusing on student learning and using student work in
coaching sessions are ways to prevent a habit of criticizing teachers on superficial aspects of
particular teaching practices.
Coaches are encouraged to work with the principal to establish a clear, shared vision for
mathematics instruction in schools (Knight, 2007; West & Staub, 2003). Coaches are also
encouraged to give feedback to the principal about the school’s progress toward meeting its
vision for mathematics (West & Staub, 2003). There is potential for tension in the coach-teacher
relationship due to the coach’s position as a school leader. The texts suggest that coaches should
position themselves in a partnering, trusting relationship (Hull et al., 2009) with teachers so that
the coach is not seen as an evaluator or the “ears and eyes” of the principal.
Content-focused coaching also suggests that coaches should diagnose teachers’ stated and
unstated needs (West & Staub, 2003). Mathematics coaching asserts that it is a coach’s
responsibility to maintain and share best-practices research and be knowledgeable about data
acquisition and analysis and its use to guide coaching conversations and school improvement
(Hull et al., 2009). The texts also suggest that it is important for coaches to plan lessons with
teachers (Hull et al., 2009; Knight, 2007; West & Staub, 2003). Cognitive coaching emphasizes
that coaches should use reflective questions as a critical tool in coaching conversations (Costa &
INFLUENCES OF COACHING KNOWLEDGE 7
Garmston, 2002). The texts also suggest that coaches should be concerned with teachers’ beliefs
about effective mathematics instruction (Knight, 2007; West & Staub, 2003).
Although the preceding description does not completely capture the extensive
recommendations for coaches found in the texts we have cited, these are the features of coaching
that we focused on in our study, and our instruments measured the extent to which coaches were
aware of these various recommendations.
For our study, we did not distinguish between knowledge that an individual holds as a
view or belief and knowledge that is evident through a skill that an individual exhibits. We agree
that there is a distinction between these two types of knowledge. Some readers may interpret the
texts’ recommendations as a collection of skills that an effective coach should possess. We do
not necessarily disagree with this perspective. We do, however, take the position that knowledge
of the practices recommended in prominent coaching texts is a knowledge domain.
Coaching Intensity
Studies that examine contextual factors that influence a coach’s effectiveness are also just
emerging. Ramey et al. (2011) reported that teachers who participated in “dense coaching” (20
consecutive days) showed greater gains in their use of effective instructional reading practices
when compared to a “low density” coaching group. Biancarosa and Bryk (2011) reported that
teachers who participated in above-average amounts of coaching implemented targeted practices
with greater frequency. Campbell and Malkus (2011) collected data on daily activities of the
mathematics specialists in their study, including time spent in direct contact with teachers, but
they did not use this data to model individual teacher change. Campbell and Malkus (2011) noted
that as the coaching activities of the specialists decreased and were replaced by other duties, the
positive effects of the specialists on student achievement diminished.
INFLUENCES OF COACHING KNOWLEDGE 8
Types of Teacher Change
Questions about ways in which coaches can impact teachers’ knowledge and practice of
the content they teach also remain open, and few studies have attempted to isolate the effect. One
study that examined the effects of coaching on teacher knowledge of early language literacy was
unable to detect improvements in any of their groups, including those who received coursework
or coaching (Neuman & Wright, 2010).
Data Sources
The Examining Mathematics Coaching (EMC) Project recruited coaches and teachers to
participate throughout the 5 years of the project (2009–2014). The data set as analyzed includes a
total of 51 school-based coaches and 180 coached teachers from 28 districts across eight states
(see Table 1).
At the time the coaches in our study entered the project, 24% held bachelor’s degrees and
73% held master’s degrees. The remaining 3% reported some “other” type of degree. The
coaching participants began the project with an average of 12.6 years of teaching experience in
K–8 and an average of 11.6 years of mathematics teaching experience at that level. Coaches
reported an average of 2.1 years of prior coaching experience in K–8, with an average of 1.7
years of experience coaching mathematics. All 51 coaches held one or more teaching
certifications. Forty-five of the 51 coaches were certified as elementary teachers, 25 were
certified as middle-school teachers, and 13 were certified as secondary teachers. Only 11 of the
51 coaches reported holding an endorsement or certificate specific to mathematics.
At the time the teachers in our study entered the project, 58% held bachelor’s degrees and
40% held master’s degrees. The remaining 2% reported some “other” type of degree. The teacher
participants began the project with an average of 9.2 years of experience teaching in K–8 and an
INFLUENCES OF COACHING KNOWLEDGE 9
average of 8.4 years of experience teaching mathematics at that level. All 180 teachers held one
or more teaching certifications. One hundred seventy of the 180 teachers were certified as
elementary teachers, 82 were certified as middle-school teachers, and 16 were certified as
secondary teachers. Only 16 of the 180 teachers reported holding an endorsement or certificate
specific to mathematics.
The sample of districts in our study is diverse. District-level demographics are more
appropriate to our study than school-level demographics because many of the coaches coached in
multiple schools within a district. Twelve of the districts are described as urban or suburban, five
are in remote towns, and 11 are rural districts (U.S. Department of Education, 2012). Table 2
further summarizes our participating districts’ demographics.
EMC collected data on coach and teacher knowledge and practices for 5 consecutive
years, and here we report our analysis of this 5-year study. Coaches received professional
development experiences, designed and presented by project staff, in both coaching and
mathematics for teaching at different times over the duration of the project. At the beginning of
the study coaches were randomly assigned to one of two groups. These groups received
professional development (PD) from the project in different orders and at different times: “Group
1” received mathematics PD in Year 1 and coaching PD in Year 3, while “Group 2” received
coaching PD in Year 2 and mathematics PD in Year 4. In the study reported in this article, the
PD effects and the random assignment of coaches to PD groups are not incorporated into our
statistical models. Instead, the PD offered opportunities to improve coaches’ coaching and
mathematics content knowledge at different time points, potentially creating more variation in
our sample across time.
INFLUENCES OF COACHING KNOWLEDGE 10
Because some participants, both coaches and teachers, withdrew from the project due to
factors that had nothing to do with the study (e.g., change of job), some data are considered
missing at random. New coach enrollments were allowed as late as the start of Year 2 within the
existing random structure. Teacher replacements were allowed through the start of Year 4. See
Table 1 for more details on the study’s sample sizes.
Explanatory measures (coach variables) include assessments of
coaches’ mathematics and pedagogical content knowledge, as measured by
the Mathematics Knowledge for Teaching (MKT) number and operation (K–5
or 6–8) instrument (Hill, Rowan, & Ball, 2005; Hill et al., 2008);
coaches’ knowledge of, and alignment with, “prominent” coaching
recommendations, as measured by the Coaching Knowledge Survey (CKS), a
project-developed instrument based on the common coaching
recommendations found in Costa and Garmston (2002), Knight (2007), West
and Staub (2003), Hull et al. (2009), and Sutton et al. (2011);
coaches’ self-assessment of their mathematics coaching skills, as measured by
the Coaching Skills Inventory (CSI), a project-developed instrument aligned
with practices expressed on the project’s classroom observation protocol; and
the intensity of coaches’ practices, measured as the amount of time a coach
spent in pre- or post-lesson conferences each year with each teacher.
Coaches completed the MKT and CSI at the beginning of the project, then completed the MKT,
CSI, and CKS at the end of Year 1. They again completed the MKT, CSI, and CKS at the start of
Years 2, 3, 4, and 5.
Response measures (teacher variables) include assessments of
INFLUENCES OF COACHING KNOWLEDGE 11
teachers’ mathematics and pedagogical content knowledge, as measured by
the MKT number and operation (K–5 or 6–8) instrument;
teachers’ classroom practice, as measured by the 7-category ordered capsule
response found on the Horizon Research 2003 version of the Inside the
Classroom Observation Protocol, or ITCOP (see Weiss, Pasley, Smith,
Banilower, and Heck, 2003, for the instrument and a description of its use,
and Horizon Research Inc., 2000, for validity and reliability estimates); and
teachers’ self-efficacy for teaching mathematics, as measured by the Teacher
Survey (TS), a project-developed instrument.
Teachers completed the MKT and TS at the beginning of the project, then for a second time at
the end of Year 1. They again completed the MKT and TS at the end of Years 2, 3, 4, and 5.
EMC staff observed each teacher annually in Years 1–5 using the ITCOP.
We examined the relationship between the variations in the coaches’ scores (explanatory
variables) and the associated changes across time in the teachers’ scores (response variables). In
our analysis, we used the “centering” of variables in order to reduce the variability across means.
Quantitative predictor variables that vary over time contain two types of variation: variation
among participants and variation over time. In order to estimate the effects of each type of
variation, we calculated the mean over time for the teacher or coach, used that as one predictor,
and then subtracted this from the original variable to create the “centered” predictor (see
Gelman, 2008, for alternatives to this centering procedure). This allows the effects of differences
among teachers and coaches on that predictor to be separated from the effects of variation over
time on that predictor.
INFLUENCES OF COACHING KNOWLEDGE 12
We use hierarchical models to account for the hierarchical nature of the study, with
repeated measures on coaches and teachers assigned to coaches. Other control variables include
the professional development group to which the project randomly assigned the participant,
whether or not a coach received outside (i.e., not provided by EMC) coaching and/or
mathematics professional development in a given year, and whether or not a teacher received
outside mathematics professional development in a given year.
Methods
Measures
Coaching Skills Inventory (CSI). The CSI is a project-developed instrument designed to
measure a mathematics coach’s perspective on his or her own level of effectiveness or
confidence with various coaching responsibilities. The inventory has 20 items measured on a 5-
point Likert scale, with a higher rating indicating a higher level of self-reported effectiveness.
(Example item: How effective do you feel coaching teachers on creating an environment where
students listen to one another?)
Exploratory factor analysis (varimax rotation) revealed three categories, which we
labeled (a) mathematics content and mathematics-specific pedagogy, (b) student-centered
pedagogy, and (c) building coaching relationships. For these factors, internal reliability scales
were high (Cronbach’s α = 0.935, 0.932, and 0.822, respectively). A single score for a participant
is extracted from the instrument by averaging the averages of the scales (factors).
Annual CSI scores were used in the models as explanatory variables in two ways: the
averages across the 5 time points for each coach (CSImean) and the yearly variation around the
mean for each coach (CSIcentered). As will be seen shortly, CSIcentered scores explained gains
in some teacher variables across years.
INFLUENCES OF COACHING KNOWLEDGE 13
Coaching Knowledge Survey (CKS). The CKS is a project-developed instrument
designed to capture the extent to which a coach’s knowledge of effective coaching practices
aligns with predominant coaching texts (i.e., Costa & Garmston, 2002; Knight, 2007; Hull et al.,
2009; West & Staub, 2003). The instrument contains both 7-point Likert scale items and selected
response items for a total of 20 items. Each item was coded according to whether or not the
response conformed with assertions found in coaching texts. For example, the item I work with
principals or other administrators to form a clear message to teachers about effective
mathematics instruction was rated by participants on a 7-point Likert scale from strongly
disagree to strongly agree. A coach with extensive knowledge of these coaching texts knows
that there can be tension between the role of a coach as confidant for teachers and the role of a
coach as a school mathematics leader and a possible member of a school’s leadership team.
Some texts caution against reporting to administrators about particular teachers’ actions (e.g.,
Hull et al., 2009). Yet a coach with extensive understanding of these predominant texts knows it
is recommended that coaches take a leadership role in developing a school vision for
mathematics, and that the principal plays a critical role in communicating and supporting this
vision (e.g., Knight, 2007). A knowledgeable coach might have personal experiences that
preclude the coach from strongly agreeing with this statement (e.g., a principal who is not
supportive of standards-based instruction), but a coach who has knowledge about coaching texts
knows which side of the fence to be on. Thus, coaches who rated this item as “5” (1 category
above neutral) or higher (agree) were coded as expressing actions that conform with the views
expressed in the texts. Coaches who rated this item as “1,” “2,” or “3” (disagreeing) or “4”
(neutral) were coded as expressing views that do not conform to the literature. Table 3 offers a
subset of the items from the CKS to illustrate types of items on the instrument.

INFLUENCES OF COACHING KNOWLEDGE 14
The CKS was developed and validated through the following process. First EMC
researchers developed a collection of 39 items based on responses to a pilot instrument from 191
coaches throughout the United States, none of whom were participants in the EMC Project. This
was a sample of convenience created through an open e-mail invitation sent to a network of
mathematics coaches and mathematics coaching experts that included a link to the survey. More
details on the development of this instrument are available in Greenwood and Jesse (2014).
Briefly, a tetrachoric correlation matrix (Revelle, 2014) for the 39 binary items was
developed to explore the underlying dimensions in the items. Scree plot and associated parallel
analysis suggested that the items contained 5 or more dimensions. In a maximum likelihood
factor analysis, 20 items were associated with the first factor (loadings greater than 0.4) and were
retained for further exploration. This collection of 20 items exhibits good, but not excellent,
internal consistency (Cronbach’s α estimated at 0.81).
Item response theory (IRT) 1- and 2-parameter logistic (1PL and 2PL) models were
considered to develop a scoring model for the CKS responses on the 20 identified items. These
items were all relatively easy for the pilot participants whose responses we used to develop the
scoring model (the most difficult having 65% conforming responses and the least difficult having
96% conforming responses). A 1PL model was found to be adequate with p = 0.06 when tested
relative to the 2PL model. There was no evidence of a lack of fit of the 1PL model from a
bootstrap test (p = 0.556), where the null hypothesis was of model adequacy with the 1PL model.
Additionally, there was no evidence of multidimensionality, with p = 0.204 from 999 bootstrap
samples using methods described in Rizopoulos (2006). The estimated 1PL scoring model was
then applied to the longitudinal responses of the study participants.
INFLUENCES OF COACHING KNOWLEDGE 15
Our next concern was whether or not the collection of 20 items is a useful and valid
assessment of the EMC coaches. Figure 1 demonstrates that the CKS scores of the EMC coaches
at the pretest appear to be about 1 standard deviation lower than the pilot sample (mean of 0 by
construction) and increased over time in the study. We modeled the longitudinal CKS responses
using a 2-level hierarchical linear model over 5 years, assessing for evidence of any differences
based on the timing of professional development between PD Groups 1 and 2, controlling for
whether or not a coach had received outside mathematics professional development and whether
or not a coach had received outside coaching professional development in a given year. There
was no evidence of a time-by-PD group interaction (F(4,189) = 0.66, p = 0.62). With the
interaction removed from the model, there was strong evidence for changes over time (F(4,193)
= 8.8, p < 0.0001) and impacts of outside coaching professional development (F(1,193) = 10.1, p
= 0.002), but no evidence of a difference in the two PD groups (F(1,49) = 2.1, p = 0.153) or
based on having had outside mathematics training (F(1,193) = 1.96, p = 0.163). In this model,
the coaches in Year 5 had mean CKS scores estimated to be 0.55 standard deviations (SD) higher
than in Year 1 (95% CI: 0.347 to 0.754), and the coaches who had outside coaching training in
the prior year had a mean CKS score that is 0.25 SDs higher than coaches who had no outside
training in the prior year (95% CI: 0.094 to 0.400). The detected effects of outside coaching
professional development and time on our EMC sample’s longitudinal CKS scores suggest that
our collection of 20 items has predictive validity, and that these items are useful for detecting
changes in coaches’ conformance to coaching texts and for relating scores on this instrument to
teacher-level changes.
Coaches’ annual CKS scores were used as explanatory variables in two ways in the
statistical models below: the averages across the 5 years for each coach (CKSmean) and the
INFLUENCES OF COACHING KNOWLEDGE 16
yearly variation around the mean for each coach (CKScentered). We explain further below that
the CKSmean scores had negative relationships with all teacher measures (though there was only
limited evidence for the effects with p-values either slightly or much over 0.05), but the variation
in CKS scores (CKScentered) explained gains in one teacher response across years.
Mathematics Knowledge for Teaching (MKT). The MKT instrument was created by
the Learning Mathematics for Teaching Project at the University of Michigan (Hill et al., 2005;
Hill et al., 2008) using an IRT model to produce estimated latent ability scores related to
mathematics knowledge for teaching. This instrument was selected for this study because of its
validity and reliability (Hill, Schilling, & Ball, 2004) and its alignment with content that K–8
teachers teach (Ball, Thames, & Phelps, 2008). Hill et al. (2008) discussed the merits of using
the MKT for this type of study. Teachers and coaches in our project completed the grade-band
version of the MKT (K–5 or 6–8) that best aligned with their teaching assignment or coaching
assignment on the date they entered the project. Participants alternated between two versions of
the MKT at their level of instruction, with the initial version randomly assigned. The scores on
the two versions were equated using the original data sets used to develop the instruments. The
MKT IRT scores from each year of the study were used for teachers as response variables. The
Coach MKT IRT scores were used in the models as explanatory variables in two ways: the
averages across the 5 time points for each coach (CMKTmean) and the yearly variation around
the mean for each coach (CMKTcentered). As we explain further below, we found minimal
evidence of relationships between coaches’ MKT and teachers’ MKT.
Inside the Classroom Observation Protocol (ITCOP). The ITCOP prompts the
observer to rate a lesson in four domains: design, implementation, mathematics content, and
INFLUENCES OF COACHING KNOWLEDGE 17
classroom culture. After rating these domains, the rater gives an overall capsule rating of the
lesson quality and impact. For our study, we used only the capsule rating.
The intention of the capsule rating is to record the rater’s overall assessment of
instruction and lesson quality and impact. The lesson is rated from 1 to 5, with “1” being
ineffective instruction, “2” being elements of effective instruction, “3” being beginning stages of
effective instruction, “4” being highly accomplished effective instruction, and “5” being
exemplary instruction. Capsule ratings of “3” are then refined as either “Low 3,” “Solid 3,” or
“High 3.” These responses were converted into a 7-level Likert scale to respect this ranking of
the intermediate responses.
Data from the ITCOP were collected by 12 observers who underwent annual reliability
training to standardize the ITCOP observations. Videos of non-EMC classroom lessons used in
reliability training in Year 1 and Year 2 were incorporated into the Year 5 training to guard
against observer “drift.” Each year in training, project observers exhibited a high degree of
reliability (between 80% and 100% agreement within 1 point of median), and we found no
evidence of drift on observer scores between Years 1 and 2 and Year 5 (100% interrater and
cross-year agreement within 1 point of median). The observers were then allocated to observe all
teachers in the study each spring based on geographical efficiency, which tended to confound the
28 districts and 12 observers. The observers did not have knowledge of the teachers’ MKT
scores, and for the vast majority, the observers were previously unacquainted with the teachers
they observed, other than encounters during a brief, formal orientation to the project that
occurred in 2009, at the outset of the project and months before the initial observations. Thus, the
observers had little existing knowledge of the teachers they observed, thereby reducing bias in
the observations. The ITCOP measurements involved prearranged classroom visits for lessons
INFLUENCES OF COACHING KNOWLEDGE 18
related to number sense or algebraic reasoning that took place between March and May each
year.
Teacher Survey (TS). The TS, a 38-item instrument using 8-point scaled responses, is
designed to measure a teacher’s personal level of preparedness, anxiety, and self-efficacy for
teaching mathematics, along with the level of participation in mathematics-related professional
development. Exploratory factor analysis revealed four factors: (a) preparedness to teach
mathematics, (b) anxiety for teaching mathematics, (c) efficacy for teaching mathematics, and
(d) engagement in mathematics activities. Internal reliability scores (Cronbach’s α) were high for
each factor (0.933, 0.944, 0.920, and 0.846, respectively). The average teacher responses on the
items loading on each factor were averaged to create a single score to use as a response variable
for each teacher in each year.
Coaching intensity. The coaching intensity variable (total number of minutes per year of
coaching in pre-lesson and post-lesson conferences for each teacher) is decomposed and used in the
model in two ways at the teacher level: the CIntMean, which averaged the minutes per teacher across
years, and the CIntCentered, which is the variation around that mean for each teacher for each project
year. (Note that these values also contain variation at the coach level, although the variable is focused on
the variation over time in the minutes spent by the pair in coaching sessions and the average for that pair.)
Both of these variables are used in each model to control for differences in the contact time that each
teacher received on average (CIntMean) and the variation around that mean for each teacher
(CIntCentered).
We do know that coaching intensity varied among our coaches across the years. In Year 1, some
coaches were either just beginning coaching or were to begin in the following year, and they may have
reported 0 coaching sessions for that first year. Other coaches began the project coaching frequently
during the early years of EMC, but then due to changes in job responsibilities or school restructuring,
their coaching sessions were reduced or eliminated as the project progressed. This phenomenon can be
INFLUENCES OF COACHING KNOWLEDGE 19
seen in the subset of our data that follows our coaching pairs from Year 1 to Year 5 (coach self-reported
data). In Year 1, 61 of 125 coaching pairs participated in 4 or more coaching sessions in mathematics; 92
pairs spent more than 60 minutes in pre- or post-lesson conferencing (inclusive “or”) about mathematics;
and 9 pairs participated in no coaching sessions in mathematics. In Year 2, the rates improved: 112 of 146
coaches reported 4 or more coaching sessions with an EMC teacher; 112 coaches reported more than 60
minutes in pre- or post-lesson conferences (inclusive) with an EMC teacher; and only 7 pairs participated
in no coaching sessions in mathematics with an EMC teacher. In both Years 3 and 4, we say decreases in
the number of coaches reporting 4 or more coaching sessions relative to our sample size (e.g., n = 139
coaching pairs in Year 3). In Year 5, 64 of 121 coaches reported 4 or more sessions with an EMC teacher;
66 coaches reported more than 60 minutes in pre- or post-lesson conferences (inclusive) with an EMC
teacher; and 37 pairs reported no coaching sessions in mathematics with an EMC teacher.
Data about coaching frequency and the nature of their coaching activities were self-reported by
coaches and compared with independent reporting by the teachers they coached. Our sample had a high
degree of reliability among coach and teachers’ when reporting to questions about whether or not
coaching occurred in a given year, only 6 of 138 teachers reported no coaching sessions when the coach
reported that sessions occurred. When asked about the exact number of coaching sessions, the teachers
and coaches’ responses differed slightly. For example, in Year 3, 59% of the coach and teacher pairs
reported numbers of mathematics coaching sessions that were no more than 1 apart, and 73% reported
numbers of mathematics coaching sessions that were no more than 2 apart. Coaches were asked to keep
careful logs of their coaching sessions with EMC teachers, but the teachers were not ask to do so. Teacher
reporting was likely based on their memory of a given year. This may explain the discrepancies. Never
the less, our data provides some confidence in the reliability of our coach reported data.
We also collected data on the nature of these sessions. In Year 3, for example, 71% of the
coaches reported that more than half or all of their coaching sessions used a pre-lesson conference; 77%
reported that more than half or all used a post-lesson conference; and 79% reported that more than half or
INFLUENCES OF COACHING KNOWLEDGE 20
all used a lesson observation. Sixty-four percent reported that none of their sessions involved lesson
modeling, and 25% reported using modeling no more than twice.
Other measures. Three variables related to outside training (Coach’s Outside Coaching
PD, Coach’s Outside Mathematics PD, and Teacher’s Outside Mathematics PD) were binned
into two categories: having had none or having had any in the prior 12 months. This
categorization was used because most were heavily right-skewed and could lead to influential
observations in the models. For the outside coach professional development, responses for
number of hours of professional development were obtained for the periods before EMC started
and during each 12-month segment of the study. For the outside mathematics professional
development for teachers and coaches, all responses referenced the prior 12 months, with
questions concerning the number of hours of mathematics professional development and number
of courses. Because of some potential overlap between courses and professional development
(e.g., a teacher may have received course credit for a professional development experience), the
two sets of responses were combined to create a variable that provided for the presence of either
a mathematics course or professional development for each coach and teacher in the prior 12
months. A description of all variables used in the models is available in Table 4.
Each longitudinal model for teacher-level repeated measures includes random intercepts
for the teacher and coach (2 nested random intercepts). This is generally a 3-level hierarchical
framework for the design, except for the rare case where teacher and coach pairings changed
(e.g., due to a school district’s personnel reassignments), which can create crossing with the
same teacher occurring with two different coaches. As will be illustrated in the next section, the
models are discussed using hierarchical modeling notation, except that the design is not
completely hierarchical with some teachers crossing coaches. Preliminary models also contained
a district effect, but the complexity of the model relative to the sample size suggested a
INFLUENCES OF COACHING KNOWLEDGE 21
simplified version of the hierarchical structure to allow more information to be available for
estimation of other, more interesting components in the model.
The Model
In order to separate the impacts of differences between coaches and variation in coaches
over time, two versions of quantitative explanatory variables (predictors) were considered. We
decomposed the variability in the predictors into differences between coaches (aggregated to the
mean for each coach on the variables) and variability over time for the coach (using the
“centered” versions of the variables for each coach). Predictive variables were “centered” by
subtracting the mean for each coach from their raw values (that vary over time) on the variables.
The centered versions of the variables are Level 1 predictors (they vary over time), while the
means for the coaches are Level 3 predictors, which do not vary over time or by teacher.
Coaching measures from the CKS (coaching knowledge), CSI (coaching skills), and MKT
(mathematics knowledge) were all used in both their aggregated and centered versions in the
models. The aggregated versions explored the potential for differences in the coach to explain
differences in the teachers. The centered versions explored whether the variation in coaches over
time is related to the variation in teachers over time.
We employed linear mixed models (Pinheiro & Bates, 2000; Singer & Willett, 2003;
Bickel, 2007) to fit all the multilevel hierarchical models, estimated using the lme4 package
(Bates, Maechler, Bolker, & Walker, 2014) in R. Cumulative probit mixed models were used for
the ITCOP capsule response (Agresti, 2010) and were estimated using the ordinal package
(Christensen, 2012).
The 3-level model for each response variable y for the ith measurement on the jth teacher
for the kth coach is:

INFLUENCES OF COACHING KNOWLEDGE 22
Level 1 (variation in teachers over time):
y ijk=β jk+β2 CoachingIntensityCenteredijk+ β4CKScentered ijk+β6CSIcentered ijk+ β8CMKTcentered ijk+β9 CoachPDijk+ β10 CoachOutsideMathijk+β11TeacherOutsideMathijk+εijk
Level 2 (teacher level): β jk=β0 k+β1CoachingIntensityMean jk+γ jk
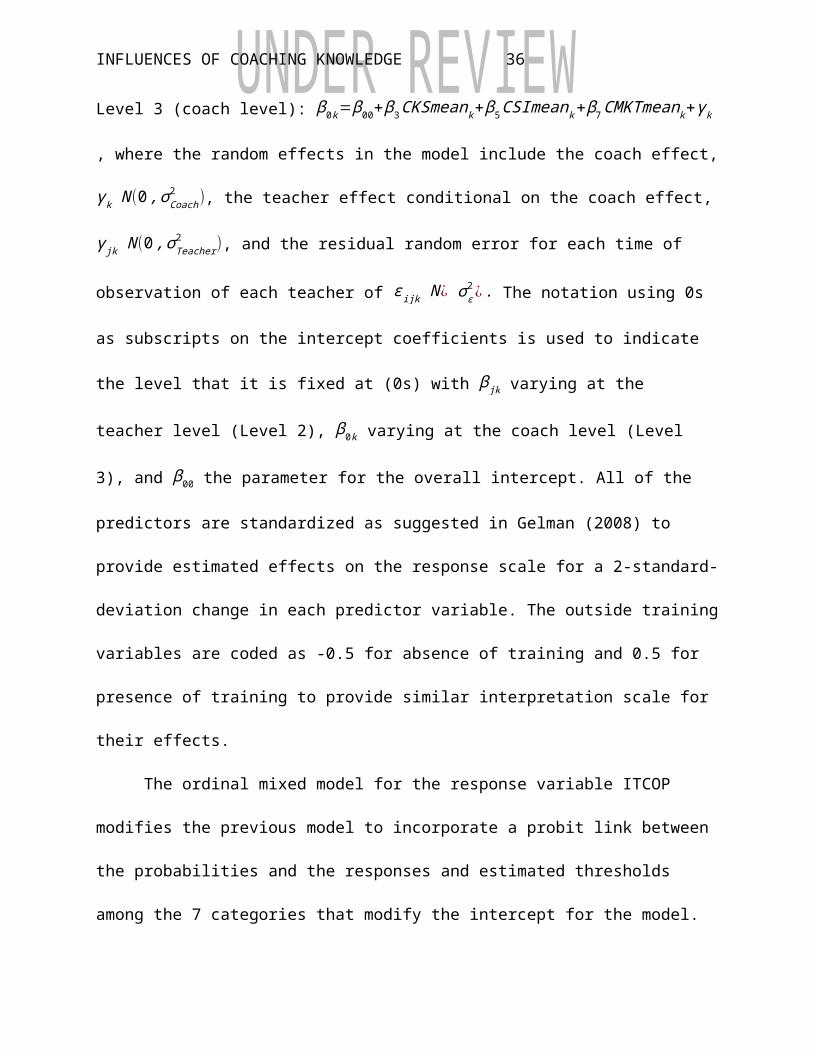
Level 3 (coach level): β0k=β00+β3CKSmeank+β5CSImeank +β7CMKTmeank+γ k, where the
random effects in the model include the coach effect, γk N (0 , σCoach2 ), the teacher effect
conditional on the coach effect, γ jk N (0 , σTeacher2 ), and the residual random error for each time of
observation of each teacher of ε ijk N ¿ σ ε2¿ . The notation using 0s as subscripts on the intercept
coefficients is used to indicate the level that it is fixed at (0s) with β jk varying at the teacher level
(Level 2), β0 k varying at the coach level (Level 3), and β00 the parameter for the overall
intercept. All of the predictors are standardized as suggested in Gelman (2008) to provide
estimated effects on the response scale for a 2-standard-deviation change in each predictor
variable. The outside training variables are coded as -0.5 for absence of training and 0.5 for
presence of training to provide similar interpretation scale for their effects.
The ordinal mixed model for the response variable ITCOP modifies the previous model
to incorporate a probit link between the probabilities and the responses and estimated thresholds
among the 7 categories that modify the intercept for the model. Because of the similarity of
reported results to those from linear mixed models, further details are omitted but are available
upon request.
Results
Our findings suggest that improvements over time in coaches’ self-assessment of
mathematics coaching skills (CSI) were positively related to all three of the teacher response
variables. As coaches’ assessment of their mathematics coaching skills increased, so did
teachers’ mathematics knowledge (MKT), teachers’ self-efficacy (TS), and teachers’ use of
INFLUENCES OF COACHING KNOWLEDGE 23
standards-based practices (ITCOP). These effects were also detected when we analyzed subsets
of the data, covering just the first 3 and then the first 4 years. This indicates to us that the effects
of coaching on teachers’ knowledge and practice can be detected on a shorter term than 5 years.
Improvements in coaches’ alignment with the recommendations of predominant coaching texts
(CKS) were related to increases in teachers’ mathematics knowledge for teaching number and
operation (MKT). We found no evidence that changes in coaches’ MKT scores explained
variation in any of our models for teacher measures.
In terms of control variables, we found no evidence that coaches’ outside professional
development in coaching knowledge was positively related to changes in our teacher measures,
even though many of our coaches reported having considerable amounts of such training.
Teachers’ outside professional development in mathematics was related to increases in teachers’
self-efficacy (TS) and improvements in teachers’ use of standards-based practices (ITCOP).
Coaching Variables That Explain Changes in Preparedness, Anxiety, and Self-Efficacy for
Teaching Mathematics
We saw improvements in teachers’ TS scores (measuring teachers’ preparedness, anxiety,
and self-efficacy for teaching mathematics) over the course of the project, as shown in Figure 2.
Our question is not whether the TS scores went up, nor simply whether TS scores correlate to
coach measures, but instead whether changes in the coaches’ measures explain those changes.
Table 5 displays the results of our model for how changes in coach measures explain
changes in teachers’ TS ratings. In the model for the TS total scores, there was strong evidence
of a relationship between CSIcentered and TS scores (p = 0.0001). For a 2-SD change in
CSIcentered, the mean TS was estimated to change by 0.174 points (SE = 0.044). There was also
strong evidence of an effect of outside mathematics training on the TS scores (p = 0.0001), with
INFLUENCES OF COACHING KNOWLEDGE 24
a teacher who had outside professional development in a given year having an estimated mean
TS score that was higher by 0.21 points (SE = 0.053). In data sets up to Years 3 and 4, there was
similar evidence of effects of both the CSIcentered and teacher outside professional development
being related to changes in TS scores, which provides additional confidence in the strength of the
findings. There was moderate evidence of an effect of the mean coaching intensity (p = 0.026),
with higher coaching intensity related to higher TS scores, on average. None of the other effects
were suggested as being important in the model except for the random effects of teacher and
coach, with the intraclass correlation (ICC) of two measurements on the same coach of 0.072 and
the ICC of two measurements on the same teacher with the same coach of 0.66.
Coaching Variables That Explain Changes in Classroom Practice
We saw improvements in teachers’ ITCOP scores over the course of the project (Figure
3) with the median score moving from a 3 to 5 on the 7-point scale. Again, our primary question
is whether changes in the coaches’ measures explain those changes in teachers’ scores.
Table 6 displays the results of our model for how changes in coach measures explain
changes in teachers’ ITCOP ratings across the 5-year study. In Year 5, the evidence was quite
strong for a CSIcentered effect (p < 0.0001) and strong for a Teacher’s Outside Mathematics PD
effect (p = 0.0486). The CSIcentered effect was detected as important in analyses using a subset
of the data up to Years 3 and 4, and the Teacher’s Outside Mathematics PD effect was detected
as important in analyses using a subset of the data up to Year 4. None of the other effects were
suggested as being important in the model except for the random effects of teacher and coach,
with ICCs for two measurements of the same coach of 0.044 and two measurements of the same
teacher of 0.46. We found no evidence that changes in the CKS score over time were related to
changes in the ITCOP responses (p = 0.32).
INFLUENCES OF COACHING KNOWLEDGE 25
Coaching Variables That Explain Changes in Teacher Mathematics Content Knowledge
The teachers in our study began the project with average MKT scores just slightly above
the mean of the nationally normed sample (the mean of our participants was 0.107, with a
standard deviation of 0.962). We saw improvements in teachers’ MKT scores over the course of
the project, ending 0.433 standard deviations above average as seen in Figure 4. Once again, we
are concerned with whether or not changes in the coaches’ measures explain these changes to
teachers’ scores.
Table 7 displays the results of our model for how changes in coach measures explain
changes in teachers’ MKT scores. CKScentered scores (p = 0.002) and CSIcentered scores (p =
0.015) showed strong evidence of relationships with changes in teacher MKT scores, both
exhibiting positive effects. For a 2-SD change in the CKS variation over time, the MKT score
was estimated to increase on average by 0.13 standard deviations of MKT. For the same increase
in the CSI variation over time, the teacher MKT mean was estimated to increase by 0.1 on the
MKT scale. These relationships were also detected in our Year 3 and Year 4 analyses, indicating
that this effect of coaching can be seen in a 3-year time span. None of the other effects were
suggested as being important in the model except for the random effects of teacher and coach,
which estimated the ICC of two measurements of the same coach of 0.072 and two
measurements of the same teacher with the same coach of 0.556.
Marginal evidence was found for a relationship with CKSmean (p = 0.054) and even
weaker evidence for CMKTmean (p = 0.090) in the same model that controls for a variety of
outside influences. While there was some evidence from the CMKT mean effect (CMKTmean)
that high-scoring coaches were associated with high-scoring teachers, which could represent an
INFLUENCES OF COACHING KNOWLEDGE 26
undetected school effect or a recruitment bias (since coaches selected the teachers they would
coach for this project), these p-values provided limited evidence of these effects.
We detected some evidence of an effect of CKSmean on the teacher MKT responses,
with a p-value of 0.054 and the estimated relationships negative. There was limited
multicollinearity in the predictors in the model, so that was not a likely cause of the reversal of
the effect from expectations. We found this puzzling. This could reflect limitations in our
instrument and the possibility that sufficient variation was not observed. Or, perhaps, coaches
with a better understanding of coaching texts (high CKS) tended to select teachers with lower
MKT (e.g., struggling teachers). Such a hypothesis is supported by the fact that improvements in
CKS (CKScentered) corresponded to improved average teacher MKT scores, although, based on
our data, explanations of why CKSmean might be negatively related to teacher MKT scores are
purely speculative.
Intensity
We were surprised that our analysis did not detect a relationship between coaching
intensity and most of the teacher variables. Because our primary analysis defined intensity as the
sum of total annual minutes in a pre- or post-lesson conference, we were worried that we may
have missed an effect. From our qualitative approaches in the study, we did have evidence that
some coaches were working with teachers in a variety of ways that did not align with our EMC
definition of coaching. For example, some coaches were holding larger-audience professional
development sessions and informal follow-ups, and some coaches were at times “coaching” the
teacher during the lesson observation with neither a formal pre-lesson conference nor a post-
lesson conference. These coaches would ask the teacher questions and offer suggestions as the
students performed individual or group work.
INFLUENCES OF COACHING KNOWLEDGE 27
As a post-hoc analysis, we replaced our measure of coaching intensity with a measure of
the number of coaching sessions in mathematics reported and reran the analysis as described
above. We then replaced this measure with the number of coaching sessions in mathematics that
were reported as involving number and operation. In both cases, the overall picture did not
change. The relationships discussed above remained intact, and these alternative measures of
intensity did not explain changes in teacher measures. We had no way of keeping track of the
other types of professional development, such as larger group trainings, so these additional
impacts were not considered.
Discussion
We set out to understand how types of coaching knowledge influence coaching
effectiveness and in what ways. We implemented interventions for coaches designed to increase
coaches’ scores on measures of mathematics knowledge for teaching and knowledge of, and
alignment with, notions of effective coaching. Our hypothesis was that improvements in
identified knowledge domains and practices would translate into improvements in coaching
effectiveness as defined by our teacher measures.
Our analysis supports the hypothesis that some types of coaching knowledge and practice
can be isolated as important to effective coaching. As coaches reported improved coaching skills,
we found that these higher scores explained improvements in all of our teacher measures:
mathematics knowledge, mathematics teaching practices, and self-efficacy. We found evidence
that as coaches reported practices that more aligned with the practices recommended by some
prominent coaching texts, teachers’ MKT scores also improved. We were unable to detect
relationships between improvements in coaches’ mathematics knowledge and mathematics
coaching effectiveness.
INFLUENCES OF COACHING KNOWLEDGE 28
Our study had a variety of limitations that should be considered when reflecting on the
findings reported here. A major limitation is the intensity of coaching, which decreased over the
course of the project and thereby decreased our sample size. By Year 5, many of our original
coach participants were no longer operating as coaches due to district personnel changes beyond
our control. We argue that this is a consequence of studying school-based coaches hired by their
districts, in contrast to the approach taken by other coaching studies that have used project-
supported coaches, school-based or otherwise. We took measures to take this low intensity into
account. We put forth our findings as a study of coaching in a broader context of how it is
currently being enacted in schools and by schools.
A second limitation is the instrumentation used to measure coaching knowledge and skill.
These were project-developed instruments because, at the time of the study, we did not find
existing instruments available. Moreover, our CKS contained two types of items: items
attempting to measure knowledge of what coaching texts recommend, and items measuring the
degree to which a coach’s practice aligns with the recommendations. Only the practice items
survived the validity and reliability analysis. Thus, our CKS might be more aptly called a
“coaching practice survey.” Another measure of coaches’ knowledge of coaching texts might
explain changes in teachers’ knowledge, views, and practices.
A third limitation is related to the control variables for coach and teacher outside
professional development. We used a binary measure of whether or not our participants had
outside professional development in a given year. We had no way of measuring the quality of the
professional development experiences. Even though our coaches and teachers reported the
amount of time spent in outside professional development, including courses, we were
uncomfortable using the total numbers of hours reported in our models. Experiences may vary
INFLUENCES OF COACHING KNOWLEDGE 29
significantly in quality and type. A more detailed measure of the quality of professional
development might produce different results in a similar study.
Our results support mathematics classroom coaching as a school-based strategy for
influencing teacher practice, knowledge, and beliefs. Though our sample of coaches was
recruited rather than selected at random, the diverse nature of the school districts whose coaches
participated in our study, combined with the way that our project studied mathematics coaches in
the varied contexts in which coaching is being enacted in those school districts, provides
evidence that the results from this study are useful in understanding coaching in varied settings.
INFLUENCES OF COACHING KNOWLEDGE 30
References
Agresti, A. (2010). Analysis of ordinal categorical data (2nd ed.). Hoboken, NJ: Wiley.
Ball, D. L., Thames, M. H., & Phelps, G. (2008). Content knowledge for teaching: What makes
it special? Journal of Teacher Education, 59(5), 389–407.
Bates, D., Maechler, M., Bolker, B., & Walker, S. (2014). lme4: Linear mixed-effects models
using Eigen and S4 (R package version 1.1-6). Retrieved from
http://cran.r-project.org/web/packages/lme4/index.html
Biancarosa, G., & Bryk, A. S. (2011). Efficacy of literacy collaborative professional
development: A summary of findings. Journal of Reading Recovery, Spring, 25–32.
Bickel, R. (2007). Multilevel analysis for applied research: It’s just regression! New York, NY:
Guilford.
Campbell, P. F., & Malkus, N. N. (2011). The impact of elementary mathematics coaches on
student achievement. Elementary School Journal, 111(3), 430–454.
Christensen, R. H. B. (2012). ordinal: Regression models for ordinal data (R package version
2012.01-19). Retrieved from http://www.cran.r-project.org/package=ordinal/
Costa, A. L., & Garmston, R. J. (2002). Cognitive coaching: A foundation for renaissance
schools. Norwood, MA: Christopher-Gordon.
Gelman, A. (2008). Scaling regression inputs by dividing by two standard deviations. Statistics
in Medicine, 27(15), 2865–2873.
Greenwood, M., & Jesse, D. (in press). (2014). Scoring and then analyzing or analyzing while
scoring: An application of GLMM to an education instrument development and analysis.
In JSM Proceedings, Statistical Computing Section. Alexandria, VA: American
Statistical Association.
INFLUENCES OF COACHING KNOWLEDGE 31
Hill, H. C., Blunk, M. L., Charalambous, C. Y., Lewis, J. M., Phelps, G. C., Sleep, L., & Ball, D.
L. (2008). Mathematical knowledge for teaching and the mathematical quality of
instruction: An exploratory study. Cognition and Instruction, 26(4), 430–511.
Hill, H. C., Rowan, B., & Ball, D. L. (2005). Effects of teachers’ mathematical knowledge for
teaching on student achievement. American Educational Research Journal, 42(2), 371–
406.
Hill, H. C., Schilling, S. G., & Ball, D. L. (2004). Developing measures of teachers’ mathematics
knowledge for teaching. The Elementary School Journal, 105(1), 11–30.
Horizon Research Inc. (2000). Validity and reliability information for the LSC Classroom
Observation Protocol. Retrieved from http://www.horizon-research.com/LSC/news/
cop_validity_2000.pdf
Hull, T. H., Balka, D. S., & Miles, R. H. (2009). A guide to mathematics coaching: Processes for
increasing student achievement. Thousand Oaks, CA: Corwin Press.
Knight, J. (2007). Instructional coaching: A partnership approach to improving instruction.
Thousand Oaks, CA: Corwin Press.
Neuman, S. B., & Wright, T. S. (2010). Promoting language and literacy development for early
childhood educators: A mixed-methods study of coursework and coaching. The
Elementary School Journal, 111(1), 63–86.
Pinheiro, J. C., & Bates, D. M. (2000). Mixed-effects models in S and S-Plus. New York, NY:
Springer.
Powell, D. R., & Diamond, K. E. (2011). Improving the outcomes of coaching-based
professional development interventions. In S. B. Neuman & D. K. Dickinson (Eds.),
Handbook of early literacy research: Vol. 3 (pp. 295–307). New York, NY: Guilford.
INFLUENCES OF COACHING KNOWLEDGE 32
Ramey, S. L, Crowell, N. A., Ramey, C. T., Grace, C., Timraz, N., & Davis, L. E. (2011). The
dosage of professional development for early childhood professionals: How the amount
and density of professional development may influence its effectiveness. In J. A. Sutterby
(Ed.), The early childhood educator professional development grant: Research and
practice (pp. 11–32). Cambridge, MA: Emerald.
Revelle, W. (2014). psych: Procedures for personality and psychological research (R package
version 1.4.8). Retrieved from http://cran.r-project.org/package=psych
Rizopoulos, D. (2006). ltm: An R package for latent variable modeling and item response theory
analyses. Journal of Statistical Software, 17(5), 1–25.
Singer, J. D., & Willett, J. B. (2003). Applied longitudinal data analysis: Modeling change and
event occurrence. New York, NY: Oxford University Press.
Sutton, J. T., Burroughs, E. A., & Yopp, D. A. (2011). Mathematics coaching knowledge:
Domains and definitions. Journal of Mathematics Education Leadership, 13(2), 12–20.
U.S. Department of Education, Institute of Education Sciences, National Center for Education
Statistics. (2012). Common Core of Data (CCD) [Data file]. Retrieved from
http://nces.ed.gov/ccd/districtsearch/
Weiss, I. R., Pasley, J. D., Smith, P. S., Banilower, E. R., & Heck, D. J. (2003). Looking inside
the classroom: A study of K–12 mathematics and science education in the United States.
Retrieved from the Horizon Research Inc. website:
http://www.horizon-research.com/insidetheclassroom/reports/looking/complete.pdf
West, L., & Staub, F. C. (2003). Content-focused coaching: Transforming mathematics lessons.
Portsmouth, NH: Heinemann.

INFLUENCES OF COACHING KNOWLEDGE 33
Table 1
EMC Project Participation, Years 1–5
Year 1 Year 2 Year 3 Year 4 Year 5
Coaches a,c 47 50 49 48 45
Teachers b,c 125 146 139 133 121
a Coaches in the data set as analyzed (n = 51) were added as late as Year 2, and some coaches
included in the data set withdrew from the project during Years 1–4.
b Teachers in the data set as analyzed (n = 180) were added as late as the start of Year 4 to
replace any teachers who withdrew from the project during Years 1–4. This was done to
maintain three teachers per coach whenever possible.
c Coaches and teachers worked in 28 districts across Colorado, Georgia, Idaho, Montana,
Nebraska, North Dakota, Washington, and Wisconsin.
INFLUENCES OF COACHING KNOWLEDGE 34
Table 2
Summary of Demographics for the 28 EMC Participating Districts
Percentage of students in the district meeting each characteristic
Characteristic
reported
0%–24% 25%–49% 50%–74% 75%–100%
Eligibility for
free or reduced
lunch a
2 12 6 7
Hispanic b 26 1 0 1
Native American 21 1 1 5
Black 27 0 0 1
a Data supplied by districts or state departments of education. Not available for one rural district
(data suppressed for privacy reasons).
b Ethnicity data from U.S. Department of Education (2012).

INFLUENCES OF COACHING KNOWLEDGE 35
Table 3
Sample CKS Items
Item Item type Scoring
I encourage teachers to include, in each
lesson they teach, summaries of what
students learned or discovered.
Reported practice
with teachers
To the right of neutral
(agreeing) scored as
conforming.
I reflect on state assessment data to
identify curriculum areas that need to be
strengthened.
Reported practice
with data
To the right of neutral
(agreeing) scored as
conforming.
I meet with the principal to discuss the
school’s vision for mathematics
instruction.
Reported practice
with principal
To the right of neutral
(agreeing) scored as
conforming.
INFLUENCES OF COACHING KNOWLEDGE 36
Table 4
How Variables Were Used and Transformed in Models
Variable Type of score usedDecomposed into
mean and variation over time?
Teacher ID Identifier
Coach ID Identifier
PD of Coach Group 1 or Group 2
CKS IRT score X
CSI Mean of ratings X
Coach MKT IRT score X
Coaching Intensity Sum of minutes in pre- plus post-lesson
conferences for each year
X
Coach’s Outside
Coaching PD
1 if any, 0 otherwise
Coach’s Outside
Mathematics PD or
Courses
1 if any, 0 otherwise
Teacher’s Outside
Mathematics PD or
Courses
1 if any, 0 otherwise
Time Categories 1, 2, 3, 4, or 5
Teacher MKT IRT score
ITCOP Capsule rating converted to 7-point scale
TS Mean of ratings
INFLUENCES OF COACHING KNOWLEDGE 37
Table 5
Standardized Model Coefficients and p-Values for Fixed Effects in the TS Total Score Model
Standardized effect Estimate
SE t value DF p-value
Intercept 5.359 0.064 6.28 48.3 <0.0001***
CIntMean 0.275 0.122 2.26 116.6 0.0256*
CIntCentered 0.069 0.040 1.71 475.1 0.0881
CKSmean -0.115 0.146 -0.79 50.0 0.4321
CKScentered 0.032 0.043 0.73 484.0 0.4659
CSImean 0.043 0.147 0.29 48.3 0.7711
CSIcentered 0.174 0.044 3.97 491.1 0.0001***
CMKTmean 0.055 0.127 0.44 38.1 0.6663
CMKTcentered 0.037 0.041 0.90 482.4 0.3685
CoachOutsideCoachPD -0.001 0.050 -0.02 535.9 0.9823
CoachOutsideMath -0.081 0.055 -1.46 517.1 0.1448
TeacherOutsideMath 0.211 0.053 4.00 543.0 0.0001***
*p<0.05. ***p < 0.001.
INFLUENCES OF COACHING KNOWLEDGE 38
Table 6
Standardized Model Coefficients and p-Values for Fixed Effects in the ITCOP Capsule Rating
Model
Standardized effect Estimate SE z-value p-value
CIntMean 0.2466 0.1768 1.40 0.1629
CIntCentered 0.0627 0.0849 0.74 0.4607
CKSmean -0.1475 0.2088 -0.71 0.4799
CKScentered 0.0897 0.0908 0.99 0.3228
CSImean 0.0382 0.2075 0.18 0.8541
CSIcentered 0.4884 0.0932 5.24 <0.0001***
CMKTmean -0.0504 0.1836 -0.27 0.7838
CMKTcentered 0.0607 0.1128 0.54 0.5906
CoachOutsideCoachPD 0.0337 0.1013 0.33 0.7393
CoachOutsideMath -0.0339 0.1122 -0.30 0.7628
TeacherOutsideMath 0.2105 0.1067 1.97 0.0486*
*p < 0.05. ***p < 0.001.
INFLUENCES OF COACHING KNOWLEDGE 39
Table 7
Standardized Model Coefficients and p-Values for Fixed Effects in the Teacher MKT Model
Standardized effect Estimate
SE t value DF p-value
Intercept 0.276 0.070 -0.88 37.9 0.3842
CIntMean 0.101 0.132 0.76 119.5 0.4461
CIntCentered 0.020 0.038 0.54 480.0 0.5907
CKSmean -0.318 0.160 -1.99 38.4 0.0541
CKScentered 0.127 0.041 3.11 488.0 0.0020*
CSImean 0.111 0.162 0.69 38.0 0.4978
CSIcentered 0.101 0.041 2.45 494.2 0.0148*
CMKTmean 0.245 0.140 1.76 27.6 0.0897
CMKTcentered 0.042 0.039 1.09 487.2 0.2763
CoachOutsideCoachPD 0.007 0.047 0.15 521.2 0.8838
CoachOutsideMath 0.059 0.053 1.12 503.7 0.2647
TeacherOutsideMath 0.058 0.050 1.16 530.3 0.2487
*p < 0.05. ***p < 0.001.
INFLUENCES OF COACHING KNOWLEDGE 40
Figure 1. Boxplots with means (circles) and 95% confidence intervals for the CKS scores by
year of study, 1 to 5. The pilot data set was scored to have a mean of 0, and the study participants
mean increases from 1 standard deviation below 0 to 0.5 standard deviations below 0.

INFLUENCES OF COACHING KNOWLEDGE 41
Figure 2. Boxplots with means (circles) and 95% confidence intervals for the TS scores by year
of study, 1 to 5.

INFLUENCES OF COACHING KNOWLEDGE 42
Figure 3. Boxplots with means (circles) and 95% confidence intervals for the ITCOP scores by
year of study, 1 to 5. Original 7-point Likert scale converted to numerical scores to make this
plot consistent with other results.
INFLUENCES OF COACHING KNOWLEDGE 43
Figure 4. Boxplots with means (circles) and 95% confidence intervals for the teacher MKT
scores by year of study, 1 to 5.