oecd/nrc benchmark based on nupec pwr … · nupec pwr subchannel and bundle tests ... power to the...
TRANSCRIPT

NEA/NSC/DOC(2010)1
NEA NUCLEAR SCIENCE COMMITTEE NEA COMMITTEE ON SAFETY OF NUCLEAR INSTALLATIONS
OECD/NRC BENCHMARK BASED ON NUPEC PWR SUBCHANNEL AND
BUNDLE TESTS (PSBT)
Volume I: Experimental Database and Final Problem Specifications
A. Rubin, A. Schoedel, M. Avramova Nuclear Engineering Program
The Pennsylvania State University University Park, PA 16802, USA
H. Utsuno Japan Nuclear Energy Safety Organization
Kamiya-cho MT Bldg., 4-3-20, Toranomon, Minato-ku, Tokyo, 105-0001, Japan
S. Bajorek, A. Velazquez-Lozada US NRC
November 2010
US NRC OECD Nuclear Energy Agency

ii
ORGANISATION FOR ECONOMIC CO-OPERATION AND DEVELOPMENT
Pursuant to Article 1 of the Convention signed in Paris on 14th December 1960, and which came into force on 30th
September 1961, the Organisation for Economic Co-operation and Development (OECD) shall promote policies designed:
to achieve the highest sustainable economic growth and employment and a rising standard of living in Member countries, while maintaining financial stability, and thus to contribute to the development of the world economy;
to contribute to sound economic expansion in Member as well as non-member countries in the process of economic development; and
to contribute to the expansion of world trade on a multilateral, non-discriminatory basis in accordance with international obligations.
The original Member countries of the OECD are Austria, Belgium, Canada, Denmark, France, Germany, Greece, Iceland, Ireland, Italy, Luxembourg, the Netherlands, Norway, Portugal, Spain, Sweden, Switzerland, Turkey, the United Kingdom and the United States. The following countries became Members subsequently through accession at the dates indicated hereafter; Japan (28th April 1964), Finland (28th January 1969), Australia (7th June 1971), New Zealand (29th May 1973), Mexico (18th May 1994), the Czech Republic (21st December 1995), Hungary (7th May 1996), Poland (22nd November 1996) and the Republic of Korea (12th December 1996). The Commission of the European Communities takes part in the work of the OECD (Article 13 of the OECD Convention).
NUCLEAR ENERGY AGENCY
The OECD Nuclear Energy Agency (NEA) was established on 1st February 1958 under the name of OEEC European Nuclear Energy Agency. It received its present designation on 20th April 1972, when Japan became its first non-European full Member. NEA membership today consists of all OECD Member countries, except New Zealand and Poland. The Commission of the European Communities takes part in the work of the Agency.
The primary objective of the NEA is to promote co-operation among the governments of its participating countries in furthering the development of nuclear power as a safe, environmentally acceptable and economic energy source.
This is achieved by:
encouraging harmonization of national regulatory policies and practices, with particular reference to the safety of nuclear installations, protection of man against ionising radiation and preservation of the environment, radioactive waste management, and nuclear third party liability and insurance;
assessing the contribution of nuclear power to the overall energy supply by keeping under review the technical and economic aspects of nuclear power growth and forecasting demand and supply for the different phases of the nuclear fuel cycle;
developing exchanges of scientific and technical information particularly through participation in common services;
setting up international research and development programmes and joint undertakings.
In these and related tasks, the NEA works in close collaboration with the International Atomic Energy Agency in Vienna, with which it has concluded a Co-operation Agreement, as well as with other international organisations in the nuclear field.
© OECD 2009 Permission to reproduce a portion of this work for non-commercial purposes or classroom use should be obtained
through the Centre français d’exploitation du droit de copie (CCF), 20, rue des Grands-Augustins, 75006 Paris, France, Tel. (33-1) 44 07 47 70, Fax (33-1) 46 34 67 19, for every country except the United States. In the United States permission should be obtained through the Copyright Clearance Center, Customer Service, (508)750-8400, 222 Rosewood Drive, Danvers, MA 01923, USA, or CCC Online: http://www.copyright.com/. All other applications for permission to reproduce or translate all or part of this book should be made to OECD Publications, 2, rue André-Pascal, 75775 Paris Cedex 16, France.

Foreword
The need to refine models for best-estimate calculations, based on good-quality experimental data, has been expressed in many recent meetings in the field of nuclear applications. The needs arising in this respect should not be limited to the currently available macroscopic methods but should be extended to next-generation analysis techniques that focus on more microscopic processes. One of the most valuable databases identified for the thermal-hydraulics modeling was developed by the Nuclear Power Engineering Corporation (NUPEC), Japan, which includes subchannel void fraction and departure from nucleate boiling (DNB) measurements in a representative Pressurized Water Reactor (PWR) fuel assembly. Part of this database is made available for this international benchmark activity entitled as the NUPEC PWR Subchannel and Bundle Tests (PSBT) benchmark. This international project is officially approved by the Japan Ministry of Economy, Trade, and Industry (METI), U.S. Nuclear Regulatory Commission (NRC), and endorsed by the OECD/NEA. The benchmark team is organized based on the collaboration between Japan and USA. A large number of international experts have agreed to participate in this program.
The fine-mesh high-quality subchannel void fraction and departure from nucleate boiling data encourages advancement in understanding and modeling complex flow behavior in real bundles. Considering that the present theoretical approach is relatively immature, the benchmark specification is designed so that it will systematically assess and compare the participants’ analytical models on the prediction of detailed void distributions and DNB. The development of truly mechanistic models for DNB prediction is currently underway. The benchmark problem includes both macroscopic and microscopic measurement data. In this context, the subchannel grade void fraction data are regarded as the macroscopic data and the digitized computer graphic images are the microscopic data, which provides void distribution within a subchannel.
The NUPEC PSBT benchmark consists of two parts (phases). Each part is consisting of different exercises:
Phase I – Void Distribution Benchmark Exercise 1 – Steady-state single subchannel benchmark Exercise 2 – Steady-state bundle benchmark Exercise 3 – Transient bundle benchmark Exercise 4 – Pressure drop benchmark
Phase II – DNB Benchmark Exercise 1 – Steady-state fluid temperature benchmark Exercise 2 – Steady-state DNB benchmark Exercise 3 – Transient DNB benchmark
This report provides the specifications for the international OECD/NRC NUPEC PSBT benchmark problem. The specification report is prepared jointly by the Pennsylvania State University (PSU), USA and Japan Nuclear Energy Safety (JNES) Organization, in cooperation with US NRC and NEA/OECD. The work is sponsored by the US NRC, METI-Japan, NEA/OECD, and the Nuclear Engineering Program (NEP), Pennsylvania State University. The specifications cover the four exercises of Phase I, and the three exercises of Phase II. In addition, a CD-ROM has also been prepared with the complete NUPEC PWR database and is distributed along with the specifications to the participants, who have signed the NEA/OECD confidentiality agreement. The agreement as well as the other related information about the OECD/NRC PSBT benchmark can be found at:
http://www.nea.fr/html/science/egrsltb/PSBT/.
3

Acknowledgments
The authors would like to thank Prof. Hideki Nariai – President of the JNES, Japan, whose support and encouragement in establishing and carrying out this benchmark are invaluable.
This report is the sum of many efforts including the funding agencies and their staff – the METI, Japan, US NRC and the Organization of Economic Co-operation and Development (OECD). Special appreciation goes to the report reviewer: Prof. Kostadin Ivanov from Pennsylvania State University (PSU). His comments, corrections, and suggestions were very valuable and significantly improved the quality of this report.
The authors wish to express their sincere appreciation for the outstanding support offered by the JNES personnel in providing the test data and discussing the test characteristics.
The authors would like to acknowledge and thank Westinghouse Electric Company, Pittsburgh, PA, USA and Mr. Robert Salko, a PhD candidate at PSU, for their outstanding technical assistance and work in the preparation of the spacer grid data for this benchmark.
Particularly noteworthy are the efforts of Dr. Chris Hoxie and Dr. Jenifer Uhle from US NRC. With their help funding is secured, enabling this project to proceed. We also thank them for their excellent technical advice and assistance.
The authors would like to thank Dr. A. Hotta from TEPSYS, Japan, Prof. J. Aragones from Universidad Politecnica Madrid (UPM), Spain – member of NSC /NEA, and Prof. F. D’Auria of University of Pisa (UP), Italy – member of CSNI/NEA, whose support and encouragement in establishing and carrying out this benchmark are invaluable.
Finally, we are grateful to Cristina Lebunetelle from NEA/OECD for having devoted her competence and skills to the final editing of this report.
4

TABLE OF CONTENTS
Foreword ......................................................................................................................................... 3 Acknowledgments ........................................................................................................................... 4 TABLE OF CONTENTS ................................................................................................................ 5 List of Figures ................................................................................................................................. 7 List of Tables................................................................................................................................... 9 Chapter 1 INTRODUCTION ....................................................................................................... 11 1.1 Background ............................................................................................................................. 11 1.2 Objective ................................................................................................................................. 11 1.3 Outline of the PSBT Specification .......................................................................................... 12 1.4 Definition of Benchmark Phases ............................................................................................. 12 1.4.1 Phase I - Void Distribution Benchmark ............................................................................... 12 1.4.2 Phase II - Departure from Nucleate Boiling (DNB) Benchmark ......................................... 13 1.5 Benchmark Team and Sponsorship ......................................................................................... 13 Chapter 2 TEST FACILITIES...................................................................................................... 15 2.1 General .................................................................................................................................... 15 2.2 Test Loop................................................................................................................................. 15 2.3 Test Section ............................................................................................................................. 17 2.3.1 Single Subchannel Void Distribution Measurements........................................................... 17 2.3.2 Bundle Void Distribution Measurements ............................................................................. 18 2.3.3 Bundle DNB Measurements................................................................................................. 19 2.4 Void Distribution Measurement Methods ............................................................................... 20 2.5 DNB Measurement Methods................................................................................................... 24 2.6 Studies on the Accuracy of the Void Fraction......................................................................... 24 Chapter 3 TEST ASSEMBLY DATA ......................................................................................... 29 3.1 General .................................................................................................................................... 29 3.2 Void Distribution Data ............................................................................................................ 29 3.2.1 Single Subchannel Specification .......................................................................................... 29 3.2.1.1 Heater Rod Structure for Subchannel Test Assembly ....................................................... 31 3.2.2 Bundle Specification ............................................................................................................ 31 3.2.2.1 Heater Rod Structure for Bundle Test Assembly .............................................................. 35 3.2.2.2 Spacer Grid Data ............................................................................................................... 36 3.3 DNB Measurement.................................................................................................................. 46 3.4 Thermo-Mechanical Properties ............................................................................................... 52 3.4.1 Properties of Inconel 600...................................................................................................... 52 3.4.2 Properties of Alumina........................................................................................................... 52 3.4.3 Properties of Titanium.......................................................................................................... 52 Chapter 4 BENCHMARK PHASES AND EXERCISES ............................................................. 53 4.1 Introduction ............................................................................................................................. 53 4.2 Phase I - Void Distribution Benchmark .................................................................................. 55 4.2.1 Exercise I-1 – Steady-State Single Subchannel Benchmark ................................................ 55 4.2.2 Exercise I-2 – Steady-State Bundle Benchmark................................................................... 60 4.2.3 Exercise I-3 – Transient Bundle Benchmark........................................................................ 68 4.2.4 Exercise I-4 – Pressure Drop Benchmark............................................................................. 87 4.3 Phase II: DNB Benchmark ...................................................................................................... 87 4.3.1 Exercise II-1 – Steady-State Fluid Temperature Benchmark ............................................... 87 4.3.2 Exercise II-2 – Steady-State DNB Benchmark .................................................................... 90 4.3.3 Exercise II-3 – Transient DNB Benchmark ....................................................................... 102 Chapter 5 OUTPUT REQUESTED ........................................................................................... 115 5.1 Introduction ........................................................................................................................... 115
5

5.2 Void Distribution Benchmark ............................................................................................... 115 5.3 DNB Benchmark ................................................................................................................... 118 Chapter 6 CONCLUSIONS ........................................................................................................ 120 6.1 Phase I - Void Distribution Benchmark ................................................................................ 120 6.2 Phase II - DNB Benchmark................................................................................................... 120 REFERENCES............................................................................................................................ 122
6

List of Figures
Figure 1.5.1 PSBT Benchmark Team............................................................................................ 14 Figure 2.2.1 System Diagram of NUPEC PWR Test Facility....................................................... 16 Figure 2.3.1.1 Test Section for Central Subchannel Void Distribution Measurement.................. 17 Figure 2.3.2.1 Test Section for Rod Bundle Void Distribution Measurement .............................. 18 Figure 2.4.1 Void Fraction Measurement Procedure .................................................................... 21 Figure 2.4.2 Relation between Chordal and CT Averaged Densities in bundle S1....................... 23 Figure 2.6.1 Deviation of Measured Void Fraction from Calculated Void Fraction..................... 25 Figure 2.7.1 Deviation of Experimental Quality from Calculated Quality (Method 1; S1 and S2)....................................................................................................................................................... 26 Figure 2.7.2 Deviation of Experimental Quality from Calculated Quality (Method 2; S1 and S2)....................................................................................................................................................... 26 Figure 2.7.3 Deviation of Experimental Quality from Calculated Quality (Method 2; B5).......... 27 Figure 2.7.4 Deviation of Experimental Quality from Calculated Quality (Method 2; B6).......... 27 Figure 2.7.5 Deviation of Experimental Quality from Calculated Quality (Method 2; B7).......... 27 Figure 2.7.6 Deviation of Experimental Quality from Calculated Quality (Method 2; B8).......... 28 Figure 3.2.1.1 Cross Sectional View of Subchannel Test Assembly ............................................ 30 Figure 3.2.2.1 Location of Pressure Taps...................................................................................... 33 Figure 3.2.2.2 Radial Power Distribution Type A......................................................................... 34 Figure 3.2.2.3 Radial Power Distribution Type B......................................................................... 34 Figure 3.2.2.1.1 Cross Section of Bundle Heater Rod .................................................................. 35 Figure 3.2.2.2.1 Three-Dimensional View of the Simple Spacer.................................................. 37 Figure 3.2.2.2.2 Three-Dimensional View of the Non-Mixing Vane Spacer................................ 38 Figure 3.2.2.2.3 Three-Dimensional View of the Mixing Vane Spacer........................................ 39 Figure 3.2.2.2.4 Dimensions of the Simple Spacer ....................................................................... 40 Figure 3.2.2.2.5 Dimensions of the Non-Mixing Vane Spacer ..................................................... 41 Figure 3.2.2.2.3 Dimensions of the Mixing Vane Spacer ............................................................. 44 Figure 3.3.1 Radial Power Distribution Type C............................................................................ 49 Figure 3.3.2 Radial Power Distribution Type D............................................................................ 49 Figure 3.3.5 Location of Thermocouples for Test Assemblies ..................................................... 50 Figure 3.3.6 Fluid Temperature Measurements............................................................................. 51 Figure 4.2.3.1 Variation of Properties during Transient for Data Series 5T (Power Increase) ..... 71 Figure 4.2.3.2 Variation of Properties during Transient for Data Series 5T (Flow Reduction) .... 71 Figure 4.2.3.3 Variation of Properties during Transient for Data Series 5T (Depressurization)... 74 Figure 4.2.3.4 Variation of Properties during Transient for Data Series 5T (Temperature Increase)....................................................................................................................................................... 74 Figure 4.2.3.5 Variation of Properties during Transient for Data Series 6T (Power Increase) ..... 77 Figure 4.2.3.6 Variation of Properties during Transient for Data Series 6T (Flow Reduction) .... 77 Figure 4.2.3.7 Variation of Properties during Transient for Data Series 6T (Depressurization)... 80 Figure 4.2.3.8 Variation of Properties during Transient for Data Series 6T (Temperature Increase)....................................................................................................................................................... 80 Figure 4.2.3.9 Variation of Properties during Transient for Data Series 7T (Power Increase) ..... 83 Figure 4.2.3.10 Variation of Properties during Transient for Data Series 7T (Flow Reduction) .. 83 Figure 4.2.3.11 Variation of Properties during Transient for Data Series 7T (Depressurization). 86 Figure 4.2.3.12 Variation of Properties during Transient for Data Series 7T (Temperature Increase) ........................................................................................................................................ 86 Figure 4.3.3.1 Variation of Properties during Transient for Data Series 11T (Power Increase) . 105 Figure 4.3.3.2 Variation of Properties during Transient for Data Series 11T (Flow Reduction) 105 Figure 4.3.3.3 Variation of Properties during Transient for Data Series 11T (Depressurization)108
7

Figure 4.3.3.4 Variation of Properties during Transient for Data Series 11T (Temperature Increase) ...................................................................................................................................... 108 Figure 4.3.3.5 Variation of Properties during Transient for Data Series 12T (Power Increase) . 111 Figure 4.3.3.6 Variation of Properties during Transient for Data Series 12T (Flow Reduction) 111 Figure 4.3.3.7 Variation of Properties during Transient for Data Series 12T (Depressurization)114 Figure 4.3.3.8 Variation of Properties during Transient for Data Series 12T (Temperature Increase) ...................................................................................................................................... 114
8

List of Tables
Table 2.2.1 Range of NUPEC PWR Test Facility Operating Conditions ..................................... 15 Table 2.2.2 Transient Parameters of NUPEC PWR Test Facility ................................................. 15 Table 2.2.3 Reference Rated Operating Conditions of PWR ........................................................ 16 Table 2.3.2.1 Test Vessel and Flow Channel Structure Data ........................................................ 19 Table 2.3.2.2 Manufacturing Tolerances for Test Assembly ........................................................ 19 Table 2.4.1 Estimated Accuracy for Void Fraction Measurements............................................... 22 Table 2.4.2 Error Sources for Void Measurements ....................................................................... 22 Table 2.4.3 Number of Gamma Ray Beams.................................................................................. 23 Table 2.4.4 Time Required to Perform Void Fraction Measurements .......................................... 23 Table 2.5.1 Estimated Accuracy for DNB Measurements ............................................................ 24 Table 3.2.1 Test Assemblies for Void Fraction Measurements..................................................... 29 Table 3.2.1.1 Geometry and Power Shape for Test Assembly S1, S2, S3, and S4 ....................... 30 Table 3.2.1.2 Geometric Characteristics of Subchannel Assemblies ............................................ 31 Table 3.2.1.1.1 Heater Rod Structure for Subchannel Test Assembly .......................................... 31 Table 3.2.2.1 Geometry and Power Shape for Test Assembly B5, B6, and B7 ............................ 32 Table 3.2.2.2 Axial Power Distribution (Cosine).......................................................................... 34 Table 3.2.2.1.1 Heater Rod Structure for Bundle Test Assembly ................................................. 35 Table 3.2.2.2.1 Bundle Average Spacer Pressure Loss Coefficients............................................. 36 Table 3.3.1 Test Assemblies for DNB Measurements .................................................................. 46 Table 3.3.2 Geometry and Power Shape for Test Assembly A0................................................... 47 Table 3.3.3 Geometry and Power Shape for Test Assembly A1, A2, and A3 .............................. 48 Table 3.3.4 Geometry and Power Shape for Test Assembly A4, A8, A11, and A12.................... 49 Table 4.1.1 NUPEC PSBT Benchmark Database ......................................................................... 54 Table 4.1.2 Benchmark Conditions ............................................................................................... 54 Table 4.2.1 Test Series for Void Fraction Measurement............................................................... 55 Table 4.2.1.1 Test Conditions for Steady-State Void Measurement Test Series 1........................ 56 Table 4.2.1.2 Test Conditions for Steady-State Void Measurement Test Series 2........................ 57 Table 4.2.1.3 Test Conditions for Steady-State Void Measurement Test Series 3........................ 58 Table 4.2.1.4 Test Conditions for Steady-State Void Measurement Test Series 4........................ 59 Table 4.2.2.1 Test Conditions for Steady-State Void Measurement Test Series 5........................ 60 Table 4.2.2.2 Test Conditions for Steady-State Void Measurement Test Series 6........................ 62 Table 4.2.2.3 Test Conditions for Steady-State Void Measurement Test Series 7........................ 64 Table 4.2.2.4 Test Conditions for Steady-State Void Measurement Test Series 8........................ 66 Table 4.2.2.5 Duplicated Cases in Test Series B5 and B8 ............................................................ 67 Table 4.2.3.1 Test Conditions for Transient Void Measurement Test Series 5T, 6T, 7T ............. 68 Table 4.2.3.2 Transient Void Fraction in Rod Bundle Test Series 5T (Power Increase) .............. 69 Table 4.2.3.3 Transient Void Fraction in Rod Bundle Test Series 5T (Flow Reduction) ............. 70 Table 4.2.3.4 Transient Void Fraction in Rod Bundle in Test Series 5T (Depressurization)........ 72 Table 4.2.3.5 Transient Void Fraction in Rod Bundle in Test Series 5T (Temperature Increase) 73 Table 4.2.3.6 Transient Void Fraction in Rod Bundle in Test Series 6T (Power Increase) .......... 75 Table 4.2.3.7 Transient Void Fraction in Rod Bundle in Test Series 6T (Flow Reduction) ......... 76 Table 4.2.3.8 Transient Void Fraction in Rod Bundle in Test Series 6T (Depressurization)........ 78 Table 4.2.3.9 Transient Void Fraction in Rod Bundle in Test Series 6T (Temperature Increase) 79 Table 4.2.3.10 Transient Void Fraction in Rod Bundle in Test Series 7T (Power Increase) ........ 81 Table 4.2.3.11 Transient Void Fraction in Rod Bundle in Test Series 7T (Flow Reduction) ....... 82 Table 4.2.3.12 Transient Void Fraction in Rod Bundle in Test Series 7T (Depressurization)...... 84
9

Table 4.2.3.13 Transient Void Fraction in Rod Bundle in Test Series 7T (Temperature Increase)....................................................................................................................................................... 85 Table 4.3.1 Test Series for DNB Measurement............................................................................. 87 Table 4.3.1.1 Test Conditions for Steady-State Fluid Temperature Benchmark........................... 88 Table 4.3.2.1 Test Conditions for Steady-State DNB Test Series 0.............................................. 90 Table 4.3.2.2 Test Conditions for Steady-State DNB Test Series 2.............................................. 92 Table 4.3.2.3 Test Conditions for Steady-State DNB Test Series 3.............................................. 94 Table 4.3.2.4 Test Conditions for Steady-State DNB Test Series 4.............................................. 96 Table 4.3.2.5 Test Conditions for Steady-State DNB Test Series 8.............................................. 98 Table 4.3.2.6 Test Conditions for Steady-State DNB Test Series 13.......................................... 100 Table 4.3.3.1 Test Conditions for Transient DNB Test Series 11T and 12T .............................. 102 Table 4.3.3.2 Transient DNB Data in Rod Bundle in Test Series 11T (Power Increase) ........... 103 Table 4.3.3.3 Transient DNB Data in Rod Bundle in Test Series 11T (Flow Reduction) .......... 104 Table 4.3.3.4 Transient DNB Data in Rod Bundle in Test Series 11T (Depressurization) ......... 106 Table 4.3.3.5 Transient DNB Data in Rod Bundle in Test Series 11T (Temperature Increase) . 107 Table 4.3.3.6 Transient DNB Data in Rod Bundle in Test Series 12T (Power Increase) ........... 109 Table 4.3.3.7 Transient DNB Data in Rod Bundle in Test Series 12T (Flow Reduction) .......... 110 Table 4.3.3.8 Transient DNB Data in Rod Bundle in Test Series 12T (Depressurization) ......... 112 Table 4.3.3.9 Transient DNB Data in Rod Bundle in Test Series 12T (Temperature Increase) . 113 Table 5.2.1 Output Format of Steady-State Single Subchannel Benchmark............................... 115 Table 5.2.2 Output Format of Steady-State Bundle Benchmark ................................................. 116 Table 5.2.3 Output Format of Transient Bundle Benchmark ...................................................... 116 Table 5.2.4 Output Format of Single Subchannel Pressure Drop Benchmark ............................ 117 Table 5.2.5 Output Format of Bundle Pressure Drop Benchmark .............................................. 117 Table 5.3.1 Output Format of Steady-State Fluid Temperature Benchmark............................... 118 Table 5.3.2 Output Format of Steady-State DNB Benchmark .................................................... 118 Table 5.3.3 Output Format of Transient DNB Benchmark ......................................................... 119
10

Chapter 1 INTRODUCTION
1.1 Background
Over the last four years the Pennsylvania State University (PSU) under the sponsorship of U.S. Nuclear Regulatory Commission (NRC) has prepared, organized, conducted and summarized the OECD/NRC Benchmark based on NUPEC BWR Full-size Fine-mesh Bundle Tests (BFBT). The international benchmark activities have been conducted in cooperation with the Nuclear Energy Agency (NEA), OECD and Japan Nuclear Energy Safety (JNES) organization, Japan. From 1987 to 1995, the Nuclear Power Engineering Corporation (NUPEC) in Japan performed a series of void measurement tests using full-size mock-up tests for both BWRs and PWRs. For BWRs, based on state-of-the-art computer tomography (CT) technology, the void distribution was visualized at the mesh size smaller than the subchannel under actual plant conditions. NUPEC also performed steady-state and transient critical power test series based on the equivalent full-size mock-ups. Considering the reliability not only of the measured data, but also other relevant parameters such as the system pressure, inlet sub-cooling and rod surface temperature, these test series supplied the first substantial database for the development of truly mechanistic and consistent models for void distribution and boiling transition.
Consequently, the JNES has made available the BWR NUPEC database for the purposes of the OECD/NRC BFBT international benchmark. This international benchmark has encouraged advancement in the uninvestigated fields of two-phase flow theory with very important relevance to the nuclear reactors safety margins evaluation. The BFBT benchmark is made up of two parts (phases), each part consisting of four different exercises and has been used for validation of CFD, subchannel and system thermal-hydraulic codes. The BFBT benchmark activity has been very successful with about thirty (30) organizations from fifteen (15) countries participating in different benchmark exercises. The BFBT activity is being completed with final comparative reports to be published as US NRC NUREG and NEA/OECD reports. A special Nuclear Engineering and Design journal issue is being prepared devoted to the BFBT benchmark, which will document the models and results of the participants.
Based on the success of the OECD/NRC BFBT benchmark the JNES, Japan has decided to release also the data based on the NUPEC PWR Subchannel and Bundle Tests (PSBT) for an international benchmark and has asked PSU to organize and conduct this benchmark activity. Void fraction measurements and departure from nucleate boiling (DNB) tests were performed at NUPEC under the conditions simulating PWR thermal-hydraulic conditions, including the steady-states and the transients such as the power increase, the flow reduction, the depressurization and the temperature increase.
1.2 Objective
The established international OECD/NRC PWR Subchannel and Bundle Tests (PSBT) benchmark, based on the NUPEC database, encourages advancement in subchannel analysis of fluid flow in rod bundles, which has very important relevance to the nuclear reactor safety margin evaluation. This benchmark specification is being designed so that it can systematically assess and compare the participants’ numerical models for the prediction of detailed subchannel void distributions and departure from nucleate boiling (DNB) to full scale experimental data on a prototypical PWR rod bundle. Currently the numerical modeling of subchannel void distribution has limited theoretical approach that can be applied to a wide range of geometrical and operating
11

conditions. In the past decade, experimental and computational technologies have tremendously improved the study of the flow structure. Over the next decade, it can be expected that mechanistic approaches will be more widely applied to the complicated fluid phenomena inside fuel bundles. The development of truly mechanistic models for DNB prediction is currently underway. These models must include processes such as void distribution, droplet deposition, liquid film entrainment, and spacer grid behavior. The benchmark specification requires participants to explain their modeling correlations between the measured DNB and the flow dominant processes.
It should be recognized that the purpose of this benchmark is not only the comparison of currently available computational approaches but above-all the encouragement to develop novel next-generation approaches that focus on more microscopic processes. In this context, the subchannel grade void fraction data are regarded as the macroscopic data and the digitized computer graphic images are the microscopic data, which provides the detailed void distribution within the subchannel. This benchmark specification is supplemented by a CD-ROM with complete NUPEC PWR Benchmark Database, which is distributed to all participants who have signed the confidentiality agreement.
1.3 Outline of the PSBT Specification
Chapter 1 of this specification discusses the main objectives of the international OECD/NRC PSBT benchmark. A definition of the benchmark phases and exercises is provided.
Chapter 2 discusses the NUPEC PWR PSBT facility and the specific methods used in the void distribution and DNB measurements.
Chapter 3 provides specifications of fuel assembly types and heater rods as well as spacer data and thermo-mechanical properties of structural materials.
Chapter 4 defines the NUPEC PSBT data to be used for the benchmark exercises. In total seven exercises of two phases will be performed in the framework of this benchmark.
Chapter 5 describes the requested output and the output format that the benchmark team will collect from the participants.
Chapter 6 summarizes the conclusions of the specification.
1.4 Definition of Benchmark Phases
The test facility design and data from NUPEC includes both macroscopic and microscopic measurements. There are two separate phases, each consisting of different exercises. These phases and exercises are discussed below.
1.4.1 Phase I - Void Distribution Benchmark
The purpose of this benchmark phase is three-fold:
1) To provide data for validation of numerical models of void distribution;
2) To provide data over a wide range of geometrical and operating conditions for validation of void distribution models;
3) To provide data for development of mechanistic approaches widely applicable to the fluid phenomena inside fuel bundles.
Phase I includes four exercises:
12

Exercise 1 – Steady-state single subchannel benchmark, which can be used to improve the current models of void generation and void distribution within a subchannel.
Exercise 2 – Steady-state bundle benchmark, which can be applied to subchannel and system thermal-hydraulic codes.
Exercise 3 – Transient bundle benchmark, which can be used to determine the capabilities of subchannel and system thermal-hydraulic codes of predicting void generation during transients.
Exercise 4 – Pressure drop benchmark. Code-to-code comparisons will also be performed.
1.4.2 Phase II - Departure from Nucleate Boiling (DNB) Benchmark
The purpose of this benchmark is to develop truly mechanistic models for DNB prediction.
Phase II includes three exercises:
Exercise 1 – Steady-state fluid temperature benchmark, which can be applied to subchannel and system thermal-hydraulic codes as well as CFD codes.
Exercise 2 – Steady-state DNB benchmark, which can be used to improve the current models of DNB prediction in PWR bundles at steady-state.
Exercise 3 – Transient DNB benchmark, which can be used to improve the current models of DNB prediction in PWR bundles during transients.
1.5 Benchmark Team and Sponsorship
The benchmark activities are being performed as an international project supported by US NRC and METI (Japan), and endorsed by the OECD/NEA. The benchmark team is organized based on the collaboration between USA and Japan as shown in Figure 1. This approach has been very successful in the OECD/NRC BFBT benchmark, which has been completed. It shall be recognized that METI had sponsored the NUPEC PWR subchannel and bundle test project. JNES on behalf of METI provides the test information and measured data. OECD/NEA provides supporting activities for this international PSBT benchmark project. The US team, headed by Prof. Avramova and Prof. Ivanov from PSU, co-ordinates the benchmark project in cooperation with US NRC. The PSU team is preparing the benchmark specification, organizing the technical content of the workshops (the logistics of the workshops is being managed by NEA/OECD), answering the questions issued by participants, comparing and analyzing participants’ results and preparing comparison reports as NEA/OECD and NUREG reports. The basic activity of the US benchmark team (PSU team) is sponsored by the US NRC. In addition to the above described activities the PSU team is performing PSBT calculations using the PSU version of COBRA-TF and working in cooperation with US NRC on the development and validation of a subchannel model in TRACE using the PSBT data.
13

Figure 1.5.1 PSBT Benchmark Team
NRCOECD/NEA
Pennsylvania State UniversityPrepare Specification
Answer Participants’ QuestionsCompare Participants’ Results
Organise WorkshopsMake NUREG Reports
NUPEC JNES
Supply Test Information
Japanese Team
InternationalBenchmark Team
Authorisation as International Project
METI
US Team
Sponsoring BenchmarkSponsored Test
14

Chapter 2 TEST FACILITIES
2.1 General
The void distribution and DNB measurements took place at the facility described in Section 2.2. The facility is able to simulate the high-pressure, high-temperature fluid conditions found in PWR’s. Although the same test loop was used for both phases, different test sections were constructed to represent a single subchannel and a complete rod bundle.
2.2 Test Loop
The NUPEC test facility shown in Figure 2.2.1 consists of a high pressure and high temperature recirculation loop, a cooling loop, and instrumentation and data recording systems. The recirculation loop consists of a test section, circulation pump, preheater, steam drum (acting as a pressurizer), and a water mixer. The design pressure is 19.2 MPa and the design temperature is 362 C. The operating conditions of the test facility are shown in Table 2.2.1 and Table 2.2.2. Reference rated operating conditions of a PWR are listed in Table 2.2.3. Note that the units given for pressure in Table 2.2.3 may require conversion to more conventional units. The following conversions are to be used:
psia223.14
bar980665.0
acm
kg1
2
Table 2.2.1 Range of NUPEC PWR Test Facility Operating Conditions
Quantity Range
Pressure 4.9 – 16.6 MPa Mass Velocity 550 – 4150 kg/m2s
Inlet Coolant Temperature 140 – 345 °C
Table 2.2.2 Transient Parameters of NUPEC PWR Test Facility
Transient Scenario Transient Change
Depressurization -0.03 MPa/s
Temperature Increase 1 C/s Flow Reduction -25 %/s
Power Increase 15 %/s
15

Table 2.2.3 Reference Rated Operating Conditions of PWR
Test section Pressure (kg/cm2a)
Mass flux (106kg/m2h)
Heat flux (106kcal/m2h)
Power (MW)
Inlet temperature (°C)
55 Rod bundle
158 12 0.5 2.7 290
66 Rod bundle
158 12 0.5 3.9 290
Figure 2.2.1 System Diagram of NUPEC PWR Test Facility
16

2.3 Test Section
Three different test sections were used to perform the void distribution measurement tests; one for the subchannel void distribution test, one for the rod bundle void distribution test, and one for the bundle DNB measurements.
2.3.1 Single Subchannel Void Distribution Measurements
Figure 2.3.1.1 shows the test section used for the central subchannel void measurement. It simulates one of the subchannel types found in a PWR assembly. Coolant flows in the pressure vessel horizontally through the coolant inlet nozzle located just below the heated section. Similar test sections were used for the central with thimble, side, and corner subchannel types. The effective heated length is 1555 mm, and the void measurement section begins at 1400 mm from the bottom of the heated section [1] .
Figure 2.3.1.1 Test Section for Central Subchannel Void Distribution Measurement
He
ate
d S
ect
ion
1
55
5 m
m
14
00
mm
Measuring Section
W
W
17

2.3.2 Bundle Void Distribution Measurements
An electrically heated rod bundle was used to simulate a partial section and full length of a PWR fuel assembly. Figure 2.3.2.1 shows the test section used for the rod bundle void measurements. The effective heated length is 3658 mm, which is broken into three sections (upper, middle, lower), measuring at 3177 mm, 2669 mm, and 221 6mm, respectively. Coolant flows into the pressure vessel horizontally through the coolant inlet nozzle and down through the section between the flow channel and the pressure vessel. The coolant continues into the flow channel, flowing from the bottom of the pressure vessel up through the test assembly, where the bottom of the heated section is located 630 mm above the bottom of the pressure vessel. Table 2.3.2.1 provides data regarding the structure of the test vessel and flow channel. Table 2.3.2.2 shows the tolerances for the manufacture of the test assemblies.
Figure 2.3.2.1 Test Section for Rod Bundle Void Distribution Measurement
Upper Measurement Location: 3177 mm
Middle Measurement Location: 2669 mm
Lower Measurement Location: 2216 mm
Hea
ted
Sec
tion
365
8 m
m
630
mm
18

Figure 2.3.2.2 Cross Section of Test Vessel
W
W
Test Vessel Flow Shroud
Flow Channel
Table 2.3.2.1 Test Vessel and Flow Channel Structure Data
Item Data Inner length (mm) 64.9 Thickness (mm) 5.0
Flow Channel
Material Alumina Inner length (mm) 75.1 Thickness (mm) 10
Flow Shroud
Material SUS304 Outer diameter(mm) 216.3 Thickness (mm) 23.0
Test Vessel (Upper Cylinder)
Material SUS304 Outer diameter(mm) 318.5 Thickness (mm) 33.3
Test Vessel (Lower Cylinder)
Material SUS304
Table 2.3.2.2 Manufacturing Tolerances for Test Assembly
Item Tolerance Rod bundle
Heater rod diameter 0.02 mm Heater rod displacement 0.45 mm Flow channel inner width 0.05 mm Flow channel displacement 0.20 mm Power distribution 3 %
2.3.3 Bundle DNB Measurements
The DNB measurements were performed for full-length partial 5×5 and 6×6 array rod bundles, which simulate 17×17 PWR fuel assemblies. Measurements were performed both for steady-state and transients. The measurements were performed at the facility shown in Figure 2.2.1 using the assemblies described in Table 3.3.1 .
19

2.4 Void Distribution Measurement Methods
The detailed explanation for the void fraction measurement procedure is provided in References [2] and [3]. A brief description follows.
A gamma-ray transmission method was used to measure the density of the flow, which was converted to the void fraction of the gas-liquid two-phase flow. Figure 2.4.1 shows the procedure used to perform the void fraction measurements for the entire rod bundle. The top half of the figure shows the procedure used to perform the void fraction measurements for a single subchannel. In the subchannel experiments [3] a narrow gamma-ray beam CT scanner was used to measure the subchannel averaged void fraction and a wide gamma-ray beam was used to measure the chordal averaged void fraction. For each subchannel type - corner, side, or center – a relationship between the subchannel averaged and the chordal averaged void fractions was individually derived. These relationships were then used to correct the subchannel averaged void fraction measured with the wide beam in the bundle tests.
The void measurement systems shown in Figure 2.4.1 consist of gamma-ray sources (137Cs); detectors; collimators, and signal processing units. The attenuation of the gamma-rays, which depends on the void fraction, was detected. The intensity of the gamma-ray source was determined to obtain the count-rate of the signal processing (30×104 cps).
The CT scanner system was used to determine the distribution of density/void fraction over the subchannel at steady-state flow and to define the subchannel averaged void fraction. The system was operated by translate/rotate method. At each translation/rotation location, the intensity of gamma-ray attenuated by the object, the so-called “projection data”, was detected. An image reconstruction was then performed by a filtered back-projection algorithm to obtain the distribution of the linear attenuation coefficient. A sufficient measuring time was given in order to avoid the effect of the flow motion.
Two densitometer systems – in x- and y-directions - were used in the chordal averaged void fraction measurements in the single subchannel tests. Each of them consisted of a gamma source and a detector. They were located at the same tables (the same elevation) as CT, which was fixed during the measurements.
A multi-beam system was used to measure each subchannel void fraction of the rod bundle. Six transmission data of x-direction and six transmission data of y-direction between the rod and rod/channel wall were used to reconstruct the void fraction of the 36 subchannels by an iterative method. These subchannel void fractions corresponded to the chordal measurements of the single subchannel tests. The relationships between the subchannel averaged void fraction and the chordal averaged void fraction obtained in the single subchannel tests were used to determine the subchannel averaged void fractions in the rod bundle tests. Such measurements were performed simultaneously at three axial elevations.
Table 2.4.1 shows the estimated accuracy of the void fraction measurements. Table 2.4.2 describes the sources of error in the void measurement process (these values correspond to one standard deviation, 1).
Figure 2.4.2 was used to determine the uncertainties inherent in the void measurements and to correct the measured values based on the pressure of the test case. The correlation between the chordal and CT averaged values is given by the best-fit curves and was introduced for the high and low-pressure conditions, respectively. The reference averaged density was 500 kg/m3. The uncertainty of the correlation was determined to be less than 18 kg/m3, which was regarded as three standard deviations (3). Therefore, one standard deviation (1) is 6 kg/m3. Table 2.4.3 provides information on the gamma beams used for these measurements.
20

Table 2.4.4 shows the time required to perform the void fraction measurements.
Figure 2.4.1 Void Fraction Measurement Procedure
Subchannel Test
CT Measurement
Chordal Measurement
Bundle Test
Chordal Averaged
Ch
ann
elA
vera
ged
Used for Correction of Bundle data
Void Measurement Equipment
Subchannel Test
Bundle Test
21

Table 2.4.1 Estimated Accuracy for Void Fraction Measurements
Quantity Accuracy Process parameters
Pressure 1 % Flow 1.5% Power 1 % Fluid temperature 1 Celsius
Void fraction measurement CT measurement
Gamma-ray beam width 1 mm Subchannel averaged (steady-state) 3% void Spatial resolution of one pixel 0.5 mm
Chordal measurement Gamma-ray beam width (center) 3 mm Gamma-ray beam width (side) 2 mm Subchannel averaged (steady-state) 4% void Subchannel averaged (transient) 5% void
Table 2.4.2 Error Sources for Void Measurements
Chordal Averaged Error source Steady-state Transient
CT Averaged
Effect of surrounding condition (magnetic-field and temperature) on measurement system
0.1%
0.1%
0.1%
Randomness of γ-ray source decay 0.02% 0.2% 0.1%
Correction error due to back ground 0.0% 0.0% 0.0%
Correction error due to counting loss <0.5% <0.5% <0.1%
Calibration error 0.1% 0.1% 0.1%
Correction error due to attenuation by surrounding water
0.0% 0.0% -
Correction error due to scattering from multi γ-rays
<0.2% <0.2% -
γ-ray Measurement
Total <0.55% <0.6% <0.2%
Transfer to density <9 kg/m3 <10 kg/m3 <15 kg/m3 Subchannel Density Distribution error to Subchannel <5 kg/m3 <5 kg/m3 -
Correlation error from Chordal averaged to CT averaged <6 kg/m3 <6 kg/m3 -
Subchannel Density <20 kg/m3 <21 kg/m3 <15 kg/m3
Subchannel Void* 0.040 0.042 0.030
Uncertainty (1σ) 4 % 5 % 3 % * Reference averaged density is 500 kg/m3 (see Figure 2.4.1).
22

Table 2.4.3 Number of Gamma Ray Beams
Test assembly CT Measurement Chordal Measurement
Subchannel 2
(X and Y direction) 2
(X and Y direction)
Rod bundle - 6 beam 2 3 section
(total 36 beams)
Table 2.4.4 Time Required to Perform Void Fraction Measurements
Item CT Measurement Chordal Measurement
Time needed 5 s/stepT33 R 17 step (it takes 2 h)
100 s sampling cycle 0.1 s Steady-state
Measurement 2 times 3 times Time needed - 200 s
Transient Measurement - 1 time
Figure 2.4.2 Relation between Chordal and CT Averaged Densities in bundle S1
Chordal Averaged Density (kg/m3)
CT
Ave
rage
d D
ensi
ty (
kg/m
3 )
Pressure < 100 kg/m3a
Pressure > 125 kg/m3a
23

2.5 DNB Measurement Methods
The thermocouples described in Table 3.2.2.2 are used to determine the heat flux axially along the rod bundle. These thermocouples are attached to the inner surface of the heater rods and determine the boiling transition. The bundle power is increased gradually by fine steps to the vicinity of DNB power, which is based on preliminary analysis. The occurrence of DNB is confirmed by a rod temperature rise of more than 11°C (20°F) as measured by the thermocouples. The DNB power is defined as the power corresponding to the step just before the step where the temperature increased. Table 2.5.1 shows the estimated accuracies of different process parameters for the DNB measurements.
Table 2.5.1 Estimated Accuracy for DNB Measurements
Quantity Accuracy Process parameters Pressure 1 % Flow 1.5% Power 1 % Fluid temperature 1 Celsius
2.6 Studies on the Accuracy of the Void Fraction A deviation exists between the measured void fraction and the void fraction calculated using the measured fluid densities. Solving the standard equation for mixture density,
fg )1( , for the void fraction gives )/()( fgf , where the liquid and
vapor densities (ρf and ρg, respectively) are assumed to be at saturation. As it can be seen in Figure 2.6.1 the “measured” void fraction is consistently greater than the “calculated” void fraction.
Following the results of the study performed on the calculation of void fraction, the benchmark team evaluated the experimentally-determined quality for the selected cases in Test Series S1 and S2, the only subchannel series for which quality was provided in the experimental database. Since temperature data at the measurement location was not available, the mixture enthalpy was determined using the measured density and pressure. These two parameters, along with steam table data, were used to determine the fluid temperature at the measurement location. The temperature and the given pressure were then used to determine the mixture enthalpy.
Once this mixture enthalpy was determined, and the fluid and vapor enthalpies (hf and hg, respectively) were found assuming saturation properties at the previously determined flow tempe-rature, the equilibrium quality was evaluated using the equation )hh/()hh(x fgfmixture .
The differences between the experimental and “calculated” qualities (determined using the equation above, referred to as “Method 1”) for these two test series are shown in Figure 2.7.1. This procedure differs from that used for the original (NUPEC, referred to as “Method 2”) calculations of quality, which assumed conservation of energy in the test section. In this method, the mixture quality was expressed by
24

hm
kgG]m[A
h
s3600
]kW[Q]mm[z
]mm[z]kg/kJ[h]kg/kJ[h
22total
localinmix
where hin is taken at the inlet temperature and pressure. The above expression for quality can then be used, with the fluid and vapor enthalpies taken at saturation for the given pressure. The differences between the recalculated values and the experimental values are reflected in Figure 2.7.2 through Figure 2.7.6.
Figure 2.6.1 Deviation of Measured Void Fraction from Calculated Void Fraction
0.0
0.2
0.4
0.6
0.8
1.0
0.0 0.2 0.4 0.6 0.8 1.0
Calculated Void Fraction
Mea
sure
d V
oid
Fra
ctio
n
Test Series S1
Test Series S2
Test Series S3
Test Series S4
25

Figure 2.7.1 Deviation of Experimental Quality from Calculated Quality (Method 1; S1 and S2)
0.00
0.05
0.10
0.15
0.20
0.25
0.30
0.00 0.05 0.10 0.15 0.20 0.25 0.30
Calculated Quality
Exp
erim
enta
l Qua
lity
Test Series S1
Test Series S2
Figure 2.7.2 Deviation of Experimental Quality from Calculated Quality (Method 2; S1 and S2)
0.00
0.05
0.10
0.15
0.20
0.25
0.30
0.00 0.05 0.10 0.15 0.20 0.25 0.30
Calculated Quality
Exp
erim
enta
l Qua
lity
Test Series S1
Test Series S2
26

Figure 2.7.3 Deviation of Experimental Quality from Calculated Quality (Method 2; B5)
-0.2
-0.1
0.0
0.1
0.2
-0.2 -0.1 0.0 0.1 0.2
Calculated Quality
Exp
erim
enta
l Qua
lity
Test Series B5Lower
Test Series B5Middle
Test Series B5Upper
Figure 2.7.4 Deviation of Experimental Quality from Calculated Quality (Method 2; B6)
-0.2
-0.1
0.0
0.1
0.2
-0.2 -0.1 0.0 0.1 0.2
Calculated Quality
Exp
erim
enta
l Qua
lity
Test Series B6Lower
Test Series B6Middle
Test Series B6Upper
Figure 2.7.5 Deviation of Experimental Quality from Calculated Quality (Method 2; B7)
27

-0.2
-0.1
0.0
0.1
0.2
-0.2 -0.1 0.0 0.1 0.2
Calculated Quality
Exp
erim
enta
l Qua
lity
Test Series B7Lower
Test Series B7Middle
Test Series B7Upper
Figure 2.7.6 Deviation of Experimental Quality from Calculated Quality (Method 2; B8)
28
-0.2
-0.1
0.0
0.1
0.2
-0.2 -0.1 0.0 0.1 0.2
Calculated Quality
Exp
erim
enta
l Qua
lity
Test Series B8Lower
Test Series B8Middle
Test Series B8Upper

Chapter 3 TEST ASSEMBLY DATA
3.1 General
This chapter provides the participants with geometry and material data for the PWR rod bundles and the single subchannel apparatus utilized in the void distribution and DNB measurements. The power distribution patterns, radial and axial, as well as the tests conditions are described. Data for the fuel assemblies and spacers’ dimensions, heater rods specifications, and material properties are also given.
3.2 Void Distribution Data
Two different test assemblies were used for the void distribution measurements: a single subchannel, and a full-size PWR fuel assembly. These assemblies and their characteristics are outlined in Table 3.2.1 . The thimble rods in the bundle assemblies are filled with stratified water. In such rods, the bottom of the tube structure is open to the flow while a pin hole is located at the top of the structure.
Table 3.2.1 Test Assemblies for Void Fraction Measurements
Power distribution Assembly
Reference fuel type
Type of cell Radial Axial
S1 Center (Typical) - Uniform S2 Center (Thimble) - Uniform S3 Side - Uniform S4
1717 M
Subchannel
Corner - Uniform B5 Typical cell A Uniform B6 Typical cell A Cosine B7
1717 M
55 Rod bundle
Thimble cell B Cosine 3.2.1 Single Subchannel Specification
Table 3.2.1.1 outlines the four different subchannels used to perform the void distribution measurements. Figure 3.2.1.1 shows a cross-sectional view of the subchannel test assembly.
29

Table 3.2.1.1 Geometry and Power Shape for Test Assembly S1, S2, S3, and S4
Item Data Assembly (Subjected subchannel)
S1
S2
S3
S4 Subchannel type Center (Typical) Center (Thimble) Side Corner Number of heaters 41/4 31/4 21/4 11/4 Axial heated length (mm) 1555 1555 1555 1555 Axial power shape Uniform Uniform Uniform Uniform
WW
WW
WW
WW
■: Subjected subchannel : Heated rod : Thimble rod
Figure 3.2.1.1 Cross Sectional View of Subchannel Test Assembly
Dimensions in mm Heater (Inconel)
Insulator (Alumina) Pressure vessel
(Titanium)
Central (Thimble) Subchannel S2
Central (Typical) Subchannel S1
Corner Subchannel S4
Side Subchannel S3
30

Table 3.2.1.2 Geometric Characteristics of Subchannel Assemblies
Subchannel Type Typical (S1) Thimble (S2) Side (S3) Corner (S4)
Flow area, mm2 107.098 107.098 68.464 42.592 Heated perimeter, mm 29.845 22.384 14.923 7.461 Wetted perimeter, mm 54.645 54.645 44.923 33.161
3.2.1.1 Heater Rod Structure for Subchannel Test Assembly
Table 3.2.1.1.1 describes the properties of the heater rod used in the subchannel test assembly. Figure 3.2.1.1 provides a diagram of the cross-sectional structure of the heater rods in the subchannel test assembly.
Table 3.2.1.1.1 Heater Rod Structure for Subchannel Test Assembly
Item Data Outer radius (mm) 4.75 Thickness (mm) 0.85 Material Inconel 600
Heater
Heating Method Direct Heating Outer diameter (mm) 31 Insulator Material Alumina Inner Diameter (mm) 32 Thickness (mm) 4 Pressure vessel
Material Titanium 3.2.2 Bundle Specification
Table 3.2.2.1 outlines the three different bundles used to perform the void distribution measurements. Figure 3.2.2.1 shows the locations of the ten pressure taps inserted into the rod bundle to measure pressure loss. Figure 3.2.2.2 and Figure 3.2.2.3 show the two different radial power distributions, named A and B, respectively. All powers shown are relative powers.
Table 3.2.2.2 shows the axial power distribution (based on a cosine shape) that was used in the bundle tests.
31

Table 3.2.2.1 Geometry and Power Shape for Test Assembly B5, B6, and B7
Item Data Assembly
B5
B6
B7 Rods array 55 55 55 Number of heated rods 25 25 24 Number of thimble rods 0 0 1 Heated rod outer diameter (mm) 9.50 9.50 9.50 Thimble rod outer diameter (mm) - - 12.24 Heated rods pitch (mm) 12.60 12.60 12.60 Axial heated length (mm) 3658 3658 3658 Flow channel inner width (mm) 64.9 64.9 64.9 Radial power shape A A B Axial power shape Uniform Cosine Cosine Number of MV spacers 7 7 7 Number of NMV spacers 2 2 2 Number of simple spacers 8 8 8 MV spacer location (mm) 471, 925, 1378, 1832, 2285, 2739, 3247 NMV spacer location (mm) 2.5, 3755 Simple spacer location (mm) 237, 698, 1151, 1605, 2059, 2512, 2993, 3501
: Heated rod : Thimble rod
WW
WW
WW
MV: Mixing vane, NMV: No mixing vane Spacer location is distance from bottom of heated length to spacer bottom face.
32

33
Figure 3.2.2.1 Location of Pressure Taps

Figure 3.2.2.2 Radial Power Distribution Type A
0.85 0.85 0.85 0.85 0.85
0.85 1.00 1.00 1.00 0.85
0.85 1.00 1.00 1.00 0.85
0.85 1.00 1.00 1.00 0.85
0.85 0.85 0.85 0.85 0.85
Figure 3.2.2.3 Radial Power Distribution Type B
0.85 0.85 0.85 0.85 0.85
0.85 1.00 1.00 1.00 0.85
0.85 1.00 0.00 1.00 0.85
0.85 1.00 1.00 1.00 0.85
0.85 0.85 0.85 0.85 0.85
Table 3.2.2.2 Axial Power Distribution (Cosine)
Node Relative Power Cosine
(Bottom) 1 0.42 2 0.47 3 0.56 4 0.67 5 0.80 6 0.94 7 1.08 8 1.22 9 1.34
10 1.44 11 1.51 12 1.55 13 1.55 14 1.51 15 1.44 16 1.34 17 1.22 18 1.08 19 0.94 20 0.80 21 0.67 22 0.56 23 0.47 24 0.42
(Top)
34

3.2.2.1 Heater Rod Structure for Bundle Test Assembly
Table 3.2.2.1.1 describes the properties of the heater rods used for the rod bundle test
assembly. The insulator and the heater are made of Inconel and Alumina respectively, and the gap between the heater and insulator could be assumed zero contact. The rod is a single-ended, grounded electrical heater rod, which simulates the heat generation from a fuel rod. Figure 3.2.2.1.1 shows a cross-sectional view of the bundle heater rod.
Table 3.2.2.1.1 Heater Rod Structure for Bundle Test Assembly
Item Data Outer diameter (mm) 9.5 Thickness (mm) 0.65 Material Inconel 600
Heater
Heating Method Direct Heating Outer diameter (mm) 8.2 Inner diameter (mm) 5.8 Insulator
Material Alumina
Figure 3.2.2.1.1 Cross Section of Bundle Heater Rod
(mm)
Insulator (Alumina)
Heater (Inconel 600)
9.5
5.8
8.2
Hollow
35

3.2.2.2 Spacer Grid Data
There were three types of spacers instrumented along the axial length: simple spacer (SS), spacer with no mixing vanes (NMV), and spacer with mixing vanes (MV). The simple spacer has only dimples while NMV and MV have dimples and springs. The grids straps are made out of Inconel 600 allow.
Three-dimensional views of the different spacer types are given in Figures 3.2.2.2.1 through 3.2.2.2.3.
Figures 3.2.2.2.4 through 3.2.2.2.6 show the dimensions of the simple spacer, the non-mixing vanes spacer, and the mixing vanes spacer, respectively. Note that the dimensions on Figure 3.2.2.2.4 are in millimetres, while the dimensions in Figures 3.2.2.2.5 and 3.2.2.2.6 are in inches.The drawings of the spacers were developed using the SolidWorks® mechanical design software package.
Table 3.2.2.2.1 provides the bundle average spacer pressure loss coefficients for the three types of grids. Depending on the participants’ computer code, and using the provided spacer data, each participant may choose the subchannel grids loss coefficients or other required input values.
Table 3.2.2.2.1 Bundle Average Spacer Pressure Loss Coefficients
Spacer Type Loss Coefficient
Simple Spacer (SS) 0.4 Non-Mixing Vanes Spacer (NMV) 0.7 Mixing Vanes Spacer (MV) 1.0
36

Figure 3.2.2.2.1 Three-Dimensional View of the Simple Spacer
37

Figure 3.2.2.2.2 Three-Dimensional View of the Non-Mixing Vane Spacer
38

Figure 3.2.2.2.3 Three-Dimensional View of the Mixing Vane Spacer
39

Figure 3.2.2.2.4 Dimensions of the Simple Spacer
a) Overall Schematic
b) Top View
c) Side View
40

Figure 3.2.2.2.5 Dimensions of the Non-Mixing Vane Spacer
a) Overall Schematic
b) Top View
41

Figure 3.2.2.2.5 Dimensions of the Non-Mixing Vane Spacer – cont.
c) Springs and Dimples Dimensions
42

Figure 3.2.2.2.5 Dimensions of the Non-Mixing Vane Spacer – cont.
d) Side Views
43

Figure 3.2.2.2.3 Dimensions of the Mixing Vane Spacer
a) Side View
b) Top View
44

Figure 3.2.2.2.3 Dimensions of the Mixing Vane Spacer – cont.
c) Mixing Vane Dimensions
45

3.3 DNB Measurement
Table 3.3.1 shows the assembly types used in the DNB measurements. The heater rods used in these bundles are of the same type as those used in the bundles in the void distribution measurement exercises.
Table 3.3.2 gives the geometry and power shape for one of the test assemblies, A0. Similar information for the other assembly types is provided.
Table 3.2.2.1.1 provides information on the heating rods used in the rod bundles for this set of tests.
Figure 3.3.5 displays the locations of the thermocouples for the test assemblies.
The DNB measurements were performed with two additional radial power distributions (type C and type D). Radial power distributions A and B are the same as those used in the void distribution measurements.
Table 3.3.1 Test Assemblies for DNB Measurements
Power distribution Assembly
Reference fuel type
Rods array
Type of cell Radial Axial
A0 Typical cell A Uniform A1 Typical cell C Uniform A2
55 Typical cell A Uniform
A3 66 Typical cell D Uniform A4 Typical cell A Cosine A8 Thimble cell B Cosine
A11 Typical cell A Cosine A12
1717 M
55
Thimble cell B Cosine
46

Table 3.3.2 Geometry and Power Shape for Test Assembly A0
Item Data
Assembly
A0 Rods array 55 Number of heated rods 25 Number of thimble rods 0 Heated rod outer diameter (mm) 9.50 Thimble rod outer diameter (mm) - Heated rods pitch (mm) 12.60 Axial heated length (mm) 3658 Flow channel inner width (mm) 64.9 Radial power shape A Axial power shape Uniform Number of MV spacers 5 Number of NMV spacers 2 Number of simple spacers 6 MV spacer location (mm) 610, 1219, 1829, 2438, 3048 NMV spacer location (mm) 0, 3658 Simple spacer location (mm) 305, 914, 1524, 2134, 2743, 3353
W
: Heated rod : Thimble rod MV: Mixing vane, NMV: No mixing vane Spacer location is distance from bottom of heated length to spacer bottom face.
47

Table 3.3.3 Geometry and Power Shape for Test Assembly A1, A2, and A3
Item Data Assembly
A1
A2
A3 Rods array 55 55 66 Number of heated rods 25 25 36 Number of thimble rods 0 0 0 Heated rod outer diameter (mm) 9.50 9.50 9.50 Thimble rod outer diameter (mm) - - - Heated rods pitch (mm) 12.60 12.60 12.60 Axial heated length (mm) 3658 3658 3658 Flow channel inner width (mm) 64.9 64.9 77.5 Radial power shape C A D Axial power shape Uniform Uniform Uniform Number of MV spacers 7 7 7 Number of NMV spacer 2 2 2 Number of simple spacers 8 8 8 MV spacer location (mm) 457, 914, 1372, 1829, 2286, 2743, 3200 NMV spacer location (mm) 0, 3658 Simple spacer location (mm) 229, 686, 1143, 1600, 2057, 2515, 2972, 3429
WW
48

49
Table 3.3.4 Geometry and Power Shape for Test Assembly A4, A8, A11, and A12
Item Data Assembly
A4, A11
A8, A12 Rods array 55 55 Number of heated rods 25 24 Number of thimble rods 0 1 Heated rod outer diameter (mm) 9.50 9.50 Thimble rod outer diameter (mm) - 12.24 Heated rods pitch (mm) 12.60 12.60 Axial heated length (mm) 3658 3658 Flow channel inner width (mm) 64.9 64.9 Radial power shape A B Axial power shape Cosine Cosine Number of MV spacers 7 7 Number of NMV spacer 2 2 Number of simple spacers 8 8 MV spacer location (mm) 471, 925, 1378, 1832, 2285, 2739, 3247 NMV spacer location (mm) 2.5, 3755 Simple spacer location (mm) 237, 698, 1151, 1605, 2059, 2512, 2993, 3501
WW
Figure 3.3.2 Radial Power Distribution Type D
Figure 3.3.1 Radial Power Distribution Type C
0.85 0.85 0.85 0.85 0.85 0.85
0.85 1.00 1.00 1.00 1.00 0.85
0.85 1.00 1.00 1.00 1.00 0.85
0.85 1.00 1.00 1.00 1.00 0.85
0.85 1.00 1.00 1.00 1.00 0.85
0.85 0.85 0.85 0.85 0.85 0.85
1.00 1.00 0.25 0.25 0.25
1.00 1.00 1.00 0.25 0.25
1.00 1.00 0.25 0.25 0.25
1.00 1.00 1.00 0.25 0.25
1.00 1.00 0.25 0.25 0.25

50
Figure 3.3.5 Location of Thermocouples for Test Assemblies

51
Figure 3.3.6 Fluid Temperature Measurements

52
3.4 Thermo-Mechanical Properties
The thermo-mechanical properties of Inconel 600 are based on the MATPRO model used in TRAC code. Since no information on the heat loss is available in the NUPEC PSBT database, an adiabatic condition is suggested for the benchmark.
3.4.1 Properties of Inconel 600
(1) Density
The density is:
)10194357.110345453.110261008.5(01846.16 2722ff TxT ,
where is the density (kg/m3) and is the temperature (F). fT
(2) Specific Heat
The specific heat is:
)10597571.510458648.210682836.310060318.2
10418111.310046138.210378952.41014.0(8.4186723619516413
311285
ffff
fffp
TTTT
TTTc
pc fTwhere is the specific heat (J/kg.K) and is the temperature (F).
(3) Thermal Conductivity
The thermal conductivity is:
)10936696.910475513.3
10914512.310872857.110643719.4011332.8(729577.1516412
39263
ff
fff
TT
TTTk
k fTwhere is the thermal conductivity (W/m.K) and is the temperature (F).
3.4.2 Properties of Alumina
It is assumed that 99.5% Aluminum Oxide (Al2O3) is used.
(1) Density
A constant value of 3.89 g/cm3 is to be used.
(2) Specific heat
A constant value of 880 J/kg-K is to be used.
(3) Thermal Conductivity
A constant value of 35 W/m-K is to be used.
3.4.3 Properties of Titanium
(1) Density
A constant value of 4.54 g/cm3 is to be used.
(2) Specific heat
A constant value of 502.44 J/kg-K is to be used.
(3) Thermal Conductivity
A constant value of 16.44 W/m-K is to be used.

53
Chapter 4 BENCHMARK PHASES AND EXERCISES
4.1 Introduction
The OECD/NRC PSBT benchmark consists of two phases with each phase consisting of different exercises. The benchmark phases and exercises are described below.
Phase I – Void distribution benchmark
Exercise I-1 – Steady-state single subchannel benchmark
Exercise I-2 – Steady-state bundle benchmark
Exercise I-3 – Transient bundle benchmark
Exercise I-4 – Pressure drop benchmark
Phase II – Departure from Nucleate Boiling benchmark
Exercise II-1 – Steady-state fluid temperature benchmark
Exercise II-2 – Steady-state DNB benchmark
Exercise II-3 – Transient DNB benchmark
The subchannel approach is categorized as the macroscopic grade approach that can resolve an element as small as a subchannel size mesh. Time and space averaged formulations cause the loss of the heterogeneous and instantaneous void fraction information of the two-phase flow structure within the subchannel. As a consequence, many macroscopic correlations are still indispensable for reproducing the experimental results. In recent years, there have been developed newer two-phase flow numerical approaches that can be categorized into meso-, micro- or molecular dynamics approaches. Taking into account the immaturity of numerical modeling for detailed void distribution, this benchmark specification is designed to accept as many potential numerical approaches as possible.
Table 4.1.1 provides a guide to the participants where to find the conditions for each benchmark case within each benchmark exercise and phase. Table 4.1.2 provides a guide where to find the data for the involved fuel assemblies.

54
Table 4.1.1 NUPEC PSBT Benchmark Database
Items of Data Test Series
Void fraction measurements data - Steady-state void fraction in subchannel by CT measurement - Steady-state void distribution image in subchannel by CT measurement - Steady-state void fraction in rod bundle by chordal measurement - Steady-state void distribution image in rod bundle by chordal measurement - Transient void fraction in rod bundle by chordal measurement
1, 2, 3, 4 1, 2 5, 6, 7, 8 5, 6, 7, 8 5T, 6T, 7T
DNB measurements data - Steady-state DNB data in rod bundle - Steady-state DNB detected location in rod bundle - Steady-state fluid temperature distribution in rod bundle - Transient DNB data in rod bundle
0, 2, 3, 4, 8, 13 4, 8, 13 1 11T, 12T
Table 4.1.2 Benchmark Conditions
Phase Exercises Assembly
ID Test Series
Number Geometrical
Data
Test Matrix / Measurement
Conditions
Related Section
S1 1 Table 3.2.1.1 Table 4.2.1.1 4.2.1 S2 2 Table 3.2.1.1 Table 4.2.1.2 4.2.1 S3 3 Table 3.2.1.1 Table 4.2.1.3 4.2.1
Steady-state subchannel
S4 4 Table 3.2.1.1 Table 4.2.1.4 4.2.1 B5 5 Table 3.2.2.1 Table 4.2.2.1 4.2.2 B6 6 Table 3.2.2.1 Table 4.2.2.2 4.2.2 B7 7 Table 3.2.2.1 Table 4.2.2.3 4.2.2
Steady-state bundle
B5 8 Table 3.2.2.1 Table 4.2.2.4 4.2.2 B5 5T Table 3.2.2.1 Table 4.2.3.1 4.2.3 B6 6T Table 3.2.2.1 Table 4.2.3.1 4.2.3
Voi
d D
istr
ibu
tion
Transient bundle B7 7T Table 3.2.2.1 Table 4.2.3.1 4.2.3
Steady-state fluid temperature
A1 1 Table 3.3.3 Table 4.3.1.1 4.3.1
A0 0 Table 3.3.2 Table 4.3.2.1 4.3.2 A2 2 Table 3.3.3 Table 4.3.2.2 4.3.2 A3 3 Table 3.3.3 Table 4.3.2.3 4.3.2 A4 4 Table 3.3.4 Table 4.3.2.4 4.3.2 A8 8 Table 3.3.4 Table 4.3.2.5 4.3.2
Steady-state DNB
A4 13 Table 3.3.4 Table 4.3.2.6 4.3.2 A11 11T Table 3.3.4 Table 4.3.3.1 4.3.3
DN
B M
easu
rem
ent
Transient DNB A12 12T Table 3.3.4 Table 4.3.3.1 4.3.3

55
4.2 Phase I - Void Distribution Benchmark Table 4.2.1 summarizes the test series used for both the subchannel and rod bundle void fraction measurements.
Table 4.2.1 Test Series for Void Fraction Measurement
Test mode Void measurement Test series
Test section
Assembly Steady-State Transient CT Chordal
1 S1 Y Y Y 2 S2 Y Y Y 3 S3 Y Y Y 4
Subchannel
S4 Y Y Y 5 Y Y
5T B5
Y Y 6 Y Y
6T B6
Y Y 7 Y Y
7T B7
Y Y 8
55 Rod bundle
B5 Y Y
4.2.1 Exercise I-1 – Steady-State Single Subchannel Benchmark
The available experimental data includes CT scan measurements of the void fraction (subchannel averaged) of four representative subchannel types: typical central, central with a guide tube, side, and corner subchannels and images of the void distribution within two representative subchannel types: typical central and central with a guide tube. The data can be used to assess and improve the current models for void generation (subchannel/system and CFD codes) and void distribution within subchannels (CFD codes).
The test matrixes for the steady-state single subchannel void measurements - Test Series 1, 2, 3, and 4 - are given in Table 4.2.1.1, Table 4.2.1.2, Table 4.2.1.3, and Table 4.2.1.4, respectively. The highlighted cases are selected to be analyzed as part of benchmark. The cases in italics are selected to be modelled for the investigation of the axial variation of the void fraction.

56
Table 4.2.1.1 Test Conditions for Steady-State Void Measurement Test Series 1
Run No Pressure Mass Flux Power Inlet Temperature
(kg/cm2a) (106 kg/m2hr) (kW) (°C)
1.1221 169.1 10.95 49.9 329.7 1.1222 169.1 10.98 50.0 334.7 1.1223 169.1 11.00 49.9 339.7 1.2121 150.1 14.80 79.9 309.5 1.2122 149.9 14.89 80.1 319.7 1.2211 150.1 10.91 90.0 295.4 1.2212 150.1 10.88 90.0 299.4 1.2221 150.1 10.88 69.8 299.4 1.2223 150.1 10.91 69.8 319.6 1.2231 150.2 10.87 60.0 299.3 1.2233 150.2 10.89 59.9 309.6 1.2234 150.1 10.92 60.1 314.6 1.2235 150.1 10.89 59.9 319.6 1.2236 150.0 10.91 60.0 324.7 1.2237 150.3 10.93 60.0 329.6 1.2421 150.2 5.02 59.8 268.9 1.2422 150.1 5.00 60.0 284.1 1.2423 150.3 4.93 59.9 299.3 1.3221 125.0 11.10 59.9 294.4 1.3222 125.1 10.91 60.0 309.5 1.3223 124.9 11.10 60.1 319.7 1.4121 100.1 10.97 69.9 274.1 1.4122 99.8 10.90 69.8 304.5 1.4311 100.4 5.01 79.9 214.2 1.4312 100.2 5.03 79.8 248.9 1.4321 100.5 5.01 59.9 209.3 1.4323 100.5 5.03 59.9 229.2 1.4324 100.1 5.02 60.1 238.9 1.4325 100.3 5.03 59.8 253.8 1.4326 100.1 5.02 60.1 268.8 1.4327 100.1 4.96 59.9 289.0 1.4411 100.4 1.99 19.9 253.7 1.4412 100.3 1.99 20.0 284.0 1.5221 75.5 5.02 49.9 219.2 1.5222 75.0 5.02 50.0 243.9 1.5223 75.6 5.03 49.9 263.8 1.6211 50.4 5.02 79.7 164.1 1.6212 50.4 5.00 79.8 199.3 1.6221 50.5 5.01 50.0 189.2 1.6222 50.0 5.00 49.9 204.2 1.6223 50.5 5.03 49.9 239.0 1.6311 50.6 1.95 20.1 204.1 1.6312 50.6 1.96 20.1 238.9

57
Table 4.2.1.2 Test Conditions for Steady-State Void Measurement Test Series 2
Run No Pressure Mass Flux Power Inlet Temperature (kg/cm2a) (106 kg/m2hr) (kW) (°C)
2.1231 168.9 10.98 37.5 335.0 2.1232 168.8 11.00 37.5 340.0 2.1233 168.8 11.01 37.5 345.0 2.2121 149.5 14.89 60.2 319.9 2.2122 149.5 14.88 60.1 325.1 2.2221 149.9 10.91 60.0 310.4 2.2222 149.9 10.92 60.1 314.9 2.2231 149.9 10.91 52.5 310.3 2.2233 149.9 10.95 52.5 330.6 2.2241 150.0 10.90 45.1 304.3 2.2243 149.9 10.91 45.2 314.5 2.2244 149.9 10.91 45.0 320.0 2.2245 149.9 10.91 45.0 325.5 2.2246 150.0 10.95 45.0 329.8 2.2247 150.0 10.98 45.1 334.8 2.2441 150.4 5.00 45.1 289.8 2.2442 150.4 4.98 45.1 304.8 2.2443 150.4 4.99 45.1 320.1 2.3231 125.2 10.90 45.0 304.6 2.3232 125.1 10.91 45.1 309.8 2.3233 125.0 10.91 45.1 319.9 2.4231 100.3 10.96 52.7 279.3 2.4232 100.2 10.89 52.7 299.6 2.4421 100.4 5.03 60.1 244.0 2.4422 100.5 5.02 60.1 279.2 2.4441 100.5 5.03 45.0 234.1 2.4443 100.5 5.03 45.2 253.9 2.4444 100.6 5.03 45.1 263.9 2.4445 100.5 5.02 45.0 274.0 2.4446 100.5 5.01 45.1 284.2 2.4447 100.5 4.98 45.2 299.4 2.4551 100.7 1.79 15.0 274.0 2.4552 100.7 1.78 15.1 294.3 2.5431 75.6 5.03 37.7 239.0 2.5432 75.7 5.03 37.5 263.9 2.5433 75.6 5.02 37.5 279.2 2.6411 50.5 5.01 60.1 194.2 2.6412 50.5 5.03 60.1 229.2 2.6431 50.6 5.01 37.5 209.2 2.6432 50.6 5.02 37.5 224.2 2.6433 50.5 5.03 37.6 253.9 2.6541 50.7 1.79 15.1 224.1 2.6542 50.7 1.79 15.2 253.7

58
Table 4.2.1.3 Test Conditions for Steady-State Void Measurement Test Series 3
Run No Pressure Mass Flux Power Inlet Temperature (kg/cm2a) (106 kg/m2hr) (kW) (°C)
3.2231 149.9 10.90 40.4 309.4
3.2232 149.9 10.90 40.5 314.5
3.2251 150.0 10.89 30.0 304.3
3.2253 149.9 10.89 30.0 314.4
3.2254 149.9 10.90 30.1 319.5
3.2255 150.0 10.90 30.2 324.5
3.2256 150.0 10.93 30.1 329.6
3.2257 150.0 10.96 30.2 334.5
3.2451 150.3 4.96 30.2 283.8
3.2452 150.5 4.93 30.2 299.0
3.2453 150.3 4.94 30.2 314.3
3.4451 100.5 4.98 30.2 228.9
3.4453 100.5 4.98 30.3 248.8
3.4454 100.4 4.98 30.1 258.6
3.4455 100.6 4.98 30.3 268.8
3.4456 100.6 4.96 30.2 283.7
3.4457 100.6 4.93 30.2 299.0
3.6431 50.4 4.96 40.2 189.0
3.6432 50.4 4.97 40.1 223.9
3.6461 50.6 4.96 25.2 203.9

59
Table 4.2.1.4 Test Conditions for Steady-State Void Measurement Test Series 4
Run No Pressure Mass Flux Power Inlet Temperature (kg/cm2a) (106 kg/m2hr) (kW) (°C)
4.2231 149.9 11.06 20.3 314.3
4.2232 149.9 11.06 20.3 319.3
4.2251 149.9 11.06 15.2 310.3
4.2253 150.0 11.06 15.1 318.4
4.2254 150.0 11.07 15.2 322.4
4.2255 150.0 11.08 15.2 326.5
4.2256 150.0 11.11 15.1 330.5
4.2257 149.9 11.12 15.1 334.5
4.2451 150.4 5.01 15.2 294.0
4.2452 150.4 5.01 15.2 309.2
4.2453 150.4 5.01 15.2 324.3
4.4451 100.6 5.05 15.2 238.8
4.4453 100.5 5.05 15.2 258.6
4.4454 100.5 5.04 15.1 268.7
4.4455 100.5 5.04 15.2 278.8
4.4456 100.5 5.02 15.2 289.0
4.4457 100.5 5.00 15.2 299.1
4.6431 50.6 5.02 20.2 204.1
4.6432 50.5 5.05 20.3 238.8
4.6461 50.6 5.03 12.5 214.0

60
4.2.2 Exercise I-2 – Steady-State Bundle Benchmark
The experimental data include X-ray densitometer measurements of void fraction (chordal averaged) at three axial elevations. The averaging is over the four central subchannels. Images of the bundle void distribution are available as well. The data can be applied to thermal-hydraulic subchannel and system codes and CFD codes.
The test matrixes for the steady-state bundle void measurements - Test Series 5, 6, 7, and 8 - are given in Table 4.2.2.1, Table 4.2.2.2, Table 4.2.2.3, and Table 4.2.2.4, respectively.
The highlighted cases are selected to be analyzed as part of benchmark.
Table 4.2.2.1 Test Conditions for Steady-State Void Measurement Test Series 5
Run No Pressure Mass Flux Power Inlet Temperature (kg/cm2a) (106 kg/m2hr) (kW) (°C)
5.1121 167.39 14.96 2990 316.9 5.1122 167.25 15.02 2995 322.0 5.1221 168.29 11.00 3000 292.3 5.1222 168.27 10.98 2998 297.3 5.1231 168.29 10.97 2488 311.8 5.1232 168.29 10.98 2486 316.6 5.1331 168.80 7.95 2491 287.2 5.1332 168.71 7.93 2491 292.2 5.1341 168.76 7.90 2005 312.2 5.1342 168.83 7.91 2005 317.2 5.1451 169.19 4.99 1515 302.3 5.1452 169.19 4.98 1516 312.5 5.2111 148.15 15.08 3296 291.9 5.2112 148.04 14.98 3294 296.8 5.2131 148.02 14.99 2360 316.5 5.2132 147.67 15.01 2361 321.8 5.2221 149.06 11.06 2972 287.2 5.2222 149.18 11.04 2965 292.5 5.2231 149.16 10.95 2364 301.7 5.2232 148.83 11.01 2360 311.8 5.2241 148.92 11.00 1901 316.8 5.2242 148.78 11.01 1898 321.6 5.2331 149.57 8.03 2481 277.5 5.2332 149.82 7.94 2523 287.8 5.2341 149.72 7.97 1902 302.0 5.2342 149.51 7.91 1901 312.2 5.2351 149.71 7.89 1431 316.8 5.2352 149.63 7.94 1433 321.9 5.2442 149.97 4.99 2000 263.0 5.2451 150.10 4.94 979 311.4 5.2452 150.16 4.90 964 321.8 5.3111 123.65 15.10 3480 276.7 5.3112 123.52 15.10 3489 281.7 5.3221 124.55 11.06 2997 271.8

61
Table 4.2.2.1 Test Conditions for Steady-State Void Measurement Test Series 5 – Cont.
Run No Pressure Mass Flux Power Inlet Temperature (kg/cm2a) (106 kg/m2hr) (kW) (°C)
5.3222 124.31 11.07 2988 277.0 5.3321 124.88 8.00 3000 243.0 5.3322 124.77 8.00 2998 248.0 5.3331 124.89 8.00 2491 267.1 5.3332 124.96 7.99 2494 277.3 5.3441 125.22 5.00 2014 247.9 5.3442 125.13 5.00 2013 257.7 5.4211 98.71 11.12 3478 242.6 5.4212 98.70 11.11 3480 247.7 5.4321 99.28 8.09 2984 237.9 5.4322 99.21 8.07 2985 243.1 5.4431 99.89 4.91 2507 199.2 5.4432 100.09 5.02 2449 204.3 5.4441 100.02 4.97 2003 223.2 5.4442 99.97 5.02 2007 233.4 5.4561 100.33 2.03 1018 204.4 5.4562 100.23 2.02 1016 214.3 5.5201 74.44 11.07 4018 208.2 5.5202 74.36 11.07 4021 213.2 5.5311 74.95 8.07 3506 193.8 5.5312 74.87 8.13 3511 204.0 5.5321 75.00 8.05 3017 203.6 5.5322 74.93 8.03 3016 218.6 5.5431 75.21 5.07 2520 174.2 5.5432 75.18 5.05 2518 184.2 5.5441 75.13 5.01 2020 203.6 5.5442 75.27 5.02 2022 213.6 5.5551 75.41 2.00 1028 183.0 5.5552 75.40 2.00 1026 193.2 5.6311 48.99 7.86 3496 163.8 5.6312 48.85 7.85 3492 173.9 5.6321 49.20 7.87 3000 173.5 5.6322 49.08 7.86 3000 183.6 5.6431 49.82 4.93 2507 149.4 5.6432 49.73 4.96 2506 159.3 5.6441 49.92 4.96 2016 168.6 5.6442 49.84 4.96 2017 178.5 5.6551 50.17 2.00 1028 149.1 5.6552 50.17 2.00 1028 159.1

62
Table 4.2.2.2 Test Conditions for Steady-State Void Measurement Test Series 6
Run No Pressure Mass Flux Power Inlet Temperature (kg/cm2a) (106 kg/m2hr) (kW) (°C)
6.1121 167.59 15.16 3372 301.5 6.1122 167.56 15.17 3376 306.7 6.1221 168.24 11.32 3390 274.9 6.1222 168.28 11.32 3391 280.2 6.1231 168.23 11.25 2890 296.7 6.1232 168.26 11.25 2889 301.9 6.1331 168.65 8.23 2891 262.1 6.1332 168.68 8.22 2891 267.2 6.1341 168.75 8.18 2398 286.9 6.1342 168.67 8.18 2398 291.9 6.1451 169.03 5.20 1914 267.4 6.1452 169.06 5.20 1915 272.5 6.2111 148.13 15.32 3882 276.4 6.2112 148.60 15.30 3879 281.5 6.2131 148.50 15.21 2884 303.4 6.2132 148.40 15.23 2886 311.8 6.2221 149.41 11.34 3394 271.7 6.2222 149.21 11.07 3597 277.3 6.2231 149.42 11.31 2894 281.7 6.2232 149.27 11.30 2894 291.9 6.2241 149.29 11.27 2398 301.6 6.2242 149.24 11.25 2396 306.8 6.2331 149.78 8.24 2899 257.2 6.2332 149.64 7.97 3013 267.2 6.2341 149.69 8.21 2387 281.7 6.2342 149.75 8.21 2398 289.0 6.2351 149.72 8.17 1897 306.8 6.2352 149.71 8.17 1897 313.8 6.2441 150.01 5.16 2415 223.5 6.2442 150.02 5.12 2412 228.4 6.2461 150.17 5.08 957 311.6 6.2462 150.20 5.09 957 321.7 6.3121 123.73 15.12 3308 276.2 6.3122 123.62 15.12 3305 286.4 6.3231 124.58 11.09 2846 271.4 6.3232 124.37 11.09 2842 281.8 6.3331 124.90 8.03 2840 242.3 6.3332 124.84 8.02 2839 252.1 6.3341 124.91 8.02 2373 266.9 6.3342 124.91 8.01 2375 282.1 6.3451 125.15 5.01 1924 242.8 6.3452 125.20 5.00 1920 262.5 6.4221 99.66 11.11 3333 227.4 6.4222 99.53 11.11 3317 241.3 6.4331 99.91 8.03 2862 222.9 6.4332 99.94 8.04 2854 242.6

63
Table 4.2.2.2 Test Conditions for Steady-State Void Measurement Test Series 6 - Cont
Run No Pressure Mass Flux Power Inlet Temperature (kg/cm2a) (106 kg/m2hr) (kW) (°C)
6.4441 100.19 5.03 2382 183.7 6.4442 100.11 5.03 2833 204.3 6.4451 100.19 5.01 1923 213.1 6.4452 100.22 5.01 1922 232.9 6.4561 100.42 2.05 973 192.6 6.4562 100.41 2.05 972 213.0 6.5211 74.58 11.11 3803 197.9 6.5212 74.53 11.09 3802 213.0 6.5321 75.00 8.07 3335 173.3 6.5322 74.95 8.06 3336 193.5 6.5331 74.96 8.05 2857 187.8 6.5332 75.04 8.03 2862 202.8 6.5441 75.27 5.05 2392 153.7 6.5442 75.25 5.05 2392 173.8 6.5451 75.22 5.02 1921 183.2 6.5452 75.25 5.01 1920 203.8 6.5561 75.41 2.06 977 163.5 6.5562 75.41 2.06 974 178.2 6.6321 49.90 8.09 3351 153.4 6.6322 49.80 8.09 3344 168.5 6.6331 49.94 8.09 2875 162.7 6.6332 49.93 8.08 2876 178.3 6.6441 50.17 5.06 2396 143.7 6.6442 50.19 5.05 2394 158.7 6.6451 50.29 5.04 1925 162.9 6.6452 50.28 5.06 1930 178.2 6.6561 50.38 2.02 979 144.0 6.6562 50.40 2.00 979 158.5

64
Table 4.2.2.3 Test Conditions for Steady-State Void Measurement Test Series 7
Run No Pressure Mass Flux Power Inlet Temperature (kg/cm2a) (106 kg/m2hr) (kW) (°C)
7.1121 167.48 15.07 3385 301.8 7.1122 167.41 15.07 3384 306.8 7.1221 168.32 11.05 3391 277.4 7.1222 168.25 11.10 3390 282.3 7.1231 168.27 11.04 2892 297.0 7.1232 168.24 11.01 2891 302.0 7.1331 168.73 7.97 2994 268.0 7.1332 168.75 7.98 2995 272.8 7.1341 168.74 7.92 2391 289.4 7.1342 168.75 7.94 2391 295.3 7.1451 169.17 4.99 1963 273.0 7.1452 169.17 4.96 1963 278.0 7.2111 148.63 15.06 3992 281.8 7.2112 148.68 14.94 3993 286.5 7.2131 148.74 14.77 2993 306.2 7.2132 148.48 14.98 2987 315.5 7.2221 149.29 11.01 3503 272.1 7.2222 149.30 11.06 3506 277.2 7.2231 149.28 11.00 3004 286.8 7.2232 149.28 11.01 3004 294.6 7.2241 149.24 10.96 2407 306.1 7.2242 149.17 10.94 2409 311.3 7.2331 149.73 7.99 2958 257.6 7.2332 149.80 7.96 2957 264.5 7.2341 149.72 7.97 2447 282.0 7.2342 149.75 7.95 2450 289.2 7.2351 149.73 7.91 1958 306.4 7.2352 149.74 7.91 1955 311.4 7.2441 149.99 4.98 2516 223.9 7.2442 150.03 4.96 2516 233.9 7.2461 150.10 4.96 1019 311.2 7.2462 150.13 4.95 1040 321.2 7.3121 123.68 15.20 3502 276.1 7.3122 123.52 15.12 3498 286.0 7.3231 124.36 11.41 3011 270.9 7.3232 124.35 11.09 3006 281.1 7.3331 124.77 8.00 3012 242.7 7.3332 124.75 8.04 3011 252.5 7.3341 124.77 8.01 2480 266.0 7.3342 124.89 8.02 2480 280.2 7.3451 125.07 5.03 2023 242.8 7.3452 125.09 5.03 2021 260.1 7.4221 99.58 11.12 3508 227.7 7.4222 99.46 11.12 3506 242.6 7.4331 100.03 8.02 3017 223.0
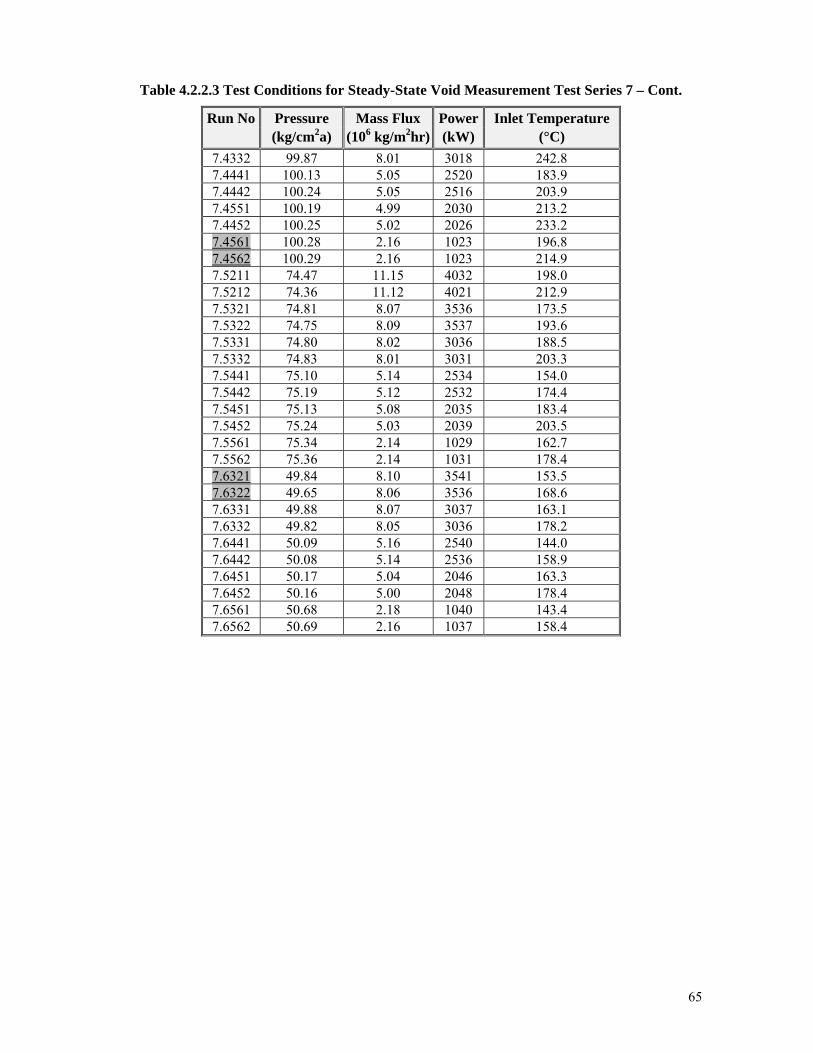
65
Table 4.2.2.3 Test Conditions for Steady-State Void Measurement Test Series 7 – Cont.
Run No Pressure Mass Flux Power Inlet Temperature (kg/cm2a) (106 kg/m2hr) (kW) (°C)
7.4332 99.87 8.01 3018 242.8 7.4441 100.13 5.05 2520 183.9 7.4442 100.24 5.05 2516 203.9 7.4551 100.19 4.99 2030 213.2 7.4452 100.25 5.02 2026 233.2 7.4561 100.28 2.16 1023 196.8 7.4562 100.29 2.16 1023 214.9 7.5211 74.47 11.15 4032 198.0 7.5212 74.36 11.12 4021 212.9 7.5321 74.81 8.07 3536 173.5 7.5322 74.75 8.09 3537 193.6 7.5331 74.80 8.02 3036 188.5 7.5332 74.83 8.01 3031 203.3 7.5441 75.10 5.14 2534 154.0 7.5442 75.19 5.12 2532 174.4 7.5451 75.13 5.08 2035 183.4 7.5452 75.24 5.03 2039 203.5 7.5561 75.34 2.14 1029 162.7 7.5562 75.36 2.14 1031 178.4 7.6321 49.84 8.10 3541 153.5 7.6322 49.65 8.06 3536 168.6 7.6331 49.88 8.07 3037 163.1 7.6332 49.82 8.05 3036 178.2 7.6441 50.09 5.16 2540 144.0 7.6442 50.08 5.14 2536 158.9 7.6451 50.17 5.04 2046 163.3 7.6452 50.16 5.00 2048 178.4 7.6561 50.68 2.18 1040 143.4 7.6562 50.69 2.16 1037 158.4

66
Table 4.2.2.4 Test Conditions for Steady-State Void Measurement Test Series 8
Run No Pressure Mass Flux Power Inlet Temperature (kg/cm2a) (106 kg/m2hr) (kW) (°C)
8.1232 168.8 10.98 2511.8 316.8 8.1342 168.9 7.91 2011.7 316.9 8.1452 169.2 4.92 1520.2 312.0 8.2131 149.6 15.14 2354.7 316.3 8.2132 149.6 15.14 2356.4 321.3 8.2222 149.9 11.03 2996.2 292.0 8.2231 149.9 11.04 2356.9 301.5 8.2232 150.1 11.00 2359.3 311.9 8.2332 150.1 7.98 2505.4 287.1 8.2351 149.9 7.90 1426.8 316.6 8.2352 150.0 7.93 1424.9 321.6 8.2441 150.2 4.98 2012.1 257.5 8.2442 150.2 4.98 2012.0 262.5 8.2452 149.6 4.93 965.6 321.1 8.3221 124.9 11.10 3010.7 271.7 8.3222 125.0 11.10 3009.9 277.0 8.3332 125.1 8.00 2522.7 277.0 8.3442 125.3 4.98 2020.7 257.7 8.4211 100.0 11.11 3514.9 242.5 8.4212 100.0 11.11 3510.4 247.4 8.4431 100.2 5.00 2534.9 199.1 8.4432 100.2 4.99 2534.9 203.9 8.4562 99.6 2.10 1028.3 213.7 8.5311 75.3 8.05 3529.9 193.6 8.5312 75.4 8.07 3535.4 203.6 8.5442 75.0 4.99 2034.9 213.4 8.6321 50.5 8.05 3048.7 173.1 8.6322 50.7 8.09 3049.1 183.3 8.6441 50.3 5.05 2045.0 168.4 8.6442 50.5 5.05 2043.5 178.3 8.6551 50.3 2.08 1025.2 148.6
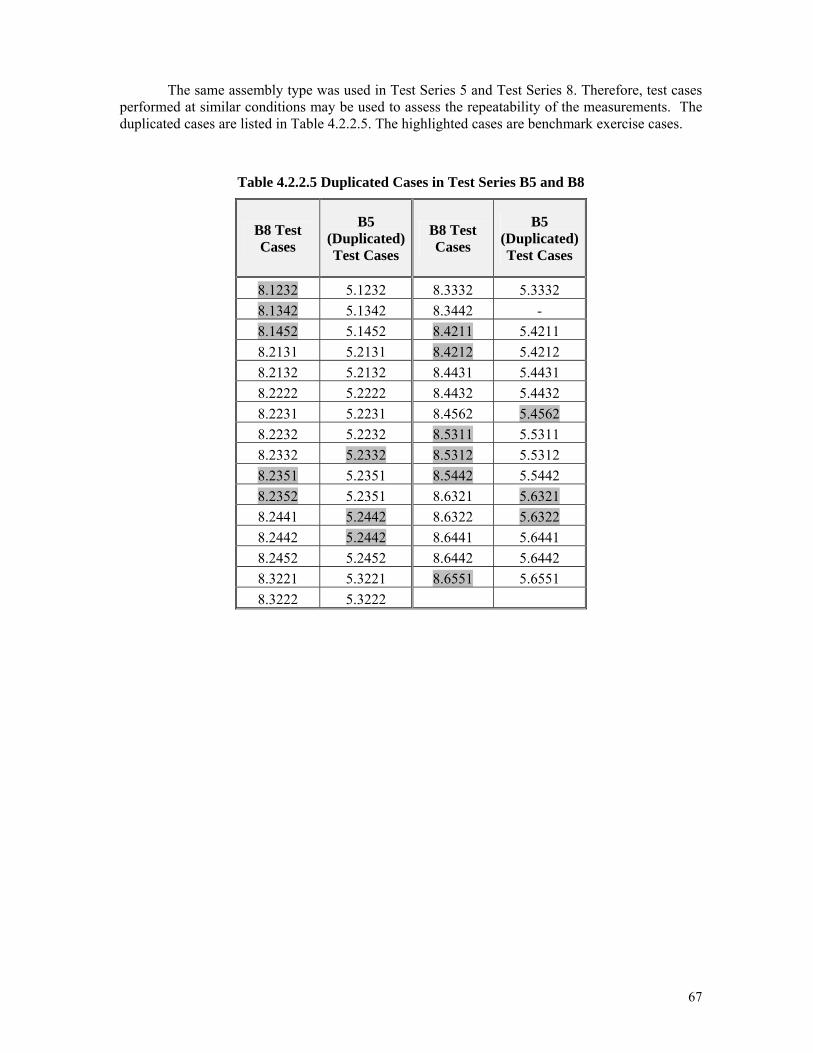
67
The same assembly type was used in Test Series 5 and Test Series 8. Therefore, test cases performed at similar conditions may be used to assess the repeatability of the measurements. The duplicated cases are listed in Table 4.2.2.5. The highlighted cases are benchmark exercise cases.
Table 4.2.2.5 Duplicated Cases in Test Series B5 and B8
B8 Test Cases
B5 (Duplicated) Test Cases
B8 Test Cases
B5 (Duplicated) Test Cases
8.1232 5.1232 8.3332 5.3332
8.1342 5.1342 8.3442 -
8.1452 5.1452 8.4211 5.4211
8.2131 5.2131 8.4212 5.4212
8.2132 5.2132 8.4431 5.4431
8.2222 5.2222 8.4432 5.4432
8.2231 5.2231 8.4562 5.4562
8.2232 5.2232 8.5311 5.5311
8.2332 5.2332 8.5312 5.5312
8.2351 5.2351 8.5442 5.5442
8.2352 5.2351 8.6321 5.6321
8.2441 5.2442 8.6322 5.6322
8.2442 5.2442 8.6441 5.6441
8.2452 5.2452 8.6442 5.6442
8.3221 5.3221 8.6551 5.6551
8.3222 5.3222
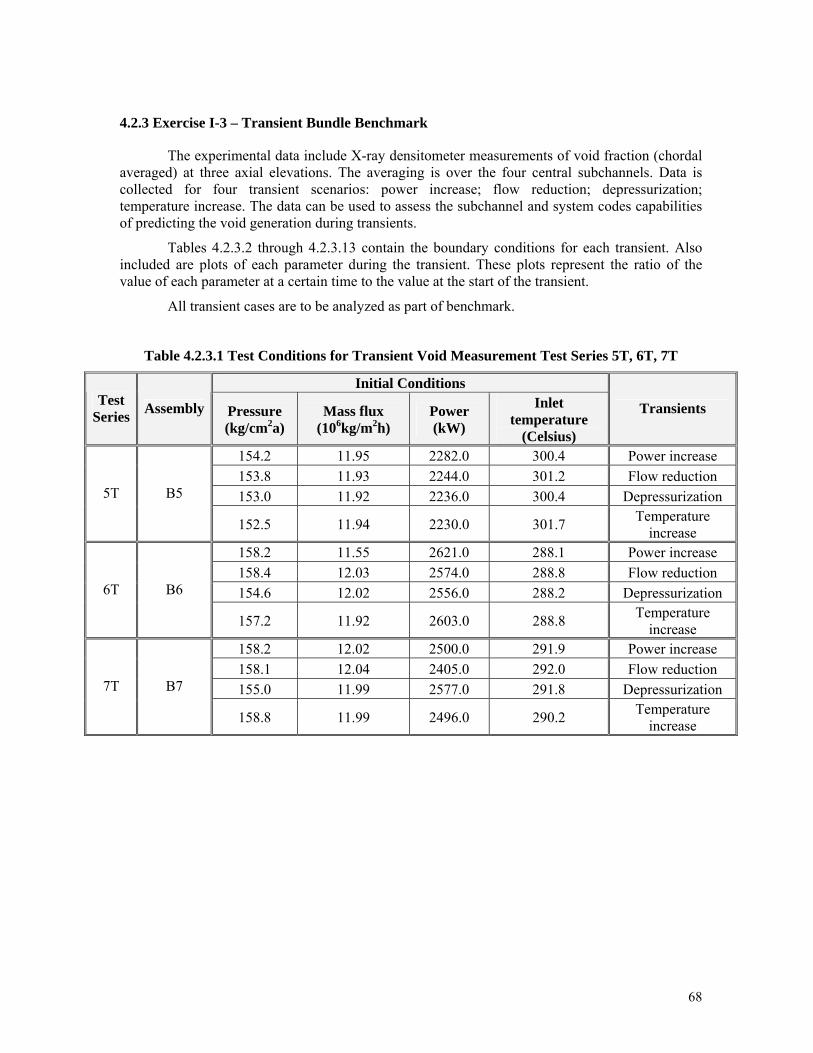
68
4.2.3 Exercise I-3 – Transient Bundle Benchmark
The experimental data include X-ray densitometer measurements of void fraction (chordal averaged) at three axial elevations. The averaging is over the four central subchannels. Data is collected for four transient scenarios: power increase; flow reduction; depressurization; temperature increase. The data can be used to assess the subchannel and system codes capabilities of predicting the void generation during transients.
Tables 4.2.3.2 through 4.2.3.13 contain the boundary conditions for each transient. Also included are plots of each parameter during the transient. These plots represent the ratio of the value of each parameter at a certain time to the value at the start of the transient.
All transient cases are to be analyzed as part of benchmark.
Table 4.2.3.1 Test Conditions for Transient Void Measurement Test Series 5T, 6T, 7T
Initial Conditions Test
Series Assembly Pressure
(kg/cm2a) Mass flux
(106kg/m2h) Power (kW)
Inlet temperature
(Celsius)
Transients
154.2 11.95 2282.0 300.4 Power increase
153.8 11.93 2244.0 301.2 Flow reduction
153.0 11.92 2236.0 300.4 Depressurization 5T B5
152.5 11.94 2230.0 301.7 Temperature
increase 158.2 11.55 2621.0 288.1 Power increase
158.4 12.03 2574.0 288.8 Flow reduction
154.6 12.02 2556.0 288.2 Depressurization 6T B6
157.2 11.92 2603.0 288.8 Temperature
increase 158.2 12.02 2500.0 291.9 Power increase
158.1 12.04 2405.0 292.0 Flow reduction
155.0 11.99 2577.0 291.8 Depressurization 7T B7
158.8 11.99 2496.0 290.2 Temperature
increase

69
Table 4.2.3.2 Transient Void Fraction in Rod Bundle Test Series 5T (Power Increase)
Time Pressure Mass Flux Power Inlet Temperature (sec) (kg/cm2a) (106 kg/m2 hr) (kW) (°C) 30.0 154.2 11.95 2282.0 300.4 30.2 154.4 11.95 2261.0 300.4 30.4 154.3 11.94 2254.0 300.4 30.6 153.9 11.96 2256.0 300.4 30.8 154.1 11.96 2261.0 300.4 31.0 154.0 11.95 2182.0 300.5 31.2 154.1 11.95 2194.0 300.4 31.4 154.2 12.01 2228.0 300.6 31.6 154.3 12.00 2236.0 300.5 31.8 154.4 11.98 2249.0 300.5 32.0 154.4 11.95 2265.0 300.5 32.2 154.5 11.94 2295.0 300.5 32.4 154.3 11.93 2343.0 300.5 32.6 154.3 11.91 2389.0 300.4 32.8 154.3 11.92 2451.0 300.4 33.0 154.3 11.92 2511.0 300.4 33.2 154.4 11.90 2573.0 300.4 33.4 154.4 11.90 2639.0 300.5 33.6 154.5 11.87 2675.0 300.5 33.8 154.4 11.85 2717.0 300.7 34.0 154.5 11.84 2765.0 300.6 34.2 154.6 11.82 2834.0 300.6 34.4 154.5 11.82 2882.0 300.5 34.6 154.6 11.81 2948.0 300.4 34.8 154.4 11.79 2992.0 300.5 35.0 154.7 11.76 3074.0 300.4 35.2 154.8 11.73 3096.0 300.3 35.4 154.9 11.71 3079.0 300.3 35.6 155.0 11.79 3067.0 300.4 35.8 154.9 11.76 3062.0 300.5 36.0 155.2 11.75 3090.0 300.5 36.2 155.0 11.74 3100.0 300.7 36.4 155.0 11.72 3093.0 300.7 36.6 155.3 11.71 3074.0 300.6 36.8 155.1 11.73 3061.0 300.6 37.0 155.3 11.76 3092.0 300.5 37.2 155.0 11.78 3103.0 300.5 37.4 155.0 11.78 3104.0 300.4 37.6 155.0 11.78 3051.0 300.5 37.8 154.9 11.76 3052.0 300.5 38.0 155.1 11.76 3071.0 300.6 38.2 155.0 11.75 3073.0 300.6 38.4 155.1 11.75 3074.0 300.6 38.6 154.9 11.76 3089.0 300.7 38.8 154.9 11.76 3078.0 300.6 39.0 155.0 11.76 3062.0 300.6

70
Table 4.2.3.3 Transient Void Fraction in Rod Bundle Test Series 5T (Flow Reduction)
Time Pressure Mass Flux Power Inlet Temperature
(sec) (kg/cm2a) (106 kg/m2 hr) (kW) (°C) 30.0 153.8 11.93 2244.0 301.2 30.2 153.9 11.93 2228.0 301.2 30.4 154.0 11.94 2234.0 301.2 30.6 153.9 11.95 2233.0 301.2 30.8 153.9 11.86 2259.0 301.1 31.0 154.0 11.13 2256.0 301.1 31.2 153.7 9.88 2259.0 301.2 31.4 153.8 8.68 2250.0 301.2 31.6 153.7 7.94 2241.0 301.2 31.8 153.6 7.63 2242.0 301.1 32.0 153.8 7.38 2233.0 301.2 32.2 153.9 7.06 2240.0 301.1 32.4 154.0 6.77 2219.0 301.2 32.6 154.0 6.59 2246.0 301.1 32.8 153.8 6.55 2240.0 301.2 33.0 153.8 6.69 2234.0 301.2 33.2 153.9 6.96 2239.0 301.2 33.4 153.9 7.22 2225.0 301.2 33.6 154.0 7.38 2233.0 301.1 33.8 154.1 7.49 2240.0 301.2 34.0 154.1 7.88 2228.0 301.2 34.2 154.2 8.53 2239.0 301.2 34.4 154.3 9.15 2228.0 301.2 34.6 154.1 9.55 2236.0 301.2 34.8 154.2 9.71 2234.0 301.3 35.0 154.2 9.77 2243.0 301.2

71
Figure 4.2.3.1 Variation of Properties during Transient for Data Series 5T (Power Increase)
5T - Power Increase
0.90
1.00
1.10
1.20
1.30
1.40
30 32 34 36 38 40
Time (sec)
Rat
io t
o In
itia
l val
ue
Pressure
Mass Flux
Power
Inlet Temperature
Figure 4.2.3.2 Variation of Properties during Transient for Data Series 5T (Flow Reduction)
5T - Flow Reduction
0.50
0.60
0.70
0.80
0.90
1.00
1.10
30 31 32 33 34 35 36
Time (sec)
Rat
io t
o In
itia
l val
ue
Pressure
Mass Flux
Power
Inlet Temperature

72
Table 4.2.3.4 Transient Void Fraction in Rod Bundle in Test Series 5T (Depressurization)
Time Pressure Mass Flux Power Inlet Temperature (sec) (kg/cm2a) (106 kg/m2 hr) (kW) (°C) 20.0 153.0 11.92 2236.0 300.4 24.0 152.6 11.93 2251.0 300.4 28.0 152.3 11.93 2263.0 300.5 32.0 151.7 11.90 2247.0 300.5 36.0 151.1 11.93 2258.0 300.5 40.0 150.4 11.92 2253.0 300.5 44.0 149.5 11.91 2282.0 300.5 48.0 148.4 11.94 2255.0 300.5 52.0 147.5 11.93 2257.0 300.5 56.0 146.3 11.91 2257.0 300.5 60.0 145.2 11.90 2257.0 300.5 64.0 144.1 11.92 2260.0 300.5 68.0 142.9 11.94 2267.0 300.6 72.0 141.5 11.91 2264.0 300.5 76.0 140.6 11.91 2278.0 300.4 80.0 139.5 11.92 2267.0 300.0 84.0 138.2 11.93 2258.0 299.7 88.0 137.0 11.94 2263.0 299.3 92.0 135.8 11.96 2256.0 298.7 96.0 134.4 11.92 2170.0 298.2
100.0 132.8 11.94 2244.0 297.6 104.0 131.6 11.78 2246.0 297.1 108.0 130.4 11.58 2261.0 296.6 112.0 129.5 11.39 2248.0 296.2 116.0 128.7 11.21 2262.0 295.8 120.0 127.8 10.99 2269.0 295.4 124.0 126.8 10.82 2273.0 295.0 128.0 126.0 10.75 2260.0 294.6 132.0 125.2 10.78 2263.0 294.2 136.0 124.1 10.80 2273.0 293.8 138.0 123.8 10.75 2266.0 293.6 142.0 122.7 10.79 2273.0 293.1 146.0 121.6 10.76 2262.0 292.5 150.0 120.6 10.75 2264.0 291.8 154.0 119.5 10.80 2272.0 290.9 158.0 118.2 10.77 2269.0 290.0 162.0 116.9 10.73 2259.0 289.1 166.0 115.7 10.76 2269.0 288.2 170.0 114.7 10.80 2270.0 287.5 174.0 114.3 10.79 2270.0 286.7 178.0 114.2 10.80 2263.0 286.0

73
Table 4.2.3.5 Transient Void Fraction in Rod Bundle in Test Series 5T (Temperature Increase)
Time Pressure Mass Flux Power Inlet Temperature
(sec) (kg/cm2a) (106 kg/m2 hr) (kW) (°C) 60.0 152.5 11.94 2230.0 301.7 62.0 152.5 11.96 2268.0 302.5 64.0 152.7 11.92 2270.0 304.1 66.0 152.3 11.94 2272.0 305.8 68.0 152.3 11.98 2264.0 307.9 70.0 152.5 11.93 2279.0 310.3 72.0 152.8 11.94 2263.0 312.7 74.0 152.7 11.95 2264.0 315.1 76.0 152.5 11.93 2264.0 317.6 78.0 152.7 11.94 2243.0 319.8 80.0 153.0 11.95 2245.0 322.1 82.0 153.5 12.00 2244.0 324.0 84.0 153.7 11.98 2272.0 325.7 86.0 153.7 12.00 2255.0 327.5 88.0 153.8 12.04 2260.0 328.9 90.0 154.8 12.05 2266.0 330.3 92.0 155.2 12.16 2250.0 331.3 94.0 155.3 12.23 2268.0 332.4 96.0 155.4 12.11 2266.0 333.4 98.0 156.0 12.10 2252.0 334.2
100.0 156.3 12.09 2237.0 334.9 102.0 156.4 12.09 2251.0 335.5 104.0 157.5 12.13 2250.0 335.6 106.0 157.6 12.12 2232.0 334.8 108.0 158.0 12.07 2240.0 333.6 110.0 158.4 12.12 2238.0 331.6 112.0 158.8 12.07 2240.0 329.8 114.0 159.0 12.06 2256.0 327.8 116.0 159.6 12.09 2274.0 326.1 118.0 159.7 12.05 2236.0 324.7 120.0 159.8 12.07 2247.0 323.4

74
Figure 4.2.3.3 Variation of Properties during Transient for Data Series 5T (Depressurization)
5T - Depressurization
0.70
0.75
0.80
0.85
0.90
0.95
1.00
1.05
1.10
20 40 60 80 100 120 140 160 180
Time (sec)
Rat
io t
o In
itia
l val
ue
Pressure
Mass Flux
Power
Inlet Temperature
Figure 4.2.3.4 Variation of Properties during Transient for Data Series 5T (Temperature Increase)
5T - Temperature Increase
0.90
0.95
1.00
1.05
1.10
1.15
1.20
60 70 80 90 100 110 120 130
Time (sec)
Rat
io t
o In
itia
l val
ue
Pressure
Mass Flux
Power
Inlet Temperature

75
Table 4.2.3.6 Transient Void Fraction in Rod Bundle in Test Series 6T (Power Increase)
Time Pressure Mass Flux Power Inlet Temperature (sec) (kg/cm2a) (106 kg/m2 hr) (kW) (°C) 24.0 158.2 11.55 2621.0 288.1 24.2 158.2 11.54 2682.0 288.1 24.4 158.2 11.54 2750.0 288.1 24.6 158.2 11.53 2811.0 288.1 24.8 158.2 11.52 2886.0 288.2 25.0 158.2 11.50 2946.0 288.4 25.2 158.2 11.48 3020.0 288.4 25.4 158.3 11.43 3106.0 288.4 25.6 158.3 11.43 3181.0 288.5 25.8 158.4 11.41 3237.0 288.5 26.0 158.4 11.43 3283.0 288.5 26.2 158.5 11.41 3314.0 288.5 26.4 158.5 11.40 3321.0 288.6 26.6 158.6 11.40 3333.0 288.5 26.8 158.6 11.40 3339.0 288.6 27.0 158.6 11.40 3323.0 288.5 27.2 158.6 11.41 3317.0 288.5 27.4 158.7 11.40 3306.0 288.5 27.6 158.7 11.40 3306.0 288.5 27.8 158.7 11.41 3313.0 288.5 28.0 158.7 11.42 3305.0 288.6 28.2 158.7 11.41 3314.0 288.5 28.4 158.8 11.43 3311.0 288.5 28.6 158.8 11.43 3309.0 288.4 28.8 158.8 11.44 3302.0 288.5 29.0 158.8 11.45 3296.0 288.5 29.2 158.8 11.45 3302.0 288.5 29.4 158.8 11.45 3302.0 288.5 29.6 158.8 11.45 3293.0 288.5 29.8 158.9 11.44 3304.0 288.5 30.0 158.9 11.44 3305.0 288.5 30.2 158.9 11.44 3297.0 288.5 30.4 158.9 11.45 3240.0 288.6 30.6 158.9 11.47 3235.0 288.6 30.8 159.0 11.49 3248.0 288.6 31.0 159.0 11.49 3259.0 288.6 31.2 159.0 11.48 3294.0 288.6 31.4 159.0 11.47 3304.0 288.7 31.6 159.1 11.47 3276.0 288.6 31.8 159.1 11.47 3027.0 288.5 32.0 159.1 11.48 2432.0 288.2 32.2 159.0 11.53 1893.0 288.0 32.4 159.0 11.59 1537.0 287.8 32.6 158.9 11.63 1373.0 287.5 32.8 158.8 11.64 1356.0 287.5 33.0 158.7 11.64 1368.0 287.6

76
Table 4.2.3.7 Transient Void Fraction in Rod Bundle in Test Series 6T (Flow Reduction)
Time Pressure Mass Flux Power Inlet Temperature (sec) (kg/cm2a) (106 kg/m2 hr) (kW) (°C) 19.0 158.4 12.03 2574.0 288.8 19.2 158.5 12.02 2562.0 288.8 19.4 158.4 12.01 2561.0 288.8 19.6 158.3 12.01 2544.0 288.8 19.8 158.3 11.90 2548.0 288.8 20.0 158.1 11.22 2557.0 288.8 20.2 157.8 10.18 2560.0 289.0 20.4 157.7 9.14 2563.0 289.2 20.6 157.6 8.38 2571.0 289.3 20.8 157.6 7.97 2581.0 289.5 21.0 157.7 7.72 2583.0 289.5 21.2 157.8 7.50 2573.0 289.6 21.4 157.8 7.32 2575.0 289.6 21.6 157.8 7.17 2579.0 289.6 21.8 157.8 7.12 2583.0 289.7 22.0 157.8 7.16 2593.0 289.6 22.2 157.9 7.27 2551.0 289.6 22.4 157.9 7.37 2587.0 289.6 22.6 157.9 7.45 2572.0 289.6 22.8 158.0 7.53 2536.0 289.6 23.0 158.0 7.82 2484.0 289.5 23.2 158.0 8.29 2511.0 289.4 23.4 158.1 8.76 2541.0 289.3 23.6 158.2 9.12 2551.0 289.2 23.8 158.2 9.32 2571.0 289.2 24.0 158.3 9.49 2567.0 289.1 24.2 158.3 9.70 2574.0 289.0 24.4 158.4 9.89 2576.0 289.0 24.6 158.4 10.05 2572.0 289.1 24.8 158.4 10.15 2566.0 289.0 25.0 158.4 10.35 2559.0 289.1 25.2 158.4 10.61 2567.0 288.9 25.4 158.5 10.86 2564.0 288.9 25.6 158.5 11.05 2576.0 288.9 25.8 158.5 11.15 2572.0 288.9 26.0 158.5 11.22 2544.0 288.9 26.2 158.5 11.29 2537.0 288.9 26.4 158.5 11.34 2541.0 288.9 26.6 158.5 11.39 2550.0 289.0 26.8 158.5 11.39 2552.0 289.0 27.0 158.6 11.36 2557.0 289.1

77
Figure 4.2.3.5 Variation of Properties during Transient for Data Series 6T (Power Increase)
6T - Power Increase
0.50
0.60
0.70
0.80
0.90
1.00
1.10
1.20
1.30
24 26 28 30 32 34
Time (sec)
Rat
io t
o In
itia
l va
lue
Pressure
Mass Flux
Power
Inlet Temperature
Figure 4.2.3.6 Variation of Properties during Transient for Data Series 6T (Flow Reduction)
6T - Flow Reduction
0.50
0.60
0.70
0.80
0.90
1.00
1.10
19 21 23 25 27 29
Time (sec)
Rat
io t
o In
itia
l val
ue
Pressure
Mass Flux
Power
Inlet Temperature

78
Table 4.2.3.8 Transient Void Fraction in Rod Bundle in Test Series 6T (Depressurization)
Time Pressure Mass Flux Power Inlet Temperature (sec) (kg/cm2a) (106 kg/m2 hr) (kW) (°C) 0.0 154.6 12.02 2556.0 288.2 4.0 154.5 11.95 2597.0 288.0 8.0 154.3 11.90 2599.0 288.0
12.0 154.2 11.82 2599.0 287.8 16.0 153.9 11.75 2600.0 287.8 20.0 153.5 11.67 2600.0 287.8 24.0 153.0 11.62 2599.0 287.9 28.0 152.4 11.56 2602.0 287.7 32.0 151.7 11.49 2574.0 287.8 36.0 150.5 11.38 2612.0 287.7 40.0 149.2 11.36 2561.0 287.6 44.0 147.8 11.29 2595.0 287.6 48.0 146.5 11.20 2591.0 287.6 52.0 145.1 11.15 2591.0 287.7 56.0 143.8 11.07 2542.0 287.7 60.0 142.5 11.00 2590.0 287.8 64.0 141.2 10.93 2604.0 288.1 68.0 139.9 10.90 2565.0 288.2 72.0 138.6 10.83 2615.0 288.4 76.0 137.4 10.79 2626.0 288.5 80.0 136.3 10.78 2595.0 288.3 84.0 135.1 10.81 2582.0 287.8 88.0 134.0 10.82 2619.0 287.1 92.0 132.9 10.82 2599.0 286.3 96.0 131.8 10.80 2580.0 285.3 100.0 130.7 10.84 2594.0 284.4 104.0 129.7 10.86 2614.0 283.5 108.0 128.6 10.80 2597.0 282.8 112.0 127.5 10.84 2596.0 282.0 116.0 126.5 10.87 2611.0 281.2 120.0 125.4 10.84 2610.0 280.8 124.0 124.4 10.84 2600.0 280.3 128.0 123.3 10.84 2606.0 279.9 132.0 122.2 10.86 2618.0 279.4 136.0 121.2 10.85 2586.0 279.1 140.0 120.1 10.85 2602.0 278.7 144.0 119.0 10.85 2603.0 278.2 148.0 118.0 10.87 2615.0 277.9 152.0 116.9 10.82 2605.0 277.6 156.0 115.8 10.83 2588.0 277.3 160.0 114.8 10.84 2616.0 277.0 164.0 114.0 10.84 2608.0 276.7 168.0 113.9 10.84 2603.0 276.4 172.0 114.0 10.87 2616.0 276.3 176.0 114.2 10.87 2599.0 275.7 180.0 114.4 10.87 2576.0 275.3 184.0 114.6 10.87 2615.0 274.8 188.0 114.8 10.87 2598.0 274.3 192.0 115.0 10.90 2628.0 273.7 196.0 115.1 10.89 2586.0 272.9

79
Table 4.2.3.9 Transient Void Fraction in Rod Bundle in Test Series 6T (Temperature Increase)
Time Pressure Mass Flux Power Inlet Temperature (sec) (kg/cm2a) (106 kg/m2 hr) (kW) (°C) 56.0 157.2 11.92 2603.0 288.8 58.0 157.2 11.88 2582.0 288.9 60.0 157.1 11.87 2572.0 289.4 62.0 157.0 11.84 2559.0 290.3 64.0 157.0 11.82 2590.0 291.5 66.0 156.9 11.81 2582.0 293.0 68.0 156.8 11.78 2562.0 294.7 70.0 156.7 11.77 2574.0 296.4 72.0 156.7 11.76 2564.0 298.4 74.0 156.7 11.73 2556.0 300.2 76.0 156.6 11.75 2568.0 302.1 78.0 156.7 11.75 2578.0 303.8 80.0 156.7 11.76 2566.0 305.5 82.0 156.8 11.73 2566.0 307.1 84.0 156.9 11.72 2553.0 308.7 86.0 157.0 11.68 2557.0 310.1 88.0 157.1 11.66 2559.0 311.5 90.0 157.3 11.70 2561.0 312.9 92.0 157.4 11.69 2562.0 314.2 94.0 157.6 11.70 2551.0 315.4 96.0 157.8 11.70 2569.0 316.6 98.0 158.0 11.69 2561.0 317.6 100.0 158.2 11.72 2549.0 318.8 102.0 158.6 11.74 2567.0 319.7 104.0 158.9 11.70 2556.0 320.6 106.0 159.2 11.74 2568.0 321.4 108.0 159.6 11.72 2563.0 322.2 110.0 160.0 11.75 2544.0 322.9 112.0 160.4 11.75 2552.0 323.6 114.0 160.8 11.82 2464.0 324.2 116.0 161.3 11.82 2561.0 324.8 118.0 161.8 11.88 2558.0 325.4 120.0 162.2 11.90 2541.0 325.9 122.0 162.8 11.96 2563.0 326.3 124.0 163.3 11.99 2553.0 326.9 126.0 163.9 12.03 2576.0 327.3 128.0 164.5 12.08 2506.0 327.4 130.0 165.1 12.11 2543.0 327.3 132.0 165.7 12.14 2546.0 326.4 134.0 166.3 12.21 2531.0 325.4 136.0 166.8 12.19 2544.0 323.9 138.0 167.3 12.20 2556.0 322.2 140.0 167.7 12.24 2546.0 320.4 142.0 168.0 12.20 2568.0 318.6 144.0 168.3 12.26 2565.0 316.7 146.0 168.5 12.24 2537.0 315.1 148.0 168.6 12.23 2540.0 313.4 150.0 168.7 12.23 2551.0 312.0 152.0 168.7 12.24 2560.0 310.6 154.0 168.7 12.22 2567.0 309.3 156.0 168.6 12.22 2566.0 308.2 158.0 168.4 12.19 2542.0 307.1 160.0 168.3 12.17 2561.0 306.1

80
Figure 4.2.3.7 Variation of Properties during Transient for Data Series 6T (Depressurization)
6T - Depressurization
0.70
0.75
0.80
0.85
0.90
0.95
1.00
1.05
1.10
0 25 50 75 100 125 150 175 200
Time (sec)
Rat
io t
o In
itia
l val
ue
Pressure
Mass Flux
Power
Inlet Temperature
Figure 4.2.3.8 Variation of Properties during Transient for Data Series 6T (Temperature Increase)
6T - Temperature Increase
0.90
0.95
1.00
1.05
1.10
1.15
1.20
50 75 100 125 150 175
Time (sec)
Rat
io t
o In
itia
l val
ue
Pressure
Mass Flux
Power
Inlet Temperature

81
Table 4.2.3.10 Transient Void Fraction in Rod Bundle in Test Series 7T (Power Increase)
Time Pressure Mass Flux Power Inlet Temperature (sec) (kg/cm2a) (106 kg/m2 hr) (kW) (°C) 32.0 158.2 12.02 2500.0 291.9 32.2 158.2 12.02 2504.0 291.9 32.4 158.2 12.02 2503.0 291.9 32.6 158.2 12.02 2492.0 291.9 32.8 158.2 12.02 2490.0 291.9 33.0 158.2 12.03 2513.0 291.9 33.2 158.2 12.02 2561.0 291.9 33.4 158.2 12.01 2617.0 292.0 33.6 158.2 12.01 2680.0 292.1 33.8 158.2 11.99 2741.0 292.1 34.0 158.2 11.98 2803.0 292.1 34.2 158.2 11.96 2862.0 292.1 34.4 158.3 11.96 2913.0 292.2 34.6 158.3 11.95 2962.0 292.2 34.8 158.3 11.93 3027.0 292.3 35.0 158.4 11.91 3083.0 292.3 35.2 158.4 11.89 3141.0 292.3 35.4 158.5 11.88 3234.0 292.3 35.6 158.5 11.86 3294.0 292.4 35.8 158.6 11.85 3346.0 292.3 36.0 158.6 11.86 3408.0 292.3 36.2 158.7 11.84 3445.0 292.2 36.4 158.8 11.84 3444.0 292.3 36.6 158.8 11.83 3443.0 292.3 36.8 158.8 11.82 3451.0 292.3 37.0 158.9 11.81 3451.0 292.3 37.2 158.9 11.82 3448.0 292.3 37.4 158.9 11.83 3417.0 292.3 37.6 159.0 11.85 3421.0 292.4 37.8 159.0 11.84 3445.0 292.4 38.0 159.0 11.84 3450.0 292.4 38.2 159.1 11.83 3462.0 292.3 38.4 159.1 11.83 3448.0 292.3 38.6 159.1 11.82 3438.0 292.3 38.8 159.1 11.83 3455.0 292.2 39.0 159.2 11.83 3457.0 292.3 39.2 159.2 11.82 3468.0 292.4 39.4 159.2 11.83 3465.0 292.4 39.6 159.2 11.82 3433.0 292.4 39.8 159.3 11.82 3434.0 292.3 40.0 159.3 11.84 3435.0 292.3 40.2 159.3 11.85 3446.0 292.3 40.4 159.4 11.85 3450.0 292.4 40.6 159.4 11.85 3437.0 292.4 40.8 159.4 11.84 3441.0 292.4 41.0 159.5 11.84 3443.0 292.4 41.2 159.5 11.84 3444.0 292.4 41.4 159.5 11.84 3440.0 292.4 41.6 159.6 11.84 3435.0 292.4 41.8 159.6 11.84 3439.0 292.4 42.0 159.6 11.85 3467.0 292.4

82
Table 4.2.3.11 Transient Void Fraction in Rod Bundle in Test Series 7T (Flow Reduction)
Time Pressure Mass Flux Power Inlet Temperature (sec) (kg/cm2a) (106 kg/m2 hr) (kW) (°C) 157.0 158.1 12.04 2405.0 292.0 157.2 158.1 12.03 2426.0 292.0 157.4 158.1 12.04 2435.0 292.0 157.6 158.1 12.03 2433.0 292.0 157.8 158.1 11.77 2432.0 292.0 158.0 158.0 11.30 2418.0 292.0 158.2 157.9 10.79 2427.0 292.1 158.4 157.8 10.38 2430.0 292.2 158.6 157.7 10.13 2427.0 292.1 158.8 157.7 9.76 2430.0 292.2 159.0 157.5 9.21 2432.0 292.3 159.2 157.5 8.63 2431.0 292.4 159.4 157.5 8.20 2429.0 292.6 159.6 157.5 7.94 2432.0 292.6 159.8 157.6 7.69 2432.0 292.7 160.0 157.6 7.38 2441.0 295.7 160.2 157.6 7.04 2439.0 292.8 160.4 157.6 6.79 2426.0 292.7 160.6 157.7 6.66 2426.0 292.8 160.8 157.7 6.64 2428.0 292.8 161.0 157.8 6.69 2415.0 292.8 161.2 157.8 6.75 2414.0 292.8 161.4 157.9 6.79 2415.0 292.8 161.6 157.9 6.82 2420.0 292.8 161.8 158.0 6.89 2421.0 292.7 162.0 158.0 7.00 2425.0 292.8 162.2 158.1 7.11 2419.0 292.6 162.4 158.2 7.20 2431.0 292.7 162.6 158.2 7.25 2430.0 292.7 162.8 158.2 7.27 2425.0 292.8 163.0 158.3 7.27 2417.0 292.8 163.2 158.3 7.26 2420.0 292.9 163.4 158.4 7.26 2421.0 292.8 163.6 158.4 7.25 2428.0 292.7 163.8 158.4 7.26 2425.0 292.7 164.0 158.5 7.26 2417.0 292.7 164.2 158.5 7.27 2423.0 292.8 164.4 158.6 7.27 2416.0 292.7 164.6 158.6 7.27 2426.0 292.7 164.8 158.6 7.27 2420.0 292.8 165.0 158.7 7.27 2418.0 292.8 165.2 158.8 7.27 2418.0 292.8 165.4 158.8 7.26 2427.0 292.8 165.6 158.9 7.26 2433.0 292.8 165.8 158.9 7.27 2432.0 292.9 166.0 159.0 7.27 2431.0 293.0 166.2 159.1 7.26 2432.0 293.1 166.4 159.1 7.27 2435.0 293.1 166.6 159.2 7.28 2436.0 293.1 166.8 159.2 7.28 2428.0 293.2 167.0 159.3 7.27 2432.0 293.2

83
Figure 4.2.3.9 Variation of Properties during Transient for Data Series 7T (Power Increase)
7T - Power Increase
0.90
1.00
1.10
1.20
1.30
1.40
32 34 36 38 40 42 44
Time (sec)
Rat
io t
o In
itia
l va
lue
Pressure
Mass Flux
Power
Inlet Temperature
Figure 4.2.3.10 Variation of Properties during Transient for Data Series 7T (Flow Reduction)
7T - Flow Reduction
0.50
0.60
0.70
0.80
0.90
1.00
1.10
157 159 161 163 165 167 169
Time (sec)
Rat
io t
o In
itia
l val
ue
Pressure
Mass Flux
Power
Inlet Temperature
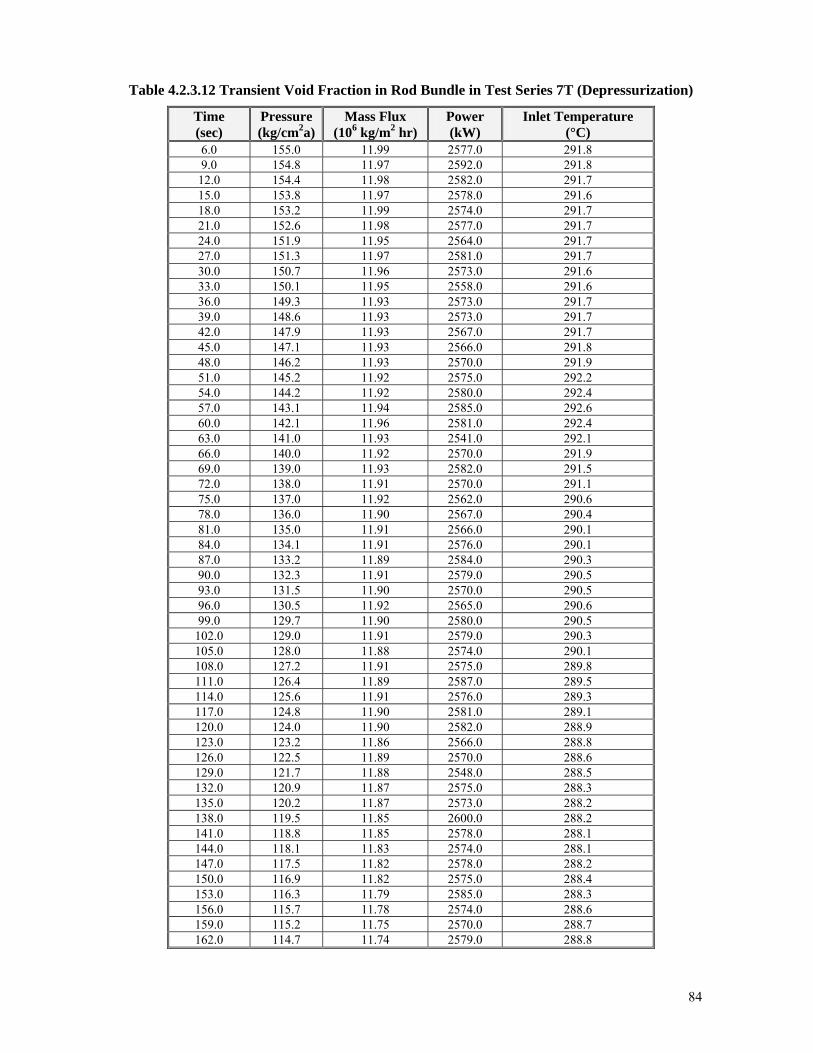
84
Table 4.2.3.12 Transient Void Fraction in Rod Bundle in Test Series 7T (Depressurization)
Time Pressure Mass Flux Power Inlet Temperature (sec) (kg/cm2a) (106 kg/m2 hr) (kW) (°C) 6.0 155.0 11.99 2577.0 291.8 9.0 154.8 11.97 2592.0 291.8 12.0 154.4 11.98 2582.0 291.7 15.0 153.8 11.97 2578.0 291.6 18.0 153.2 11.99 2574.0 291.7 21.0 152.6 11.98 2577.0 291.7 24.0 151.9 11.95 2564.0 291.7 27.0 151.3 11.97 2581.0 291.7 30.0 150.7 11.96 2573.0 291.6 33.0 150.1 11.95 2558.0 291.6 36.0 149.3 11.93 2573.0 291.7 39.0 148.6 11.93 2573.0 291.7 42.0 147.9 11.93 2567.0 291.7 45.0 147.1 11.93 2566.0 291.8 48.0 146.2 11.93 2570.0 291.9 51.0 145.2 11.92 2575.0 292.2 54.0 144.2 11.92 2580.0 292.4 57.0 143.1 11.94 2585.0 292.6 60.0 142.1 11.96 2581.0 292.4 63.0 141.0 11.93 2541.0 292.1 66.0 140.0 11.92 2570.0 291.9 69.0 139.0 11.93 2582.0 291.5 72.0 138.0 11.91 2570.0 291.1 75.0 137.0 11.92 2562.0 290.6 78.0 136.0 11.90 2567.0 290.4 81.0 135.0 11.91 2566.0 290.1 84.0 134.1 11.91 2576.0 290.1 87.0 133.2 11.89 2584.0 290.3 90.0 132.3 11.91 2579.0 290.5 93.0 131.5 11.90 2570.0 290.5 96.0 130.5 11.92 2565.0 290.6 99.0 129.7 11.90 2580.0 290.5
102.0 129.0 11.91 2579.0 290.3 105.0 128.0 11.88 2574.0 290.1 108.0 127.2 11.91 2575.0 289.8 111.0 126.4 11.89 2587.0 289.5 114.0 125.6 11.91 2576.0 289.3 117.0 124.8 11.90 2581.0 289.1 120.0 124.0 11.90 2582.0 288.9 123.0 123.2 11.86 2566.0 288.8 126.0 122.5 11.89 2570.0 288.6 129.0 121.7 11.88 2548.0 288.5 132.0 120.9 11.87 2575.0 288.3 135.0 120.2 11.87 2573.0 288.2 138.0 119.5 11.85 2600.0 288.2 141.0 118.8 11.85 2578.0 288.1 144.0 118.1 11.83 2574.0 288.1 147.0 117.5 11.82 2578.0 288.2 150.0 116.9 11.82 2575.0 288.4 153.0 116.3 11.79 2585.0 288.3 156.0 115.7 11.78 2574.0 288.6 159.0 115.2 11.75 2570.0 288.7 162.0 114.7 11.74 2579.0 288.8

85
Table 4.2.3.13 Transient Void Fraction in Rod Bundle in Test Series 7T (Temperature Increase)
Time Pressure Mass Flux Power Inlet Temperature (sec) (kg/cm2a) (106 kg/m2 hr) (kW) (°C) 50.0 158.8 11.99 2496.0 290.2 52.0 158.8 11.97 2509.0 291.5 54.0 158.9 11.93 2509.0 292.5 56.0 158.9 11.92 2514.0 293.5 58.0 158.9 11.90 2494.0 294.3 60.0 159.0 11.91 2502.0 295.1 62.0 159.1 11.94 2501.0 296.2 64.0 159.1 11.90 2507.0 297.9 66.0 159.2 11.90 2500.0 300.2 68.0 159.3 11.91 2501.0 303.0 70.0 159.6 11.90 2505.0 305.7 72.0 159.5 11.93 2512.0 309.0 74.0 159.7 11.88 2504.0 312.2 76.0 160.1 11.91 2508.0 315.1 78.0 160.5 11.93 2512.0 318.1 80.0 161.1 11.95 2490.0 320.5 82.0 161.8 12.13 2484.0 322.6 84.0 162.5 12.12 2480.0 323.7 86.0 163.3 12.02 2497.0 324.6 88.0 164.1 12.08 2483.0 325.5 90.0 164.8 12.02 2503.0 326.3 92.0 165.7 12.05 2483.0 327.2 94.0 166.5 12.04 2494.0 328.0 96.0 167.3 12.04 2501.0 328.9 98.0 168.2 12.04 2486.0 329.5 100.0 169.0 12.04 2486.0 329.1 102.0 169.8 12.04 2501.0 327.8 104.0 170.5 12.02 2487.0 325.8 106.0 171.2 12.00 2500.0 323.6 108.0 171.7 12.00 2503.0 321.1 110.0 172.2 12.00 2503.0 319.1 112.0 172.5 11.98 2498.0 317.3 114.0 172.8 11.94 2509.0 315.6 116.0 173.1 11.99 2500.0 314.2 118.0 173.2 11.97 2478.0 313.1 120.0 173.3 11.93 2512.0 311.9 122.0 173.4 11.94 2516.0 311.1 124.0 173.5 11.98 2503.0 310.1 126.0 173.5 11.91 2502.0 309.2 128.0 173.5 11.92 2503.0 308.4 130.0 173.5 11.96 2503.0 307.7 132.0 173.4 11.93 2500.0 307.0 134.0 173.4 11.94 2505.0 306.4 136.0 173.3 11.93 2501.0 305.8 138.0 173.2 11.94 2525.0 305.1 140.0 173.2 11.92 2513.0 304.7 142.0 173.1 11.89 2503.0 304.1 144.0 173.0 11.92 2493.0 303.5 146.0 172.9 11.95 2491.0 303.1 148.0 172.8 11.95 2502.0 302.5

86
Figure 4.2.3.11 Variation of Properties during Transient for Data Series 7T (Depressurization)
7T - Depressurization
0.70
0.75
0.80
0.85
0.90
0.95
1.00
1.05
0 25 50 75 100 125 150 175
Time (sec)
Rat
io t
o In
itia
l val
ue
Pressure
Mass Flux
Power
Inlet Temperature
Figure 4.2.3.12 Variation of Properties during Transient for Data Series 7T (Temperature Increase)
5T - Temperature Increase
0.90
0.95
1.00
1.05
1.10
1.15
1.20
50 70 90 110 130 150
Time (sec)
Rat
io t
o In
itia
l val
ue
Pressure
Mass Flux
Power
Inlet Temperature

87
4.2.4 Exercise I-4 – Pressure Drop Benchmark As previously mentioned, no data is available for code-to-data pressure drop comparison. However, code-to-code comparisons will be performed on the pressure drop calculations for the typical central subchannel. The boundary conditions include both single-phase and two-phase conditions. Exercise cases to be calculated correspond to Test Series 1 of the steady-state central subchannel void measurements as given in Table 4.2.1.1. This benchmark will assess the wall friction and the two-phase multiplier models of the codes used.
Code-to-code comparisons will also be performed on the pressure drop calculations for the bundle. Exercise cases to be calculated correspond to Test Series 5 of the steady-state bundle void measurements as given in Table 4.2.1.4. This benchmark will assess the pressure loss and the two-phase multiplier models of the codes used.
4.3 Phase II: DNB Benchmark
Table 4.3.1 summarizes the test series performed for the DNB measurements in Exercises 1, 2, and 3 of Phase 2.
Table 4.3.1 Test Series for DNB Measurement
Test mode Measurement Test series
Test section
AssemblySteady-
State Transient DNB Fluid
temperature 0 A0 Y Y 1 A1 Y Y 2
55
A2 Y Y 3 66 A3 Y Y 4 A4 Y Y 8 A8 Y Y
11T A11 Y Y 12T A12 Y Y 13
55
A4 Y Y 4.3.1 Exercise II-1 – Steady-State Fluid Temperature Benchmark
In addition to the void distribution and DNB power measurements; data is available for the
subchannel exit fluid temperature. The data can be applied to both subchannel/system and CFD codes.
The highlighted cases are selected to be analyzed.
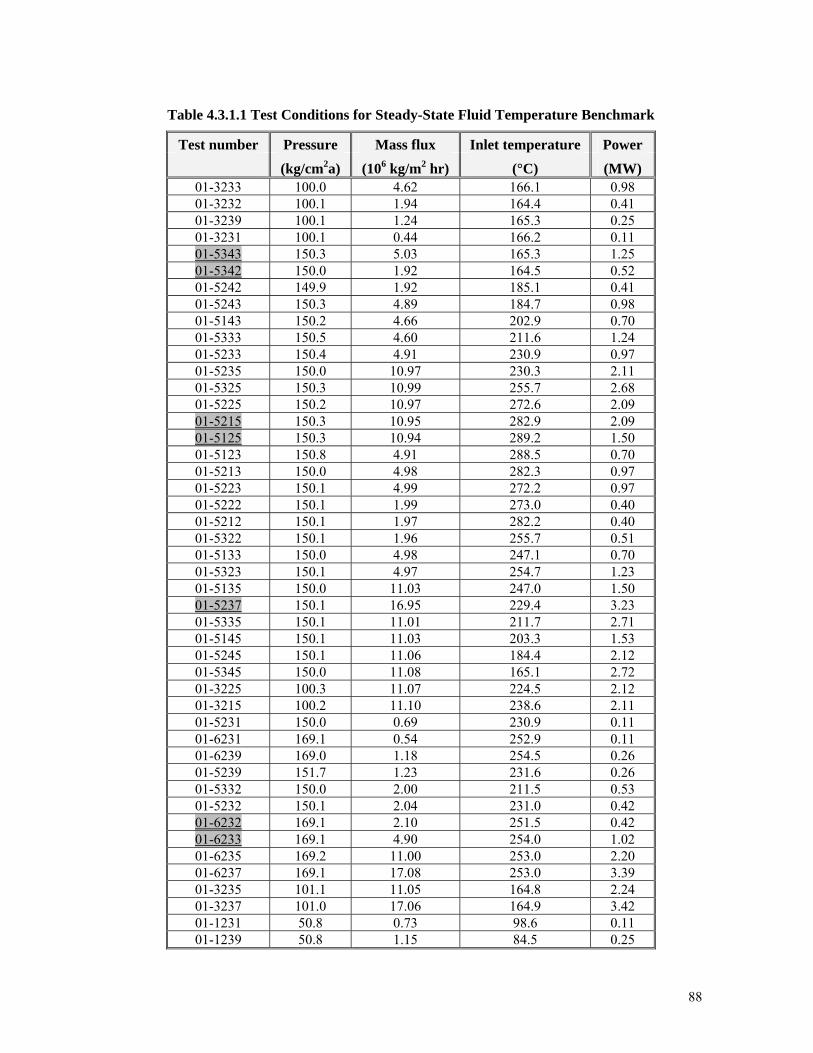
88
Table 4.3.1.1 Test Conditions for Steady-State Fluid Temperature Benchmark
Test number Pressure Mass flux Inlet temperature Power
(kg/cm2a) (106 kg/m2 hr) (°C) (MW) 01-3233 100.0 4.62 166.1 0.98 01-3232 100.1 1.94 164.4 0.41 01-3239 100.1 1.24 165.3 0.25 01-3231 100.1 0.44 166.2 0.11 01-5343 150.3 5.03 165.3 1.25 01-5342 150.0 1.92 164.5 0.52 01-5242 149.9 1.92 185.1 0.41 01-5243 150.3 4.89 184.7 0.98 01-5143 150.2 4.66 202.9 0.70 01-5333 150.5 4.60 211.6 1.24 01-5233 150.4 4.91 230.9 0.97 01-5235 150.0 10.97 230.3 2.11 01-5325 150.3 10.99 255.7 2.68 01-5225 150.2 10.97 272.6 2.09 01-5215 150.3 10.95 282.9 2.09 01-5125 150.3 10.94 289.2 1.50 01-5123 150.8 4.91 288.5 0.70 01-5213 150.0 4.98 282.3 0.97 01-5223 150.1 4.99 272.2 0.97 01-5222 150.1 1.99 273.0 0.40 01-5212 150.1 1.97 282.2 0.40 01-5322 150.1 1.96 255.7 0.51 01-5133 150.0 4.98 247.1 0.70 01-5323 150.1 4.97 254.7 1.23 01-5135 150.0 11.03 247.0 1.50 01-5237 150.1 16.95 229.4 3.23 01-5335 150.1 11.01 211.7 2.71 01-5145 150.1 11.03 203.3 1.53 01-5245 150.1 11.06 184.4 2.12 01-5345 150.0 11.08 165.1 2.72 01-3225 100.3 11.07 224.5 2.12 01-3215 100.2 11.10 238.6 2.11 01-5231 150.0 0.69 230.9 0.11 01-6231 169.1 0.54 252.9 0.11 01-6239 169.0 1.18 254.5 0.26 01-5239 151.7 1.23 231.6 0.26 01-5332 150.0 2.00 211.5 0.53 01-5232 150.1 2.04 231.0 0.42 01-6232 169.1 2.10 251.5 0.42 01-6233 169.1 4.90 254.0 1.02 01-6235 169.2 11.00 253.0 2.20 01-6237 169.1 17.08 253.0 3.39 01-3235 101.1 11.05 164.8 2.24 01-3237 101.0 17.06 164.9 3.42 01-1231 50.8 0.73 98.6 0.11 01-1239 50.8 1.15 84.5 0.25

89
Table 4.3.1.1 Test Conditions for Steady-State Fluid Temperature Benchmark – Cont.
Test number Pressure Mass flux Inlet temperature Power (kg/cm2a) (106 kg/m2 hr) (°C) (MW)
01-1232 50.9 2.00 87.2 0.41 01-1233 50.1 5.03 85.0 1.01 01-1235 50.0 11.05 86.0 2.24 01-1237 50.2 17.00 86.0 3.44 01-3245 100.1 10.99 103.6 2.22 01-5255 150.1 11.02 113.8 2.22 01-5355 150.0 11.03 94.3 2.85 01-5155 150.1 11.02 133.2 1.59 01-5153 150.1 5.05 132.9 0.72 01-5253 150.1 5.02 113.3 1.01 01-5353 150.0 5.03 93.4 1.31 01-5352 150.0 1.99 93.3 0.52 01-5252 150.0 1.95 113.9 0.41

90
4.3.2 Exercise II-2 – Steady-State DNB Benchmark
The experimental data include the power at which departure from nucleate boiling occurs and the corresponding location in the bundle (for selected test cases only). The data can be applied to thermal-hydraulic subchannel and system codes and CFD codes.
The highlighted cases are selected to be analyzed.
Table 4.3.2.1 Test Conditions for Steady-State DNB Test Series 0
Test number Pressure Mass flux Inlet Temperature (kg/cm2a) (106 kg/m2hr) (°C)
00-3230 100.4 5.07 243.2 00-3240 100.7 8.13 242.7 00-3260 101.1 14.28 242.9 00-3270 101.0 17.20 240.9 00-4270 125.8 16.78 262.7 00-4260 126.3 14.27 262.7 00-4240 125.8 8.14 262.4 00-4230 125.2 5.07 263.0 00-5330 150.4 5.08 253.9 00-5340 150.3 8.09 253.1 00-5350 150.1 11.23 252.9 00-5360 150.7 14.28 252.8 00-5370 150.3 17.13 253.3 00-3550 102.6 11.28 147.1 00-4550 125.6 11.27 170.5 00-3460 103.7 14.36 179.8 00-3440 100.1 8.22 179.8 00-3430 100.1 5.12 180.1 00-4430 125.7 5.11 203.6 00-4440 125.6 8.09 202.4 00-4460 125.4 14.20 202.0 00-5560 150.7 14.23 191.8 00-5550 150.5 11.23 191.9 00-5540 152.8 8.19 192.7 00-5530 150.3 5.15 192.0 00-3770 100.8 17.18 193.4 00-3350 99.5 11.14 210.4 00-4770 126.7 17.13 216.0 00-5450 150.7 11.13 223.4 00-3551 103.1 11.31 147.2 00-4551 125.6 11.30 170.2 00-5551 150.1 11.26 192.1 00-6550 169.2 11.23 208.5 00-5451 151.8 11.14 224.0 00-5870 151.5 17.17 227.3 00-6470 169.8 17.16 238.6 00-6460 171.3 14.28 238.7

91
Table 4.3.2.1 Test Conditions for Steady-State DNB Test Series 0 – Cont.
Test number Pressure Mass flux Inlet Temperature (kg/cm2a) (106 kg/m2hr) (°C)
00-6440 171.0 8.13 238.6 00-6430 169.5 5.12 237.9 00-5331 150.4 5.13 253.4 00-5351 150.5 11.19 252.4 00-5371 150.5 17.21 252.7 00-5352 150.2 11.15 252.2 00-6350 169.3 11.12 278.6 00-6270 170.6 17.09 295.4 00-6260 169.3 14.16 294.4 00-6240 168.9 8.12 295.4 00-6230 169.2 5.12 296.2 00-5250 150.6 11.16 281.8 00-7680 159.7 12.23 287.1 00-5251 150.4 11.80 281.5 00-7681 159.8 12.22 288.2 00-4150 124.9 11.10 305.1 00-5130 150.0 5.08 321.6 00-5140 150.5 8.09 321.2 00-5150 150.7 11.09 321.3 00-5160 150.4 14.15 321.0 00-5170 150.8 17.80 321.4 00-6150 168.9 11.06 331.9 00-5151 150.5 11.09 320.9 00-6151 169.3 11.07 332.4 00-4151 125.5 11.10 304.8 00-3150 101.2 11.20 287.4 00-5252 150.6 11.14 281.0 00-3151 100.3 11.19 286.9 00-4350 125.3 11.20 232.5 00-3351 100.2 11.18 211.7 00-4351 125.3 10.95 232.8 00-3352 100.2 10.93 211.7 00-6551 169.1 10.92 208.8

92
Table 4.3.2.2 Test Conditions for Steady-State DNB Test Series 2
Test number Pressure Mass flux Inlet Temperature (kg/cm2a) (106 kg/m2hr) (°C)
02-2430 75.9 5.03 154.4 02-3430 100.0 5.01 181.0 02-3440 100.5 7.98 178.9 02-2450 76.9 10.90 154.0 02-1450 51.7 10.81 123.2 02-1440 50.9 8.05 123.1 02-1430 50.8 4.97 125.6 02-1420 50.3 2.10 122.6 02-1490 53.5 1.24 128.4 02-4230 125.3 4.89 264.0 02-3230 100.3 4.97 243.4 02-3240 100.7 7.98 243.0 02-3260 100.5 14.13 241.9 02-3270 100.3 16.83 241.9 02-4350 125.7 10.97 233.6 02-4370 125.3 17.04 232.6 02-4270 125.4 16.98 262.9 02-5270 150.0 16.92 281.8 02-7680 158.6 12.03 289.9 02-5250 150.3 10.95 282.3 02-5340 150.0 7.98 253.1 02-5330 149.9 4.93 254.9 02-3420 100.3 2.02 186.4 02-3490 100.5 1.23 175.1 02-1220 50.4 2.09 190.3 02-1230 50.6 4.98 190.8 02-1240 50.9 8.00 189.5 02-1250 52.7 11.03 188.7 02-1260 52.5 14.03 189.0 02-1360 52.7 14.01 155.7 02-1270 53.5 16.89 188.8 02-2270 76.8 16.97 219.5 02-2250 77.4 11.01 219.2 02-1150 52.3 11.06 238.2 02-2150 77.7 11.03 265.4 02-3150 101.6 10.98 287.3 02-3241 100.5 7.98 243.0 02-2230 76.7 4.93 220.1 02-1290 49.4 1.14 200.9 02-3290 100.3 1.18 245.5 02-3220 99.8 1.96 244.7 02-4150 125.5 10.86 306.1 02-5251 150.7 10.93 282.4 02-7681 158.6 12.03 288.9 02-6330 169.8 5.02 268.0

93
Table 4.3.2.2 Test Conditions for Steady-State DNB Test Series 2 – Cont.
Test number Pressure Mass flux Inlet Temperature (kg/cm2a) (106 kg/m2hr) (°C)
02-6350 170.1 10.88 266.9 02-6370 169.7 16.90 267.4 02-5370 150.6 16.94 254.0 02-5360 150.7 14.04 252.9 02-5350 150.7 11.08 253.0 02-5290 150.0 1.20 274.8 02-5220 150.3 2.03 270.3 02-5130 150.1 4.92 322.4 02-5140 150.6 7.87 321.5 02-5490 151.5 1.27 225.9 02-5420 151.3 2.00 229.2 02-3242 100.9 7.97 242.9 02-5252 149.2 10.96 282.7 02-7682 157.2 11.98 288.5 02-5170 149.2 17.17 321.7 02-5160 150.2 13.94 322.7 02-5150 150.7 10.82 322.5 02-6150 169.5 10.89 333.8 02-6250 170.8 10.91 296.2 02-6450 169.4 10.89 238.8 02-6550 169.0 10.95 206.4 02-5450 149.7 10.92 222.2 02-5460 151.0 13.86 222.7 02-5550 150.1 10.96 189.6 02-5540 150.2 8.02 189.5 02-5530 150.3 5.03 190.3 02-4430 126.0 4.95 201.8 02-3350 101.1 10.76 212.4 02-3460 102.2 14.00 178.5 02-4550 124.9 11.03 168.3 02-3550 100.8 10.97 145.7

94
Table 4.3.2.3 Test Conditions for Steady-State DNB Test Series 3
Test number Pressure Mass flux Inlet Temperature (kg/cm2a) (106 kg/m2hr) (°C)
03-3430 100.3 5.03 180.4 03-3440 100.3 8.05 179.6 03-4550 126.2 11.05 168.8 03-3350 100.6 11.02 210.8 03-3360 99.9 13.77 209.9 03-4350 125.5 10.71 233.3 03-4360 125.4 13.71 232.5 03-4370 126.0 16.76 233.4 03-5460 150.6 13.61 222.5 03-5330 150.3 4.95 254.0 03-5340 150.2 8.02 253.3 03-5250 150.3 11.00 282.5 03-7680 158.1 12.06 289.2 03-5350 150.5 11.02 253.2 03-5360 150.5 13.76 252.7 03-5370 150.7 16.93 252.8 03-5270 150.9 16.72 282.6 03-4270 125.5 16.71 262.8 03-4260 125.1 13.87 262.8 03-4240 125.1 7.99 263.3 03-4230 125.1 4.99 263.9 03-3230 100.1 5.00 243.5 03-3240 100.4 7.94 242.8 03-3260 100.5 13.74 241.5 03-3270 100.2 16.87 242.9 03-3550 100.9 10.83 161.4 03-5530 150.0 5.01 190.9 03-5540 150.3 7.98 190.4 03-4430 125.1 5.02 201.5 03-4440 125.2 7.99 201.4 03-3351 101.0 10.82 212.1 03-5550 150.2 10.92 190.3 03-5450 150.0 10.96 222.4 03-6460 169.6 13.77 238.5 03-6450 169.3 10.73 238.9 03-6440 169.8 7.98 238.5 03-6430 168.8 5.02 238.5 03-6330 169.2 4.96 268.6 03-6350 169.7 10.97 268.4 03-5351 150.5 11.03 252.1 03-5251 150.5 10.97 282.5 03-5352 150.6 11.06 252.9 03-6370 169.8 16.53 268.8 03-6270 169.5 16.62 297.0 03-6260 169.2 13.69 296.7

95
Table 4.3.2.3 Test Conditions for Steady-State DNB Test Series 3 – Cont.
Test number Pressure Mass flux Inlet Temperature (kg/cm2a) (106 kg/m2hr) (°C)
03-5252 150.3 10.76 282.8 03-6240 169.3 7.91 296.5 03-6230 169.3 4.94 296.9 03-5130 150.3 4.90 323.0 03-5140 150.3 7.79 322.8 03-5150 150.6 10.92 323 03-6150 168.9 10.95 334.5 03-5160 150.4 13.66 322.5 03-5170 150.4 16.71 322.7 03-4150 125.3 10.77 306.2 03-3150 100 10.78 287.8 03-3352 100.3 10.73 211.5
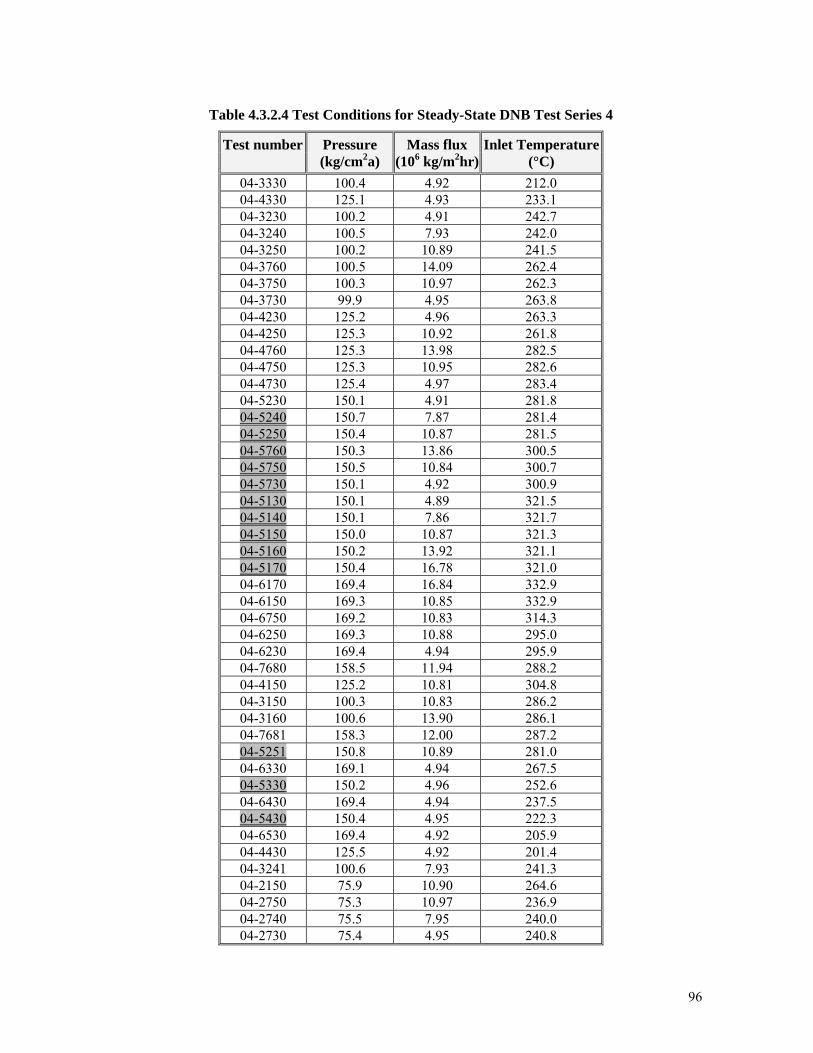
96
Table 4.3.2.4 Test Conditions for Steady-State DNB Test Series 4
Test number Pressure Mass flux Inlet Temperature (kg/cm2a) (106 kg/m2hr) (°C)
04-3330 100.4 4.92 212.0 04-4330 125.1 4.93 233.1 04-3230 100.2 4.91 242.7 04-3240 100.5 7.93 242.0 04-3250 100.2 10.89 241.5 04-3760 100.5 14.09 262.4 04-3750 100.3 10.97 262.3 04-3730 99.9 4.95 263.8 04-4230 125.2 4.96 263.3 04-4250 125.3 10.92 261.8 04-4760 125.3 13.98 282.5 04-4750 125.3 10.95 282.6 04-4730 125.4 4.97 283.4 04-5230 150.1 4.91 281.8 04-5240 150.7 7.87 281.4 04-5250 150.4 10.87 281.5 04-5760 150.3 13.86 300.5 04-5750 150.5 10.84 300.7 04-5730 150.1 4.92 300.9 04-5130 150.1 4.89 321.5 04-5140 150.1 7.86 321.7 04-5150 150.0 10.87 321.3 04-5160 150.2 13.92 321.1 04-5170 150.4 16.78 321.0 04-6170 169.4 16.84 332.9 04-6150 169.3 10.85 332.9 04-6750 169.2 10.83 314.3 04-6250 169.3 10.88 295.0 04-6230 169.4 4.94 295.9 04-7680 158.5 11.94 288.2 04-4150 125.2 10.81 304.8 04-3150 100.3 10.83 286.2 04-3160 100.6 13.90 286.1 04-7681 158.3 12.00 287.2 04-5251 150.8 10.89 281.0 04-6330 169.1 4.94 267.5 04-5330 150.2 4.96 252.6 04-6430 169.4 4.94 237.5 04-5430 150.4 4.95 222.3 04-6530 169.4 4.92 205.9 04-4430 125.5 4.92 201.4 04-3241 100.6 7.93 241.3 04-2150 75.9 10.90 264.6 04-2750 75.3 10.97 236.9 04-2740 75.5 7.95 240.0 04-2730 75.4 4.95 240.8

97
Table 4.3.2.4 Test Conditions for Steady-State DNB Test Series 4 – Cont.
Test number Pressure Mass flux Inlet Temperature (kg/cm2a) (106 kg/m2hr) (°C)
04-2230 75.6 4.96 219.8 04-1730 50.7 4.94 213.3 04-1230 50.3 4.98 190.3 04-2330 75.5 5.00 188.6 04-1220 53.5 2.16 192.1 04-1320 50.8 2.18 148.2 04-2320 75.7 2.15 188.1 04-3320 100.4 2.09 217.2 04-2220 75.4 2.09 218.8 04-3220 100.2 2.23 244.3 04-4320 124.9 2.08 238.2 04-4220 125.1 2.19 264.3 04-5320 150.3 2.04 257.8 04-5220 150.3 2.15 283.1 04-6770 169.3 16.81 314.6 04-6270 169.5 16.83 294.6 04-5260 150.5 13.94 281.1 04-5270 150.5 16.90 281.6 04-4260 125.5 14.05 261.3 04-4270 126.0 17.01 261.5 04-3770 100.8 17.00 262.1 04-6350 169.0 10.99 267.2 04-6450 168.8 10.96 237.0 04-5350 151.7 10.93 251.9 04-5360 150.5 14.06 251.7 04-5440 150.5 7.93 221.8 04-4350 125.5 10.88 232.0 04-3260 100.8 13.96 240.9 04-3350 100.5 10.86 210.2 04-2250 75.4 10.88 217.6

98
Table 4.3.2.5 Test Conditions for Steady-State DNB Test Series 8
Test number Pressure Mass flux Inlet Temperature (kg/cm2a) (106 kg/m2hr) (°C)
08-3330 100.5 5.05 211.8 08-4330 124.7 5.06 233.1 08-3230 100.2 5.07 242.5 08-3240 100.4 8.09 241.3 08-3250 100.6 11.22 241.3 08-3760 100.4 14.28 262.0 08-3750 100.5 11.09 262.1 08-3740 100.2 8.11 262.4 08-3730 100.2 5.05 263.4 08-4230 125.3 5.03 262.1 08-4240 125.2 8.08 261.9 08-4250 125.4 11.17 262.0 08-4760 125.1 14.21 282.4 08-4750 125.4 11.16 282.2 08-4740 125.2 8.11 282.4 08-4730 125.3 5.02 282.9 08-5230 150.6 4.98 281.6 08-5240 150.4 8.02 281.5 08-5250 149.9 11.05 280.9 08-7680 158.4 12.16 288.0 08-5760 150.1 14.15 300.7 08-5750 150.3 11.04 300.4 08-5740 150.4 8.00 300.5 08-5730 150.2 4.96 300.4 08-5130 150.1 4.95 321.6 08-5140 150.4 8.01 321.3 08-5150 150.2 11.03 321.0 08-5160 150.4 14.16 321.0 08-5170 150.4 17.10 320.9 08-6170 169.6 17.10 332.6 08-6150 168.5 11.04 332.5 08-6750 169.2 11.02 314.0 08-6250 168.9 11.01 295.5 08-6240 168.9 8.03 295.5 08-6230 169.1 4.99 295.6 08-7681 158.3 12.16 288.3 08-4150 125.2 11.04 304.6 08-4140 125.2 8.03 304.8 08-3140 100.6 8.06 286.4 08-3150 100.2 11.08 286.1 08-3160 100.2 14.25 285.9 08-5251 150.1 11.08 281.3 08-6340 169.2 8.06 267.3 08-6330 169.1 5.05 267.7 08-5340 150.4 8.08 252.6 08-5330 150.4 5.04 252.4

99
Table 4.3.2.5 Test Conditions for Steady-State DNB Test Series 8 – Cont.
Test number Pressure Mass flux Inlet Temperature (kg/cm2a) (106 kg/m2hr) (°C)
08-6430 169.1 5.01 237.6 08-5430 150.2 5.04 222.5 08-6530 169.2 5.00 206.4 08-4430 125.2 5.02 201.7 08-3241 100.5 8.09 241.6 08-2150 75.5 11.20 264.0 08-2750 75.3 11.20 239.3 08-2740 75.4 8.15 239.6 08-2730 75.2 5.04 240.8 08-2230 75.2 5.02 219.2 08-1730 50.2 5.02 212.8 08-1230 50.5 5.03 189.8 08-1220 50.2 2.10 189.3 08-1320 50.4 2.09 157.5 08-2320 75.1 2.09 187.8 08-2220 75.3 2.12 222.3 08-3320 100.5 2.12 208.0 08-3220 100.4 2.09 244.8 08-4320 124.8 2.11 230.4 08-4220 125.0 2.07 265.2 08-5320 150.3 2.12 248.7 08-5220 150.3 2.07 279.5 08-5252 150.2 11.13 281.5 08-7682 158.3 12.22 288.3 08-6770 169.5 17.20 314.4 08-6270 168.8 17.18 295.0 08-5260 150.4 14.25 281.3 08-5270 149.9 17.25 281.0 08-3242 100.3 8.06 241.4 08-4260 125.0 14.29 260.7 08-4270 125.8 17.33 262.0 08-6350 169.4 11.12 266.7 08-6450 169.1 11.14 237.0 08-7683 158.1 12.36 288.4 08-5350 150.5 11.35 251.9 08-5360 150.4 14.20 252.8 08-5440 150.0 8.09 222.6 08-4350 125.1 11.15 232.7 08-3770 100.5 17.34 262.2 08-3260 100.4 14.33 241.5 08-3350 100.3 11.14 210.9 08-2250 74.7 11.12 216.4 08-1150 50.2 11.20 237.5 08-1750 50.5 11.15 212.1 08-1250 50.3 11.15 188.4 08-2330 75.2 5.04 188.6 08-1330 50.2 5.08 158.2

100
Table 4.3.2.6 Test Conditions for Steady-State DNB Test Series 13
Test number Pressure Mass flux Inlet Temperature (kg/cm2a) (106 kg/m2hr) (°C)
13-4240 125.2 7.79 265.7 13-4250 125.5 10.94 263.6 13-A250 138.1 10.91 273.6 13-A240 137.3 7.93 274.1 13-5340 150.2 8.04 254.3 13-5D40 150.4 8.05 269.1 13-5230 150.4 4.90 283.7 13-52A0 150.1 6.42 285.2 13-5240 150.3 7.91 283.1 13-52B0 150.3 9.45 284.6 13-5250 150.1 10.90 282.8 13-4251 125.0 11.00 262.4 13-4241 125.1 7.80 265.8 13-A241 137.6 8.04 272.1 13-A251 137.9 10.79 275.2 13-5341 150.1 8.04 254.4 13-5D41 150.3 8.05 269.1 13-5231 150.0 4.92 283.9 13-52A1 150.0 6.41 282.2 13-5241 150.1 7.90 283.3 13-52B1 150.3 9.48 284.7 13-5251 150.5 10.95 283.3 13-B240 159.5 7.98 288.6 13-B250 159.7 10.71 291.9 13-6250 169.5 10.84 297.2 13-6240 169.3 7.98 297.2 13-5C40 150.0 7.76 293.1 13-5B40 150.1 7.74 302.6 13-5A40 150.3 7.95 313.3 13-5140 150.2 7.89 323.1 13-51B0 150.2 9.37 322.3 13-5150 150.2 10.84 322.8 13-51C0 150.3 12.32 321.0 13-5160 150.3 13.90 322.7 13-5A50 150.1 10.69 312.8 13-5B50 150.0 10.69 302.0 13-5C50 150.1 10.66 297.5 13-6251 169.0 10.80 297.0 13-6241 169.0 7.99 295.5 13-B251 159.8 10.67 292.0 13-B241 159.7 7.97 290.5 13-5C41 150.0 7.76 293.4 13-5B41 150.4 7.94 302.7 13-5A41 149.7 7.97 313.2 13-5C51 150.3 10.61 293.0 13-52C0 150.6 12.31 282.7

101
Table 4.3.2.6 Test Conditions for Steady-State DNB Test Series 13 – Cont.
Test number Pressure Mass flux Inlet Temperature (kg/cm2a) (106 kg/m2hr) (°C)
13-5D50 150.1 10.66 269.0 13-5260 150.5 13.78 282.8 13-5230 150.1 10.95 254.0 13-52C1 150.5 12.38 282.3 13-5261 150.8 13.77 283.0 13-5D51 150.1 10.74 269.2 13-5141 150.4 7.86 320.2 13-51B1 150.6 9.35 318.1 13-5151 150.5 10.83 319.7 13-51C1 150.7 12.36 318.1 13-5161 151.4 13.89 319.6 13-5A51 150.0 10.69 310.2 13-5B51 150.2 10.67 299.3 13-5351 150.5 10.94 251.5

102
4.3.3 Exercise II-3 – Transient DNB Benchmark
The experimental data include the power at which departure from nuclear boiling occurs during four transient scenarios: power increase; flow reduction; depressurization; temperature increase. A summary of the test conditions for transient DNB test series 11T and 12T is given in Table 4.3.3.1. The data can be applied to subchannel and system codes.
Tables 4.3.3.2 through 4.3.3.9 contain the boundary conditions for each transient. Also
included are plots of each parameter during the transient (Figures 4.3.3.1 through 4.3.3.8). These plots represent the ratio of the value of each parameter at a certain time to the value at the start of the transient.
All transient cases are to be analyzed.
Table 4.3.3.1 Test Conditions for Transient DNB Test Series 11T and 12T
Initial Conditions Test Series
Assembly Power (MW)
Mass flux (106kg/m2h)
Pressure (kg/cm2a)
Inlet temperature (°C)
Transients
2.50 11.18 156.2 291.0 Power increase 2.50 11.19 156.1 293.1 Flow reduction 2.52 11.28 156.3 291.7 Depressurization 11T A4
2.48 11.04 154.6 291.6 Temperature
increase 2.51 11.40 156.1 291.3 Power increase 2.51 11.71 156.3 292.5 Flow reduction 2.50 11.42 156.2 290.6 Depressurization 12T A8
2.50 11.38 155.8 291.2 Temperature
increase

103
Table 4.3.3.2 Transient DNB Data in Rod Bundle in Test Series 11T (Power Increase)
Time (sec)
Pressure (kg/cm2a)
Mass Flux (106 kg/m2hr)
Inlet temperature (°C)
Power (MW)
61 156.2 11.18 291.0 2.50 62 156.3 11.16 290.9 2.52 63 156.3 11.18 290.9 2.55 64 156.4 11.16 291.0 2.58 65 156.8 11.18 291.0 2.61 66 156.6 11.16 291.0 2.64 67 156.5 11.16 291.0 2.67 68 156.4 11.16 290.9 2.70 69 156.3 11.16 291.0 2.73 70 156.3 11.14 291.0 2.75 71 156.5 11.14 291.0 2.78 72 156.8 11.13 291.0 2.81 73 156.9 11.11 291.0 2.83 74 156.8 11.14 291.0 2.86 75 157.0 11.13 291.0 2.88 76 157.0 11.10 291.0 2.91 77 156.8 11.13 291.0 2.94 78 156.8 11.12 291.0 2.98 79 156.8 11.13 291.0 3.01 80 157.0 11.10 291.0 3.04 81 157.1 11.12 291.0 3.05 82 157.2 11.11 291.0 3.08 83 157.4 11.10 291.0 3.11 84 157.3 11.11 291.0 3.14 85 157.5 11.14 291.0 3.17 86 157.2 11.09 291.0 3.21 87 157.6 11.07 291.0 3.23 88 157.8 11.10 291.0 3.26 89 157.3 11.06 291.0 3.29 90 157.4 11.06 291.0 3.33 91 157.5 11.06 291.0 3.35 92 157.6 11.07 291.0 3.39 93 157.9 11.08 291.0 3.41 94 157.6 11.06 291.0 3.44 95 157.7 11.05 291.0 3.46 96 158.1 11.05 291.0 3.50 97 157.7 11.03 291.0 3.53 98 157.9 11.06 291.0 3.55 99 157.6 11.05 291.0 3.58 100 157.6 11.04 291.0 3.61 101 157.9 11.03 291.0 3.64 102 157.5 11.02 291.0 3.67 103 157.6 11.00 291.0 3.69 104 157.9 11.00 291.0 3.72 105 157.6 11.01 291.0 3.75 106 157.6 11.00 291.0 3.78 107 157.9 10.99 291.0 3.81 108 157.6 10.95 290.9 3.83

104
Table 4.3.3.3 Transient DNB Data in Rod Bundle in Test Series 11T (Flow Reduction)
Time (sec)
Pressure (kg/cm2a)
Mass flux (106 kg/m2 hr)
Inlet temperature (°C)
Power (MW)
20 156.1 11.19 293.1 2.50 21 156.3 11.19 293.1 2.50 22 156.4 11.19 293.1 2.50 23 156.3 11.16 293.1 2.50 24 156.3 10.88 293.2 2.50 25 156.2 10.58 293.2 2.50 26 156.1 10.34 293.2 2.51 27 156.3 10.20 293.2 2.50 28 156.1 10.13 293.2 2.50 29 156.5 10.05 293.1 2.50 30 156.1 9.89 293.1 2.50 31 156.1 9.66 293.2 2.50 32 156.5 9.46 293.1 2.50 33 156.3 9.26 293.2 2.50 34 156.4 9.13 293.2 2.49 35 156.3 8.99 293.2 2.49 36 156.3 8.82 293.2 2.49 37 156.5 8.57 293.2 2.50 38 156.6 8.31 293.2 2.50 39 156.4 8.10 293.2 2.50 40 156.6 7.98 293.2 2.50 41 156.8 7.90 293.2 2.50 42 156.9 7.76 293.3 2.50 43 157.1 7.49 293.3 2.50 44 157.2 7.21 293.3 2.49 45 156.9 6.98 293.3 2.49 46 156.9 6.89 293.3 2.50 47 157.3 6.77 293.3 2.49 48 157.3 6.53 293.3 2.49 49 157.2 6.36 293.2 2.50 50 157.4 6.31 293.3 2.50 51 157.7 6.25 293.2 2.50 52 157.6 6.05 293.2 2.50 53 157.7 5.75 293.2 2.50 54 158.1 5.51 293.2 2.50 55 157.8 5.34 293.2 2.50

105
Figure 4.3.3.1 Variation of Properties during Transient for Data Series 11T (Power Increase)
11T - Power Increase
0.90
1.00
1.10
1.20
1.30
1.40
1.50
1.60
60 70 80 90 100 110
Time (sec)
Rat
io t
o In
itia
l va
lue
Pressure
Mass Flux
Power
Inlet Temperature
Figure 4.3.3.2 Variation of Properties during Transient for Data Series 11T (Flow Reduction)
11T - Flow Reduction
0.40
0.50
0.60
0.70
0.80
0.90
1.00
1.10
20 25 30 35 40 45 50 55 60
Time (sec)
Rat
io t
o In
itia
l va
lue
Pressure
Mass Flux
Power
Inlet Temperature

106
Table 4.3.3.4 Transient DNB Data in Rod Bundle in Test Series 11T (Depressurization)
Time (sec)
Pressure (kg/cm2a)
Mass flux (106 kg/m2hr)
Inlet temperature (°C)
Power (MW)
50 156.3 11.28 291.7 2.52 51 156.4 11.27 291.7 2.53 52 156.4 11.26 291.7 2.53 53 156.0 11.24 291.7 2.54 54 155.3 11.22 291.7 2.57 55 154.9 11.25 291.7 2.60 56 154.6 11.25 291.7 2.63 57 154.2 11.25 291.7 2.66 58 153.9 11.23 291.7 2.69 59 153.5 11.24 291.7 2.72 60 153.2 11.23 291.7 2.75 61 152.9 11.22 291.7 2.77 62 152.5 11.23 291.6 2.80 63 152.3 11.24 291.6 2.83 64 151.8 11.25 291.7 2.85 65 151.2 11.21 291.7 2.88 66 150.8 11.18 291.6 2.92 67 150.4 11.19 291.6 2.95 68 150.0 11.22 291.6 2.98 69 149.7 11.20 291.6 3.01 70 149.2 11.20 291.6 3.04 71 148.7 11.18 291.6 3.07 72 148.3 11.17 291.6 3.10 73 147.9 11.18 291.6 3.13 74 147.5 11.15 291.6 3.17 75 147.3 11.15 291.5 3.20 76 146.7 11.15 291.5 3.23 77 146.3 11.15 291.5 3.25 78 145.9 11.16 291.6 3.28 79 145.4 11.18 291.6 3.31 80 145.2 11.18 291.5 3.34 81 145.0 11.17 291.6 3.37 82 144.4 11.11 291.5 3.39 83 143.8 11.09 291.6 3.42 84 143.5 11.09 291.6 3.45 85 143.2 11.11 292.7 3.47 86 143.0 11.13 291.8 3.50 87 142.3 11.11 291.9 3.53 88 141.9 11.08 292.0 3.56 89 141.4 11.10 292.2 3.59 90 141.3 11.12 292.5 3.62 91 140.9 11.12 292.8 3.65 92 140.3 11.11 293.1 3.68 93 139.9 11.10 293.4 3.71 94 139.6 11.12 293.8 3.74 95 139.3 11.12 294.2 3.76 96 139.1 11.12 294.5 3.79

107
Table 4.3.3.5 Transient DNB Data in Rod Bundle in Test Series 11T (Temperature Increase)
Time (sec)
Pressure (kg/cm2a)
Mass flux (106 kg/m2hr)
Inlet temperature (°C)
Power (MW)
96 154.6 11.04 291.6 2.48 97 154.4 11.04 291.6 2.48 98 154.3 11.03 291.6 2.49 99 154.5 11.02 291.7 2.50 100 154.2 11.01 291.8 2.51 101 154.2 11.02 291.8 2.53 102 154.6 11.03 292.0 2.55 103 154.3 11.02 292.3 2.56 104 154.3 10.98 292.6 2.57 105 154.2 11.00 293.1 2.59 106 154.4 11.01 293.5 2.60 107 154.1 11.02 294.0 2.62 108 154.3 11.00 294.7 2.64 109 154.2 10.99 295.3 2.65 110 154.2 11.02 296.0 2.66 111 154.2 11.05 296.7 2.68 112 154.2 11.06 297.5 2.70 113 154.4 11.03 298.2 2.72 114 154.9 11.04 299.1 2.74 115 154.9 11.03 299.8 2.75 116 154.6 11.03 300.6 2.77 117 154.5 11.06 301.3 2.79 118 154.6 11.04 302.0 2.80 119 154.7 11.05 302.8 2.82 120 155.0 11.05 303.5 2.84 121 154.9 11.06 304.1 2.85 122 155.0 11.07 304.9 2.87 123 155.1 11.08 305.4 2.88 124 155.3 11.08 306.0 2.89 125 155.5 11.05 306.6 2.91 126 155.6 11.06 307.2 2.93 127 155.6 11.09 307.8 2.94 128 155.8 11.09 308.3 2.96 129 156.0 11.09 308.9 2.97 130 156.3 11.09 309.4 2.99 131 156.4 11.07 309.9 3.00 132 156.8 11.06 310.3 3.02 133 156.4 11.06 310.7 3.04 134 157.0 11.08 311.2 3.05 135 156.6 11.10 311.5 3.07 136 156.6 11.10 311.9 3.09 137 156.6 11.11 312.2 3.10 138 156.7 11.11 312.6 3.11 139 157.1 11.15 312.9 3.12 140 157.1 11.17 313.3 3.14 141 156.8 11.19 313.6 3.16 142 157.0 11.22 313.9 3.18 143 156.9 11.22 314.2 3.19 144 157.1 11.21 314.4 3.21 145 156.9 11.18 314.7 3.22 146 157.1 11.17 314.9 3.24 147 157.0 11.19 315.1 3.25 148 157.0 11.24 315.4 3.27 149 157.3 11.25 315.5 3.28 150 157.1 11.25 315.8 3.30 151 157.3 11.17 315.8 3.30

108
Figure 4.3.3.3 Variation of Properties during Transient for Data Series 11T (Depressurization)
11T - Depressurization
0.80
0.90
1.00
1.10
1.20
1.30
1.40
1.50
1.60
50 55 60 65 70 75 80 85 90 95 100
Time (sec)
Rat
io t
o In
itia
l va
lue
Pressure
Mass Flux
Power
Inlet Temperature
Figure 4.3.3.4 Variation of Properties during Transient for Data Series 11T (Temperature Increase)
11T - Temperature Increase
0.90
1.00
1.10
1.20
1.30
1.40
95 105 115 125 135 145 155
Time (sec)
Rat
io t
o In
itia
l va
lue
Pressure
Mass Flux
Power
Inlet Temperature

109
Table 4.3.3.6 Transient DNB Data in Rod Bundle in Test Series 12T (Power Increase)
Time (sec)
Pressure (kg/cm2a)
Mass flux (106 kg/m2 hr)
Inlet temperature (°C)
Power (MW)
46 156.1 11.40 291.3 2.51 47 156.1 11.42 291.3 2.52 48 156.1 11.40 291.3 2.56 49 156.1 11.39 291.2 2.59 50 156.2 11.39 291.3 2.62 51 156.2 11.41 291.3 2.65 52 156.2 11.39 291.2 2.68 53 156.6 11.38 291.2 2.71 54 156.3 11.38 291.1 2.75 55 156.3 11.37 291.2 2.78 56 156.4 11.38 291.2 2.81 57 156.4 11.38 291.1 2.85 58 156.5 11.39 291.1 2.87 59 156.5 11.38 291.1 2.90 60 156.6 11.35 291.1 2.93 61 156.8 11.35 291.1 2.96 62 156.7 11.37 291.0 3.00 63 156.8 11.37 291.0 3.04 64 156.9 11.39 291.0 3.07 65 157.2 11.37 291.0 3.10 66 157.3 11.37 291.0 3.13 67 157.1 11.37 290.9 3.17 68 157.2 11.35 291.0 3.20 69 157.3 11.39 290.9 3.24 70 157.3 11.35 290.9 3.27 71 157.6 11.36 290.9 3.31 72 157.6 11.35 290.9 3.34 73 157.6 11.34 290.8 3.37 74 157.7 11.34 290.8 3.40 75 157.8 11.34 290.8 3.43 76 158.0 11.32 290.9 3.47 77 158.0 11.34 290.8 3.50 78 158.1 11.31 290.8 3.52 79 158.3 11.29 290.8 3.57 80 158.4 11.31 290.8 3.59 81 158.6 11.30 290.8 3.62 82 158.5 11.31 290.8 3.65 83 158.8 11.28 290.8 3.68 84 158.7 11.29 290.8 3.71 85 158.8 11.28 290.8 3.75 86 158.9 11.26 290.8 3.78 87 159.1 11.26 290.9 3.81 88 159.2 11.25 290.8 3.84

110
Table 4.3.3.7 Transient DNB Data in Rod Bundle in Test Series 12T (Flow Reduction)
Time (sec)
Pressure (kg/cm2a)
Mass flux (106 kg/m2 hr)
Inlet temperature (°C)
Power (MW)
20 156.3 11.71 292.5 2.51 21 156.3 11.67 292.5 2.51 22 156.4 11.66 292.4 2.51 23 156.2 11.66 292.4 2.51 24 156.3 11.68 292.5 2.51 25 156.3 11.67 292.4 2.51 26 156.2 11.58 292.5 2.51 27 156.1 11.27 292.5 2.51 28 156.6 10.96 292.5 2.51 29 156.1 10.64 292.5 2.51 30 156.2 10.49 292.4 2.51 31 156.2 10.40 292.5 2.50 32 156.2 10.28 292.5 2.51 33 156.1 10.09 292.5 2.51 34 156.1 9.86 292.5 2.51 35 156.1 9.61 292.6 2.50 36 156.2 9.44 292.5 2.50 37 156.3 9.31 292.5 2.50 38 156.3 9.14 292.4 2.50 39 156.4 8.91 292.5 2.50 40 156.4 8.67 292.5 2.50 41 156.6 8.39 292.5 2.50 42 156.7 8.17 292.5 2.50 43 156.8 8.02 292.5 2.50 44 156.7 7.88 292.4 2.50 45 156.8 7.70 292.5 2.50 46 156.8 7.49 292.3 2.49 47 156.9 7.26 292.4 2.49 48 156.9 7.01 292.4 2.49 49 157.1 6.74 292.4 2.49 50 157.2 6.52 292.4 2.49 51 157.3 6.38 292.4 2.49 52 157.3 6.25 292.3 2.49 53 157.5 6.05 292.5 2.49 54 157.5 5.80 292.5 2.49 55 157.5 5.54 292.6 2.48 56 157.6 5.35 292.7 2.48 57 157.8 5.26 292.7 2.48 58 157.9 5.10 292.6 2.48

111
Figure 4.3.3.5 Variation of Properties during Transient for Data Series 12T (Power Increase)
21T - Power Increase
0.90
1.00
1.10
1.20
1.30
1.40
1.50
1.60
45 50 55 60 65 70 75 80 85 90
Time (sec)
Rat
io t
o In
itia
l va
lue
Pressure
Mass Flux
Power
Inlet Temperature
Figure 4.3.3.6 Variation of Properties during Transient for Data Series 12T (Flow Reduction)
12T - Flow Reduction
0.40
0.50
0.60
0.70
0.80
0.90
1.00
1.10
20 25 30 35 40 45 50 55 60
Time (sec)
Rat
io t
o In
itia
l va
lue
Pressure
Mass Flux
Power
Inlet Temperature

112
Table 4.3.3.8 Transient DNB Data in Rod Bundle in Test Series 12T (Depressurization)
Time (sec)
Pressure (kg/cm2a)
Mass flux (106 kg/m2 hr)
Inlet temperature (°C)
Power (MW)
92 156.2 11.42 290.6 2.50 93 156.3 11.42 290.6 2.50 94 156.1 11.34 290.6 2.50 95 156.1 11.36 290.6 2.50 96 155.9 11.36 290.7 2.51 97 155.7 11.39 290.6 2.53 98 155.6 11.41 290.7 2.55 99 155.4 11.41 290.6 2.56 100 155.2 11.38 290.7 2.58 101 155.0 11.36 290.7 2.60 102 154.8 11.36 290.7 2.61 103 154.8 11.40 290.7 2.63 104 154.4 11.40 290.7 2.65 105 154.2 11.39 290.7 2.67 106 153.9 11.37 290.7 2.68 107 153.6 11.39 290.6 2.70 108 153.3 11.36 290.6 2.72 109 153.0 11.35 290.6 2.74 110 152.7 11.36 290.6 2.76 111 152.4 11.41 290.6 2.78 112 152.0 11.39 290.6 2.80 113 151.7 11.38 290.6 2.81 114 151.4 11.39 290.6 2.83 115 151.0 11.34 290.6 2.85 116 150.7 11.33 290.6 2.87 117 150.4 11.31 290.6 2.89 118 150.2 11.38 290.6 2.91 119 149.8 11.38 290.6 2.92 120 149.4 11.34 290.6 2.93 121 149.1 11.32 290.6 2.95 122 148.8 11.32 290.6 2.97 123 148.5 11.36 290.6 2.99 124 148.0 11.34 290.6 3.01 125 147.7 11.31 290.6 3.03 126 147.3 11.31 290.6 3.05 127 147.0 11.32 290.6 3.08 128 146.6 11.35 290.6 3.09 129 146.4 11.33 290.5 3.11 130 145.9 11.32 290.6 3.13 131 145.8 11.35 290.7 3.15 132 145.4 11.36 290.7 3.17 133 144.9 11.32 290.8 3.19 134 144.7 11.30 290.9 3.20 135 144.3 11.27 291.0 3.22 136 144.1 11.26 291.1 3.23 137 143.6 11.29 291.3 3.25 138 143.3 11.30 291.5 3.27 139 142.9 11.32 291.6 3.28 140 142.6 11.31 291.8 3.30 141 142.3 11.29 292.0 3.32 142 142.0 11.28 292.3 3.33 143 141.8 11.28 292.5 3.35 144 141.4 11.33 292.7 3.37 145 141.1 11.35 293.0 3.39 146 140.9 11.36 293.3 3.41

113
Table 4.3.3.9 Transient DNB Data in Rod Bundle in Test Series 12T (Temperature Increase)
Time (sec)
Pressure (kg/cm2a)
Mass flux (106 kg/m2 hr)
Inlet temperature (°C)
Power (MW)
83 155.8 11.38 291.2 2.5 84 155.8 11.39 291.2 2.5 85 155.6 11.36 291.2 2.5 86 155.6 11.32 291.2 2.51 87 155.5 11.34 291.2 2.51 88 155.5 11.37 291.2 2.51 89 155.4 11.37 291.2 2.53 90 155.5 11.34 291.2 2.54 91 155.4 11.32 291.2 2.56 92 155.5 11.29 291.2 2.58 93 155.3 11.25 291.2 2.6 94 155.2 11.23 291.2 2.61 95 155.2 11.23 291.2 2.63 96 155.2 11.27 291.2 2.65 97 155.2 11.28 291.2 2.66 98 155.1 11.28 291.2 2.67 99 155.4 11.21 291.2 2.69 100 155.1 11.20 291.3 2.71 101 155.2 11.22 291.3 2.73 102 155.2 11.24 291.3 2.75 103 155.2 11.22 291.4 2.77 104 155.0 11.23 291.5 2.79 105 155.0 11.20 291.7 2.81 106 155.2 11.19 292.0 2.83 107 155.0 11.19 292.3 2.84 108 155.0 11.23 292.7 2.86 109 155.0 11.18 293.3 2.88 110 155.0 11.16 293.8 2.9 111 155.1 11.12 294.4 2.91 112 155.1 11.14 295.0 2.92 113 155.3 11.18 295.7 2.94 114 155.3 11.22 296.4 2.95 115 155.4 11.22 297.1 2.97 116 155.3 11.14 297.8 2.99 117 155.4 11.19 298.6 3.01 118 155.4 11.21 299.4 3.02 119 155.4 11.25 300.2 3.04 120 155.5 11.22 301.0 3.06 121 155.7 11.24 301.9 3.08 122 155.7 11.21 302.7 3.1 123 155.8 11.22 303.5 3.12 124 155.9 11.24 304.4 3.14 125 156.1 11.24 305.3 3.15 126 156.1 11.26 306.2 3.17 127 156.4 11.25 307.2 3.18 128 156.4 11.26 308.0 3.2 129 156.7 11.23 308.8 3.22 130 156.9 11.26 309.7 3.24 131 157.0 11.26 310.5 3.25 132 157.2 11.25 311.4 3.28

114
Figure 4.3.3.7 Variation of Properties during Transient for Data Series 12T (Depressurization)
12T - Depressurization
0.80
0.90
1.00
1.10
1.20
1.30
1.40
90 100 110 120 130 140 150
Time (sec)
Rat
io t
o In
itia
l va
lue
Pressure
Mass Flux
Power
Inlet Temperature
Figure 4.3.3.8 Variation of Properties during Transient for Data Series 12T (Temperature Increase)
12T - Temperature Increase
0.90
1.00
1.10
1.20
1.30
1.40
85 95 105 115 125 135
Time (sec)
Rat
io t
o In
itia
l va
lue
Pressure
Mass Flux
Power
Inlet Temperature

115
Chapter 5 OUTPUT REQUESTED
5.1 Introduction
The participants should submit their results in an electronic format. All output should be in
SI units.
Templates of requested output data for each exercise are provided by the benchmark team.
The PSU team has the obligation to:
Provide code-to-data comparisons for different submittals;
Provide code-to-code comparisons for different submittals;
Provide overall conclusions on current code capabilities to represent the key phenomena.
5.2 Void Distribution Benchmark
Exercise I-1: Steady-State Single Subchannel Benchmark
For each of the test series 1, 2, 3 and 4, the calculated subchannel averaged fluid densities
and void fractions have to be submitted in the format shown in Table 5.2.1. The data have to be extracted at the axial elevation of 1.4 m from the beginning of the heated length (see Figure 2.3.1.1 ).
Participants using CFD codes should provide images of the in-channel void distribution for all four (4) test series, in addition to the tabulated output data.
Table 5.2.1 Output Format of Steady-State Single Subchannel Benchmark
Exercise 1, Phase I Test Series 1 – 4
Run Number Subchannel
Averaged Fluid Density (kg/m3)
Subchannel Averaged Void
Fraction
Thermal Equilibrium
Quality
x.xxx x.xxx x.xxx x.xxx x.xxx x.xxx x.xxx x.xxx x.xxx x.xxx x.xxx x.xxx
… … … … x.xxx x.xxx x.xxx x.xxx

116
Exercise I-2: Steady-State Bundle Benchmark
For each of the test series 5, 6, 7 and 8, the calculated region-averaged void fractions have to be submitted in the format shown in Table 5.2.2. The averaging has to be performed over the four central subchannels of the bundle. The output data have to be extracted at three axial elevations: 2.216 m (lower), 2.669 m (middle), and 3.177 m (upper) from the beginning of the heated length (see Figure 2.3.2.1).
Table 5.2.2 Output Format of Steady-State Bundle Benchmark
Exercise 2, Phase I Test Series 5 – 8
Region-Averaged Void Fraction, (-)
Run Number Lower Elevation
(2.216m) Middle Elevation
(2.669m) Upper Elevation
(3.177m)
Bundle Average Void
Fraction
x.xxx x.xxx x.xxx x.xxx x.xxx x.xxx x.xxx x.xxx x.xxx x.xxx x.xxx x.xxx x.xxx x.xxx x.xxx
… … … … … x.xxx x.xxx x.xxx x.xxx x.xxx Exercise I-3: Transient Bundle Benchmark
There are four different transient scenarios simulated for three different 5×5 bundle
configurations. These bundle configurations, respectively B5, B6, and B7, are described in Table 3.2.2.1 . The transient scenarios include power rise, flow reduction, depressurization, and temperature increase. In total, twelve calculations are to be performed and for each calculation the results have to be submitted in a format shown in Table 5.2.3. Similarly to the Steady-State Bundle Benchmark, the averaging has to be performed over the four central subchannels of the bundle. The output data have to be extracted at three axial elevations: 2.216 m (lower), 2.669 m (middle), and 3.177 m (upper) from the beginning of the heated length (see Figure 2.3.2.1).
Table 5.2.3 Output Format of Transient Bundle Benchmark
Exercise 3, Phase I Test Series 5T (Power increase)
Region-Averaged Void Fraction, (-) Time, [sec] Lower Elevation
2.216 m Middle Elevation
2.669 m Upper Elevation
3.177 m xx.x x.xxx x.xxx x.xxx xx.x x.xxx x.xxx x.xxx … … … …
xx.x x.xxx x.xxx x.xxx

117
Exercise I-4: Pressure Drop Benchmark
As discussed previously, although there is no available data, code to code benchmark on pressure drop of heated section for the typical central subchannel is proposed. The reference value for the bundle under the rated condition (single-phase) is about 1.6 kg/cm2 which is read from the initial value of the pressure drop over the heated section for the bundle B7 during power increase transient (test series 7T).
Participants are requested to submit the code predicted pressure drop over the heated length of the bundle test assembly B7, test series T7 before the transient is initialized.
In addition, participants are requested to submit the code predicted pressure drops over the heated length of the single subchannel test assembly S1 and bundle test assembly B5 bundle for the exercise cases included in the Test Series 1 and Test Series 5. Results have to be submitted in the format shown in Table 5.2.4 and Table 5.2.5.
Table 5.2.4 Output Format of Single Subchannel Pressure Drop Benchmark
Exercise 4, Phase I Test Series 1
Test Number Pressure Drop,
(kg/cm2) x.xxx xxx.x x.xxx xxx.x
… … x.xxx xxx.x
Table 5.2.5 Output Format of Bundle Pressure Drop Benchmark
Exercise 4, Phase I Test Series 5
Test Number Pressure Drop,
[kg/cm2] x.xxx xxx.x x.xxx xxx.x
… … x.xxx xxx.x

118
5.3 DNB Benchmark
Exercise II-1: Steady-State Fluid Temperature Benchmark
The calculated results for a given exercise case should be submitted as a 6×6 matrix of space averaged fluid temperature in a subchannel mesh size. An example of the output format of the Steady-State Fluid Temperature Benchmark is given in Table 5.3.1. The data have to be extracted at the axial elevation of 457mm above the end of the heated length, where the actual measurements were conducted (see Figure 3.3.6 ).
Table 5.3.1 Output Format of Steady-State Fluid Temperature Benchmark
Exercise 1, Phase II Test No.
Average Fluid Temperature, (°C)
y/x 1 2 3 4 5 6
1 xxx.x xxx.x xxx.x xxx.x xxx.x xxx.x
2 xxx.x xxx.x xxx.x xxx.x xxx.x xxx.x
3 xxx.x xxx.x xxx.x xxx.x xxx.x xxx.x
4 xxx.x xxx.x xxx.x xxx.x xxx.x xxx.x
5 xxx.x xxx.x xxx.x xxx.x xxx.x xxx.x
6 xxx.x xxx.x xxx.x xxx.x xxx.x xxx.x
Cross-sectional averaged: (°C)
Exercise II-2: Steady-State DNB Benchmark
For each of the test series 0, 2, 3, 4, 8 and 13, the predicted DNB powers; the axial
elevation and radial position of the first predicted DNBs (test series 4, 8, and 13 only) have to be submitted in the format shown in Table 5.3.2.
Table 5.3.2 Output Format of Steady-State DNB Benchmark
Exercise 2, Phase II Test Series 0, 2, and 3
Test Number
Predicted DNB Power, (MW)
xx-xxx x.xx xx-xxx x.xx
… … xx-xxx x.xx

119
Exercise 2, Phase II Test Series 4, 8 and 13
Test Number
Predicted DNB Power, (MW)
Axial Elevation of First Predicted
DNB, (m)
Radial Position of First Predicted DNB,
Central or Peripheral Rod
xx-xxx x.xx x.xxx xxxxx xx-xxx x.xx x.xxx xxxxx
… … … … xx-xxx x.xx x.xxx xxxxx
Exercise II-3: Transient DNB Benchmark
There are four different transient scenarios simulated for two different 5×5 bundle
configurations. The two bundle configurations, respectively A11 and A12, are described in Table 3.3.4 . The transient scenarios include power rise, flow reduction, depressurization, and temperature increase. In total, eight calculations are to be performed and for each calculation the results have to be submitted in the format shown in Table 5.3.3.
Table 5.3.3 Output Format of Transient DNB Benchmark
Exercise 3, Phase II Test Series 11T and 12T
Test Number Time of Detected DNB,
(sec) 11-0312 x.x 11-0112 x.x 11-0212 x.x 11-0321 x.x
12-0312 x.x
12-0112 x.x
12-0211 x.x
12-0321 x.x

120
Chapter 6 CONCLUSIONS
The objective of the PSBT benchmark specifications is to provide the participants with
information on the benchmark database. Although it contains detailed information on the test cases and measurements for the complete NUPEC PWR database, specific exercises were selected out for the OECD/NRC PSBT benchmark to reduce the amount of work; to make the analysis more precise; and to avoid confusion among the comparison of the participants’ results.
6.1 Phase I - Void Distribution Benchmark
Exercise I-1 – Steady-State Single Subchannel Benchmark The goal of this exercise is to benchmark the subchannel, meso- and microscopic
numerical approaches. The supplied measured data includes space averaged void fraction in subchannel mesh size. The test cases are selected at PWR rated conditions. Different types of single subchannel test assemblies are used to investigate the effect of geometry on phenomenon in concern.
Exercise I-2 – Steady-State Bundle Benchmark This exercise is designed for benchmarking meso-scopic numerical approaches. The test
cases for this exercise are chosen at PWR rated conditions and deviations of quality from the rated conditions.
Exercise I-3 – Transient Bundle Benchmark NUPEC PSBT database includes simulation of four representative transients of PWRs;
power increase, flow reduction, depressurization, and temperature increase. All four transients are selected as benchmark cases. Exercise 3 of Phase II is designed for benchmarking subchannel numerical approaches.
Exercise I-4 – Pressure Drop Benchmark This exercise is designed for performing code-to-code comparisons concerning axial
pressure drop. Although no empirical data is available, code results will be compared with relevant graphical data.
6.2 Phase II - DNB Benchmark
Exercise II-1 – Steady-State Fluid Temperature Benchmark Exercise 1 of Phase II is designed to assess the thermal-hydraulic codes’ capabilities of
predicting the exit coolant temperature. Exercise II-2 – Steady-State DNB Benchmark The goal of Exercise 2 of Phase II is to assess the thermal-hydraulic codes’ capabilities of
correct prediction of DNB along rod bundles.

121
Exercise II-3 – Transient DNB Benchmark Exercise 3 of Phase II is designed to enhance the currently underway development of truly
mechanistic models for DNB prediction during the four postulated transients in PWRs.

122
REFERENCES [1] “OECD/NEA Benchmark Based on NUPEC PWR Subchannel and Bundle Tests (PSBT)”,
JNES, April 2009
[2] “Proving Test on the Reliability for Nuclear Fuel Assemblies”, Summary Report of Proving Tests on the Reliability for Nuclear Power Plant- 1989, Nuclear Power Engineering Test Center, 1989
[3] Hori, K. et al., “In Bundle Void Fraction Measurement of PWR Fuel Assembly”, ICONE-2, Vol.1, pp.69-76, San Francisco, California, 21-24 March 1993
[4] Pamphlet of Takasago Engineering Laboratory, Nuclear Power Engineering Center (NUPEC).