oecd qsar toolbox v.3 3.3_aquatic... · to review the workflow of the toolbox. • to review the...
TRANSCRIPT
OECD QSAR Toolbox v.3.3
Step by step example how to predict acute aquatic toxicity to Daphnia for the 3-ethyl-5-methyl-3-methoxyphenol by the trend analysis approach
• Background
• Objectives
• Specific Aims
• Trend analysis
• The exercise
• Workflow of the exercise
• Save the prediction result
2
Outlook
The OECD QSAR Toolbox for Grouping Chemicals into Categories 23.02.2015

• This is a step-by-step presentation designed to take the user of the Toolbox through the workflow of a data filling exercise by the trend analysis approach.
3
Background
The OECD QSAR Toolbox for Grouping Chemicals into Categories 23.02.2015

• Background
• Objectives
• Specific Aims
• Trend analysis
• The exercise
• Workflow of the exercise
• Save the prediction result
4
Outlook
The OECD QSAR Toolbox for Grouping Chemicals into Categories 23.02.2015

• This presentation reviews a number of functionalities of the Toolbox:
• Identify analogues for a target chemical
• Retrieve experimental results available for those analogues
• Fill data gaps by trend-analysis
5
Objectives
The OECD QSAR Toolbox for Grouping Chemicals into Categories 23.02.2015

• Background
• Objectives
• Specific Aims
• Trend analysis
• The exercise
• Workflow of the exercise
• Save the prediction result
6
Outlook
The OECD QSAR Toolbox for Grouping Chemicals into Categories 23.02.2015

• To review the workflow of the Toolbox.
• To review the six modules of the Toolbox.
• To reacquaint the user with the basic functionalities within each module.
• To explain to the user the rationale behind each step of the exercise.
7
Specific Aims
The OECD QSAR Toolbox for Grouping Chemicals into Categories 23.02.2015

• Background
• Objectives
• Specific Aims
• Trend analysis
• The exercise
• Workflow of the exercise
• Save the prediction result
8
Outlook
The OECD QSAR Toolbox for Grouping Chemicals into Categories 23.02.2015

• For a given (eco)toxicological endpoint, the members of a category are often related by a trend (e.g. increasing, decreasing or constant). The trend could be related to molecular mass, carbon chain length, or to some other physicochemical property.
• A demonstration of consistent trends in the behaviour of a group of chemicals is one of the desirable attributes of a chemical category and one of the indicators that a common mechanism for all chemicals is involved. When some chemicals in a category have measured values and a consistent trend is observed, missing values can be estimated by simple scaling from the measured values to unmeasured values as a means of filling data gaps.
9
Trend Analysis Overview
The OECD QSAR Toolbox for Grouping Chemicals into Categories 23.02.2015
• Background
• Objectives
• Specific Aims
• Trend analysis
• The exercise
• Workflow of the exercise
• Save the prediction result
10
Outlook
The OECD QSAR Toolbox for Grouping Chemicals into Categories 23.02.2015

• In this exercise we will predict the acute toxicity to daphnids for an untested compound, (3-ethyl-5-methyl-4-methoxyphenol), which is the “target” chemical.
• This prediction will be accomplished by collecting a set of test data for chemicals considered to be in the same category as the target molecule.
• The category will be defined using the following categorization schemes:
- Acute aquatic toxicity classification by ECOSAR – for structural grouping.
- Acute aquatic toxicity MOA by OASIS – mechanistic grouping.
11
Exercise
The OECD QSAR Toolbox for Grouping Chemicals into Categories 23.02.2015

• Background
• Objectives
• Specific Aims
• Trend analysis
• The exercise
• Workflow of the exercise
• Save the prediction result
12
Outlook
The OECD QSAR Toolbox for Grouping Chemicals into Categories 23.02.2015

• The Toolbox has six modules which are used in a sequential workflow:
•Chemical Input • Profiling •Endpoints •Category Definition • Filling Data Gaps •Report
13
Workflow
The OECD QSAR Toolbox for Grouping Chemicals into Categories 23.02.2015
• Background
• Objectives
• Specific Aims
• Trend analysis
• The exercise
• Workflow of the exercise •Chemical Input
14
Outlook
The OECD QSAR Toolbox for Grouping Chemicals into Categories 23.02.2015

• This module provides the user with several means of entering the chemical of interest or the target chemical.
• Since all subsequent functions are based on chemical structure, the goal here is to make sure the molecular structure assigned to the target chemical is the correct one.
15
Chemical Input Overview
The OECD QSAR Toolbox for Grouping Chemicals into Categories 23.02.2015

User Alternatives for Chemical ID:
A.Single target chemical • Chemical Name • Chemical Abstract Services (CAS) number (#) • SMILES (simplified molecular information line entry
system) notation/InChi • Drawing chemical structure • Select from User List/Inventory/Databases • Chemical IDs such as EC number, Einecs number
B.Group of chemicals • User List/Inventory • Specialized Databases
16
Chemical Input Ways of Entering a Chemical
The OECD QSAR Toolbox for Grouping Chemicals into Categories 23.02.2015
• Open the Toolbox.
• The six modules in the workflow are seen listed next to “QSAR TOOLBOX”.
• Click on “Input” (see next screen shot).
17
Getting Started
The OECD QSAR Toolbox for Grouping Chemicals into Categories 23.02.2015

18
Chemical Input Screen Input screen
The OECD QSAR Toolbox for Grouping Chemicals into Categories 23.02.2015

• Inputting the target chemical by drawing varies in difficulty with the structural complexity of the molecule.
• It is accomplished by a series of point-click-move-click operations within the 2D-editor which drops down when you click on “structure” (see next screen shot).
• The subsequent series of screen shots will take you through the process for the target chemical.
19
Chemical Input by Drawing
The OECD QSAR Toolbox for Grouping Chemicals into Categories 23.02.2015

1
1. Click on Structure
20
Chemical Input Screen Input target chemical by drawing
The OECD QSAR Toolbox for Grouping Chemicals into Categories 23.02.2015

21
2
1
1. Left Click on the appropriate template form from “templates”. 2. Move the curser to the large clear area and left click again, this puts the selected template on the plot.
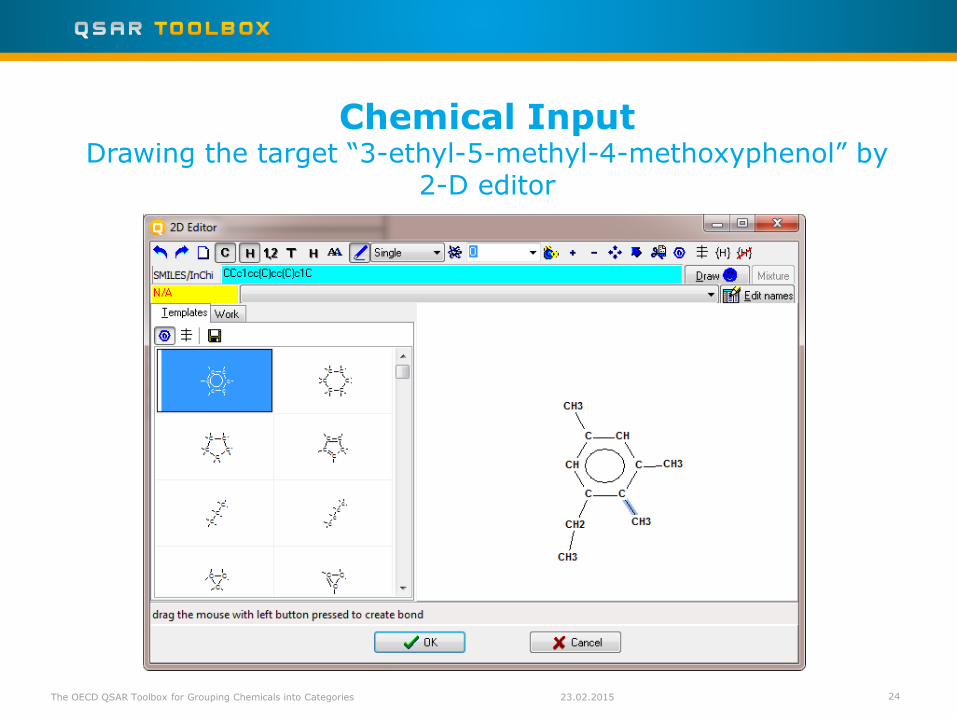
Chemical Input Drawing the target “3-ethyl-5-methyl-4-methoxyphenol” by
2-D editor
The OECD QSAR Toolbox for Grouping Chemicals into Categories 23.02.2015

22
3
3. Click on button to add a bond of selected type (“Single” in this case). 4. Drag the mouse (pointing finger) to the appropriate atom and left click to create a single bond.
Chemical Input Drawing the target “3-ethyl-5-methyl-4-methoxyphenol” by
2-D editor
The OECD QSAR Toolbox for Grouping Chemicals into Categories
4
23.02.2015
• Note the default is addition of a CH3-group.
• By moving the ‘finger’ to other C-atoms and left clicking the mouse adds other hydrocarbon fragments.
• If you make an incorrect entry you can click on the ‘undo’ icon in the upper corner of the screen to remove the addition.
• This process allows you to build the hydrocarbon skeleton of the target molecule (see next screen shot).
23
Chemical Input by Drawing
The OECD QSAR Toolbox for Grouping Chemicals into Categories 23.02.2015
24
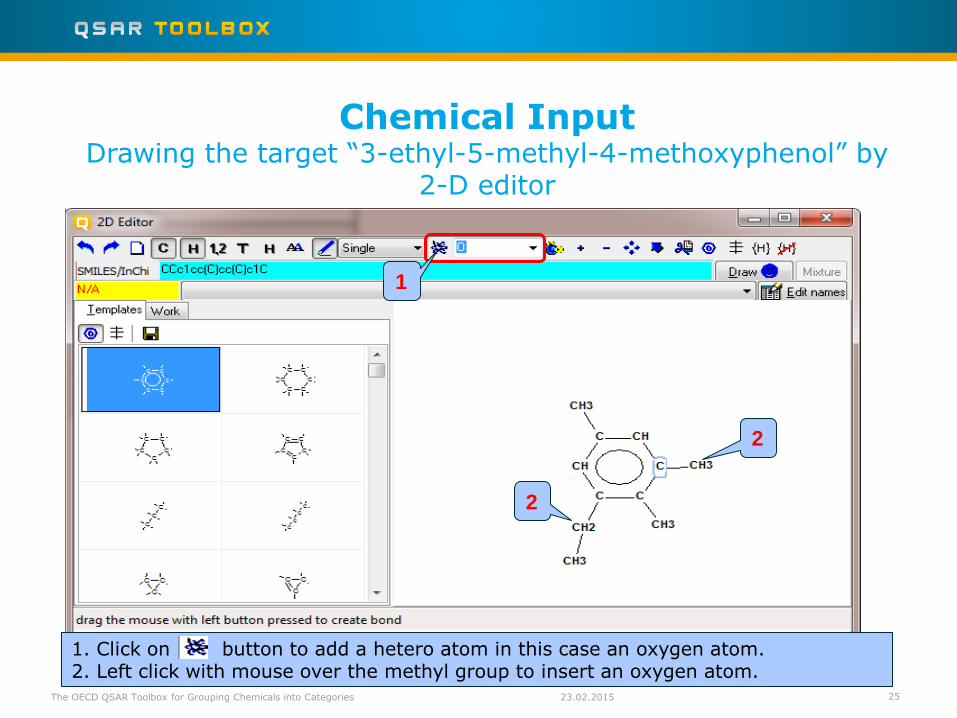
Chemical Input Drawing the target “3-ethyl-5-methyl-4-methoxyphenol” by
2-D editor
The OECD QSAR Toolbox for Grouping Chemicals into Categories 23.02.2015
1
2
2
1. Click on button to add a hetero atom in this case an oxygen atom. 2. Left click with mouse over the methyl group to insert an oxygen atom.
25
Chemical Input Drawing the target “3-ethyl-5-methyl-4-methoxyphenol” by
2-D editor
The OECD QSAR Toolbox for Grouping Chemicals into Categories 23.02.2015

4
3. Click on button 5. Click Draw 4. Drag the mouse from the O-atom to create a single bond 6. Click OK
3
5
26
Chemical Input Drawing the target “3-ethyl-5-methyl-4-methoxyphenol” by
2-D editor
The OECD QSAR Toolbox for Grouping Chemicals into Categories
6
23.02.2015
• The already drawn target structure automatically appears on the data matrix
• Note that no CAS number or name is displayed for this chemical. This means the target chemical is not listed in the chemical inventories/databases implemented in the Toolbox (see next slide).
27
Chemical Input Target chemical identity
The OECD QSAR Toolbox for Grouping Chemicals into Categories 23.02.2015

The workflow on the first module is now complete, and the user can
proceed to the next module. Click on “Profiling”.
28
Chemical Input Target chemical identity
The OECD QSAR Toolbox for Grouping Chemicals into Categories 23.02.2015

• Background
• Objectives
• Specific Aims
• Trend analysis
• The exercise
• Workflow of the exercise •Chemical Input •Profiling
29
Outlook
The OECD QSAR Toolbox for Grouping Chemicals into Categories 23.02.2015

• “Profiling” refers to the electronic process of retrieving relevant information on the target compound, other than environmental fate, ecotoxicity and toxicity data, which are stored in the Toolbox database.
• Available information includes likely mechanism(s) of action, as well as observed or simulated metabolites.
30
Profiling Overview
The OECD QSAR Toolbox for Grouping Chemicals into Categories 23.02.2015

Summary information of the different profilers are provided in the “About”.
1 2
1. Highlight the profiler, then perform right click; 2. Select About; 3. After acquiring the information you desire, click on “close”.
Profiling Side-Bar to Profiling
The OECD QSAR Toolbox for Grouping Chemicals into Categories
3
23.02.2015 31
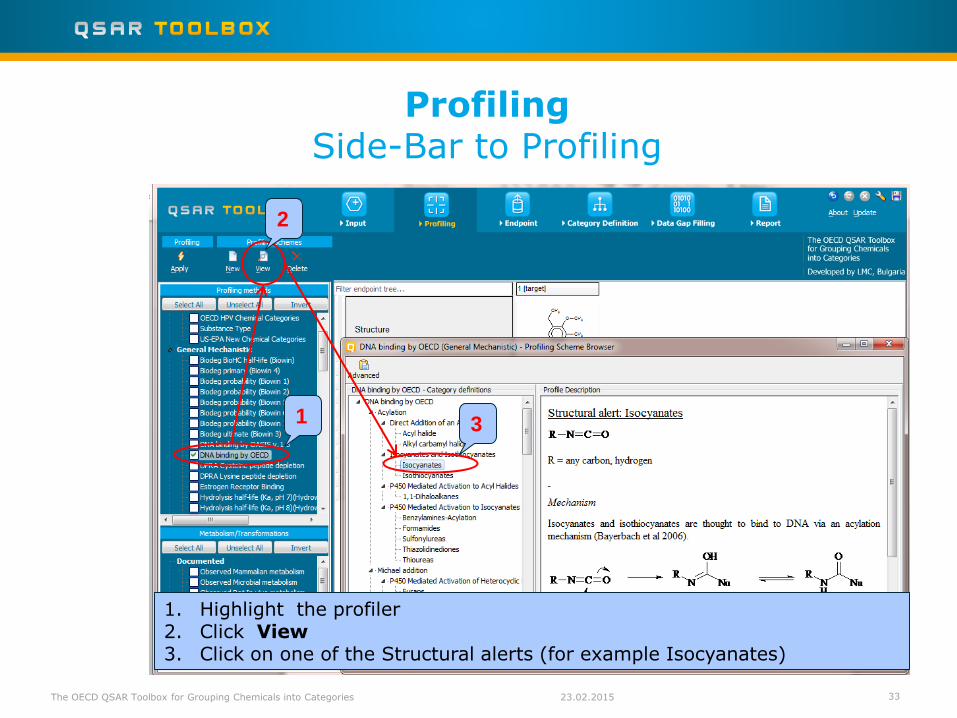
• For most of the profilers, background information can be retrieved by highlighting one of the profilers (for example, DNA binding by OECD) and clicking on “View’’ (see next screen shot).
32
Profiling Side-Bar to Profiling
The OECD QSAR Toolbox for Grouping Chemicals into Categories 23.02.2015
1
2
3
33
1. Highlight the profiler 2. Click View 3. Click on one of the Structural alerts (for example Isocyanates)
Profiling Side-Bar to Profiling
The OECD QSAR Toolbox for Grouping Chemicals into Categories 23.02.2015

• The outcome of the profiling determines the most appropriate way to search for analogues (detailed information in Manual for getting started– Toolbox 2.0 (Chapter 4). http://www.oecd.org/dataoecd/58/56/46210452.pdf
• Table 4-1 in chapter 4 (Manual for getting started – Toolbox 2.0) lists a selection of profilers and their relevance for different endpoints of regulatory relevance.
• For this example, the following mechanistic profiling methods are relevant to the aquatic toxicity:
• ECOSAR – for structural grouping
• Acute aquatic toxicity MOA by OASIS – mechanistic grouping
• Protein binding by OASIS v.1.2– mechanistic grouping
• Acute aquatic toxicity classification by Verhaar (Modified) – grouping by reactivity
• Organic functional groups – empiric knowledge
34
Profiling Side-Bar to Profiling
The OECD QSAR Toolbox for Grouping Chemicals into Categories 23.02.2015

• Select the “Profiling methods” related to the target endpoint by clicking on the box next to the profilers name.
• This selects (a green check mark appears) or deselects(green check disappears) profilers.
• For this example, select the following profilers which are relevant to the aquatic toxicity (see next screen shot):
• ECOSAR – for structural grouping
• Acute aquatic toxicity MOA by OASIS – mechanistic grouping
• Protein binding by OASIS v.1.2 – mechanistic grouping
• Acute aquatic toxicity classification by Verhaar(Modified) – grouping by reactivity
• Organic functional groups – empiric knowledge
35
Profiling Profiling the target chemical
The OECD QSAR Toolbox for Grouping Chemicals into Categories 23.02.2015

1. Place a green check in the box by the profilers related to the target Endpoint (see previous slide 35); 2. Click Apply
2
1
36
Profiling Profiling the target chemical
The OECD QSAR Toolbox for Grouping Chemicals into Categories 23.02.2015

• The actual profiling will take several seconds depending on the number and type of selected profilers.
• The results of profiling automatically appear as a dropdown box under the target chemical.
• Please note the specific profiling results by Classification by ECOSAR and MOA by OASIS (see next slide).
• These results will be used to search for suitable analogues in the next steps of the exercise.
37
Profiling Profiling the target chemical
The OECD QSAR Toolbox for Grouping Chemicals into Categories 23.02.2015

Profiling
Profiles of the target “3-ethyl-5-methyl-4-
methoxyphenol
38
1. Double click on the box to open the nodes of the tree
1
The OECD QSAR Toolbox for Grouping Chemicals into Categories 23.02.2015

• Background
• Objectives
• Specific Aims
• Trend analysis
• The exercise
• Workflow of the exercise •Chemical Input • Profiling •Endpoint
39
Outlook
The OECD QSAR Toolbox for Grouping Chemicals into Categories 23.02.2015

• “Endpoint” refer to the electronic process of retrieving the environmental fate, ecotoxicity and toxicity data that are stored in the Toolbox database.
• Data gathering can be executed in a global fashion (i.e., collecting all data of all endpoints) or on a more narrowly defined basis (e.g., collecting data for a single or limited number of endpoints).
• In this example, we limit our data gathering to the common aquatic toxicity endpoints from databases containing aquatic toxicity data (Aquatic ECETOC, Aquatic Japan MoE, ECOTOX, and Aquatic OASIS).
40
Endpoint
The OECD QSAR Toolbox for Grouping Chemicals into Categories 23.02.2015

41
1
2
3
Endpoint
1. Expand the Ecotoxicological Information section; 2. Select databases related to the target endpoint by adding a green check in the box before the database name; 3. Click Gather
The OECD QSAR Toolbox for Grouping Chemicals into Categories 23.02.2015

Toxicity information on the target chemical is electronically collected from the selected datasets.
A window with “Read data?” appears. Now the user could choose to collect “all” or “endpoint specific” data.
1. Click OK to read all available data
1
42
Endpoint Process of collecting data
The OECD QSAR Toolbox for Grouping Chemicals into Categories 23.02.2015
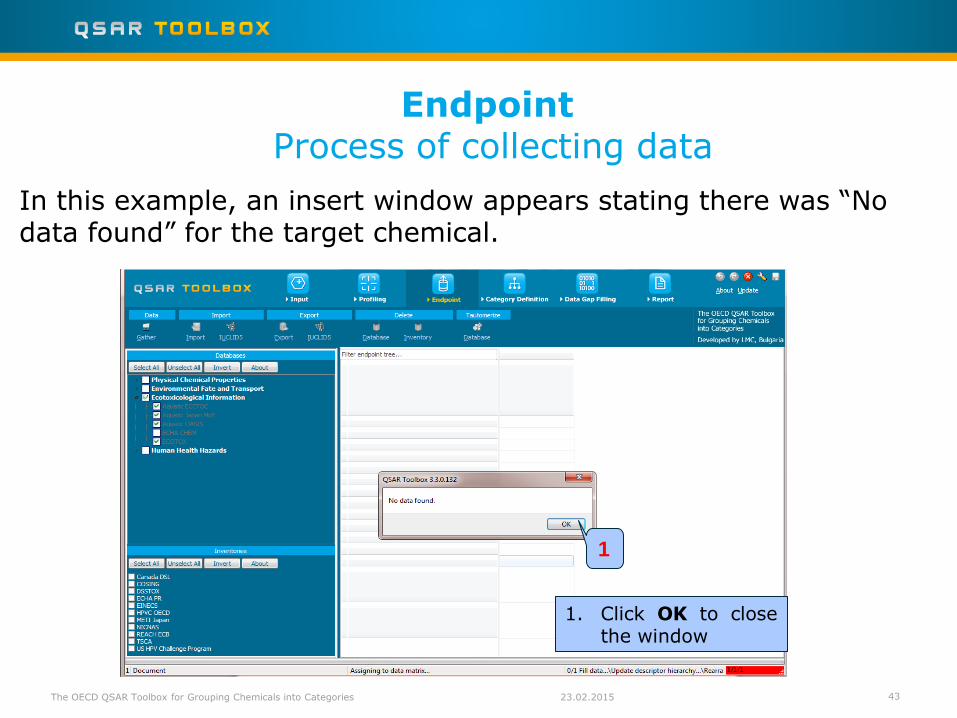
1. Click OK to close the window
1
In this example, an insert window appears stating there was “No data found” for the target chemical.
43
Endpoint Process of collecting data
The OECD QSAR Toolbox for Grouping Chemicals into Categories 23.02.2015

• Background
• Objectives
• Specific Aims
• Trend analysis
• The exercise
• Workflow of the exercise •Chemical Input • Profiling •Endpoint •Category definition
44
Outlook
The OECD QSAR Toolbox for Grouping Chemicals into Categories 23.02.2015
• You have entered the target chemical being sure of the correct structure.
• You have profiled the target chemical and found no experimental data is currently available for this structure.
• In other words, you have identified a data gap, which you would like to fill.
• Now you are ready to continue with next step of the workflow “Category Definition”.
45
Recap
The OECD QSAR Toolbox for Grouping Chemicals into Categories 23.02.2015

• This module provides the user with several means of grouping chemicals into a toxicologically meaningful category that includes the target molecule.
• This is the critical step in the workflow.
• Several options are available in the Toolbox to assist the user in defining the category definition.
46
Category Definition Overview
The OECD QSAR Toolbox for Grouping Chemicals into Categories 23.02.2015
• The different grouping methods allow the user to group chemicals into chemical categories according to different measures of “similarity” so that within a category data gaps can be filled by trend-analysis.
• Detailed information about grouping chemical (Chapter 4) could be downloaded from:
http://www.oecd.org/dataoecd/58/56/46210452.pdf
• For this example, starting from the target chemical a specific EcoSAR classification is identified, subsequently analogues are found within the same specific classification for which experimental results are available.
47
Category Definition Grouping methods
The OECD QSAR Toolbox for Grouping Chemicals into Categories 23.02.2015
• ECOSAR has been used by the U.S. Environmental Protection Agency since 1981 to predict the aquatic toxicity of new industrial chemicals in the absence of test data.
• “Aquatic toxicity classification by ECOSAR” in the Toolbox is used for grouping of chemicals by structural similarity which may or may not have mechanistic meaning. Experience has shown ECOSAR to be a robust profiler which makes it a logical choice in an initial profiling scheme.
48
Category Definition Side-bar of ECOSAR categories
The OECD QSAR Toolbox for Grouping Chemicals into Categories 23.02.2015

1. Highlight “Aquatic toxicity classification by ECOSAR”; 2. Click Define; 3. Confirm the category Phenols and 4. Click OK
2
4
3 1
49
Category Definition Defining ECOSAR category
The OECD QSAR Toolbox for Grouping Chemicals into Categories 23.02.2015

1. Click OK to confirm the name of the category a nd to gather experimental data
1
50
Category Definition Defining ECOSAR category
The OECD QSAR Toolbox for Grouping Chemicals into Categories 23.02.2015

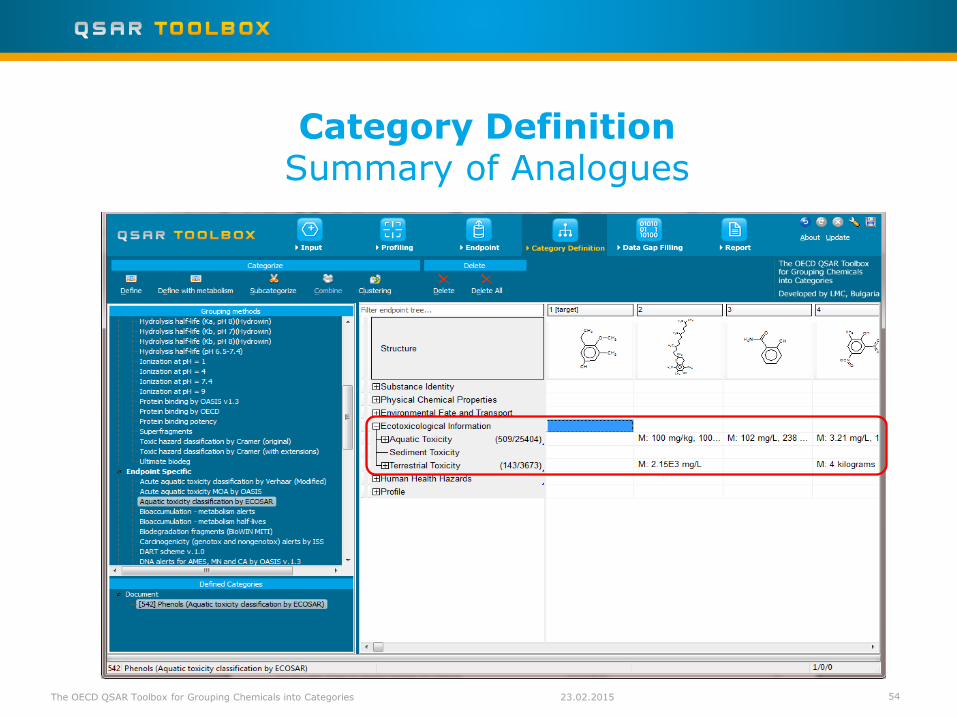
• The Toolbox now identifies all chemicals corresponding to the ECOSAR classification of “phenols” which are listed in the databases selected under “Endpoint”.
• 542 analogues are identified. Along with the target they form a category (Phenols) which can be used for data gap filling.
• The name of the category appears
in the “Defined Categories” window, along with the number of substances belonging to the category.
51
Category Definition Analogues
23.02.2015 The OECD QSAR Toolbox for Grouping Chemicals into Categories

• In this example, since only databases that contain information for ecotoxicological endpoints are selected, both options give the same results.
• As the Toolbox must search the database, this may take some time.
52
Category Definition Read data for Analogues
• The Toolbox automatically request the user to select the endpoint that should be retrieved.
• The user can either select the specific endpoint or by default choose to retrieve data on all endpoints (see below).
23.02.2015 The OECD QSAR Toolbox for Grouping Chemicals into Categories
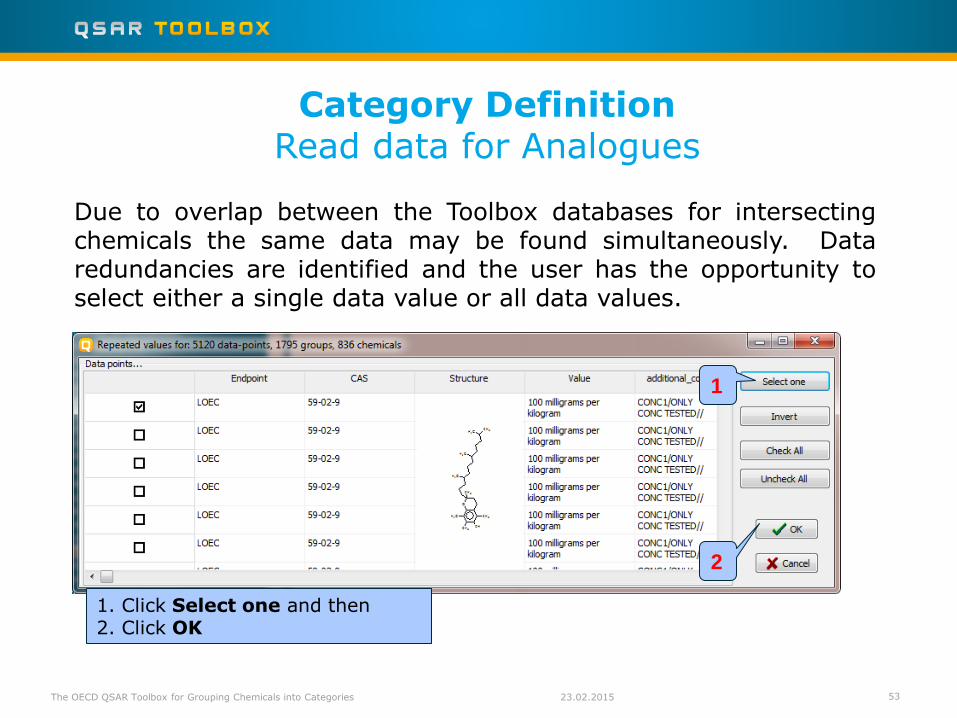
Due to overlap between the Toolbox databases for intersecting chemicals the same data may be found simultaneously. Data redundancies are identified and the user has the opportunity to select either a single data value or all data values.
1. Click Select one and then 2. Click OK
1
2
53
Category Definition Read data for Analogues
The OECD QSAR Toolbox for Grouping Chemicals into Categories 23.02.2015
54
Category Definition Summary of Analogues
23.02.2015 The OECD QSAR Toolbox for Grouping Chemicals into Categories
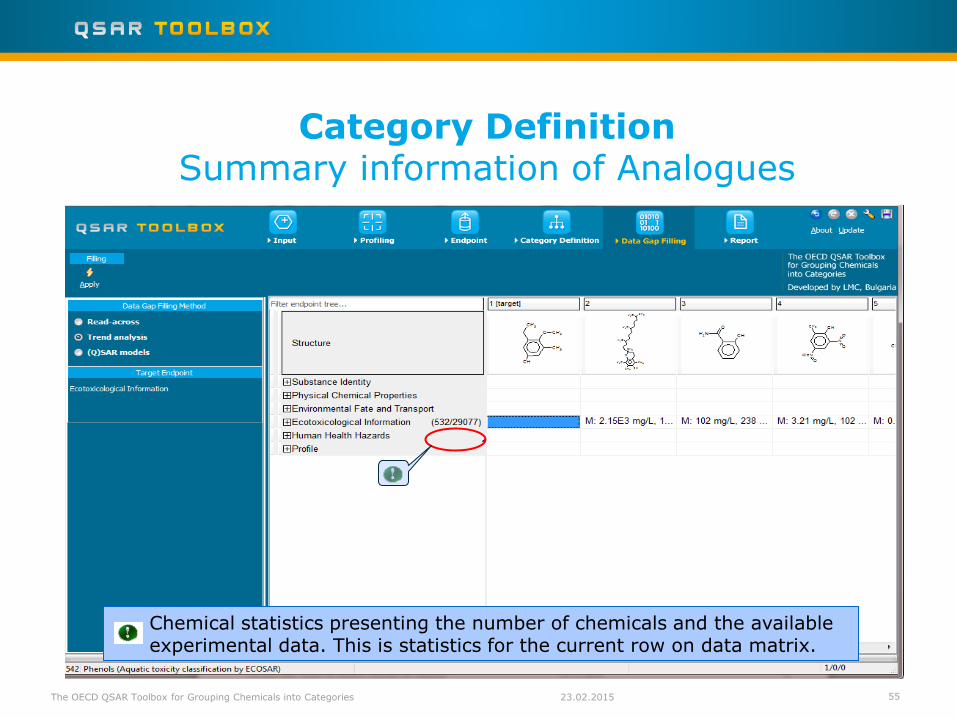
Chemical statistics presenting the number of chemicals and the available experimental data. This is statistics for the current row on data matrix.
55
Category Definition Summary information of Analogues
23.02.2015 The OECD QSAR Toolbox for Grouping Chemicals into Categories
1
56
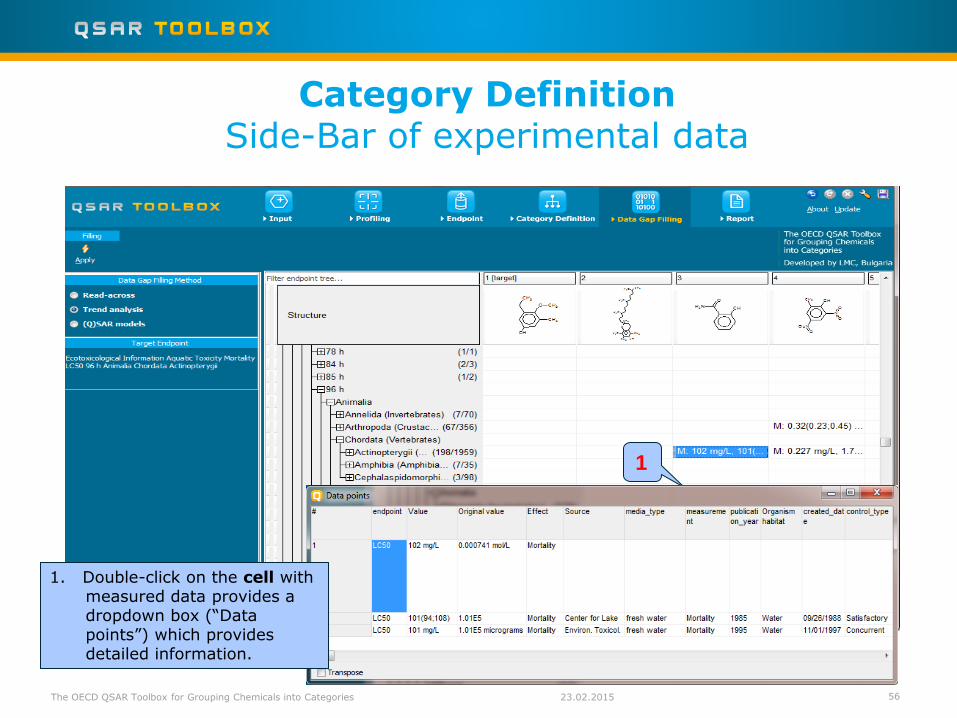
Category Definition Side-Bar of experimental data
1. Double-click on the cell with measured data provides a dropdown box (“Data points”) which provides detailed information.
23.02.2015 The OECD QSAR Toolbox for Grouping Chemicals into Categories
• You have identified a category (“phenols”) with the “Aquatic toxicity classification by ECOSAR” profiler for the target chemical 3-ethyl-5-methyl-4-methoxyphenol.
• The available experimental results for these 542 analogues have been collected from the selected databases (Aquatic ECETOC, Aquatic Japan MoE, ECOTOX, and Aquatic OASIS).
• But before the user can proceed with the “Filling Data Gap” module, he/she should navigate through the endpoint tree and find the specific gap that will be filled.
57
Recap
The OECD QSAR Toolbox for Grouping Chemicals into Categories 23.02.2015
• The user can navigate through the data tree by opening (or closing) the nodes of the tree.
• The data tree is extensive but logically constructed; it can be mastered with a practice.
• In this example, the “48 h LC50 Mortality for Daphnia magna” is the target endpoint.
• You can navigate through the endpoint tree by typing the species “Daphnia magna” in the “Filter endpoint tree…” box and clicking (Aquatic Toxicity, Mortality, LC50, 48 h, Animalia, etc to Daphnia magna- the specific endpoint (see next two screen shots)
58
Category Definition
Navigation through the endpoint tree
The OECD QSAR Toolbox for Grouping Chemicals into Categories 23.02.2015
1
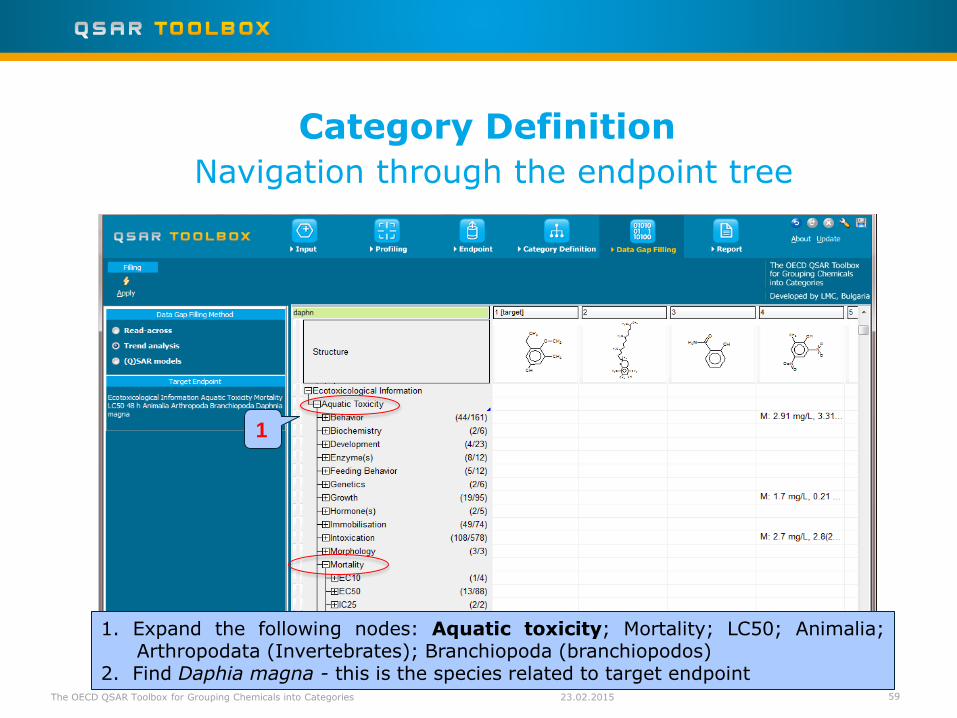
1. Expand the following nodes: Aquatic toxicity; Mortality; LC50; Animalia; Arthropodata (Invertebrates); Branchiopoda (branchiopodos)
2. Find Daphia magna - this is the species related to target endpoint 59
Category Definition
Navigation through the endpoint tree
The OECD QSAR Toolbox for Grouping Chemicals into Categories 23.02.2015

60
1
1. Expand the following nodes: Aquatic toxicity; Mortality; LC50; 48h; Animalia; Arthropodata (Invertebrates); Branchiopoda (branchiopodos)
2. Find Daphia magna - this is the species related to target endpoint
Category Definition
Navigation through the endpoint tree
The OECD QSAR Toolbox for Grouping Chemicals into Categories 23.02.2015

61
2
Category Definition
Navigation through the endpoint tree
The OECD QSAR Toolbox for Grouping Chemicals into Categories
1. Expand the following nodes: Aquatic toxicity; Mortality; LC50; 48h; Animalia; Arthropodata (Invertebrates);Branchiopoda (branchiopodos)
2. Find Daphia magna - this is the species related to target endpoint
1
23.02.2015
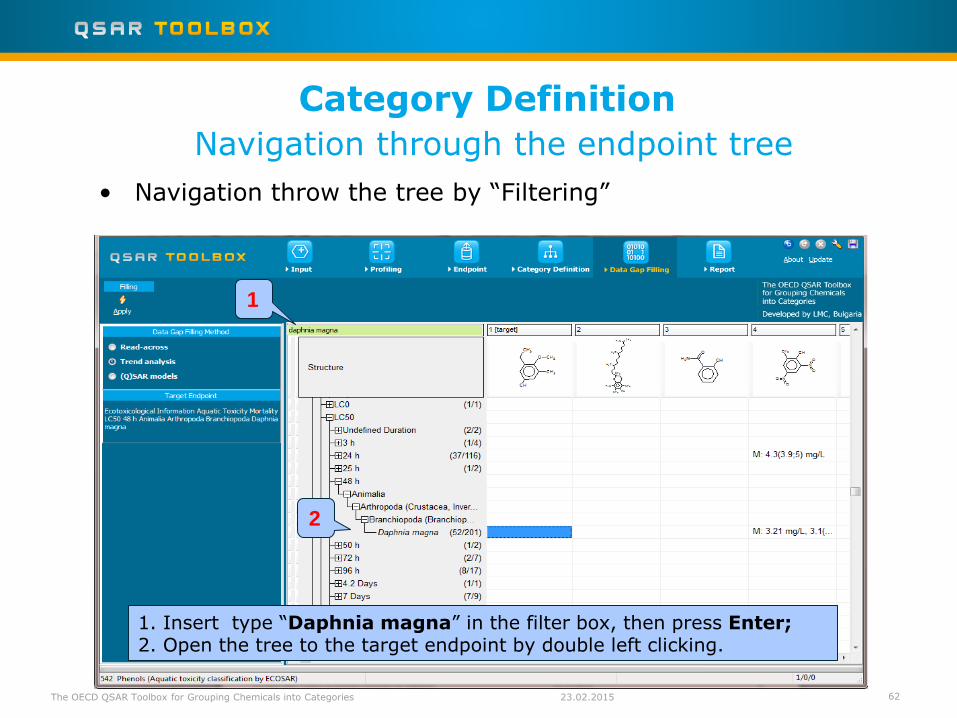
• Navigation throw the tree by “Filtering”
1. Insert type “Daphnia magna” in the filter box, then press Enter; 2. Open the tree to the target endpoint by double left clicking.
1
2
62
Category Definition
Navigation through the endpoint tree
The OECD QSAR Toolbox for Grouping Chemicals into Categories 23.02.2015

• You have now retrieved the available experimental data on aquatic toxicity for 542 chemicals classified as “phenols” by the “Aquatic toxicity classification by ECOSAR” profiler found in the databases Aquatic ECETOC, Aquatic Japan MoE, ECOTOX, and Aquatic OASIS.
• You have identified the target endpoint of “48 h LC50 Mortality for Daphnia magna”.
• You are ready to fill in the data gap so click on “Data Gap Filling” (see next screen shot).
Recap
63 The OECD QSAR Toolbox for Grouping Chemicals into Categories 23.02.2015

• Background
• Objectives
• Specific Aims
• Trend analysis
• The exercise
• Workflow of the exercise •Chemical Input • Profiling •Endpoint •Category definition •Data Gap Filling
64
Outlook
The OECD QSAR Toolbox for Grouping Chemicals into Categories 23.02.2015

• “Data Gap Filling” module give access to three different data gap filling tools:
• Read-across
• Trend analysis
• Q)SAR models
• Depending on the situation, the most relevant data gap mechanism should be chosen, taking into account the following considerations:
• Read-across is the appropriate data-gap filling method for “qualitative” endpoints like skin sensitisation
or mutagenicity for which a limited number of results are possible (e.g. positive, negative, equivocal).
Furthermore read-across is recommended for “quantitative endpoints” (e.g., 96h-LC50 for fish) if only a
low number of analogues with experimental results are identified.
• Trend analysis is the appropriate data-gap filling method for “quantitative endpoints” (e.g., 96h-LC50 for
fish) if a high number of analogues with experimental results are identified.
• “(Q)SAR models” can be used to fill a data gap if no adequate analogues are found for a target chemical.
• In this example, we use trend analysis.
65
Data Gap Filling
Overview
The OECD QSAR Toolbox for Grouping Chemicals into Categories 23.02.2015
66
Data Gap Filling
Data Gap window
The OECD QSAR Toolbox for Grouping Chemicals into Categories 23.02.2015

67
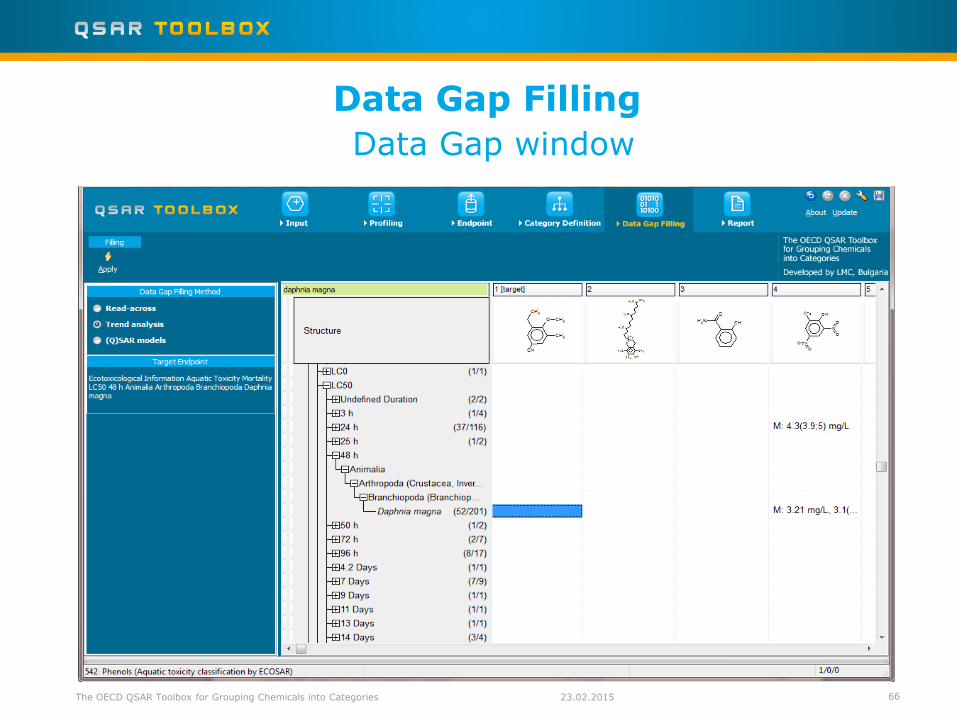
1. Highlight the data endpoint box corresponding to Daphnia magna/LC50/48h under the target chemical. It will be empty;
2. Select Trend analysis; 3. Click Apply
3
2
1
Data Gap Filling
Apply Trend analysis
The OECD QSAR Toolbox for Grouping Chemicals into Categories 23.02.2015

68
Data Gap Filling
Results of Trend analysis
The OECD QSAR Toolbox for Grouping Chemicals into Categories 23.02.2015
• The resulting plot outlines the log of the experimental LC50 results of all analogues (Y axis) according to a descriptor (X axis) with Log Kow being the default descriptor (see next slide).
• The RED dot represents the predicted value for the target chemical.
• The BLUE dots represent the experimental results available for the analogues used in the trend analysis.
• Before accepting the estimated result for the target chemical, the trend analysis should be further refined by subcategorisation (see following slides).
69
Data Gap Filling
Interpreting Trend analysis
The OECD QSAR Toolbox for Grouping Chemicals into Categories 23.02.2015

• Remember in the Toolbox, a category refers to a group of chemicals which have the same profiling result according to one of the profilers listed in the module “Profiling”.
• Subcategorisation refers to the process of applying additional profilers to the previously defined category; subcaregorisation identifies chemicals which have differing profiling results and eventually eliminating these chemicals from the final category.
70
Data Gap Filling
Side-Bar of Subcategorisation
The OECD QSAR Toolbox for Grouping Chemicals into Categories 23.02.2015
In this example, subcategorisation allows for the elimination of analogues which are dissimilar to the target chemical with respect to:
- Substance type (mixtures and hydrolizing chemicals)
The categorisation based on substance type allows keeping among the analogues only those that are of the same chemical type: discrete chemicals, mixtures, polymers, inorganics, organometalics. The current target is a discrete chemical hence the analogues should also be discrete chemicals.
- OASIS Mode of action (all except phenols and anilines)
The categorization based on mode of action identifies analogues having the same mode of action as the target which is in the group of phenols and anilines.
- Chemical elements
The profiler aimed to identify analogues consisting of same elements as those presented in the target chemical
Subcategorisation is demonstrated in the next 4 screen shots. 71
Data Gap Filling
Side-Bar of Subcategorisation
The OECD QSAR Toolbox for Grouping Chemicals into Categories 23.02.2015
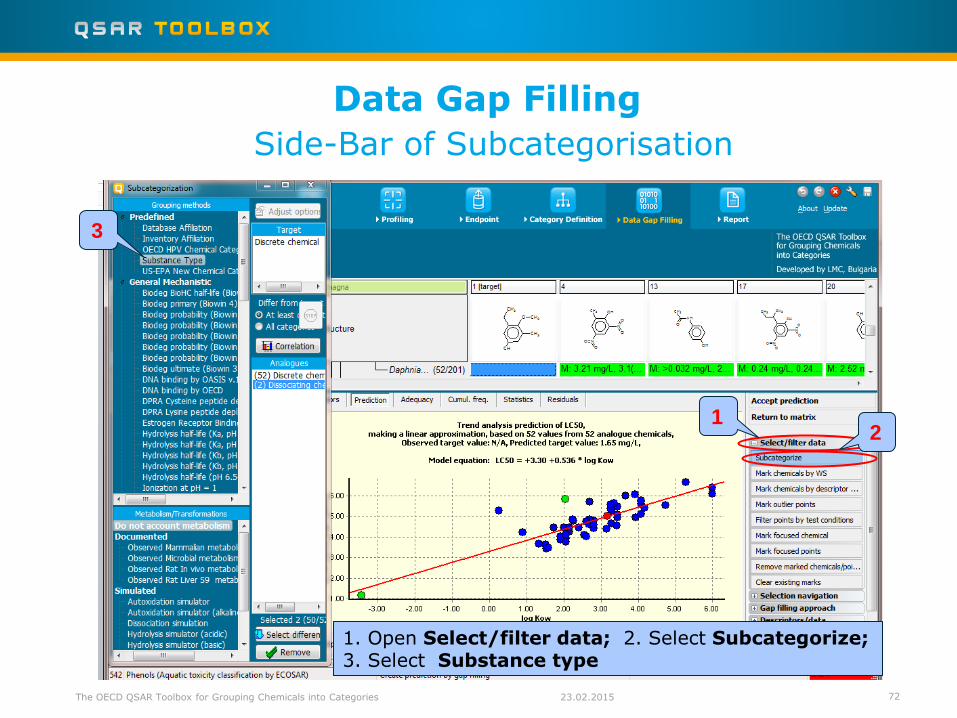
1. Open Select/filter data; 2. Select Subcategorize; 3. Select Substance type
3
1 2
72
Data Gap Filling
Side-Bar of Subcategorisation
The OECD QSAR Toolbox for Grouping Chemicals into Categories 23.02.2015

73
1
2
3
1. Double click above the outlier to see why this chemical is different to the target The chemical is dissociating chemical and has to be eliminated being different substance type
compared to the target, which is a discrete chemical. 2. Close; 3. Click Remove to eliminate dissimilar chemical
Data Gap Filling
Side-Bar of Subcategorisation
The OECD QSAR Toolbox for Grouping Chemicals into Categories 23.02.2015

1
2
Data Gap Filling
Subcategorisation by Acute-aquatic toxicity MOA
1. Select Acute aquatic toxicity MOA by OASIS; 2. Click Remove to eliminate dissimilar chemical
The OECD QSAR Toolbox for Grouping Chemicals into Categories 23.02.2015 74
1
2
Data Gap Filling
Subcategorisation by Chemical elements
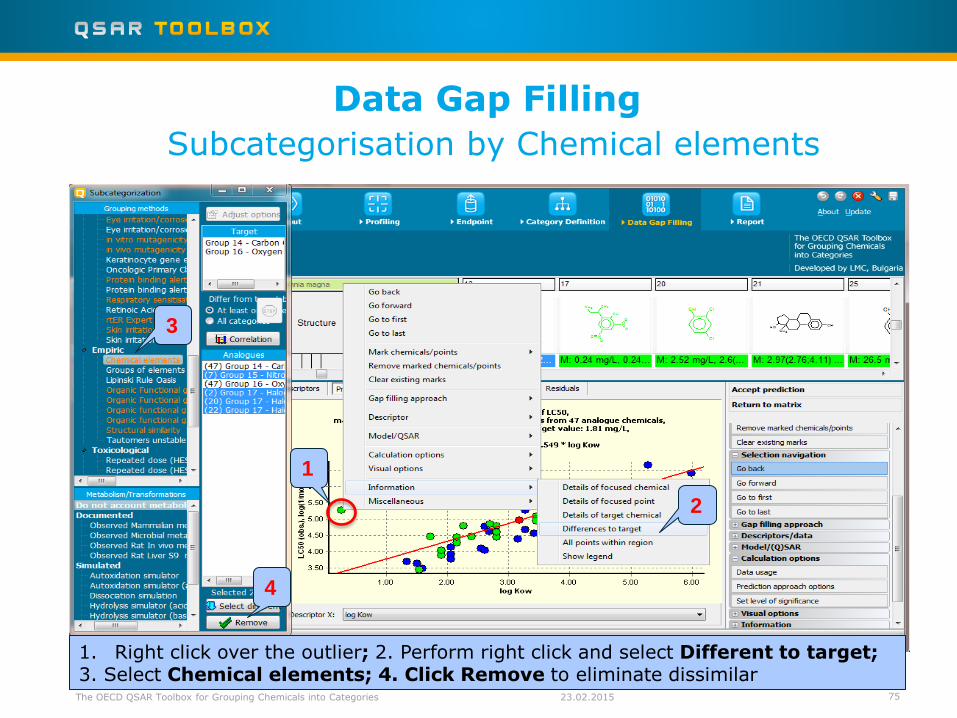
1. Right click over the outlier; 2. Perform right click and select Different to target; 3. Select Chemical elements; 4. Click Remove to eliminate dissimilar The OECD QSAR Toolbox for Grouping Chemicals into Categories
3
4
23.02.2015 75

Data Gap Filling
Results
The OECD QSAR Toolbox for Grouping Chemicals into Categories 23.02.2015 76

• The remaining chemicals in the graph now all have a consistent profile relevant for aquatic toxicity (i.e. substance type, Classification by ECOSAR, MOA by OASIS and Chemical elements).
• By accepting the prediction the data gap is filled (see next screen shot).
• By clicking on Return to Matrix, the user can close the read-across and proceed with the workflow (see next screen shot).
77
Data Gap Filling
Results
23.02.2015 The OECD QSAR Toolbox for Grouping Chemicals into Categories
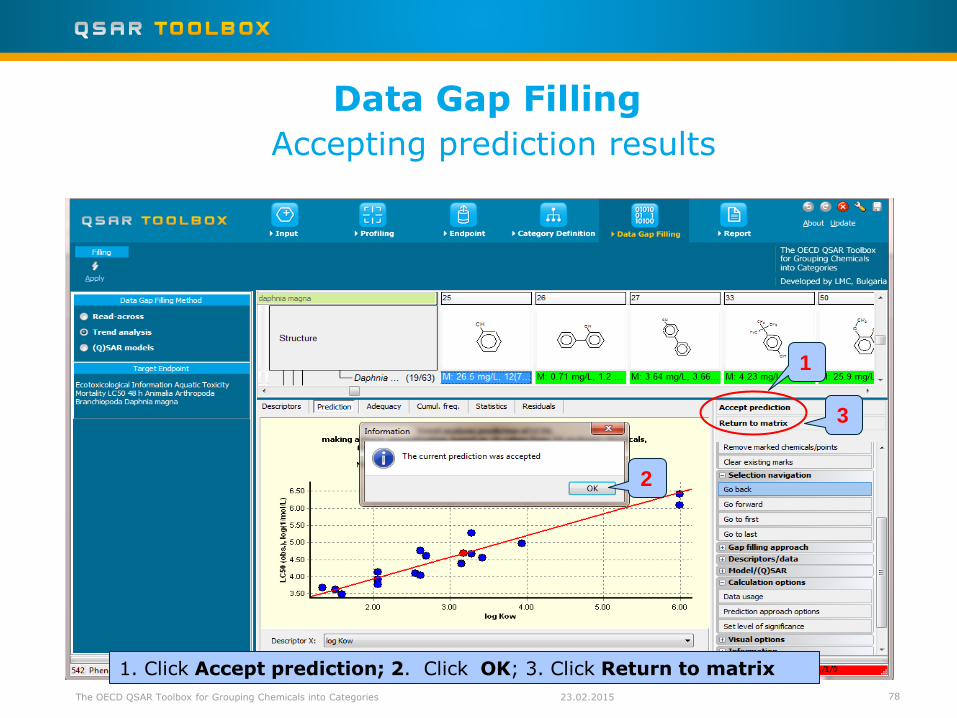
1. Click Accept prediction; 2. Click OK; 3. Click Return to matrix
1
2
78
Data Gap Filling
Accepting prediction results
3
23.02.2015 The OECD QSAR Toolbox for Grouping Chemicals into Categories

• Background
• Objectives
• Specific Aims
• Trend analysis
• The exercise
• Workflow of the exercise •Chemical Input • Profiling •Endpoint •Category definition •Data Gap Filling •Export a prediction to IUCLID5
79
Outlook
The OECD QSAR Toolbox for Grouping Chemicals into Categories 23.02.2015

• The OECD QSAR Toolbox allows the users to export predicted data (by means of the Filling Data Gap tools) to IUCLID 5.
• There are two ways of exporting:
• create an *.i5z file which can then be imported into an IUCLID 5 database.
• connect to an IUCLID 5 server (via WebServices) and assigning the predicted endpoint data to a selected substance.
• A wizard will guide the user through the different steps of exporting (see next screen shot).
• More detailed information could be found in the following link: http://www.oecd.org/dataoecd/54/27/47136326.pdf
Export prediction to the IUCLID5
Overview
The OECD QSAR Toolbox for Grouping Chemicals into Categories 23.02.2015 80
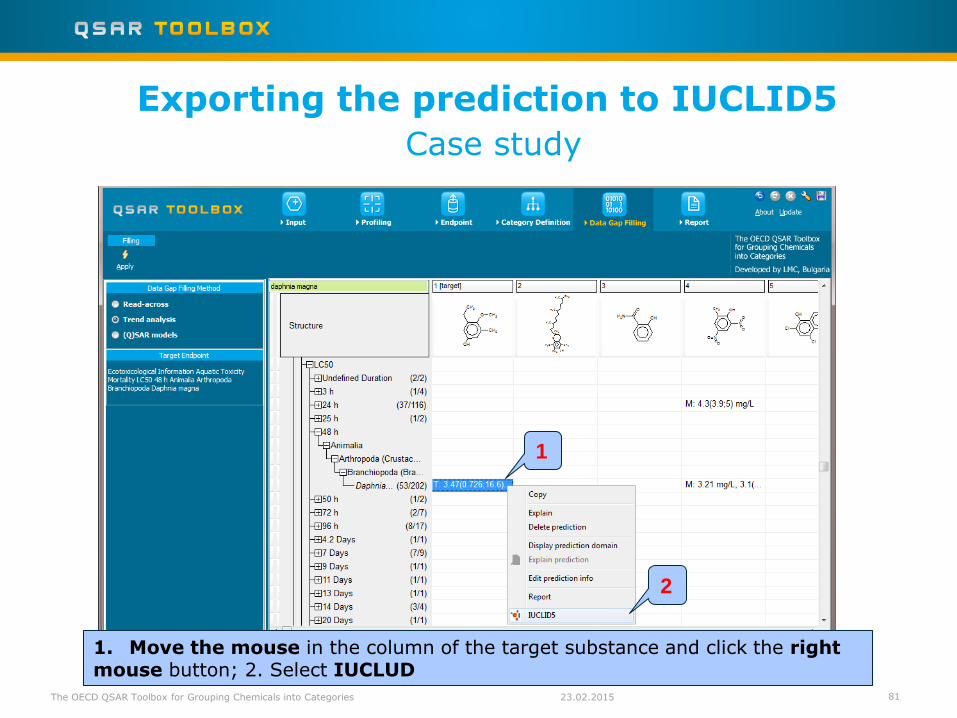
1. Move the mouse in the column of the target substance and click the right mouse button; 2. Select IUCLUD
1
2
81
Exporting the prediction to IUCLID5
Case study
23.02.2015 The OECD QSAR Toolbox for Grouping Chemicals into Categories

1. Select the prediction to export (green tick appears); 2. Click Next to move throw the next step of the export.
1
2
The user could also edit the report information
82
Exporting the prediction to IUCLID5
Case study
The OECD QSAR Toolbox for Grouping Chemicals into Categories 23.02.2015
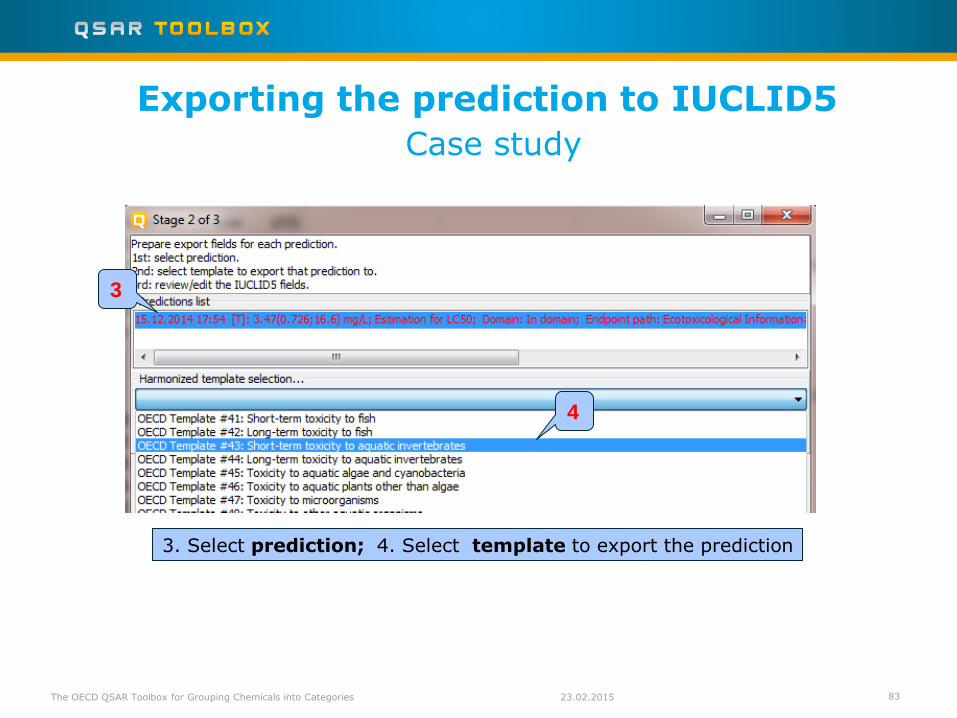
3. Select prediction; 4. Select template to export the prediction
3
83
Exporting the prediction to IUCLID5
Case study
4
The OECD QSAR Toolbox for Grouping Chemicals into Categories 23.02.2015

5. Review/edit the IUCLID5 fields 6. Click Next
5 6
84
Exporting the prediction to IUCLID5
Case study
The OECD QSAR Toolbox for Grouping Chemicals into Categories 23.02.2015
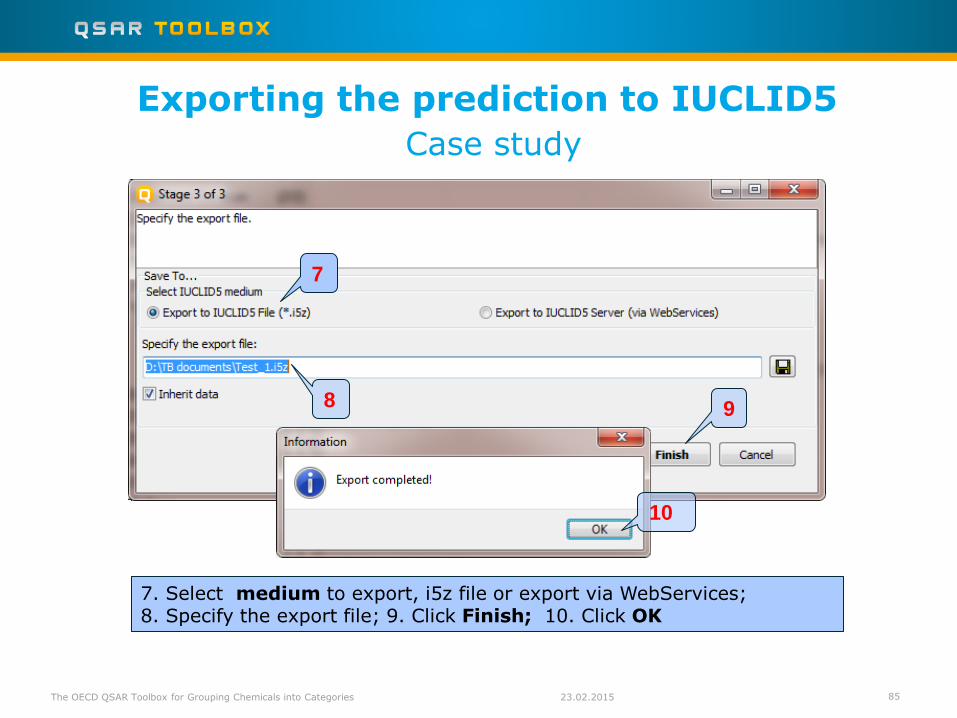
7. Select medium to export, i5z file or export via WebServices; 8. Specify the export file; 9. Click Finish; 10. Click OK
7
8 9
85
Exporting the prediction to IUCLID5
Case study
The OECD QSAR Toolbox for Grouping Chemicals into Categories
10
23.02.2015
• Background
• Objectives
• Specific Aims
• Trend analysis
• The exercise
• Workflow of the exercise •Chemical Input • Profiling •Endpoint •Category definition •Data Gap Filling •Export a prediction to IUCLID5 •Report
86
Outlook
The OECD QSAR Toolbox for Grouping Chemicals into Categories 23.02.2015

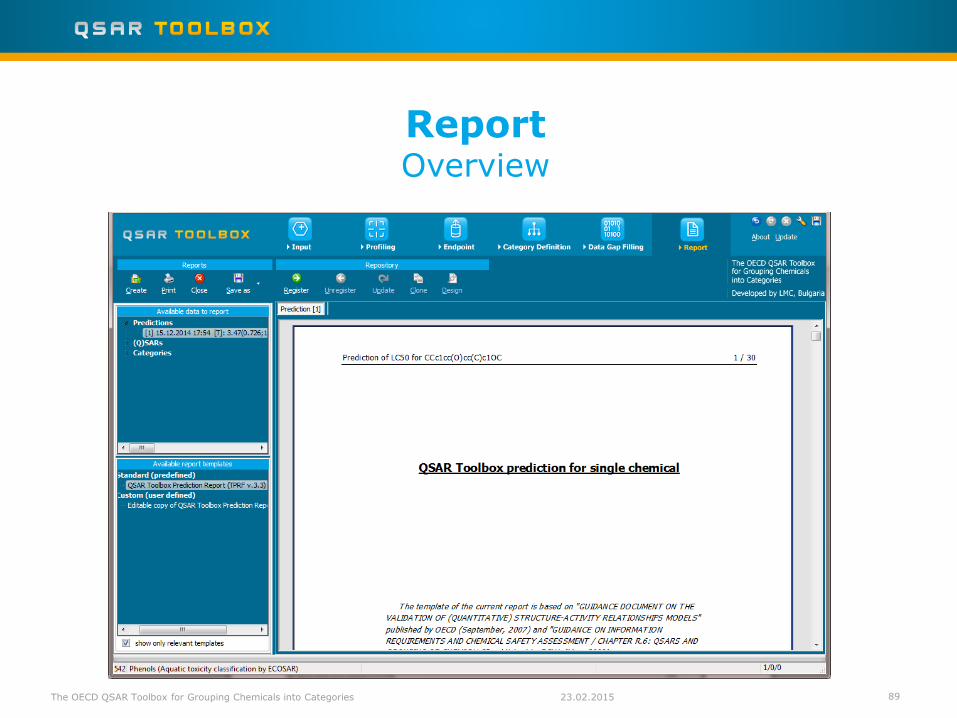
Report Overview
• Report module could generate report on any of predictions performed with the Toolbox.
• Report module contains predefined report templates as well as a template editor with which users can define their own user defined templates.
• The report can then be printed or saved in different formats.
87 The OECD QSAR Toolbox for Grouping Chemicals into Categories 23.02.2015
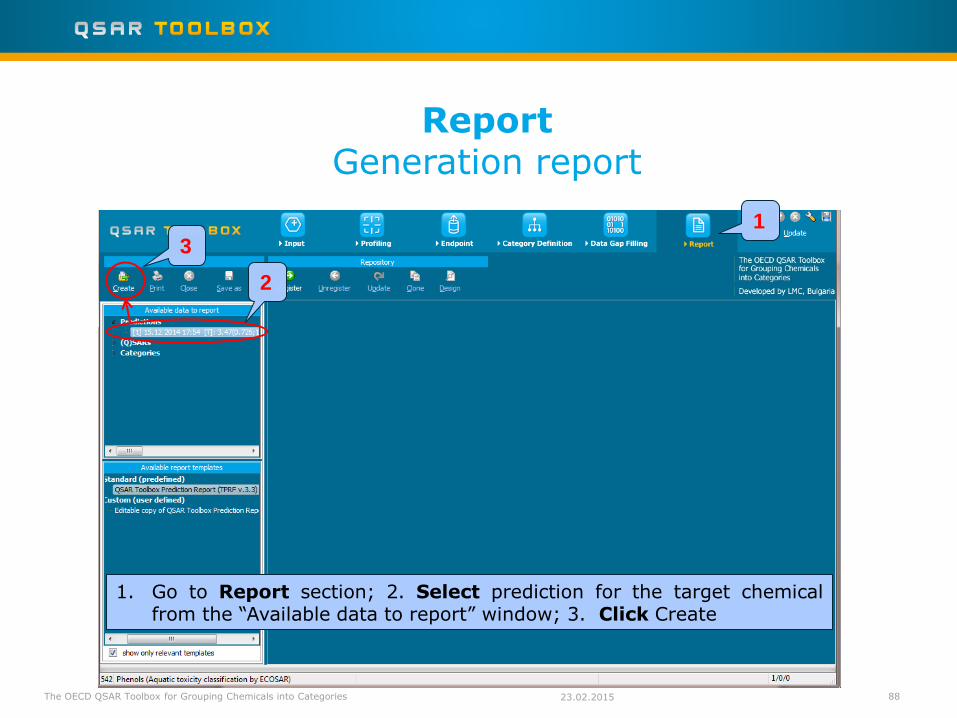
1. Go to Report section; 2. Select prediction for the target chemical from the “Available data to report” window; 3. Click Create
2
1
3
The OECD QSAR Toolbox for Grouping Chemicals into Categories
Report Generation report
88 23.02.2015
89
Report Overview
The OECD QSAR Toolbox for Grouping Chemicals into Categories 23.02.2015

• Background
• Objectives
• Specific Aims
• Trend analysis
• The exercise
• Workflow of the exercise
• Save the prediction result
90
Outlook
The OECD QSAR Toolbox for Grouping Chemicals into Categories 23.02.2015
Saving the prediction result
• This functionality allow storing/restoring the current state of Toolbox documents including loaded chemicals, experimental data, profiles, predictions etc, on the same computer. The functionality is implemented based on saving the sequence of actions that led to the current state of the Toolbox document and later executing these actions in the same sequence in order to get the same result(s).
• Saving/Loading the file with TB prediction is shown on next screenshots
91 The OECD QSAR Toolbox for Grouping Chemicals into Categories 23.02.2015
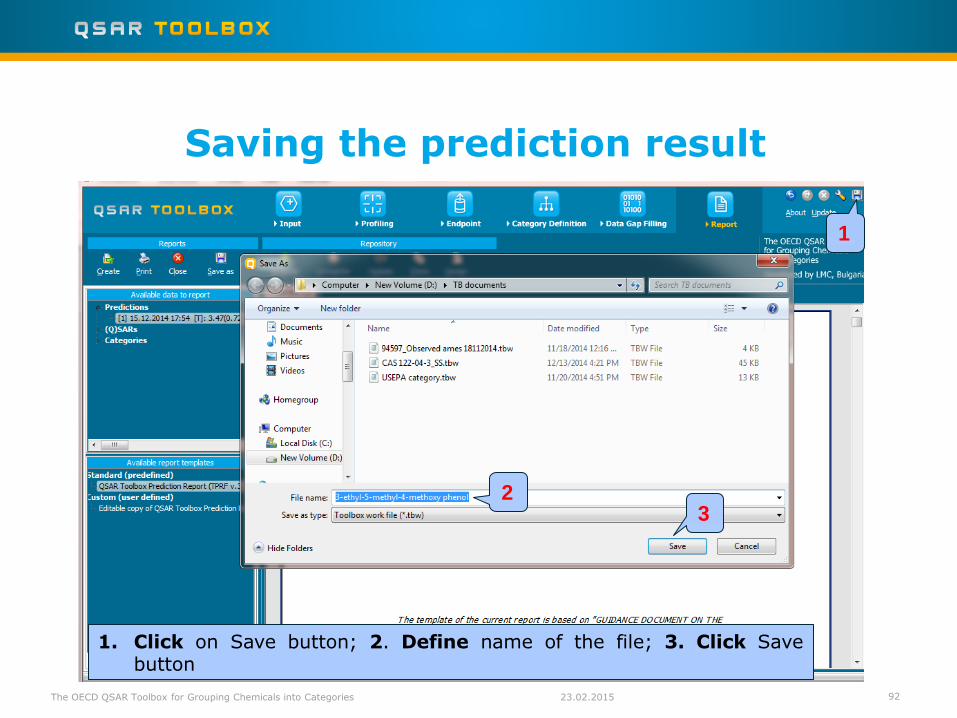
Saving the prediction result
1. Click on Save button; 2. Define name of the file; 3. Click Save button
1
2 3
92 The OECD QSAR Toolbox for Grouping Chemicals into Categories 23.02.2015
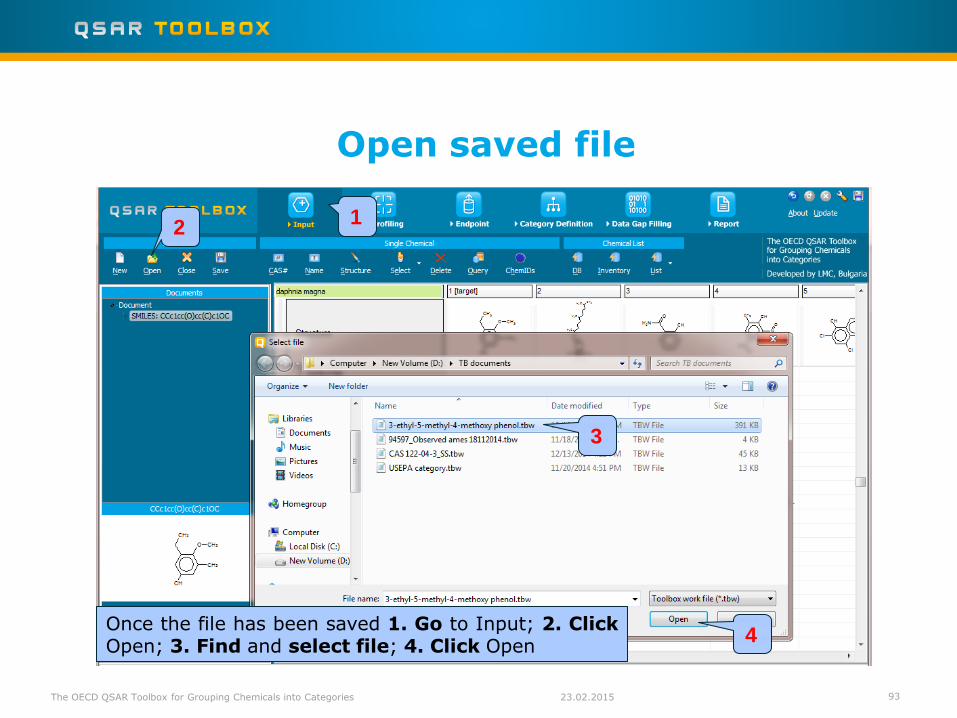
Open saved file
Once the file has been saved 1. Go to Input; 2. Click Open; 3. Find and select file; 4. Click Open
1 2
3
4
93 The OECD QSAR Toolbox for Grouping Chemicals into Categories 23.02.2015

• You have now been introduced to the work flow of the Toolbox and completed the tutorial on data gap filling by trend analysis and exported the prediction to IUCLID 5
• You have been introduced to the six modules of the Toolbox, the basic functionalities within each module and the rationale behind each module.
• Remember proficiency comes with practice.
94
Congratulations
The OECD QSAR Toolbox for Grouping Chemicals into Categories 23.02.2015