oecd economic survey of slovenia 2017 · oecd economic survey of slovenia 2017 . boosting...
TRANSCRIPT
OECD ECONOMIC SURVEY OF SLOVENIA 2017
Boosting investment through better skills and regulation Ljubljana, 5 September 2017
http://www.oecd.org/eco/surveys/economic-survey-slovenia.htm
@OECDeconomy @OECD

The economy is rebounding after a long recession
2

Growth is strengthening
3 Source: OECD Analytical Database.
-10
-8
-6
-4
-2
0
2
4
6
8
10
2000 2001 2002 2003 2004 2005 2006 2007 2008 2009 2010 2011 2012 2013 2014 2015 2016 2017
Contribution of domestic demand (percentage points) Real GDP growth (%)
Quarterly GDP (Y-o-Y changes)

Income convergence has resumed
4 Source: OECD Analytical Database.
- 70
- 60
- 50
- 40
- 30
2006 2008 2010 2012 2014 2016
SVN CZE HUN POL SVK
%
Income/capita gap to the upper half of OECD countries
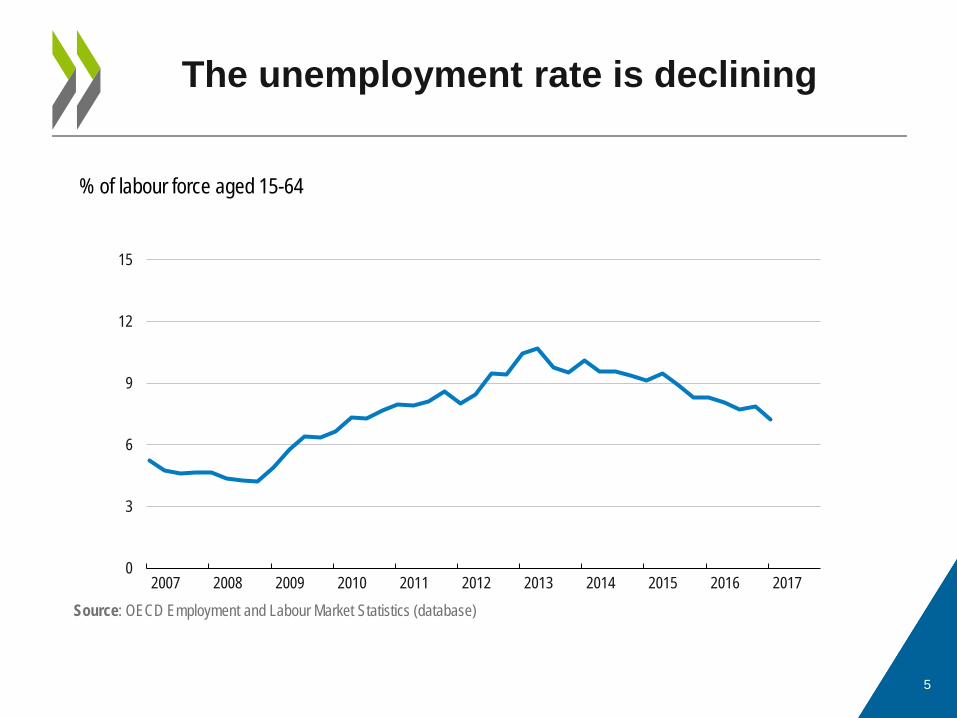
The unemployment rate is declining
5
Source: OECD Employment and Labour Market Statistics (database)
0
3
6
9
12
15
2007 2008 2009 2010 2011 2012 2013 2014 2015 2016 2017
% of labour force aged 15-64
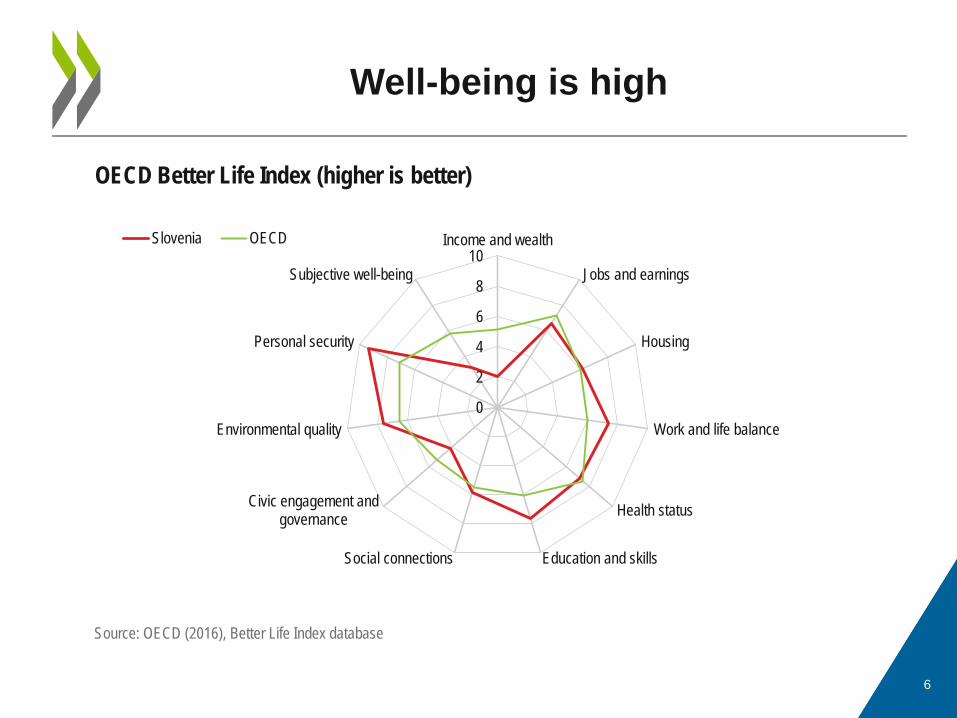
Well-being is high
6
OECD Better Life Index (higher is better)
0
2
4
6
8
10Income and wealth
Jobs and earnings
Housing
Work and life balance
Health status
Education and skillsSocial connections
Civic engagement andgovernance
Environmental quality
Personal security
Subjective well-being
Slovenia OECD
Source: OECD (2016), Better Life Index database

Income inequality is low
7 Source: Calculations based on the OECD Income Distribution Database
Income redistribution (90/10 ratio of the average income of the top decile to that of the bottom decile), latest available data
0
10
20
30
40
50
60
ISL
CZE
SVN
FIN
DNK
BEL
LUX
CHE
SVK
AUT
FRA
NOR
SWE
DEU
KOR
NLD
POL
IRL
CAN
GBR
LTU
PRT
LVA
TUR ITA
GRC
EST
ESP
ISR
USA
CHL
90/10, before redistribution 90/10, after redistribution
Ratio

Bolstering investment is key for higher
productivity
9
Source: OECD, Analytical database
15
20
25
30
35
2000 2001 2002 2003 2004 2005 2006 2007 2008 2009 2010 2011 2012 2013 2014 2015 2016
Slovenia Hungary Czech Republic Poland Slovak Republic
Total investment, as a percentage of GDP

Firms are facing increasing labour shortages
10
Source: Eurostat, Industry database.
0
5
10
15
20
25
30
35
40
2009 2010 2011 2012 2013 2014 2015 2016 2017
SVN EU28 Euro area
% of firms reporting labour shortages

Businesses face a heavy regulatory burden
11
Product market regulation indicator, index scale of 0 – 6 from least to most restrictive, latest available data
Source: OECD PMR indicators database.
0.0
0.5
1.0
1.5
2.0
2.5
NLD
GBR
AUT
DNK
NZL
ITA
SVK
AUS
EST
FIN
DEU
PRT
HUN
BEL
CZE
JPN
CAN
ESP
IRL
LUX
NOR
OECD FR
A ISL
CHE
CHL
SWE
POL
SVN
GRC
KOR
MEX
ISR
TUR
Index
Securing fiscal sustainability
12

Gross public debt is now declining
13
Source: OECD
0.0
10.0
20.0
30.0
40.0
50.0
60.0
70.0
80.0
90.0
2007 2008 2009 2010 2011 2012 2013 2014 2015 2016
% of GDP

The fiscal deficit is still falling
14
Source: OECD
-16.0
-14.0
-12.0
-10.0
-8.0
-6.0
-4.0
-2.0
0.02007 2008 2009 2010 2011 2012 2013 2014 2015 2016% of GDP

Ageing endangers fiscal sustainability
15
General government gross debt, % of GDP
Source: OECD calculations based on OECD (2017), OECD Economic Outlook: Statistics and Projections (database), December; OECD (2017), Main Economic Indicators.
0
20
40
60
80
100
120
140
160
180
200
2000 2003 2006 2009 2012 2015 2018 2021 2024 2027 2030 2033 2036 2039 2042 2045 2048 2051 2054 2057 2060
Balanced budget scenario 1 % of GDP deficit Without offsetting ageing-related costs

16
Key fiscal and spending recommendations
The government should pursue its 2020 fiscal balance objective, and preferably frontload consolidation to avoid overheating.
It should also maintain spending ceilings, pursue efficiency improvement and adjust the structure of public spending to avoid a renewed increase in public debt.
Faster, well thought-out privatisation would reduce public debt and the high level
of contingent liabilities.
Pension system: Raise the effective and statutory retirement ages. Cover shortfalls through additional contributions and lower pension
indexation. Increase incentives to work longer.
Health-care system:
Allow hospitals to adjust their health services to changing demand, by including multi-year investments and allowing them to keep cost savings.

Raising wages and living standards by investing in capital
and skills
17

Long-term unemployment remains high
18
Source: OECD, Labor Force Survey - Sex and Age composition database
Share of long-term unemployed (over one year) in total unemployment
0
10
20
30
40
50
60
70
2000
2001
2002
2003
2004
2005
2006
2007
2008
2009
2010
2011
2012
2013
2014
2015
2016
SVN OECD EU28
%

Older workers retire early, undermining inclusiveness
19
Source: OECD, Labor Force Survey - Sex and Age composition database
Employment rate for older workers (aged 55-64), 2016
0
10
20
30
40
50
60
70
80
90
TUR
GRC
SVN
LUX
BEL
POL
SVK
ESP
AUT
HUN
FRA
ITA
PRT
MEX
IRL
CZE
OECD LV
AFI
NCA
NUS
AAU
SNL
DGB
RCH
LES
TKO
RIS
RDN
KDE
UJP
NCH
ENO
RSW
ENZ
LIS
L
%

Older workers have low literacy skills
20 IT
A
0
50
100
150
200
250
300
CHL
TUR
ESP
ISR ITA
SVN
FRA
KOR
GRC
POL
AUT
OECD IR
LDN
KDE
UBE
LUK
2FI
NCA
NES
TNL
DNO
RSW
ECZ
EAU
SUS
AUK
1SV
KNZ
LJP
N
Literacy NumeracyScore
Mean literacy and numeracy proficiency scores for 55 – 65 year-olds, 2015
Source: OECD, Survey of Adult skills(PIAAC), Table A3.2 (L) and (N)

22
Better tertiary educational outcomes will boost investment in skill-intensive sectors
Mean literacy and numeracy proficiency scores for adults with tertiary education, 2015
Source: OECD, Survey of Adult skills(PIAAC), Table A3.2 (l) and (N).
0
50
100
150
200
250
300
350
CHL
TUR
GRC
ISR ITA
ESP
SVN
EST
CAN
KOR IRL
OECD DN
KDE
UFR
ASV
KUK
2UK
1AU
TPO
LUS
ANZ
LNO
RBE
LCZ
EAU
SSW
EFI
NNL
DJP
N
Literacy NumeracyScore

23
Key recommendations in the labour market and skills development
Improve general skills of vocational students through use of problem-based
learning, combined with retraining of teachers. Raise the work-experience content of technical programmes.
Increase training to help long-term unemployed to re-enter the labour market.
Improve life-long learning by using adult training vouchers or tax credits to increase training opportunities.
Eliminate the legal requirement that wages increase automatically with age. Harmonise the maximum duration of unemployment benefit across age
groups.
Link university funding to students' labour market outcomes.
Equalise tuition fees for full- and part-time students on a per course basis, coupled with grants and loans for those from poor families.

Fostering productivity by improving regulation and enhancing competition
24

Regulatory quality could be improved
25
Source: 2014 Regulatory Indicators Survey results
0
0.5
1
1.5
2
2.5
3
3.5
4GR
CTU
R IRL
SVK
USA
FIN
CZE
JPN
ESP
FRA
PRT
CHL
SVN
NOR
HUN ISL
ITA
NLD
LUX
DNK
POL
ISR
KOR
NZL
AUT
EST
SWE
CHE
CAN
BEL EU DEU
MEX
GBR
AUS
Transparency of ex post evaluation
Systematic adoption of ex post evaluation
Oversight of ex post evaluation
Methodology of ex post evaluation
Worst
Best

Entry barriers hinder investment in new technologies
26
Real gross value added per worker in professional services is low, PPP, 2014
Source: Eurostat, "Structural business Statistics - Services", Eurostat Database.
Engineering Architecture
0
20
40
60
80
100
120
GRC
LVA
PRT
HUN
EST
POL
SVK
SVN ITA
FIN
ESP
SWE
DNK
AUT
EU28
FRA
NLD
DEU
LUX
BEL
GBR
NOR
EUR thousand
0
20
40
60
80
100
120
GRC
LVA
PRT
HUN
SVN
ESP
ITA
POL
SVK
BEL
IRL
NLD
EU28 FIN
AUT
DNK
SWE
DEU
FRA
LUX
NOR
GBR
EUR thousand

The competition authority has had few successful cases
27
Source: The Slovenian Competition Protection Agency
Enforcement outcomes, 2014
40%
47%
5%
8%
CPA decisions partially upheld bycourtCases remanded back to CPA forreconsiderationCases dismissed by the Court
CPA decisions fully upheld by Court

State owned enterprises are still present in many sectors
28
Source: Slovenian Sovereign Holding (http://www.sdh.si/sl-si/upravljanje-nalozb/seznam-nalozb# - February 2017); ORBIS data base.
0
10
20
30
40
50
60
70
A - A
gricu
lture
, fore
stry a
nd fis
hing
B - M
ining
and q
uarry
ing
C - M
anufa
cturin
g
D - E
lectric
ity, g
as, s
team
and a
ir con
dition
ingsu
pply
E - W
ater s
upply
; sew
erag
e, wa
stema
nage
ment
and r
emed
iation
activ
ities
F - C
onstr
uctio
n
G - W
holes
ale an
d reta
il tra
de; r
epair
ofmo
tor ve
hicles
and m
otorcy
cles
H - T
rans
porta
tion a
nd st
orag
e
I - A
ccom
moda
tion a
nd fo
od se
rvice
activ
ities
J - In
forma
tion a
nd co
mmun
icatio
n
K - F
inanc
ial an
d ins
uran
ce ac
tivitie
s
L - R
eal e
state
activ
ities
M - P
rofes
siona
l, scie
ntific
and t
echn
ical
activ
ities
N - A
dmini
strati
ve an
d sup
port
servi
ceac
tivitie
s
O - P
ublic
admi
nistra
tion a
nd de
fence
;co
mpuls
ory s
ocial
secu
rity
P - E
duca
tion
Q - H
uman
healt
h and
socia
l wor
k acti
vities
R - A
rts, e
nterta
inmen
t and
recre
ation
S - O
ther s
ervic
e acti
vities
Number of SOEs

29
Key recommendations for improving regulation and enhancing competition
Apply consistently a common RIA framework:
including effective quality control, and training to carry out ex ante and ex post regulatory evaluations.
Simplify judicial proceedings.
Increase the competition authority’s resources and staff expertise.
Shrink the list of regulated professions, and, where regulation is
retained, move to less restrictive forms. Develop a common approach to cost-benefit analysis for project
selection.

30
Key recommendations for improving regulation and enhancing competition (continued)
Strengthen SOE governance:
by directing them to focus on core activities, allowing more management pay flexibility and strengthening supervisory boards.
Follow through with privatisation, and narrow the group of SOEs that are
considered strategic.
Implement effective separation of activities and non-discriminatory third-party access to networks. Privatise competitive activities, except in sensitive sectors.
Avoid technology biases in renewable-energy subsidies.

Disclaimers: The statistical data for Israel are supplied by and under the responsibility of the relevant Israeli authorities. The use of such data by the OECD is without prejudice to the status of the Golan Heights, East Jerusalem and Israeli settlements in the West Bank under the terms of international law. This document and any map included herein are without prejudice to the status of or sovereignty over any territory, to the delimitation of international frontiers and boundaries and to the name of any territory, city or area.
Follow us on twitter:
More Information…
http://www.oecd.org/eco/surveys/economic-survey-slovenia.htm OECD Economics OECD
31