odu financial statements 2013 · old dominion university financial report 2013 1 ... notes to...
TRANSCRIPT

Old Dominion University Financial Statements
June 30, 2013


Old Dominion University Financial Report 2013 1
TABLE OF CONTENTS
Management’s Discussion & Analysis ............................................................................... 3
Statement of Net Position ................................................................................................. 12
Statement of Revenues, Expenses and Changes in Net Position ...................................... 13
Statement of Cash Flows ................................................................................................... 14
Notes to Financial Statements ........................................................................................... 17 Independent Auditor's Report ........................................................................................... 43 University Officials ........................................................................................................... 47

Old Dominion University Financial Report 2013 2
Page Left Intentionally Blank

Old Dominion University Financial Report 2013 3
MANAGEMENT’S DISCUSSION AND ANALYSIS (Unaudited)
Old Dominion University is a comprehensive, multicultural, and student-centered research doctoral
university whose central purpose is to provide our students with the best education possible. The University is comprised of six colleges: Arts and Letters, Business and Public Administration, Education, Engineering and Technology, Health Sciences and Sciences that offer 70 baccalaureate programs, 54 master’s programs, two education specialist programs and 42 doctoral programs. More than 24,600 undergraduate and graduate students comprise the Old Dominion University student body, including more than 750 international students from 104 countries.
The University’s local, regional and national impact continues to grow. With an economic impact on
the Hampton Roads area of over $1 billion annually, Old Dominion University is one of the largest generators of new jobs in the region. The University is committed to providing research-driven solutions. Our world-class researchers are partnering with business, industry, government and investment leaders to create answers for society's most pressing challenges. Old Dominion University has made great strides in significant areas of research, including modeling and simulation, bioelectrics, maritime, ports and logistics, nanotechnologies, sea rise, and alternative energies with over 400 projects in progress at our 26 research centers.
The University is an agency of the Commonwealth of Virginia, and therefore included as a component
unit in the Commonwealth of Virginia’s Comprehensive Annual Financial Report. The 17 members of Old Dominion University’s Board of Visitors, who are appointed by the Governor of Virginia, govern University operations. Overview of the Financial Statements and Financial Analysis
The Management’s Discussion and Analysis (MD&A) is required supplemental information under the Governmental Accounting Standards Board (GASB) reporting model. It is designed to assist readers in understanding the accompanying financial statements and provides an objective, easily readable analysis of Old Dominion University financial activities based on currently known facts, decisions, and conditions. This discussion includes an analysis of the University’s financial condition and results of operations for the fiscal year ended June 30, 2013. Note that although the University’s foundations identified as component units under GASB Statement 61 are reported in the financial statements, they are excluded from this MD&A, except where specifically noted. Comparative numbers, where presented, are for the fiscal year ended June 30, 2012. Since this presentation incudes highly summarized data, it should be read in conjunction with the accompanying financial statements, Notes to the Financial Statements, and other supplemental information. University management is responsible for all of the financial information presented, including this discussion and analysis.
The three basic financial statements are the Statement of Net Position (balance sheet), the Statement of
Revenues, Expenses and Changes in Net Position (operating statement), and the Statement of Cash Flows. The following analysis discusses elements from each of these statements, as well as an overview of the University’s activities.

Old Dominion University Financial Report 2013 4
Statement of Net Position
The Statement of Net Position presents the University’s assets, liabilities, and net position as of the end of the fiscal year. The purpose of this statement is to present to the financial statement readers a snapshot of the University’s financial position at year-end. From the data presented, readers of the Statement of Net Position are able to determine the assets available to continue the University’s operations. They are also able to determine how much the University owes vendors and creditors.
Net Position is divided into three major categories. The first category, net investment in capital assets,
provides the University’s equity in property, plant, and equipment owned by the University. The next category is restricted which is divided into two categories in the financial statements, nonexpendable and expendable. Restricted nonexpendable net position consists solely of the University’s permanent endowment funds and is only available for investment purposes. Expendable restricted net position is available for expenditure by the institution but must be spent for purposes as determined by donors and/or external entities that have placed time or purpose restrictions on them. The final category is unrestricted net position which is available to the institution for any lawful purpose of the institution.
Condensed Summary of Net Position
(amounts in thousands)
Increase / Percent 2013 2012 (Decrease) Change
Assets:Current 103,619$ 89,190$ 14,429$ 16.2%Capital, net of accumulated depreciation 561,768 555,935 5,833 1.0%Other noncurrent 42,884 42,695 189 0.4% Total assets 708,271 687,820 20,451 3.0%
Liabilities:Current 74,672 62,017 12,655 20.4 %Noncurrent 245,267 259,575 (14,308) (5.5)% Total liabilities 319,939 321,592 (1,653) (0.5)%
Net Position:Net investment in capital assets 308,040 289,148 18,892 6.5 %Restricted 28,644 28,394 250 0.9 %Unrestricted 51,648 48,686 2,962 6.1 % Total net position 388,332$ 366,228$ 22,104$ 6.0 %
As of June 30,
The University’s financial position remained strong at the end of fiscal year 2013 with an increase in total assets of $20.5 million or 3.0%. The growth in current assets of $14.4 million or 16.2% was a result of an increase in auxiliary cash, monies due from the Commonwealth for reimbursement bond programs and cash relating to the Securities Lending Program. Current liabilities increased 20.4% or $12.7 million due to the timing of payments to vendors for goods and services and construction projects, along with an increased liability for cash and investments relating to the Securities Lending Program. Noncurrent liabilities decreased $14.3 million or 5.5% due to the normal payment of debt, while total University liabilities decreased $1.7 million or 0.5%. The overall financial position of the University improved over the prior fiscal year as evidenced by the growth in net position of $22.1 million or 6.0%.

Old Dominion University Financial Report 2013 5
Statement of Revenues, Expenses and Changes in Net Position
Changes in total net position as presented on the Statement of Net Position are based on the activity presented in the Statement of Revenues, Expenses and Changes in Net Position. The purpose of the statement is to present the revenues received by the University, both operating and nonoperating, and the expenses paid by the University, operating and nonoperating, and any other revenues, expenses, gains and losses received or spent by the University.
Generally, operating revenues are received for providing goods and services to students and other constituencies of the institution. Operating expenses are those expenses incurred to acquire or produce the goods and services provided in return for the operating revenues and to carry out the University’s mission. Salaries and fringe benefits for faculty and staff are the largest type of operating expense.
Nonoperating revenues are revenues received for which goods and services are not provided. For example, the University’s state appropriations are nonoperating because they are provided by the state legislature without the legislature directly receiving commensurate goods and services for those revenues.
Condensed Summary of Net Revenues, Expenses and Changes in Net Position
(amounts in thousands)
Increase / Percent 2013 2012 (Decrease) Change
Operating revenues:Student tuition and fees 120,047$ 113,653$ 6,394$ 5.6 %Federal grants and contracts 4,808 5,176 (368) (7.1)%State, local & nongovernmental grants 2,528 2,504 24 1.0 %Auxiliary enterprises 95,981 95,742 239 0.2 %Other operating revenues 4,581 6,893 (2,312) (33.5)% Total operating revenues 227,945 223,968 3,977 1.8 %
Operating expenses:Instruction 135,599 128,379 7,220 5.6 %Research 7,773 7,303 470 6.4 %Public service 444 458 (14) (3.1)%Academic support 42,130 43,056 (926) (2.2)%Student services 14,351 13,353 998 7.5 %Institutional support 28,346 28,097 249 0.9 %Operation and maintenance 26,202 24,830 1,372 5.5 %Depreciation 22,577 26,645 (4,068) (15.3)%Scholarships and fellowships 17,711 16,955 756 4.5 %Auxiliary activities 80,774 73,562 7,212 9.8 % Total operating expenses 375,907 362,638 13,269 3.7 %Operating loss (147,962) (138,670) (9,292) 6.7 %Net nonoperating revenues and expenses 147,708 139,281 8,427 6.1 %Income before other revenues/ (expenses)/gains/(losses) (254) 611 (865) (141.6)%Net other revenues and expenses 22,358 9,665 12,693 131.3 %Increase in net position 22,104 10,276 11,828 115.1 %Net position - beginning of year 366,228 355,952 10,276 2.9 %Net position - end of year 388,332$ 366,228$ 22,104$ 6.0 %
Year Ended June 30,

Old Dominion University Financial Report 2013 6
The largest components of total operating revenue are primarily student tuition and fees which increased $6.4 million or 5.6% and auxiliary enterprise revenue which increased by $0.2 million or 0.2% from the prior fiscal year. The growth in revenue was due to the rise in both in-state and out-of-state tuition rates. The overall increase in nonoperating revenue of $8.4 million or 6.1% was caused by an increase in funding from the Commonwealth through appropriations for base operating support, an increase in Pell grant revenue and investment income which was offset by a reduction in federal stimulus funding in 2013. Finally other revenues increased $12.7 million or 131.3% as a result of additional funding from the 21st Century Bond Program for ongoing campus construction.

Old Dominion University Financial Report 2013 7
Operating expenses increased $13.3 million or 3.7% in response to various factors including
establishment of additional faculty, administrative and staff positions, faculty promotions, and a 3% bonus for faculty and staff. Student financial assistance expenses increased as a result of additional financial aid and scholarship funding for undergraduate students.

Old Dominion University Financial Report 2013 8
Statement of Cash Flows
The Statement of Cash Flows provides relevant information that aids in the assessment of the University’s ability to generate cash to meet present and future obligations and detailed information reflecting the University’s sources and uses of cash during the fiscal year. The statement is divided into five sections. The first section deals with operating cash flows and reflects the sources and uses to support the essential mission of the University. The primary sources are tuition and fees ($139.1 million) and auxiliary enterprises ($109.5 million). The primary uses are payments to employees including salaries, wages, and fringe benefits ($217.2 million) and payments to vendors ($85.3 million).
The second section reflects the cash flow from non-capital financing activities and reflects nonoperating sources and uses of cash primarily to support operations. The primary sources are state appropriations ($120.8 million) and gifts and grants ($37.1 million).
The third section represents cash flows from capital financing activities and details the activities related with the acquisition and construction of capital assets including related debt payments. The primary source of funds is proceeds from reimbursements from the Commonwealth ($14.3 million). The primary uses are principal and interest paid on capital debt ($24.6 million) and purchases of capital assets ($26.6 million).
The fourth section deals with cash flows from investing activities and includes interest on investments
and sale of investments. The primary source was interest on investments and cash management ($1.0 million). The last section which is not included below reconciles the net cash used by operating activities to the operating loss reflected on the Statement of Revenues, Expenses and Changes in Net Position.
Summary Statement of Cash Flows
(amounts in thousands)
Increase / Percent2013 2012 Decrease Change
Cash flows from operating activities (121,914)$ (109,273)$ (12,641)$ (11.6)%Cash flows from non-capital financing activities 157,847 151,106 6,741 4.5 %Cash flows from capital financing activities (34,991) (29,489) (5,502) (18.7)%Cash flows from investing activities 959 785 174 22.2 %Net change in cash 1,901$ 13,129$ (11,228)$ (85.5)%
Year ended June 30,
Capital Asset and Debt Administration
The University continues to maintain and upgrade current structures, as well as adding new facilities. Investment in the development and renewal of capital assets is one of the key factors in sustaining the high quality of the University’s academic, research, and residential life functions. Overall, funds invested in capital assets reflect the ongoing campus construction as indicated in Note 5. In addition to buildings, capital asset additions for June 30, 2013 include increases of $8.9 million in equipment, and $2.1 million in library books.
Several ongoing capital projects were added and completed during the fiscal year which resulted in a net increase in construction in progress of $16.0 million. New additions to construction in progress include Phase II of Diehn Fine Arts building, the System Research and Academic building, and the Education building. Projects were financed through issuance of General Obligation and Revenue Bonds.
Financial stewardship requires effective management of resources, including the use of long-term debt to finance capital projects. The University’s long-term debt decreased $13.8 million as reflected in Notes 7 and 8. The decrease is the result of normal payment of existing debt.

Old Dominion University Financial Report 2013 9
Uncompleted construction and other related contractual commitments increased from $6.5 million at June 30, 2012 to $8.8 million at June 30, 2013, as reflected in Note 12. These obligations are for future efforts and therefore have not been accrued as expenses or liabilities on the University’s financial statements. This large increase is primarily the result of new projects for Phase II of Diehn Fine Arts building and System Research and Academic building. Economic Outlook
The passage of the Virginia Higher Education Opportunity Act by the 2011 Session of the General
Assembly speaks to the importance of policy goals of increasing accessibility and enrollments in high demand disciplines such as Science, Technology, Engineering, and Mathematics. In addition, the Act speaks to a number of restructuring initiatives to enhance progress in promoting higher education opportunities. Financial policy and the Commonwealth’s funding participation will be revisited by the Higher Education Advisory Committee in concert with State agencies. Nonetheless, all Virginia universities are faced with the challenge of containing costs through business process improvements and efficiencies.
The University’s 2013-2014 Budget and Plan is consistent with the criteria set forth in the University Strategic Plan and the Code of Virginia higher education institutional performance standards as evidenced by the focus upon enrollment and recruitment of undergraduate and transfer students, student success and retention, affordability and access for students from under-represented populations, and emphasis on the Science, Technology, Engineering, Math and Health Sciences (STEM/H) disciplines.
Last year, at the request of the President and under the direction of the Chief Operating Officer, the
budget planning process was restructured to involve the Vice Presidents in a more collaborate approach in determining the strategic direction for resource allocations. The Vice Presidents reviewed the budget requests and prioritized the initiatives in accordance with specific strategic principles:
• Mandated unavoidable cost increases, such as 3% salary increases for full-time faculty, 17% increases
in health insurance costs, faculty tenure and promotion increases, and costs for operation and maintenance of new facilities would be supported from available state and tuition funding.
• The conversion of 25 critical adjunct faculties was in response to the Affordable Care Act. These faculty positions taught course loads that exceeded the Act’s guidelines, and reducing the course load would have a negative impact on a student’s time to graduation.
• Investments were made in 25 additional faculty positions, with only a few critical administrative and staff support positions established.
• With the challenge of retaining well qualified faculty and staff, additional compensation adjustments were budgeted for full-time and hourly wage employees.
The outcome is an operating budget and plan that invests in the future of Old Dominion University
and reflects the collective input of the University’s leadership team. The new investments were grouped into the following major success critical categories:
1. Academic Enterprise (Instruction, Research, Public Service and Academic Support): Allocating
resources to hire well qualified faculty to increase college degree attainment in the Commonwealth, especially in high-demand disciplines and high-income fields such as science, technology, engineering, mathematics and health care as well as to improve the full-time faculty/student ratio.
In addition, the University will continue to invest in research and instruction in science, technology, engineering, mathematics, health science and related fields, such as Modeling and Simulation, which require qualified faculty, appropriate research facilities and equipment, and public-private and inter-governmental collaboration.

Old Dominion University Financial Report 2013 10
2. Student Recruitment and Enrollment Management: The University endeavors to provide access to qualified undergraduate and graduate students at an affordable cost. These budgeted initiatives include program funds for the enrollment management functions in admissions and student financial aid as well as in targeted student success programs. Significant investments have also been made in on-campus student employment opportunities.
3. Campus Infrastructure: The University will promote innovative instructional models toward degree
attainment through optimal use of physical facilities and instructional resources, technology-enhanced instruction, and increased online learning opportunities for both traditional and nontraditional students. These ongoing costs include base and one-time costs related to instructional technology, and operation and maintenance of plant.
4. Campus Life and Student Retention: The University is committed to student success and retention.
Investments were made toward the Student Success Programs, Student Recreation and Wellness, international student, admissions and intercultural programs. With a culturally diverse student population, it is expected that these various student engagement initiatives will provide an improved support structure to assist and retain students throughout their academic careers at Old Dominion University.
The University is responsive to the rapidly changing higher education environment. Old Dominion
University will continue to maintain its solid financial foundation and is well positioned to continue its pursuit of excellence in teaching, research and public service.

Old Dominion University Financial Report 2013 11
Page Left Intentionally Blank

Old Dominion University Financial Report 2013 12
OLD DOMINION UNIVERSITYSTATEMENT OF NET POSITIONAs of June 30, 2013
Old Dominion ComponentUniversity Units
ASSETS
Current assets:Cash and cash equivalents (Note 2) 80,161,801$ 26,052,546$
11,153,622 19,650,901- 5,223,184
Due from the Commonwealth (Note 4) 8,603,676 - Appropriations available 1,037,964 - Travel advances - 54,789Prepaid expenses 750,218 479,716Inventory 694,646 -
1,216,793 - Other assets - 180,179
Total current assets 103,618,720 51,641,315
Noncurrent assets:Restricted cash and cash equivalents (Note 2) 16,686,649 - Endowment investments (Note 3) 8,413,073 - Investments (Notes 2 and 11) 14,873,238 183,637,403 Accounts receivable - 53,088,016 Contributions receivable (Net of allowance for doubtful collections $46,465) (Note 11) - 8,386,490Notes receivable (Net of allowance for doubtful accounts $57,025) 2,062,787 3,405,000 Unamortized bond issuance expense 848,295 - Nondepreciable capital assets (Notes 5 and 11) 61,648,801 22,990,843Capital assets (Notes 5 and 11) 500,119,205 7,151,622
Total noncurrent assets 604,652,048 278,659,374
Total assets 708,270,768 330,300,689
LIABILITIES
Current liabilities:Accounts payable and accrued expenses (Note 6) 37,932,058 11,167,811Due to affiliates - 362,983Unearned revenue 10,358,293 5,552,326Obligations under securities lending (Note 2) 4,603,803 - Deposits held in custody for others 2,563,954 35,279Other liabilities - 11,120,493Line of credit - 5,255,732Long-term liabilities - current portion (Notes 7 and 11) 19,213,557 2,219,915
Total current liabilities 74,671,665 35,714,539
Noncurrent liabilities (Notes 7 and 11) 245,267,328 90,409,073
Total liabilities 319,938,993 126,123,612
NET POSITION
Net invested in capital assets 308,040,175 21,317,333Restricted for:
Nonexpendable: Scholarships and fellowships 4,876,482 - Permanently restricted - 117,360,107Expendable: Scholarships and fellowships 7,056,459 - Research 2,455,605 - Loans 3,486,654 - Capital projects 251,695 - Temporarily restricted - 72,925,121 Departmental uses 10,516,481 - Unrestricted 51,648,224 (7,425,484)
Total net position 388,331,775$ 204,177,077$
The accompanying Notes to Financial Statements are an integral part of this statement.
Accounts receivable (Net of allowance for doubtful accounts $873,694) (Note 4)Contributions receivable (Net of allowance for doubtful collections $226,394) (Note 11)
Notes receivable (Net of allowance for doubtful accounts $21,231)

Old Dominion University Financial Report 2013 13
OLD DOMINION UNIVERSITYSTATEMENT OF REVENUES, EXPENSES AND CHANGES IN NET POSITIONFor the Year Ended June 30, 2013
Old Dominion Component University Units
Operating revenues:Student tuition and fees (Net of scholarship allowances of $24,298,854) 120,046,416$ -$ Gifts and contributions - 14,261,242Federal grants and contracts 4,808,390 - State grants and contracts 300,267 - Indirect cost - 8,833,409Sponsored research - 36,818,820Nongovernmental grants and contracts 2,228,084 - Auxiliary enterprises (Net of scholarship allowances of $15,566,204) 95,981,052 - Other operating revenues 4,580,866 11,951,269
Total operating revenues 227,945,075 71,864,740
Operating expenses:Instruction 135,599,311 2,281,898Research 7,773,116 44,587,144Public service 444,193 - Academic support 42,129,848 5,616,036Student services 14,350,814 - Institutional support 28,345,609 13,244,945Operation and maintenance 26,202,004 8,835Depreciation 22,576,889 215,746Student aid 17,711,195 2,024,445Auxiliary activities 80,774,110 -
Total operating expenses 375,907,089 67,979,049
Operating income (loss) (147,962,014) 3,885,691
Nonoperating revenues (expenses):State appropriations (Note 10) 123,257,164 - Pell grant revenue 27,953,427 - Gifts 9,286,061 - Investment income (Net of investment expenses of $214,526) 2,019,032 15,627,302Other (58,331) - Interest of capital asset-related debt (10,753,341) - Payments to Commonwealth from state appropriations (1,794,540) - Payments to Treasury Board (374,473) - Payments to grantee (1,826,000) - Payments to grantors (1,386) -
Net nonoperating revenues (expenses) 147,707,613 15,627,302
Income before other revenues, (expenses), gains, and (losses) (254,401) 19,512,993
Proceeds from 21st Century bond reimbursement program 17,568,757 - Capital gifts and grants 4,232,884 - Capital appropriations 733,736 - Gain/loss on disposal of plant assets (187,869) - Build America bond interest 10,646 - Contributions to permanent endowments - 1,167,719
Total other revenues, (expenses), gains, and (losses) 22,358,154 1,167,719
Increase in net position 22,103,753 20,680,712
Net position - beginning of year 366,228,022 183,496,365
Net position - end of year 388,331,775$ 204,177,077$
The accompanying Notes to Financial Statements are an integral part of this statement.

Old Dominion University Financial Report 2013 14
OLD DOMINION UNIVERSITYSTATEMENT OF CASH FLOWSFor the Year Ended June 30, 2013
Cash flows from operating activities:Student tuition and fees 139,113,196$ Grants and contracts 6,897,204Auxiliary enterprises 109,535,169Other receipts 4,469,722Payments to employees (171,860,962)Payments for fringe benefits (45,316,952)Payments for services and supplies (78,978,610)Payments for travel (6,353,265)Payments for scholarships and fellowships (64,542,274)Payments for noncapitalized improvements and equipment (14,978,784)Loans issued to students (349,951)Collections of loans from students 451,600
Net cash used by operating activities (121,913,907)
Cash flows from non-capital financing activities:State appropriations 120,828,104Pell grant revenue 27,919,812Gifts and grants for other than capital purposes 9,197,295William D. Ford direct lending receipts 108,278,143William D. Ford direct lending disbursements (108,278,143)PLUS loans receipts 10,679,321PLUS loans disbursements (10,679,321)Refund to the grantor (1,386)Agency receipts 3,291,660Agency payments (3,388,109)
Net cash provided by noncapital financing activities 157,847,376
Cash flows from capital financing activities:Proceeds from capital debt and investments 30,938Proceeds from 21st Century bond reimbursement program 14,314,366Capital gifts 3,708,235Purchase of capital assets (26,623,324)Payment to grantee (1,826,000)Principal paid on capital debt, leases and installments (13,262,747)Interest paid on capital debt, leases and installments (11,332,643)
Net cash used by capital financing activities (34,991,175)
Cash flows from investing activities:Interest on investments and cash management 958,991
Net cash provided by investing activities 958,991
Net change in cash 1,901,285
Cash and cash equivalents - beginning of the year 91,993,729Less: Securities lending - Treasurer of Virginia (1,414,840)
Cash and cash equivalents - beginning of the year 90,578,889
Cash and cash equivalents - end of the year 92,480,174$

Old Dominion University Financial Report 2013 15
RECONCILIATION OF STATEMENT OF CASH FLOWS, STATEMENT OF NET POSITION:
Statement of Net PositionCash and cash equivalents 96,848,450$ Less: Securities lending - Treasurer of Virginia (4,368,276)
Net cash and cash equivalent 92,480,174$
RECONCILIATION OF NET OPERATING (LOSS) TO NET CASHUSED BY OPERATING ACTIVITIES:Operating (loss) (147,962,014)$ Adjustments to reconcile net income/(loss) to net cash
used by operating activitiesDepreciation expense 22,576,889Changes in assets and liabilities:
Receivables, net (3,723,572)Prepaid expenses (414,242)Inventory (19,935)Accounts payable and accrued expenses 6,236,467Deposits 130,581Unearned revenue 1,261,919
Net cash used by operating activities (121,913,907)$
Non-cash investing, capital and financing activities Security lending 4,368,276$ Capitalization of interest expense 32,750$ Amortization of bond premium 946,875$ Change in receivables related to nonoperating income 138,585$
The accompanying Notes to Financial Statements are an integral part of this statement.

Old Dominion University Financial Report 2013 16
Page Left Intentionally Blank

Old Dominion University Financial Report 2013 17
NOTES TO FINANCIAL STATEMENTS FOR THE YEAR ENDED JUNE 30, 2013
NOTE 1: SUMMARY OF SIGNIFICANT ACCOUNTING POLICIES
Reporting Entity
Old Dominion University (the University) is a comprehensive university that is part of the Commonwealth of Virginia’s statewide system of public higher education. The University’s Board of Visitors, appointed by the Governor, is responsible for overseeing governance of the University. A separate report is prepared for the Commonwealth which includes all agencies, higher education institutions, boards, commissions, and authorities over which the Commonwealth exercises or has the ability to exercise oversight authority. The University is a component unit of the Commonwealth of Virginia and is included in the basic financial statements of the Commonwealth. The University includes all entities over which the University exercises or has the ability to exercise oversight authority for financial reporting purposes. Under Governmental Accounting Standards Board (GASB) Statement 61 standards, the Old Dominion University Educational and Real Estate Foundations, the Old Dominion Athletic Foundation, and the Old Dominion University Research Foundation (the Foundations) are included as component units of the University. These foundations are legally separate and tax-exempt organizations formed to promote the achievements and further the aims and purposes of the University. The Educational and Real Estate Foundations receive, administer, and distribute gifts for the furtherance of educational activities and objectives of the University. The Athletic Foundation receives, administers, and distributes gifts for the furtherance of educational and athletic activities of the University. For additional information on these foundations, contact Foundation Offices at 4417 Monarch Way, 4th Floor, Norfolk, Virginia 23529. The Educational and Real Estate and Athletic Foundations have adopted December 31 as their year-end. All amounts reflected are as of December 31, 2012. The Research Foundation coordinates and accounts for substantially all grants and contracts awarded for research at the University. For additional information contact the Research Foundation at 4111 Monarch Way, Suite 204, Norfolk, Virginia 23508. Although the University does not control the timing or amount of receipts from the Foundations, the majority of resources, or income thereon, that the Foundations hold and invest are restricted to the activities of the University by the donors. Because these restricted resources held by the Foundations can only be used by or for the benefit of the University, the Foundations are considered component units of the University and are discretely presented in the financial statements. Basis of Presentation
The financial statements have been prepared in accordance with GASB Statement 34, Basic Financial Statements – and Management’s Discussion and Analysis – for State and Local Governments, GASB Statement 35, Basic Financial Statements - and Management’s Discussion and Analysis - for Public College and Universities and GASB Statement 63, Financial Reporting of Deferred Outflows of Resources, Deferred Inflows of Resources, and Net Position. The financial statement presentation required by GASB Statements 34 and 35 provides a comprehensive entity-wide look at the University’s financial activities. GASB Statements 34, 35 and 63 standards are designed to provide information that responds to the needs of three groups of primary users of the general purpose external financial reports: the citizenry, legislative and oversight bodies, and investors and creditors. Under this guidance, the University is required to include a management’s discussions and analysis (MD&A), basic financial statements, and notes to the financial statements.

Old Dominion University Financial Report 2013 18
The Foundations are private, nonprofit organizations, and as such the financial statement presentation follows the recommendation of accounting literature related to nonprofits. As a result, certain revenue recognition criteria and presentation features are different from GASB revenue recognition and presentation features. No modifications have been made to the Foundations’ financial information in the University’s financial reporting entity for these differences. Basis of Accounting
For reporting purposes, the University is considered a special-purpose government engaged only in business-type activities. Accordingly, its statements have been presented using the economic resource measurement focus and the accrual basis of accounting; whereby, revenues are recognized when earned and expenses are recorded when an obligation has been incurred, regardless of the timing of related cash flows. All intra-agency transactions have been eliminated. Cash and Cash Equivalents
In accordance with the GASB Statement 9, Reporting Cash Flows of Proprietary and Nonexpendable Trust Funds and Governmental Entities That Use Proprietary Fund Accounting, definition, cash and cash equivalents consist of cash on hand, money market funds, and temporary highly liquid investments with an original maturity of three months or less. Investments
The University accounts for its investments that are purchased at fair value. Investments received by gift are carried at fair value at date of acquisition in accordance with GASB Statement 31, Accounting and Financial Reporting for Certain Investments and for External Investment Pools as modified by GASB Statement 59. All investment income, including changes in the fair value of investments (unrealized gains and losses), is reported as nonoperating revenue in the Statement of Revenues, Expenses and Changes in Net Position. Receivables
Receivables consist of tuition and fee charges to students and auxiliary enterprises’ sales and services. Receivables also include amounts due from the federal, state, and local governments or private sources in connection with reimbursement of allowable expenditures made pursuant to grants and contracts. Receivables are recorded net of estimated uncollectible amounts. Prepaid Expenses
The University’s prepaid expenses include memberships and travel deposits for fiscal year 2014 that were paid in advance as of June 30, 2013. Inventories
Inventories are valued at the lower of cost (generally determined on the first-in, first-out method) or market, and consist primarily of expendable supplies held for consumption. Noncurrent Cash and Investments
Cash and investments that are externally restricted to make debt service payments, reserve funds, or purchase or construct capital and other noncurrent assets, are classified as noncurrent assets in the Statement of Net Position.
Old Dominion University Financial Report 2013 19
Capital Assets
Capital assets include land, buildings and other improvements, library materials, equipment, intangibles, and infrastructure assets such as campus lighting. Capital assets generally are defined by the University as assets with an initial cost of $5,000 or more and an estimated useful life in excess of one year, including assets acquired under the Higher Education Equipment Trust Fund. Other assets are recorded at actual cost or estimated historical cost if purchased or constructed. Library materials are valued using published average prices for library acquisitions. Donated capital assets are recorded at the estimated fair market value at the date of donation, with the exception of intra-entity capital asset donations which, in accordance with GASB Statement 48, Sales and Pledges of Receivables and Future Revenues and Intra-Entity Transfers of Assets and Future Revenues, are recorded at the carrying value of the asset on the transferor’s books as of the date of transfer. Expenses for major capital assets and improvements (construction in progress) are capitalized as projects are constructed. Interest expense of $32,750 relating to construction is capitalized net of interest income earned on resources set aside for this purpose for the year ended June 30, 2013. The costs of normal maintenance and repairs that do not add to an asset’s value or materially extend its useful life are not capitalized. Certain maintenance and replacement reserves have been established to fund costs relating to residences and other auxiliary activities. Depreciation is computed using the straight-line method over the estimated useful life of the asset and is not allocated to the functional expense categories. Useful lives by asset categories are listed below: Buildings 5-50 years Other improvements and infrastructure 4-30 years Equipment 2-25 years Library materials 5 years Intangible assets 5-25 years Accrued Compensated Absences
Accrued leave reflected in the accompanying financial statements represents the amount of annual, sick, and compensatory leave earned but not taken as of June 30, 2013. The amount reflects all earned vacation, sick, and compensatory leave payable under the Commonwealth of Virginia’s leave pay-out policy and the University’s faculty administrators’ leave pay-out policy upon employment termination. The applicable share of employer related taxes payable on the eventual termination payments is also included. Unearned Revenue
Unearned revenue primarily includes amounts received for tuition and fees and certain auxiliary activities prior to the end of the fiscal year, but related to the period after June 30, 2013. Noncurrent Liabilities
Noncurrent liabilities include principal amounts of bonds payable, notes payable, and capital lease obligations with contractual maturities greater than one year as well as estimated amounts for accrued compensated absences that will not be paid within the next fiscal year. Discounts, Premiums, and Bond Issuance Costs
Bonds payable on the Statement of Net Position are reported net of related discounts and premiums, which are expensed over the life of the bond. Similarly, bond issuance costs are reported as a noncurrent asset that is amortized over the life of the bond on a straight-line basis.

Old Dominion University Financial Report 2013 20
Net Position
GASB Statement 34 and 63 requires that the Statement of Net Position report all assets, deferred outflows of resources, liabilities, deferred inflows of resources, and net position. Net position is the difference between all other elements in a statement of net position and should be displayed in three components. Accordingly, the University’s net position is classified as follows: Net Investment in Capital Assets consists of total investments in capital assets, net accumulated
depreciation and outstanding debt obligations. Restricted Net Position:
Nonexpendable includes endowment and similar type assets whose use is limited by donors or other outside sources and as a condition of the gift, the principal is to be maintained in perpetuity.
Expendable represents funds that have been received for specific purposes and the University is legally or contractually obligated to spend the resources in accordance with restrictions imposed by external parties.
Unrestricted Net Position represents resources derived from student tuition and fees, state appropriations, unrestricted gifts, interest income, and sales and services of educational departments and auxiliary enterprises.
Classification of Revenues and Expenses
Operating revenues include activities that have the characteristics of exchange transactions, such as: (1) student tuition and fees, net of scholarship allowances; (2) sales and services of auxiliary enterprises, net of scholarship allowances; and (3) federal, state, and nongovernmental grants and contracts. Nonoperating revenues include activities that have the characteristics of nonexchange transactions, such as gifts and other revenue sources that are defined as nonoperating revenues by GASB Statement 9, Reporting Cash Flows of Proprietary and Nonexpendable Trust Funds and Governmental Entities That Use Proprietary Fund Accounting, and GASB Statement 34, such as state appropriations, investment, and interest income. Nonoperating expenses primarily include interest on debt related to the purchase of capital assets and losses on the disposal of capital assets. All other expenses are classified as operating expenses. When an expense is incurred that can be paid using either restricted or unrestricted resources, the University’s policy is to first apply the expense toward restricted resources and then toward unrestricted. Restricted funds remain classified as such until restrictions have been satisfied. Scholarship Allowances
Student tuition and fee revenues and certain other revenues from charges to students are reported net of scholarship allowances in the Statement of Revenues, Expenses and Changes in Net Position. Scholarship allowances are the differences between the actual charge for goods and services provided by the University and the amounts that are paid by students and/or third parties on the students’ behalf. Financial aid to students is reported in the financial statements under the alternative method as prescribed by the National Association of College and University Business Officers (NACUBO). The alternative method is a simple proportionality algorithm that computes scholarship discounts and allowances on a university-wide basis by allocating the cash payments to students, excluding payments for services, on the ratio of total aid to the aid not considered to be third party aid. Student financial assistance grants and other federal, state, or nongovernmental programs are recorded as either operating or nonoperating revenues in the accompanying Statement of Revenues, Expenses and Changes in Net Position. To the extent that revenues from these programs are used to satisfy tuition, fees, and other charges, the University has recorded a scholarship allowance.

Old Dominion University Financial Report 2013 21
Federal Financial Assistance Programs
The University participates in federally funded Pell Grants, Supplemental Educational Opportunity Grants (SEOG), Federal Work-Study, Perkins Loans, Stafford Loans, Parent Loans for Undergraduate Students (PLUS), and Teacher Education Assistance for College and Higher Education grants (TEACH). Federal programs are audited in accordance with generally accepted governmental auditing standards.

Old Dominion University Financial Report 2013 22
NOTE 2: CASH AND CASH EQUIVALENTS AND INVESTMENTS
The following information is provided with respect to the University’s cash, cash equivalents, and investments as of June 30, 2013. The following risk disclosures are required by GASB Statement 40, Deposit and Investment Risk Disclosures: Custodial Credit Risk (Category 3 deposits and investments) - The custodial credit risk for deposits is the risk that, in the event of the failure of a depository financial institution, a government will not be able to recover deposits or will not be able to recover collateral securities that are in the possession of an outside party. The custodial credit risk for investments is the risk that, in the event of the failure of the counterparty to a transaction, a government will not be able to recover the value of investment or collateral securities that are in the possession of an outside party. The University is not exposed to custodial credit risk at June 30, 2013. Credit risk - The risk that an issuer or other counterparty to an investment will not fulfill its obligations. GASB Statement 40 requires the disclosure of the credit quality rating on any investments subject to credit risk. The University does not have a credit rate risk policy. The University’s portfolio can be characterized as having minimal exposure to credit risk as indicated by the majority of credit ratings being A- or better.
Concentration of credit risk - The risk of loss attributed to the magnitude of a government’s investment in a single issuer. GASB Statement 40 requires disclosure of any issuer with more than five percent of total investments. The University does not have a concentration of credit risk policy. Interest rate risk - The risk that changes in interest rates will adversely affect the fair value of an investment. GASB Statement 40 requires disclosure of maturities for any investments subject to interest rate risk. None of the University’s investments are considered highly sensitive to changes in interest rates. The University does not have an interest rate risk policy. Interest rate information was organized by investment type and amount using segmented time distribution method and weighted average maturity. Foreign currency risk - The risk that changes in exchange rates will adversely affect the fair value of an investment or a deposit. The University has no foreign deposits but does have foreign investments for June 30, 2013. The foreign investments are traded in U.S. dollars and the risk is considered to be low. The University does not have a foreign currency risk policy.

Old Dominion University Financial Report 2013 23
Cash and Cash Equivalents
Pursuant to Section 2.2-1800, et seq., Code of Virginia, all state funds of the University are maintained by the Treasurer of Virginia who is responsible for the collection, disbursement, custody, and investment of state funds. Cash deposits held by the University are maintained in accounts that are collateralized in accordance with the Virginia Security for Public Deposits Act, Section 2.2-4400, et seq., Code of Virginia. Cash and cash equivalents represent cash with the treasurer, cash on hand, certificates of deposit and temporary investments with original maturities of 90 days or less, and cash equivalents with the Virginia State Non-Arbitrage Program (SNAP). SNAP is an open-end management investment company registered with the Securities and Exchange Commission (SEC). Cash and cash equivalents reporting requirements are defined by GASB Statement 9, Reporting Cash Flows of Proprietary and Nonexpendable Trust Funds and Governmental Entities that Use Proprietary Fund Accounting.
Deposits
At June 30, 2013, the carrying value of the University’s deposit with banks was $44,315,943 and bank balance was $43,894,034. The carrying value of deposits differs from the bank balance because of reconciling items such as deposits in transit and outstanding checks. Deposits with banks are covered by Federal depository insurance or collateralized in accordance with the Virginia Security for Public Deposits Act. Under the Act, banks holding deposits in excess of the amounts insured by FDIC must pledge collateral in the amount of 50% excess deposits to a collateral pool in the name of the State Treasury Board. At June 30, 2013, the University’s deposits were not exposed to custodial credit risk.
Investments
The investment policy of the University is established by the Board of Visitors and monitored by the Board’s Administration and Finance Committee. Authorized investments are set forth in the Investment of Public Funds Act, Section 2.2-4500 through 2.2-4516, et seq., Code of Virginia. Authorized investments include: U.S. Treasury and agency securities, municipal securities, corporate debt securities of domestic corporations, agency mortgage-backed securities, negotiable certificates of deposit, repurchase agreements, common and preferred equities, equity in land, and mutual and money market funds. Investments fall into two groups: short- and long-term. Short-term investments have an original maturity of over 90 days but less than or equal to one year. Long-term investments have an original maturity greater than one year.
Security Lending Transactions
The University participates in the State Treasury’s securities lending program. Collateral held for security lending transactions of $4,603,803 represents the University’s allocated share of cash collateral received and reinvested and securities received by the State Treasury securities lending program. Information related to the credit risk of these investments and the State Treasury’s securities lending program is available on a statewide level in the Commonwealth of Virginia’s Comprehensive Annual Financial Report (CAFR). The Commonwealth’s policy is to record unrealized gains and losses in the General Fund in the Commonwealth’s basic financial statements. When gains or losses are realized, the actual gains and losses are recorded by the affected agencies.

Old Dominion University Financial Report 2013 24
Credit & Concentration of Credit Risks
Type of Investment
Percentage of
InvestmentsFair
Value
Standard & Poor's Credit Quality Rating
CASH EQUIVALENTS:Mutual/Money Market Funds
BB&T/Wachovia Securities 0.14% $ 37,345 SNAP 0.05% 14,427 AAAmSecurities Lending 15.77% 4,368,276Total Cash Equivalents 4,420,048
INVESTMENTS:Mutual/Money Market
Intermediate Term Fund 22.74% 6,299,707 AA-
U. S. Treasury & Agency Securities*U. S. Treasury Bond DTD 0.56% 154,433 NRU. S. Treasury Note DTD 0.67% 184,204 NR
Corporate Bonds AFLAC Inc DTD 0.09% 25,562 A- AT&T INC DTD 0.07% 20,609 A- ACE INA HLDG Inc DTD 0.08% 22,574 A Bear Stearns Company 0.09% 23,815 A
Berkshire Hathaway Inc 0.08% 20,803 AABlackrock Inc DTD 0.08% 20,807 A+Caterpillar Financial SE DTD 0.07% 18,711 AConocophillips DTD 0.08% 23,429 ADuke Energy Carolinas DTD 0.06% 17,065 AGeneral Electric Capital Corporation DTD 0.08% 21,939 AA Goldman Sachs Group Incorporated DTD 0.08% 21,696 A-IBM Corporation DTD 0.09% 25,449 AA-Metlife Incorporated DTD 0.08% 22,891 A-Occidental Petroleum Corp DTD 0.07% 19,984 AOracle Corp DTD 0.08% 22,869 A+PNC Funding Corp DTD 0.08% 20,815 A-Pepsico INC DTD 0.07% 19,675 A-Phillip Morris International Incorporated DTD 0.08% 23,057 ATarget Corp DTD 0.08% 22,670 A+US Bancorp DTD 0.09% 24,923 A+Virginia Elec& Power CO DTD 0.07% 19,735 A-Wachovia Corporation DTD 0.08% 22,479 A
Municipal SecuritiesBaltimore Maryland Ser B Go DTD 0.15% 40,619 AA-California State Taxable Var Purp 3 Go DTD 0.07% 20,700 ADallas County Tex Hosp Dist Build America Bonds Ser B Go DTD 0.14% 39,881 AAAEastern Iowa Community College District 0.09% 26,053 NRNew York NY Build America Bonds 0.18% 49,374 AANew York Dorm Auth St Pers Income Tax Rev Taxable Gen Purp Ser B DTD 0.11% 31,370 AAANorth Tex St Muni Wtr Dist Wtr Sys Rev Build America Bonds Direct Payment 0.16% 45,033 AAAStratford CT Ref Taxable Pension 0.17% 47,558 AA-
Old Dominion University Financial Report 2013 25
Type of Investment
Percentage of
InvestmentsFair
Value
Standard & Poor's Credit Quality Rating
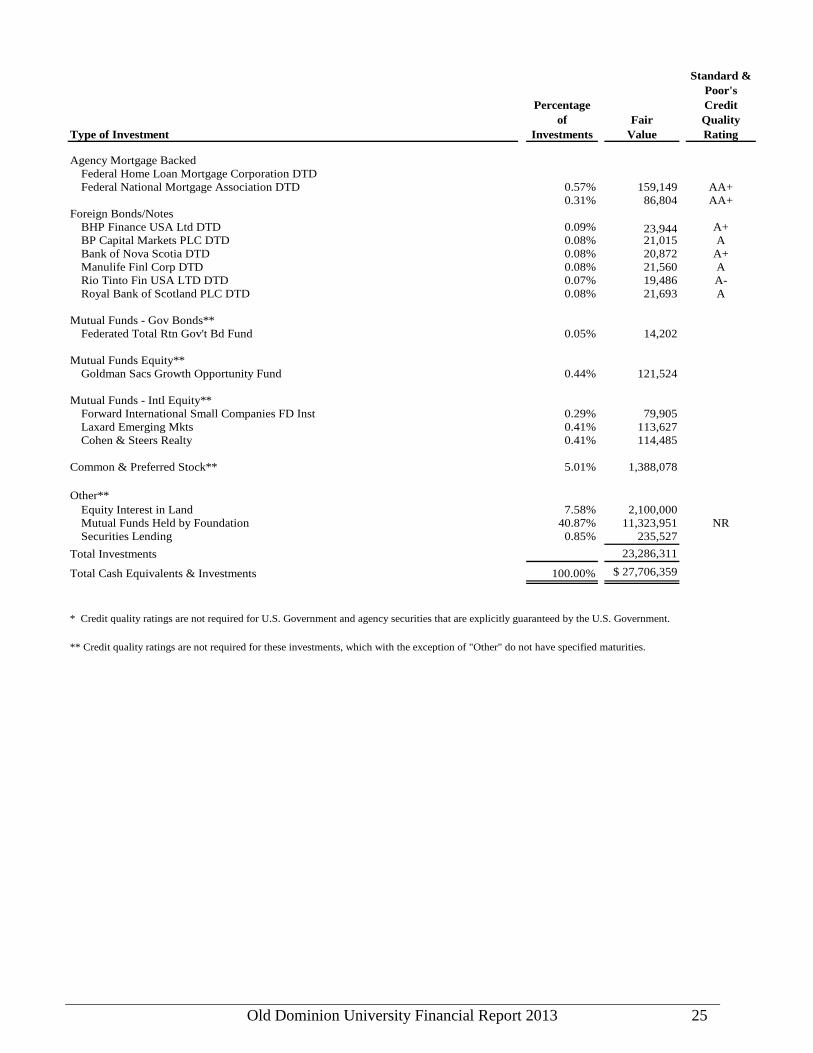
Agency Mortgage BackedFederal Home Loan Mortgage Corporation DTDFederal National Mortgage Association DTD 0.57% 159,149 AA+
0.31% 86,804 AA+Foreign Bonds/Notes
BHP Finance USA Ltd DTD 0.09% 23,944 A+BP Capital Markets PLC DTD 0.08% 21,015 ABank of Nova Scotia DTD 0.08% 20,872 A+Manulife Finl Corp DTD 0.08% 21,560 ARio Tinto Fin USA LTD DTD 0.07% 19,486 A-Royal Bank of Scotland PLC DTD 0.08% 21,693 A
Mutual Funds - Gov Bonds**Federated Total Rtn Gov't Bd Fund 0.05% 14,202
Mutual Funds Equity**Goldman Sacs Growth Opportunity Fund 0.44% 121,524
Mutual Funds - Intl Equity**Forward International Small Companies FD Inst 0.29% 79,905Laxard Emerging Mkts 0.41% 113,627Cohen & Steers Realty 0.41% 114,485
Common & Preferred Stock** 5.01% 1,388,078
Other**Equity Interest in Land 7.58% 2,100,000Mutual Funds Held by Foundation 40.87% 11,323,951 NRSecurities Lending 0.85% 235,527
Total Investments 23,286,311
Total Cash Equivalents & Investments 100.00% $ 27,706,359
* Credit quality ratings are not required for U.S. Government and agency securities that are explicitly guaranteed by the U.S. Government.
** Credit quality ratings are not required for these investments, which with the exception of "Other" do not have specified maturities.

Old Dominion University Financial Report 2013 26
Interest Rate Risk: Maturities
Type of Investment0-3
Months4-12
Months1-5
Years6-10
Years
Cash Equivalents:Mutual/Money Market Funds BB&T/Wachovia Securities $ 37,345 $ - $ - $ - SNAP 14,427Securities Lending held with Treasurer 4,368,276Total Cash Equivalents 4,420,048
Investments:Mutual/Money Market Intermediate Term Fund 6,299,707
U. S. Treasury & Agency Securities U. S. Treasury Bond DTD 154,433 U. S. Treasury Note DTD 15,117 169,087
Corporate Bonds AFLAC Inc DTD 25,562 AT&T INC DTD 20,609 ACE INA HLDG Inc DTD 22,574 Bear Stearns Company 23,815
Berkshire Hathaway Inc 20,803Blackrock Inc DTD 20,807Caterpillar Financial SE DTD 18,711Conocophillips DTD 23,429Duke Energy Carolinas DTD 17,065General Electric Capital Corporation DTD 21,939Goldman Sachs Group Incorporated DTD 21,696IBM Corporation DTD 25,449Metlife Incorporated DTD 22,891Occidental Petroleum Corp DTD 19,984 Oracle Corp DTD 22,869 PNC Funding Corp DTD 20,815 Pepsico INC DTD 19,675 Phillip Morris International Incorporated DTD 23,057 Target Corp DTD 22,670 US Bancorp DTD 24,923 Virginia Elec& Power CO DTD 19,735 Wachovia Corporation DTD 22,479
Old Dominion University Financial Report 2013 27
Type of Investment0-3
Months4-12
Months1-5
Years6-10
Years
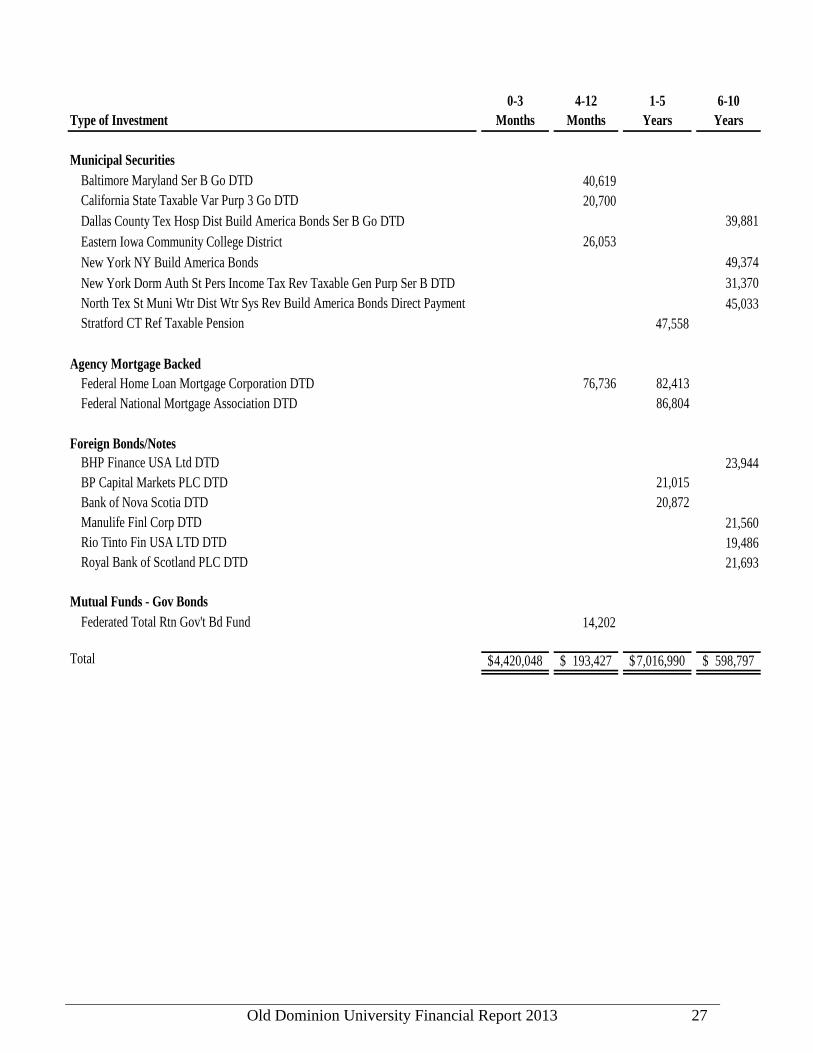
Municipal SecuritiesBaltimore Maryland Ser B Go DTD 40,619California State Taxable Var Purp 3 Go DTD 20,700Dallas County Tex Hosp Dist Build America Bonds Ser B Go DTD 39,881Eastern Iowa Community College District 26,053New York NY Build America Bonds 49,374New York Dorm Auth St Pers Income Tax Rev Taxable Gen Purp Ser B DTD 31,370North Tex St Muni Wtr Dist Wtr Sys Rev Build America Bonds Direct Payment 45,033Stratford CT Ref Taxable Pension 47,558
Agency Mortgage BackedFederal Home Loan Mortgage Corporation DTD 76,736 82,413Federal National Mortgage Association DTD 86,804
Foreign Bonds/NotesBHP Finance USA Ltd DTD 23,944BP Capital Markets PLC DTD 21,015Bank of Nova Scotia DTD 20,872Manulife Finl Corp DTD 21,560Rio Tinto Fin USA LTD DTD 19,486Royal Bank of Scotland PLC DTD 21,693
Mutual Funds - Gov BondsFederated Total Rtn Gov't Bd Fund 14,202
Total 4,420,048$ 193,427$ 7,016,990$ 598,797$

Old Dominion University Financial Report 2013 28
NOTE 3: DONOR RESTRICTED ENDOWMENT
Investments of the University’s endowment funds are pooled and consist primarily of gifts and bequests, the use of which is restricted by donor imposed limitations. The Uniform Prudent Management of Institutional Funds Act, Code of Virginia Section 55-268.1 et. seq., permits the spending policy adopted by the Board of Visitors to appropriate an amount of realized and unrealized endowment appreciation as the Board determines to be prudent. In determining the amount of appreciation to appropriate, the Board is required by the Act to consider such factors as long-term and short-term needs of the institution, present and anticipated financial requirements, expected total return on investments, price level trends, and general economic conditions. The amount available for spending is determined by applying a predetermined rate to the twelve-quarter moving average of the market value of each endowment for the period ending on the previous September 30. For fiscal year 2013, the payout percentage was 4 ½ percent. The payout percentage is reviewed and adjusted annually as deemed prudent. At June 30, 2013, net appreciation of $449,553 is available to be spent, which is reported in the Statement of Net Position as Restricted for Expendable Scholarship and Fellowships. NOTE 4: ACCOUNTS RECEIVABLE
A. Accounts receivable consisted of the following at June 30, 2013:
Student tuition and fees 6,712,588$ Auxiliary enterprises 1,885,091 Federal, state, and nongovernmental grants and contracts 2,881,581 Other activities 548,056
Gross receivables 12,027,316 Less allowance for doubtful accounts (873,694)
Net accounts receivable 11,153,622$
B. Due from the Commonwealth consisted of the following at June 30, 2013:
Interest/rebate allocation 563,873$ Equipment trust fund reimbursement 3,430,022 Virginia College Building Authority 21st Century Bonds 4,609,781
Total due from Commonwealth of Virginia 8,603,676$

Old Dominion University Financial Report 2013 29
NOTE 5: CAPITAL ASSETS
A summary of changes in the various capital asset categories for the year ending June 30, 2013 is presented as follows:
Beginning Balance Additions Reductions
Ending Balance
Nondepreciable capital assets:Land 31,064,762$ -$ -$ 31,064,762$ Construction in progress 14,571,703 17,043,803 1,031,467 30,584,039
Total nondepreciable capital assets 45,636,465 17,043,803 1,031,467 61,648,801
Depreciable capital assets:Buildings 675,601,803 756,139 - 676,357,942 Infrastructure 2,015,561 25,686 - 2,041,247 Equipment ** 69,801,231 8,876,394 2,699,075 75,978,550 Improvements other than building 11,896,708 412,884 - 12,309,592 Library books 69,474,449 2,094,104 43,673 71,524,880 Intangible assets 2,445,453 420,165 132,274 2,733,344
Total depreciable capital assets 831,235,205 12,585,372 2,875,022 840,945,555
Less accumulated depreciation for:Buildings 202,192,464 13,070,179 - 215,262,643 Infrastructure 1,362,188 27,382 - 1,389,570 Equipment ** 45,394,299 5,422,755 2,542,520 48,274,534 Improvements other than building 6,644,904 726,464 - 7,371,368 Library books 63,482,942 3,159,687 43,672 66,598,957 Intangible assets 1,859,817 170,422 100,961 1,929,278
Total accumulated depreciation 320,936,614 22,576,889 2,687,153 340,826,350 Depreciable capital assets, net 510,298,591 (9,991,517) 187,869 500,119,205 Total capital assets, net 555,935,056$ 7,052,286$ 1,219,336$ 561,768,006$
** - Beginning balances were realigned with no impact to total capital assets net beginning balance. NOTE 6: ACCOUNTS PAYABLE AND ACCRUED EXPENSES
Accounts payable and accrued expenses consisted of the following at June 30, 2013:
Employee salaries, wages, and fringe benefits payable 17,374,712$ Retainage payable 625,569 Interest payable 2,142,604 Vendors and suppliers accounts payable 17,789,173 Current liabilities - accounts payable and accrued expenses 37,932,058$

Old Dominion University Financial Report 2013 30
NOTE 7: NONCURRENT LIABILITIES
The University’s noncurrent liabilities consist of long-term debt (further described in Note 8) and other noncurrent liabilities. A summary of changes in noncurrent liabilities for the year ending June 30, 2013 is presented as follows:
Beginning Balance Additions Reductions
Ending Balance Current Portion
Long-term debt:General obligations bonds 64,038,349$ 11,616,443$ 14,810,398$ 60,844,394$ 2,873,338$ Revenue bonds 134,807,784 - 8,159,891 126,647,893 8,075,000 Installment purchases 2,233,867 - 315,986 1,917,881 308,772 Capital leases 69,137,724 - 2,102,069 67,035,655 2,394,385
Total long-term debt 270,217,724 11,616,443 25,388,344 256,445,823 13,651,495 Accrued compensated absences 7,487,662 6,608,991 6,551,318 7,545,335 5,501,562 Federal loan program contributions 39,293 87,434 - 126,727 - Other liabilities 423,500 - 60,500 363,000 60,500
Total long-term liabilities 278,168,179$ 18,312,868$ 32,000,162$ 264,480,885$ 19,213,557$
NOTE 8: LONG-TERM DEBT
The University has issued two categories of bonds pursuant to Section 9 of Article X of the Constitution of Virginia. Section 9(c) bonds are general obligation bonds issued by the Commonwealth of Virginia on behalf of the University which are secured by the net revenues of the completed project and the full faith, credit, and taxing power of the Commonwealth of Virginia. Section 9(d) bonds are revenue bonds, which are limited obligations of the University payable exclusively from pledged general revenues and are not debt of the Commonwealth of Virginia, legally, morally, or otherwise. Pledged General Fund revenues include General Fund appropriations, tuition and fees, auxiliary enterprise revenues, and other revenues not required by law to be used for another purpose. The University issued 9(d) bonds directly through underwriters and also participates in the Public Higher Education Financing Program (Pooled Bond Program) created by the Virginia General Assembly in 1996. Through the Pooled Bond Program, the Virginia College Building Authority (VCBA) also issues 9(d) bonds and uses the proceeds to purchase debt obligations (notes) of the University and various other institutions of higher education. The University’s general revenue, not otherwise obligated, also secures these notes.
Description Interest Rates Maturity 2013General obligation bonds: Dormitory, Series 2005 3.50% - 5.00% 2025 420,000$ Dormitory, Series 2006B 4.00% - 5.00% 2026 1,155,000 Dormitory, Series 2007B 4.00% - 5.00% 2027 5,890,000 Dormitory, Series 2008B 3.00% - 5.00% 2028 33,235,000 Dormitory, Series 2009C 3.00% - 5.00% 2022 1,319,293 Dormitory, Series 2009D 2.50% - 4.50% 2022 1,625,000 Dormitory, Series 2009D 2.50% - 5.00% 2022 2,465,000 Dormitory, Series 2010A 2.00% - 5.00% 2030 1,770,000 Dormitory, Series 2012A 3.00% - 5.00% 2024 654,765 Dormitory, Series 2013B 4.00% - 5.00% 2025 570,047 Dormitory, Series 2013B 4.00% - 5.00% 2026 2,760,934 Dormitory, Series 2013B 4.00% - 5.00% 2025 6,344,322 Total general obligation bonds 58,209,361

Old Dominion University Financial Report 2013 31
Description Interest Rates Maturity 2013Revenue bonds:
Classrooms, Series 2004B 3.00% - 5.00% 2017 2,725,000Classrooms, Series 2004B 3.00% - 5.00% 2020 425,000Classrooms, Series 2007B 4.00% - 4.25% 2018 797,136Recreation, Series 2004B 3.00% - 5.00% 2017 3,505,000Recreation, Series 2004B 3.00% - 5.00% 2020 480,000Recreation, Series 2007B 4.00% - 4.25% 2018 413,781Recreation, Series 2007B 4.00% - 4.50% 2020 6,718,256Recreation, Series 2010B 2.00% - 5.00% 2020 630,000Recreation, Series 2010B 2.00% - 5.00% 2021 8,465,000Parking, Series 2003A 2.00% - 5.00% 2024 90,000Parking, Series 2004A 3.00% - 5.00% 2025 350,000Parking, Series 2004B 3.00% - 5.00% 2017 1,695,000Parking, Series 2004B 3.00% - 5.00% 2020 690,000Parking, Series 2007A 4.50% - 5.00% 2028 7,095,000Parking, Series 2007B 4.00% - 4.25% 2018 149,083Parking, Series 2007B 4.00% - 4.50% 2020 2,551,744Parking, Series 2009A 2.10% - 5.00% 2029 4,750,000Parking, Series 2010B 2.00% - 5.00% 2020 360,000Parking, Series 2010B 2.00% - 5.00% 2021 2,595,000Parking, Series 2010B 2.00% - 5.00% 2020 450,000Parking, Series 2012A 5.00% 2023 650,000Parking, Series 2012A 3.00% - 5.00% 2024 2,260,000Athletic Fac. Exp., Series 2004A 3.00% - 5.00% 2025 205,000Athletic Fac. Exp., Series 2005A 3.50% - 5.00% 2026 905,000Athletic Fac. Exp., Series 2006A 3.00% - 5.00% 2027 780,000Athletic Fac. Exp., Series 2007A 4.50% - 5.00% 2028 400,000Athletic Fac. Exp., Series 2012A 3.00% - 5.00% 2024 1,330,000Athletic Fac. Exp., Series 2012A 3.00% - 5.00% 2024 1,645,000H&PE Renovation, Series 2004A 3.00% - 5.00% 2025 175,000H&PE Renovation, Series 2005A 3.50% - 5.00% 2026 910,000H&PE Renovation, Series 2007A 4.50% - 5.00% 2028 13,110,000H&PE Renovation, Series 2012A 3.00% - 5.00% 2024 1,110,000H&PE Renovation, Series 2012A 3.00% - 5.00% 2024 1,645,000Indoor Tennis Court, Series 2004A 3.00% - 5.00% 2025 130,000Indoor Tennis Court, Series 2005A 3.50% - 5.00% 2026 695,000Indoor Tennis Court, Series 2006A 3.00% - 5.00% 2027 185,000Indoor Tennis Court, Series 2007A 4.50% - 5.00% 2028 210,000Indoor Tennis Court, Series 2012A 3.00% - 5.00% 2024 820,000Indoor Tennis Court, Series 2012A 3.00% - 5.00% 2024 1,280,000Dormitory, Series 2005A 3.50% - 5.00% 2026 5,875,000Dormitory, Series 2012A 3.00% - 5.00% 2024 10,820,000Powhatan Sports Ctr, Series 2007A 4.50% - 5.00% 2028 5,405,000Powhatan Sports Ctr, Series 2009A 2.10% - 5.00% 2029 24,105,000Powhatan Sports Ctr, Series 2010A 2.00% - 5.50% 2030 860,000Webb Center Expansion, Series 2009B 2.00% - 5.00% 2029 650,000
Total revenue bonds 121,095,000

Old Dominion University Financial Report 2013 32
Description Interest Rates Maturity 2013
Installment purchases 4.23% 2023 1,917,881Capital leases Various 2011-41 67,035,655
Total bond, notes, installment purchases, and leases 248,257,897
Amortize bond premium, general obligation bonds 3,844,461Amortize bond premium, revenue bonds 8,610,099Deferred loss on early retirement of debt (4,266,634)
Total bond, notes, installment purchases, leases, bond premium, and deferred loss 256,445,823$
Long-term debt matures as follows:
Principal Interest2014 13,651,495$ 11,113,564$ 2015 14,202,705 10,440,300 2016 14,698,887 9,761,519 2017 15,350,605 9,061,273 2018 16,160,319 8,301,152
2019-2023 78,765,806 30,751,404 2024-2028 70,591,685 13,498,408 2029-2033 23,658,546 2,645,784 2034-2038 866,553 201,548 2039-2043 311,296 20,881
Total 248,257,897$ 95,795,833$
A. Equipment Trust Fund Program
The Equipment Trust Fund (ETF) program was established to provide state-supported institutions of higher education bond proceeds for financing the acquisition and replacement of instructional and research equipment. The Virginia College Building Authority (VCBA) manages the program. The VCBA issues bonds and uses the proceeds to reimburse the University and other institutions of higher education for equipment purchased. Financing agreements for ETF state that the University owns the equipment from the date of purchase. The Statement of Net Position line “Due from the Commonwealth” includes $3,430,022 for equipment purchased by the University that was not reimbursed by the VCBA at year-end.
B. Defeasance of Debt
In March 2013, the Commonwealth of Virginia issued $217,760,000 in General Obligation Refunding Bonds, Series 2013B. The sale of these bonds enabled the University to advance refund $580,000 of Series 2005A, $2,855,000 of Series 2006B and $6,575,000 of Series 2007B in General Obligation bonds. The net proceeds of $11,570,171 (after payment of underwriter’s fees and other issuance costs) were deposited in an irrevocable escrow account and will be used to pay interest, redemption premium and maturity value of the refunded bonds to their call date. This defeasance reduced total debt service

Old Dominion University Financial Report 2013 33
payments over the next ten years by $745,291 resulting in an economic gain of $657,103 discounted at the rate of 1.859 percent for General Obligation bonds. The Commonwealth of Virginia, on behalf of the University, issued bonds in previous and current fiscal years for which the proceeds were deposited into an irrevocable trust with an escrow agent to provide for all future debt service on the refunded bonds. Accordingly, the trust account assets and the related liability for the defeased bonds are not reflected in the University’s financial statements. At June 30, 2013, $37,650,000 of the defeased bonds was outstanding.
C. Assets Purchased Under Capital Leases
At June 30, 2013, assets purchased under capital leases were included in depreciable capital assets in the amount of $68,466,119. The assets are net of accumulated depreciation.

Old Dominion University Financial Report 2013 34
NOTE 9: EXPENSES BY NATURAL CLASSIFICATIONS
The following table shows a classification of expenses both by function as listed in the Statement of Revenues, Expenses and Changes in Net Position and by natural classification which is the basis for amounts shown in the Statement of Cash Flows.
Salaries, Wages, and Fringe
Benefits
Non-Personal Services/ Supplies
Scholarships and Fellowships
Plant and Equipment Depreciation Total
Instruction $ 123,169,500 $ 9,827,743 $ - $ 2,602,068 $ - $ 135,599,311 Research 4,750,219 2,534,613 - 488,284 - 7,773,116Public service 246,961 190,574 - 6,658 - 444,193Academic support 26,101,316 13,148,538 - 2,879,994 - 42,129,848Student services 11,187,723 3,113,743 - 49,348 - 14,350,814Institutional support 23,283,893 3,814,052 1,247,664 - 28,345,609Operation and maintenance of plant 10,998,694 13,620,152 - 1,583,158 - 26,202,004Depreciation expense - - - - 22,576,889 22,576,889Scholarship and related expenses - - 17,711,195 - - 17,711,195Auxiliary activities 25,083,861 44,123,195 7,400,771 4,166,283 - 80,774,110
Total $ 224,822,167 $ 90,372,610 $ 25,111,966 $ 13,023,457 $ 22,576,889 $ 375,907,089
NOTE 10: STATE APPROPRIATIONS
The University receives state appropriations from the General Fund of the Commonwealth. The Appropriation Act specifies that such unexpended appropriations shall revert, as specifically provided by the General Assembly, at the end of the biennium. For years ending at the middle of a biennium, unexpended appropriations that have not been approved for reappropriation in the next year by the Governor become part of the General Fund of the Commonwealth and are, therefore, no longer available to the University for disbursements. The following is a summary of state appropriations received by the University, including all supplemental appropriations and reversions:
Original legislative appropriation per Chapter 806: Educational and general programs $ 97,649,766 Student financial assistance/grants 18,320,392 Supplemental adjustments: Central fund appropriation transfers 3,264,914 Line of Duty 871 Grants 3,998,616 VIVA 22,605 Adjusted appropriations $ 123,257,164

Old Dominion University Financial Report 2013 35
NOTE 11: COMPONENT UNIT FINANCIAL INFORMATION
The University’s component units are presented in the aggregate on the face of the financial statements. Below is a condensed summary of each foundation and the corresponding footnotes. The University has three component units - Old Dominion Athletic Foundation, Old Dominion University Educational and Real Estate Foundations, and the Old Dominion University Research Foundation. These organizations are separately incorporated entities and other auditors examine the related financial statements.
Old Dominion Athletic Foundation
Old Dominion University
Educational and Real Estate Foundations
Old Dominion University Research
Foundation TOTALStatement of Net Position
ASSETSCurrent assets: Cash and cash equivalents 10,774,118$ 4,012,074$ 11,266,354$ 26,052,546$ Accounts receivable 169,155 3,200,634 16,281,112 19,650,901 Contributions receivable, net 1,281,363 3,941,821 - 5,223,184 Travel advances - - 54,789 54,789 Prepaid expenses 38,568 36,781 404,367 479,716 Other assets 47,108 133,071 - 180,179 Total current assets 12,310,312 11,324,381 28,006,622 51,641,315
Noncurrent assets: Investments 18,673,232 161,087,447 3,876,724 183,637,403 Accounts receivable - 53,088,016 - 53,088,016 Contributions receivable, net 4,139,325 4,247,165 - 8,386,490 Notes receivable - 3,405,000 - 3,405,000 Nondepreciable capital assets - 22,936,041 54,802 22,990,843 Capital assets 98,087 3,133,834 3,919,701 7,151,622 Total noncurrent assets 22,910,644 247,897,503 7,851,227 278,659,374 Total assets 35,220,956 259,221,884 35,857,849 330,300,689
LIABILITES
Current liabilities: Accounts payable 1,344,638 1,112,488 8,710,685 11,167,811 Due to affiliates - - 362,983 362,983 Unearned revenue - 5,958 5,546,368 5,552,326 Deposits held in custody for others - 35,279 - 35,279 Agency related payables - 11,120,493 - 11,120,493 Line of credit - 5,255,732 - 5,255,732 Long-term liabilities – current portion - 2,219,915 - 2,219,915 Total current liabilities 1,344,638 19,749,865 14,620,036 35,714,539
Noncurrent liabilities - 90,409,073 - 90,409,073 Total liabilities 1,344,638 110,158,938 14,620,036 126,123,612
NET POSITIONNet investment in capital assets 98,087 17,244,743 3,974,503 21,317,333Permanently restricted 15,175,503 102,184,604 - 117,360,107Temporarily restricted 10,684,753 44,579,906 17,660,462 72,925,121Unrestricted 7,917,975 (14,946,307) (397,152) (7,425,484) Total net position 33,876,318$ 149,062,946$ 21,237,813$ 204,177,077$

Old Dominion University Financial Report 2013 36
Old Dominion Athletic Foundation
Old Dominion University
Educational and Real Estate Foundations
Old Dominion University Research
Foundation TOTALStatement of Revenues, Expenses and Changes in Net Position
Operating revenues: Gifts and contributions 6,653,747$ 7,607,495$ -$ 14,261,242$ Indirect cost - - 8,833,409 8,833,409 Sponsored research - - 36,818,820 36,818,820 Other operating revenues 422,450 7,351,129 4,177,690 11,951,269 Total operating revenues 7,076,197 14,958,624 49,829,919 71,864,740
Operating expenses: Instruction - 2,281,898 - 2,281,898 Research - - 44,587,144 44,587,144 Academic support 1,589,367 4,026,669 - 5,616,036 Institutional support 1,008,496 6,306,880 5,929,569 13,244,945 Operation and maintenance of plant - 8,835 - 8,835 Depreciation 10,900 204,846 - 215,746 Student aid 817,054 1,207,391 - 2,024,445 Total operating expenses 3,425,817 14,036,519 50,516,713 67,979,049 Operating gain/(loss) 3,650,380 922,105 (686,794) 3,885,691
Investment income 1,721,960 13,747,630 157,712 15,627,302Contributions to permanent endowments 235,338 932,381 - 1,167,719
Increase in net position 5,607,678 15,602,116 (529,082) 20,680,712Beginning net position 28,268,640 133,460,830 21,766,895 183,496,365Ending net position 33,876,318$ 149,062,946$ 21,237,813$ 204,177,077$
Contributions Receivable
Old Dominion Athletic
Foundation
Old Dominion University
Educational and Real Estate Foundations TOTAL
Current Receivable Receivable due in less than one year 1,347,878$ 4,101,700$ 5,449,578$ Less allowance for doubtful accounts 66,515 159,879 226,394 Net current accounts receivable 1,281,363 3,941,821 5,223,184
Receivable due in greater than 1 year, net of discount ($1,465,480) 4,153,092 4,279,863 8,432,955 Less allowance for doubtful accounts 13,767 32,698 46,465 Net noncurrent contributions receivable 4,139,325 4,247,165 8,386,490 Total contributions receivable 5,420,688$ 8,188,986$ 13,609,674$

Old Dominion University Financial Report 2013 37
Investments The Foundations record investments at market except for real estate held for investment, which is recorded at the lower of cost or fair market value.
Summary Schedule of Investments
Old Dominion Athletic Foundation
Old Dominion University
Educational and Real Estate Foundations
Old Dominion University Research
Foundation TOTALU.S. treasury and agency securities 527,336$ 4,064,808$ 3,347,994$ 7,940,138$ Common & preferred stocks 703,772 5,828,877 2,783 6,535,432 Mutual and money market funds 9,996,794 82,434,985 525,947 92,957,726 Real estate - 259,000 - 259,000 Alternative investments 7,445,330 57,379,284 - 64,824,614 Managed investments - 11,120,493 - 11,120,493 Total 18,673,232$ 161,087,447$ 3,876,724$ 183,637,403$
Capital Assets
Old Dominion Athletic Foundation
Old Dominion University
Educational and Real Estate Foundations
Old Dominion University Research
Foundation TOTALNondepreciable capital assets:Land -$ 4,610,986$ 54,802$ 4,665,788$ Construction in progress - 18,325,055 - 18,325,055 Total capital assets not being depreciated - 22,936,041 54,802 22,990,843 Depreciable capital assets:Buildings - 5,075,568 1,037,290 6,112,858 Equipment 402,360 59,734 18,617,796 19,079,890 Total capital assets being depreciated 402,360 5,135,302 19,655,086 25,192,748
Less accumulated depreciation for:Buildings - 1,979,679 864,549 2,844,228 Equipment 304,273 21,789 14,870,836 15,196,898 Total accumulated depreciation 304,273 2,001,468 15,735,385 18,041,126 Total depreciable capital assets, net 98,087 3,133,834 3,919,701 7,151,622 Total capital assets, net 98,087$ 26,069,875$ 3,974,503$ 30,142,465$

Old Dominion University Financial Report 2013 38
Long-Term Liabilities
Long-term debt maturities are as follows for bonds payable and notes payable: Other Significant Transactions with Old Dominion University The University has entered into various Deed of Lease Agreements with Old Dominion University Real Estate Foundation. Under the agreements as of June 30, 2013, the University will repay $66,880,505. At the expiration of the lease terms, the Old Dominion University Real Estate Foundation shall transfer the projects to the University. As such, the University has recorded capital leases relating to these lease agreements. Direct payments to the University from the Old Dominion University Educational and Real Estate Foundations, Old Dominion Athletic Foundation, and the Old Dominion University Research Foundation for the year ended June 30, 2013 totaled $7,749,603, $2,568,523, and $8,314,248 respectively. This includes gift transfers, payments for facilities, and services. Component Unit Contingencies The Real Estate Foundation was working with the Norfolk Redevelopment and Housing Authority, (NRHA) to condemn properties for the furtherance of University activities in accordance with the University Master Plan approved by the City of Norfolk. In 1998, NRHA determined that these properties were in a blighted area and a redevelopment district was created by the Authority. The condemnation cases were filed in two phases (2008 and 2010). NRHA’s redevelopment plan was challenged by two property owners in a 2009 court case. The Circuit Court reaffirmed the plan. An appeal was filed with the Supreme Court of Virginia. The Supreme
DescriptionInterest
Rates Maturity 2012Bonds payable:
Norfolk Redevelopment and Housing Authority Revenue Bonds Series 2008 3.58% 2033 $ 49,600,000 Norfolk Redevelopment and Housing Authority Revenue Bonds Series 2008 4.475% 2031 11,850,000
Total bonds payable 61,450,000 Notes payable
Tri-Cities II 3.65% 2014 4,395,600 Bookstore 5.585% 2023 4,984,654 President's House 5.980% 2040 2,126,186
Total notes payable 11,506,440 Other long-term liabilities 19,672,548
Total long-term debt 92,628,988$
Old Dominion University Educational and Real Estate Foundations
2013 2,078,390$ 2014 6,564,166 2015 2,268,639 2016 2,369,055 2017 2,482,520
Thereafter 57,193,670 Total 72,956,440$

Old Dominion University Financial Report 2013 39
Court reaffirmed the Circuit Court’s ruling. Two property owners appealed the validity of the redevelopment plan with Supreme Court of Virginia. Another property owner missed the deadline to appeal but indicated a desire to do so. In September 2013, the court ruled in favor of one of the property owners. Based on this decision, negotiations with all three property owners began for the return of the property and/or for reimbursement to them for related costs. One settlement finalized in February 2014, one settled in May 2014, and the last one is pending. Amounts for these settlement costs were accrued as of December 31, 2013. Due to the on-going nature of the negotiations, those estimates are not disclosed. The capitalized acquisition costs for all three properties have been written off as of December 31, 2013. Component Unit Subsequent Event In February 2013, the Real Estate Foundation extended the line of credit in the amount of $6,000,000 for the purpose of purchasing additional properties for future projects. Principal on this Note matures and is payable on February 25, 2014. The interest rate is one-month LIBOR plus 1.75%. In March 2013, the line of credit agreement was modified to increase the amount available to $10,000,000, and a draw of $4,000,000 was taken. In April 2013, an additional draw of $744,268 was taken. The term and interest rate remained unchanged. The modification included an unused commitment fee of 0.25% per annum. NOTE 12: COMMITMENTS
At June 30, 2013, the University was a party to construction and other contracts totaling approximately $21,344,540 of which $12,511,385 has been incurred. The University is committed under various operating leases for equipment and space. In general, the equipment leases are for a two-year term and the space leases are for varying terms with appropriate renewal options for each type of lease. In most cases, the University expects that in the normal course of business, similar leases will replace these leases. Rental expense was approximately $7,500,595 for the year ended June 30, 2013. The University has, as of June 30, 2013, the following future minimum rental payments due under the above leases:
Year Ending June 30
Operating Lease Obligation
2014 7,134,508$ 2015 7,047,321 2016 6,026,184 2017 5,991,561 2018 5,985,867
2019-2023 20,081,536 2024-2028 4,919,317
Total 57,186,294$
Old Dominion University Financial Report 2013 40
NOTE 13: RETIREMENT PLANS
A. Virginia Retirement System
Employees of the University are employees of the Commonwealth of Virginia. Substantially, all full-time classified salaried employees of the University participate in a defined benefit retirement plan administered by the Virginia Retirement System (VRS). VRS is an agent multiple-employer public employee retirement system that acts as a common investment and administrative agency for the Commonwealth of Virginia and its political subdivisions. The VRS does not measure assets and pension benefit obligations separately for individual state institutions. Information related to the plan is available at the statewide level only and can be found in the Commonwealth of Virginia’s Comprehensive Annual Financial Report (CAFR). The Commonwealth, not the University, has the overall responsibility for contributions to this plan. The CAFR provides disclosure of the Commonwealth’s unfunded pension benefit obligation at June 30, 2013. The same report contains historical trend information showing VRS’s progress in accumulating sufficient assets to pay benefits when due. The University’s expenses include the amount assessed by the Commonwealth for contributions to VRS, which totaled approximately $6,434,653 for the year ended June 30, 2013. The retirement contribution rate was 8.76% for state employees and 14.80% for Virginia Law Officers’ Retirement System (VaLORS) for fiscal year 2013. Contributions to VRS were calculated using the base salary amount of approximately $72,003,842 for the year ended June 30, 2013. The University’s total payroll was approximately $181,743,405 for the fiscal year ended June 30, 2013.
B. Optional Retirement Plan
Full-time faculty and certain administrative staff participate in a defined contribution plan administered by two different providers rather than VRS. The two different providers are TIAA/CREF Insurance Companies and Fidelity Investment Tax-Exempt Services. These plans are fixed contribution programs where the retirement benefits received are based upon the employer’s and employee’s contributions, plus interest and dividends. Individual contracts issued under the plans provide for full immediate vesting of both the University’s and employee’s contributions. Total pension costs under these plans were approximately $6,515,700 for the year ended June 30, 2013. Contributions to the optional retirement plans were calculated using the base salary amount of approximately $65,049,787 for fiscal year 2013.
C. Deferred Compensation
Employees of the University are employees of the Commonwealth of Virginia. State employees may participate in the Commonwealth’s Deferred Compensation Plan. Participating employees can contribute to the plan each pay period with the Commonwealth matching up to $20 per pay period. The dollar amount match can change depending on the funding available in the Commonwealth’s budget. The Deferred Compensation Plan is a qualified defined contribution plan under section 401(a) of the Internal Revenue Code. Employer contributions under the Deferred Compensation Plan were approximately $593,762 for fiscal year 2013.

Old Dominion University Financial Report 2013 41
NOTE 14: POST-EMPLOYMENT BENEFITS
The Commonwealth participates in the VRS administered statewide group life insurance program which provides post-employment life insurance benefits to eligible retired and terminated employees. The Commonwealth also provides health care credits against the monthly health insurance premiums of its retirees who have at least 15 years of State service and participate in the State's health plan. Information related to these plans is available at the statewide level in the Commonwealth’s Comprehensive Annual Financial Report. NOTE 15: CONTINGENCIES
Grants and Contracts
The University has received grants for specific purposes that are subject to review and audit by the grantor agencies. Claims against these resources are generally conditional upon compliance with the terms and conditions of grant agreements and applicable federal regulations, including the expenditures of resources for allowable purposes. Any disallowance resulting from a federal audit may become a liability of the University. In addition, the University is required to comply with the various federal regulations issued by the Office of Management and Budget. Failure to comply with certain system requirements of these regulations may result in questions concerning the allowability of related direct and indirect charges pursuant to such agreements. As of June 30, 2013, the University estimates that no material liabilities will result from such audits or questions. Litigation
The University is a party to various litigations. While the final outcome cannot be determined at this time, management is of the opinion that any ultimate liability to which the University may be exposed, if any, for these legal actions will not have a material effect on the University’s financial position. NOTE 16: RISK MANAGEMENT AND EMPLOYEE HEALTH CARE PLANS
The University is exposed to various risks of loss related to torts; theft or damage to, and destruction of assets; errors and omissions; non-performance of duty; injuries to employees; and natural disasters. The University participates in insurance plans maintained by the Commonwealth of Virginia. The state employee health care and worker’s compensation plans are administered by the Department of Human Resource Management and the risk management insurance plans are administered by the Department of Treasury, Division of Risk Management. Risk management insurance includes property, general liability, medical malpractice, faithful performance of duty bond, automobile, and air and watercraft plans. The University pays premiums to each of these Departments for its insurance coverage. Information relating to the Commonwealth’s insurance plans is available at the statewide level in the Commonwealth’s Comprehensive Annual Financial Report.

Old Dominion University Financial Report 2013 42
Page Left Intentionally Blank


