odeq nephelometer network odeq (19) lrapa (5) forest health (9) field burning (3) visibility (4)...
TRANSCRIPT

ODEQ Nephelometer Network
ODEQ (19)
LRAPA (5)
Forest Health (9)
Field Burning (3)
Visibility (4)
Asotin, WA

Laboratory
Klamath Falls PM Site
Laboratory
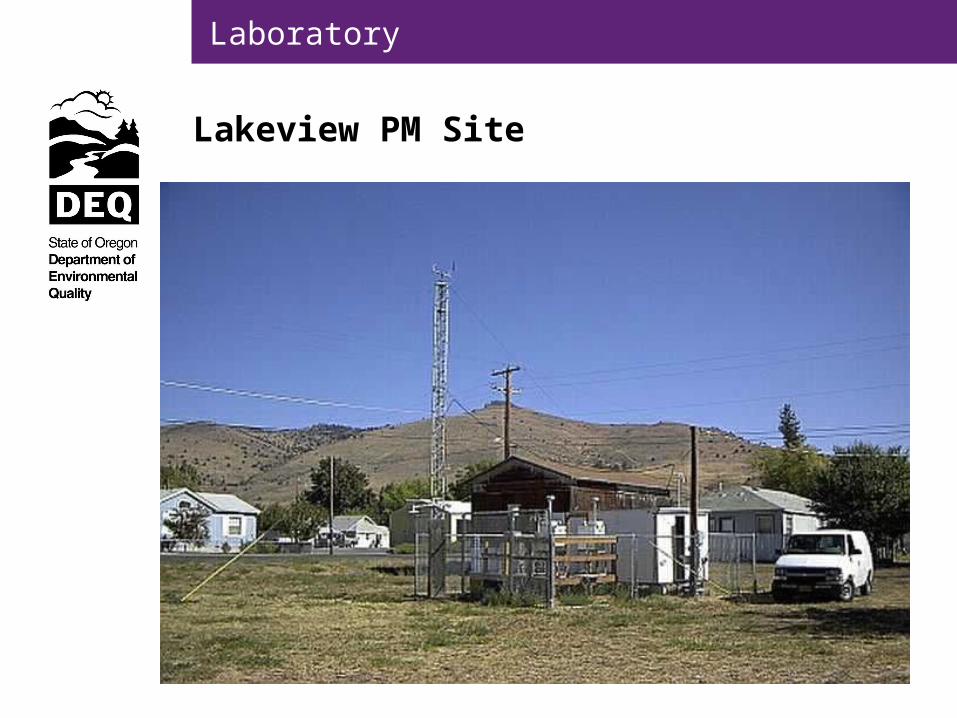
Lakeview PM Site

Laboratory
Salem PM Site (neph only)

Laboratory
Albany PM Site

Laboratory
Illinois Valley Forest Health (neph only)

Laboratory
Mt. Hood Visibility Site (neph only)

Laboratory

Laboratory

Laboratory
Neph Service Frequencies
• Routine Service – once a week– Zero check
– Cal check
– Check zero filter, chart, air flow, datalogger
• QA Review – once a month• Calibration – every 3 months (SUVA 134A)• Cleaning – every 6 months• Data Validation – within one month

Laboratory
KFP Neph vs PM2.5Jan 2005
y = 18.751x - 3.6641
R2 = 0.9982
0
10
20
30
40
50
60
0.00 0.50 1.00 1.50 2.00 2.50 3.00 3.50 4.00
Bscat
FRM
PM
2.5
(ug/
m3)

Laboratory
KFP Neph vs PM2.52004
y = 17.582x - 2.0537
R2 = 0.9848
0
10
20
30
40
50
60
0.00 0.50 1.00 1.50 2.00 2.50 3.00 3.50 4.00
Bscat
FRM
PM
2.5
(ug/
m3)

Laboratory
Klamath Falls PM2.5 vs NephWinter values Oct - May
y = 18.354x - 2.4182
R2 = 0.987
0
10
20
30
40
50
60
70
0.00 0.50 1.00 1.50 2.00 2.50 3.00 3.50 4.00
Neph (bscat)
FRM
PM
2.5
(ug/
m3)

Laboratory
SE PDX Neph vs PM2.51/1/04 to 12/31/04 y = 17.659x - 2.6137
R2 = 0.9731
0
10
20
30
40
50
60
0.0 0.2 0.4 0.6 0.8 1.0 1.2 1.4 1.6 1.8 2.0 2.2 2.4 2.6 2.8 3.0 3.2
Neph (Bscat)
PM
2.5
(u
g/m
3)

Laboratory
SE PDX Neph vs PM2.51/1/04 to 12/31/04 y = 17.659x - 2.6137
R2 = 0.9731
0
10
20
30
40
50
60
0.0 0.2 0.4 0.6 0.8 1.0 1.2 1.4 1.6 1.8 2.0 2.2 2.4 2.6 2.8 3.0 3.2
Neph (Bscat)
PM
2.5
(ug
/m3)

Laboratory
WDOE vs DEQ NephSept 2004, Sauvie Island y = 1.1511x + 0.2498
R2 = 0.9924
0.00
0.20
0.40
0.60
0.80
1.00
1.20
1.40
1.60
1.80
2.00
0.00 0.20 0.40 0.60 0.80 1.00 1.20 1.40 1.60
WDOE
DE
Q

Laboratory
Block DiagramDatalogger
XML Pusher PC
DMZ PC hosting IIS & the XML template files
ISP
Modem
Internet
Outer FirewallInner Firewall
Local Phone Access
Database Server with MS SQL
Server & ENVIEW database
Monitor
Remote Station
Oregon On-Line Services
Recorder

Laboratory
Data and AQI Display