october 24-25, 2021 storm - contracosta.ca.gov
TRANSCRIPT

ADH1.8-in16-yr
BAP0.5-in2-yr
BCO0.6-in2-yr
BIF0.7-in4-yr
BIX0.6-in2-yr
BLD1.8-in5-yr
CCP1.6-in25-yr
CRK1.0-in3-yr
DBF1.7-in21-yr
DBL1.9-in11-yr
DVB2.3-in94-yr
ESB1.2-in4-yr
FCD1.6-in32-yr
GCC2.3-in> 500 -yr
HLD1.0-in3-yr
ISD0.7-in3-yr
KGR0.8-in2-yr
MCF1.5-in12-yr
MCR0.9-in4-yr
MDP2.3-in110-yr
MED1.0-in7-yr
ORF2.0-in11-yr
RIC1.5-in9-yr
RKY1.6-in5-yr
ROF1.0-in4-yr
RRG0.8-in3-yr
RSS2.5-in149-yr
SMC2.5-in44-yr
TAS1.7-in40-yr
WDN0.9-in2-yr
WSF1.5-in33-yr
YGF1.7-in47-yr
Storm total = depth of rain ina storm with a storm beingdefined as a period startingafter at least 12 hours of norain.
Contra Costa County Flood Control and Water Conservation District Storm Report Rain Gauge Exhibit
October 24-25, 2021 Storm
PREPARED BY:CONTRA COSTA COUNTYCOMPUTER SERVICES - MAPPING SCIENCES SECTION
255 GLACIER DRIVEMARTINEZ, CALIFORNIA 94553
PUBLIC WORKS DEPARTMENT2004 CONTRA COSTA COUNTY©
Copyright and DisclaimerThis map contains copyrighted information. Reproducing all orany portion of this map is an infringement of copyright law.Users of this map agree to read and accept County of ContraCosta disclaimer of liability and warranties provided herewith.
Date: Thursday, November 4, 2021 Path: P:\GIS USERS - Development\FC\Hydrology\Projects\Gauges\2021-10-24 Event\Rain Gauges 2021-10-24.mxd BY: M. Boucher
3 Hr. Duration Storm Freq.0 - 5 Years5.1 - 10 Years10.1 - 25 Years25.1 - 50 Years50.1 - 100 Years100.1 - 500 Years> 500 Years
LegendWatershedsCityLimitsCreeksAll values are preliminary and subject
to revision. Question regarding thisexhibit should be directed to the FC
District Hydrologist at(925) 313-2000.
.0 5 102.5 Miles
Local community drainage systems are typicallydesigned for the 10-year storm. Regional floodprotection systems are typically designed for the 25-to 100-year storms. See endnotes on report memofor more details.
Find Report at www.contracosta.ca.gov/1456/Storm-Event-ReportsDurations reported are 3-, 6-, 12-, 24-, 48- and 96-hour

ADH2.9-in33-yr
BAP1.1-in4-yr
BCO1.0-in4-yr
BIF1.2-in7-yr
BIX1.0-in4-yr
BLD2.9-in9-yr
CCP2.4-in43-yr
CRK1.6-in4-yr
DBF2.7-in34-yr
DBL3.1-in24-yr
DVB3.5-in224-yr
ESB2.1-in10-yr
FCD2.8-in149-yr
GCC3.6-in> 500 -yr
HLD1.8-in6-yr
ISD1.3-in7-yr
KGR1.2-in2-yr
MCF2.4-in29-yr
MCR1.6-in15-yr
MDP3.3-in173-yr
MED1.5-in12-yr
ORF3.4-in34-yr
RIC2.6-in25-yr
RKY2.4-in6-yr
ROF1.9-in9-yr
RRG1.5-in7-yr
RSS3.9-in> 500 -yr
SMC3.8-in75-yr
TAS2.5-in49-yr
WDN1.6-in3-yr
WSF2.4-in92-yr
YGF2.7-in99-yr
Storm total = depth of rain ina storm with a storm beingdefined as a period startingafter at least 12 hours of norain.
Contra Costa County Flood Control and Water Conservation District Storm Report Rain Gauge Exhibit
October 24-25, 2021 Storm
PREPARED BY:CONTRA COSTA COUNTYCOMPUTER SERVICES - MAPPING SCIENCES SECTION
255 GLACIER DRIVEMARTINEZ, CALIFORNIA 94553
PUBLIC WORKS DEPARTMENT2004 CONTRA COSTA COUNTY©
Copyright and DisclaimerThis map contains copyrighted information. Reproducing all orany portion of this map is an infringement of copyright law.Users of this map agree to read and accept County of ContraCosta disclaimer of liability and warranties provided herewith.
Date: Thursday, November 4, 2021 Path: P:\GIS USERS - Development\FC\Hydrology\Projects\Gauges\2021-10-24 Event\Rain Gauges 2021-10-24.mxd BY: M. Boucher
6 Hr. Duration Storm Freq.0 - 5 Years5.1 - 10 Years10.1 - 25 Years25.1 - 50 Years50.1 - 100 Years100.1 - 500 Years> 500 Years
LegendWatershedsCityLimitsCreeksAll values are preliminary and subject
to revision. Question regarding thisexhibit should be directed to the FC
District Hydrologist at(925) 313-2000.
.0 5 102.5 Miles
Local community drainage systems are typicallydesigned for the 10-year storm. Regional floodprotection systems are typically designed for the 25-to 100-year storms. See endnotes on report memofor more details.
Find Report at www.contracosta.ca.gov/1456/Storm-Event-ReportsDurations reported are 3-, 6-, 12-, 24-, 48- and 96-hour
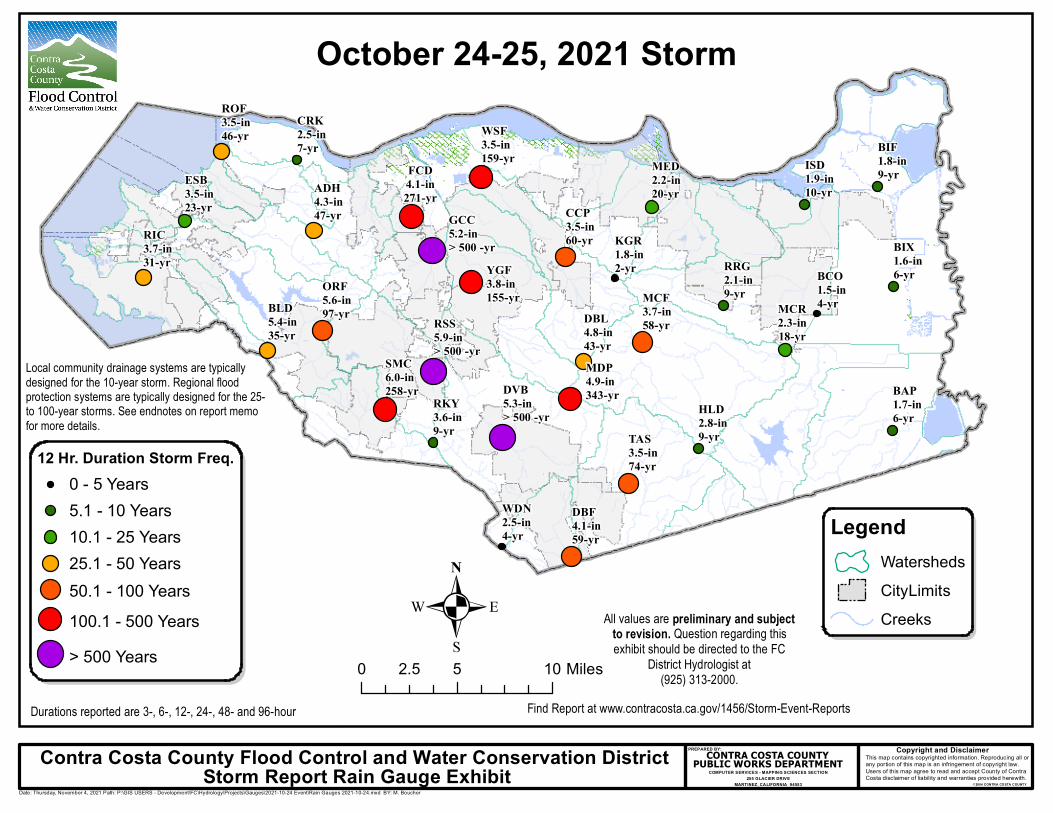
ADH4.3-in47-yr
BAP1.7-in6-yr
BCO1.5-in4-yr
BIF1.8-in9-yr
BIX1.6-in6-yr
BLD5.4-in35-yr
CCP3.5-in60-yr
CRK2.5-in7-yr
DBF4.1-in59-yr
DBL4.8-in43-yr
DVB5.3-in> 500 -yr
ESB3.5-in23-yr
FCD4.1-in271-yr
GCC5.2-in> 500 -yr
HLD2.8-in9-yr
ISD1.9-in10-yr
KGR1.8-in2-yr
MCF3.7-in58-yr
MCR2.3-in18-yr
MDP4.9-in343-yr
MED2.2-in20-yr
ORF5.6-in97-yr
RIC3.7-in31-yr
RKY3.6-in9-yr
ROF3.5-in46-yr
RRG2.1-in9-yr
RSS5.9-in> 500 -yr
SMC6.0-in258-yr
TAS3.5-in74-yr
WDN2.5-in4-yr
WSF3.5-in159-yr
YGF3.8-in155-yr
Storm total = depth of rain ina storm with a storm beingdefined as a period startingafter at least 12 hours of norain.
Contra Costa County Flood Control and Water Conservation District Storm Report Rain Gauge Exhibit
October 24-25, 2021 Storm
PREPARED BY:CONTRA COSTA COUNTYCOMPUTER SERVICES - MAPPING SCIENCES SECTION
255 GLACIER DRIVEMARTINEZ, CALIFORNIA 94553
PUBLIC WORKS DEPARTMENT2004 CONTRA COSTA COUNTY©
Copyright and DisclaimerThis map contains copyrighted information. Reproducing all orany portion of this map is an infringement of copyright law.Users of this map agree to read and accept County of ContraCosta disclaimer of liability and warranties provided herewith.
Date: Thursday, November 4, 2021 Path: P:\GIS USERS - Development\FC\Hydrology\Projects\Gauges\2021-10-24 Event\Rain Gauges 2021-10-24.mxd BY: M. Boucher
12 Hr. Duration Storm Freq.0 - 5 Years5.1 - 10 Years10.1 - 25 Years25.1 - 50 Years50.1 - 100 Years100.1 - 500 Years> 500 Years
LegendWatershedsCityLimitsCreeksAll values are preliminary and subject
to revision. Question regarding thisexhibit should be directed to the FC
District Hydrologist at(925) 313-2000.
.0 5 102.5 Miles
Local community drainage systems are typicallydesigned for the 10-year storm. Regional floodprotection systems are typically designed for the 25-to 100-year storms. See endnotes on report memofor more details.
Find Report at www.contracosta.ca.gov/1456/Storm-Event-ReportsDurations reported are 3-, 6-, 12-, 24-, 48- and 96-hour

ADH6.5-in108-yr
BAP1.9-in4-yr
BCO1.8-in4-yr
BIF2.3-in9-yr
BIX1.9-in5-yr
BLD8.6-in81-yr
CCP4.2-in34-yr
CRK4.0-in14-yr
DBF5.6-in53-yr
DBL7.1-in72-yr
DVB7.1-in478-yr
ESB6.0-in98-yr
FCD5.6-in
317-yrGCC7.0-in> 500 -yr
HLD3.8-in9-yr
ISD2.5-in10-yr
KGR2.1-in2-yr
MCF5.3-in78-yr
MCR2.8-in10-yr
MDP6.7-in327-yr
MED2.7-in12-yr
ORF8.1-in155-yr
RIC6.1-in96-yr
RKY5.5-in15-yr
ROF5.5-in156-yr
RRG2.6-in7-yr
RSS8.2-in> 500 -yr
SMC8.8-in480-yr
TAS4.6-in55-yr
WDN3.4-in4-yr
WSF4.6-in146-yr
YGF5.2-in161-yr
Storm total = depth of rain ina storm with a storm beingdefined as a period startingafter at least 12 hours of norain.
Contra Costa County Flood Control and Water Conservation District Storm Report Rain Gauge Exhibit
October 24-25, 2021 Storm
PREPARED BY:CONTRA COSTA COUNTYCOMPUTER SERVICES - MAPPING SCIENCES SECTION
255 GLACIER DRIVEMARTINEZ, CALIFORNIA 94553
PUBLIC WORKS DEPARTMENT2004 CONTRA COSTA COUNTY©
Copyright and DisclaimerThis map contains copyrighted information. Reproducing all orany portion of this map is an infringement of copyright law.Users of this map agree to read and accept County of ContraCosta disclaimer of liability and warranties provided herewith.
Date: Thursday, November 4, 2021 Path: P:\GIS USERS - Development\FC\Hydrology\Projects\Gauges\2021-10-24 Event\Rain Gauges 2021-10-24.mxd BY: M. Boucher
24 Hr. Duration Storm Freq.0 - 5 Years5.1 - 10 Years10.1 - 25 Years25.1 - 50 Years50.1 - 100 Years100.1 - 500 Years> 500 Years
LegendWatershedsCityLimitsCreeksAll values are preliminary and subject
to revision. Question regarding thisexhibit should be directed to the FC
District Hydrologist at(925) 313-2000.
.0 5 102.5 Miles
Local community drainage systems are typicallydesigned for the 10-year storm. Regional floodprotection systems are typically designed for the 25-to 100-year storms. See endnotes on report memofor more details.
Find Report at www.contracosta.ca.gov/1456/Storm-Event-ReportsDurations reported are 3-, 6-, 12-, 24-, 48- and 96-hour

ADH7.4-in34-yr
BAP2.2-in3-yr
BCO2.2-in3-yr
BIF2.9-in8-yr
BIX2.4-in5-yr
BLD9.9-in30-yr
CCP4.7-in13-yr
CRK4.4-in6-yr
DBF6.1-in20-yr
DBL8.5-in34-yr
DVB8.0-in76-yr
ESB6.5-in26-yr
FCD6.2-in48-yr
GCC7.6-in375-yr
HLD4.5-in6-yr
ISD3.2-in9-yr
KGR2.5-in2-yr
MCF6.1-in32-yr
MCR3.2-in6-yr
MDP7.6-in61-yr
MED3.3-in9-yr
ORF9.0-in35-yr
RIC6.7-in28-yr
RKY6.8-in10-yr
ROF6.1-in39-yr
RRG3.0-in4-yr
RSS8.9-in170-yr
SMC10.0-in85-yr
TAS5.2-in22-yr
WDN4.0-in3-yr
WSF4.9-in31-yr
YGF5.6-in35-yr
Storm total = depth of rain ina storm with a storm beingdefined as a period startingafter at least 12 hours of norain.
Contra Costa County Flood Control and Water Conservation District Storm Report Rain Gauge Exhibit
October 24-25, 2021 Storm
PREPARED BY:CONTRA COSTA COUNTYCOMPUTER SERVICES - MAPPING SCIENCES SECTION
255 GLACIER DRIVEMARTINEZ, CALIFORNIA 94553
PUBLIC WORKS DEPARTMENT2004 CONTRA COSTA COUNTY©
Copyright and DisclaimerThis map contains copyrighted information. Reproducing all orany portion of this map is an infringement of copyright law.Users of this map agree to read and accept County of ContraCosta disclaimer of liability and warranties provided herewith.
Date: Thursday, November 4, 2021 Path: P:\GIS USERS - Development\FC\Hydrology\Projects\Gauges\2021-10-24 Event\Rain Gauges 2021-10-24.mxd BY: M. Boucher
48 Hr. Duration Storm Freq.0 - 5 Years5.1 - 10 Years10.1 - 25 Years25.1 - 50 Years50.1 - 100 Years100.1 - 500 Years> 500 Years
LegendWatershedsCityLimitsCreeksAll values are preliminary and subject
to revision. Question regarding thisexhibit should be directed to the FC
District Hydrologist at(925) 313-2000.
.0 5 102.5 Miles
Local community drainage systems are typicallydesigned for the 10-year storm. Regional floodprotection systems are typically designed for the 25-to 100-year storms. See endnotes on report memofor more details.
Find Report at www.contracosta.ca.gov/1456/Storm-Event-ReportsDurations reported are 3-, 6-, 12-, 24-, 48- and 96-hour
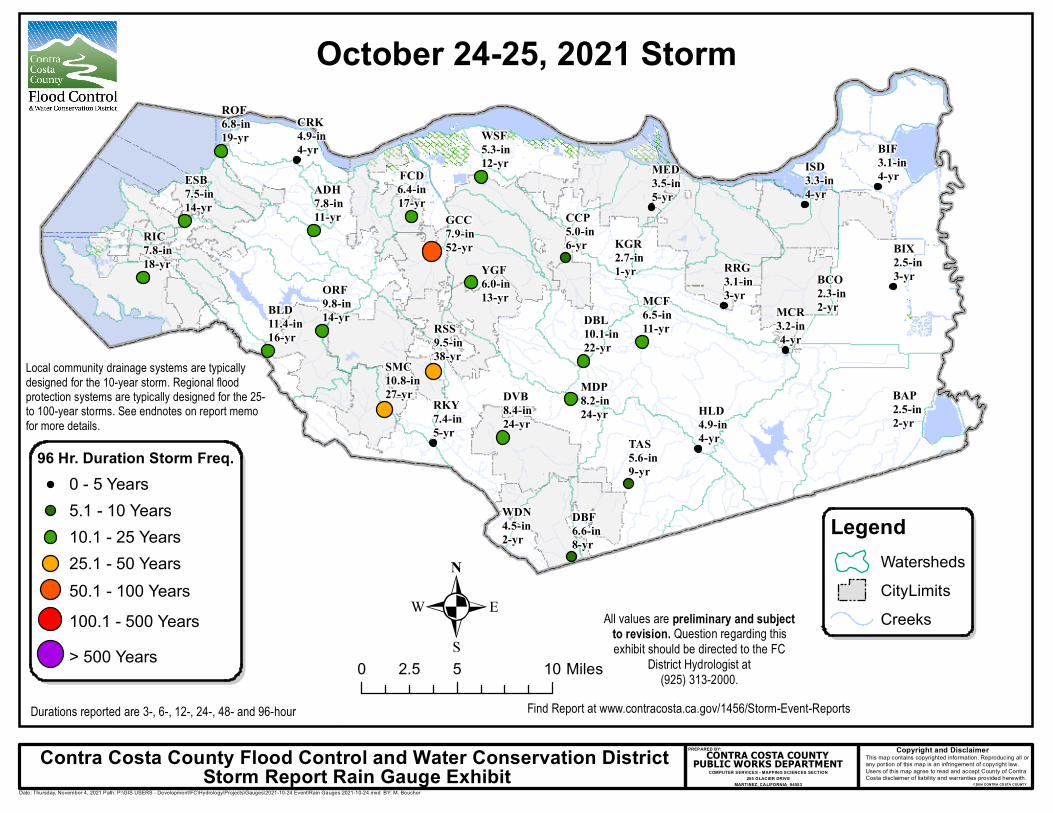
ADH7.8-in11-yr
BAP2.5-in2-yr
BCO2.3-in2-yr
BIF3.1-in4-yr
BIX2.5-in3-yr
BLD11.4-in16-yr
CCP5.0-in6-yr
CRK4.9-in4-yr
DBF6.6-in8-yr
DBL10.1-in22-yr
DVB8.4-in24-yr
ESB7.5-in14-yr
FCD6.4-in17-yr
GCC7.9-in52-yr
HLD4.9-in4-yr
ISD3.3-in4-yr
KGR2.7-in1-yr
MCF6.5-in11-yr
MCR3.2-in4-yr
MDP8.2-in24-yr
MED3.5-in5-yr
ORF9.8-in14-yr
RIC7.8-in18-yr
RKY7.4-in5-yr
ROF6.8-in19-yr
RRG3.1-in3-yr
RSS9.5-in38-yrSMC
10.8-in27-yr
TAS5.6-in9-yr
WDN4.5-in2-yr
WSF5.3-in12-yr
YGF6.0-in13-yr
Storm total = depth of rain ina storm with a storm beingdefined as a period startingafter at least 12 hours of norain.
Contra Costa County Flood Control and Water Conservation District Storm Report Rain Gauge Exhibit
October 24-25, 2021 Storm
PREPARED BY:CONTRA COSTA COUNTYCOMPUTER SERVICES - MAPPING SCIENCES SECTION
255 GLACIER DRIVEMARTINEZ, CALIFORNIA 94553
PUBLIC WORKS DEPARTMENT2004 CONTRA COSTA COUNTY©
Copyright and DisclaimerThis map contains copyrighted information. Reproducing all orany portion of this map is an infringement of copyright law.Users of this map agree to read and accept County of ContraCosta disclaimer of liability and warranties provided herewith.
Date: Thursday, November 4, 2021 Path: P:\GIS USERS - Development\FC\Hydrology\Projects\Gauges\2021-10-24 Event\Rain Gauges 2021-10-24.mxd BY: M. Boucher
96 Hr. Duration Storm Freq.0 - 5 Years5.1 - 10 Years10.1 - 25 Years25.1 - 50 Years50.1 - 100 Years100.1 - 500 Years> 500 Years
LegendWatershedsCityLimitsCreeksAll values are preliminary and subject
to revision. Question regarding thisexhibit should be directed to the FC
District Hydrologist at(925) 313-2000.
.0 5 102.5 Miles
Local community drainage systems are typicallydesigned for the 10-year storm. Regional floodprotection systems are typically designed for the 25-to 100-year storms. See endnotes on report memofor more details.
Find Report at www.contracosta.ca.gov/1456/Storm-Event-ReportsDurations reported are 3-, 6-, 12-, 24-, 48- and 96-hour

ADH6.5-in24-hrs108-yr
BAP1.7-in12-hrs6-yr
BCO1.5-in12-hrs4-yr
BIF1.8-in12-hrs9-yr
BIX1.6-in12-hrs6-yr
BLD8.6-in24-hrs81-yr
CCP3.5-in12-hrs60-yr
CRK4.0-in24-hrs14-yr
DBF4.1-in12-hrs59-yr
DBL7.1-in24-hrs72-yr
DVB5.3-in12-hrs> 500 -yr
ESB6.0-in24-hrs98-yr
FCD5.6-in
24-hrs317-yr
GCC7.0-in24-hrs> 500 -yr
HLD3.8-in24-hrs9-yr
ISD1.9-in12-hrs10-yr
KGR1.8-in12-hrs2-yr
MCF5.3-in24-hrs78-yr
MCR2.3-in12-hrs18-yr
MDP4.9-in12-hrs343-yr
MED2.2-in12-hrs20-yr
ORF8.1-in24-hrs155-yr
RIC6.1-in24-hrs96-yr
RKY5.5-in24-hrs15-yr
ROF5.5-in24-hrs156-yr
RRG2.1-in12-hrs9-yr
RSS8.2-in24-hrs> 500 -yrSMC
8.8-in24-hrs480-yr
TAS3.5-in12-hrs74-yr
WDN3.4-in24-hrs4-yr
WSF3.5-in12-hrs159-yr
YGF5.2-in24-hrs161-yr
Storm total = depth of rain ina storm with a storm beingdefined as a period startingafter at least 12 hours of norain.
Contra Costa County Flood Control and Water Conservation District Storm Report Rain Gauge Exhibit
October 24-25, 2021 Storm
PREPARED BY:CONTRA COSTA COUNTYCOMPUTER SERVICES - MAPPING SCIENCES SECTION
255 GLACIER DRIVEMARTINEZ, CALIFORNIA 94553
PUBLIC WORKS DEPARTMENT2004 CONTRA COSTA COUNTY©
Copyright and DisclaimerThis map contains copyrighted information. Reproducing all orany portion of this map is an infringement of copyright law.Users of this map agree to read and accept County of ContraCosta disclaimer of liability and warranties provided herewith.
Date: Thursday, November 4, 2021 Path: P:\GIS USERS - Development\FC\Hydrology\Projects\Gauges\2021-10-24 Event\Rain Gauges 2021-10-24.mxd BY: M. Boucher
Max Storm Frequency0 - 5 Years5.1 - 10 Years10.1 - 25 Years25.1 - 50 Years50.1 - 100 Years100.1 - 500 Years> 500 Years
LegendWatershedsCityLimitsCreeksAll values are preliminary and subject
to revision. Question regarding thisexhibit should be directed to the FC
District Hydrologist at(925) 313-2000.
.0 5 102.5 Miles
Local community drainage systems are typicallydesigned for the 10-year storm. Regional floodprotection systems are typically designed for the 25-to 100-year storms. See endnotes on report memofor more details.
Find Report at www.contracosta.ca.gov/1456/Storm-Event-ReportsDurations reported are 3-, 6-, 12-, 24-, 48- and 96-hour

ADH7.2-in
BAP2.1-in
BCO2.2-in
BIF2.9-in
BIX2.4-in
BLD9.9-in
CCP4.7-in
CRK4.4-in
DBF6.1-in
DBL8.5-in
DVB7.9-in
ESB6.5-in
FCD6.1-in
GCC7.6-in
HLD4.5-in
ISD3.1-in
KGR2.5-in
MCF6.1-in MCR
3.1-in
MDP7.5-in
MED3.3-in
ORF9.0-in
RIC6.7-in
RKY6.8-in
ROF6.1-in
RRG3.0-in
RSS8.9-in
SMC10.0-in
TAS5.2-in
WDN4.0-in
WSF4.9-in
YGF5.6-in
Storm total = depth of rain ina storm with a storm beingdefined as a period startingafter at least 12 hours of norain.
Contra Costa County Flood Control and Water Conservation District Storm Report Rain Gauge Exhibit
October 24-25, 2021 Storm
PREPARED BY:CONTRA COSTA COUNTYCOMPUTER SERVICES - MAPPING SCIENCES SECTION
255 GLACIER DRIVEMARTINEZ, CALIFORNIA 94553
PUBLIC WORKS DEPARTMENT2004 CONTRA COSTA COUNTY©
Copyright and DisclaimerThis map contains copyrighted information. Reproducing all orany portion of this map is an infringement of copyright law.Users of this map agree to read and accept County of ContraCosta disclaimer of liability and warranties provided herewith.
Date: Monday, November 8, 2021 Path: P:\GIS USERS - Development\FC\Hydrology\Projects\Gauges\2021-10-24 Event\Rain Gauges 2021-10-24.mxd BY: M. Boucher
Storm Totals (inches)
LegendWatershedsCityLimitsCreeksAll values are preliminary and subject
to revision. Question regarding thisexhibit should be directed to the FC
District Hydrologist at(925) 313-2000.
.0 5 102.5 Miles
Local community drainage systems are typicallydesigned for the 10-year storm. Regional floodprotection systems are typically designed for the 25-to 100-year storms. See endnotes on report memofor more details.
Find Report at www.contracosta.ca.gov/1456/Storm-Event-ReportsDurations reported are 3-, 6-, 12-, 24-, 48- and 96-hour

ADH
BAP
BCO
BIF
BIX
BLD
CCP
CRK
DBF
DBL
DVB
ESB FCD
GCC
HLD
ISD
KGR
MCFMCR
MDP
MED
ORF
RIC
RKY
ROF
RRG
RSSSMC
TAS
WDN
WSF
YGF
Storm total = depth of rain ina storm with a storm beingdefined as a period startingafter at least 12 hours of norain.
Contra Costa County Flood Control and Water Conservation District Storm Report Rain Gauge Exhibit
October 24-25, 2021 Storm
PREPARED BY:CONTRA COSTA COUNTYCOMPUTER SERVICES - MAPPING SCIENCES SECTION
255 GLACIER DRIVEMARTINEZ, CALIFORNIA 94553
PUBLIC WORKS DEPARTMENT2004 CONTRA COSTA COUNTY©
Copyright and DisclaimerThis map contains copyrighted information. Reproducing all orany portion of this map is an infringement of copyright law.Users of this map agree to read and accept County of ContraCosta disclaimer of liability and warranties provided herewith.
Date: Thursday, November 4, 2021 Path: P:\GIS USERS - Development\FC\Hydrology\Projects\Gauges\2021-10-24 Event\Rain Gauges 2021-10-24.mxd BY: M. Boucher
Relative depths for eachduration
5.7D3D6D12D24D48D96
LegendWatershedsCityLimitsCreeksAll values are preliminary and subject
to revision. Question regarding thisexhibit should be directed to the FC
District Hydrologist at(925) 313-2000.
.0 5 102.5 Miles
Local community drainage systems are typicallydesigned for the 10-year storm. Regional floodprotection systems are typically designed for the 25-to 100-year storms. See endnotes on report memofor more details.
Find Report at www.contracosta.ca.gov/1456/Storm-Event-ReportsDurations reported are 3-, 6-, 12-, 24-, 48- and 96-hour