october 23, 2013 public finance 2013 state controller’s conference with county auditors robert...
TRANSCRIPT

October 23, 2013
PUBLIC FINANCE
2013 STATE CONTROLLER’S CONFERENCE
WITH COUNTY AUDITORS
Robert LarkinsManaging Director
1 Embarcadero Center, Suite 650San Francisco, CA 94111
Office: [email protected]

2
IN ITS EFFORTS TO AVOID GLOBAL MELTDOWN (2008-09) AND TO STIMULATE THE U.S. ECONOMY (2009-13), THE FED HAS DRIVEN INTEREST RATES TO HALF-CENTURY LOWS
1965
1966
1968
1969
1971
1972
1974
1975
1977
1978
1980
1981
1983
1984
1986
1987
1989
1990
1992
1993
1995
1996
1998
1999
2001
2002
2004
2005
2007
2008
2010
2011
2013
0.0%
2.0%
4.0%
6.0%
8.0%
10.0%
12.0%
14.0%
16.0%
18.0%
Historical 10-Year US Treasury Yields (1965 - Present)
Source: Federal Reserve

3
• Key drivers are: the Fed, mutual fund outflows and Detroit
• While the pace of outflows has declined, municipal bond funds have experienced 18 successive weeks of outflows
• Detroit’s pending bankruptcy and the City’s assertion that GO bonds are “unsecured” has investors asking “what IS a GO pledge?”
• In California, the outcome of court decisions as to PERS’ assertion of “super seniority” in the Stockton and San Bernardino bankruptcies could have a profound impact on how investors view unsecured credits like Lease Revenue Bonds, especially for PERS agencies
• Fiscal Cliff 2.0
VOLATILITY IS THE “NEW NORMAL” IN THE MUNI MARKET
6/3/
2013
6/9/
2013
6/15
/201
3
6/21
/201
3
6/27
/201
3
7/3/
2013
7/9/
2013
7/15
/201
3
7/21
/201
3
7/27
/201
3
8/2/
2013
8/8/
2013
8/14
/201
3
8/20
/201
3
8/26
/201
3
9/1/
2013
9/7/
2013
9/13
/201
3
9/19
/201
3
-0.25%
-0.20%
-0.15%
-0.10%
-0.05%
0.00%
0.05%
0.10%
0.15%
0.20%
0.25%
Daily Changes in 30Y MMD
(2,088)
(3,769)
(2,913)
(2,048)
(2,706)
(1,748)
(289)
(4,000)
(3,500)
(3,000)
(2,500)
(2,000)
(1,500)
(1,000)
(500)
0
8/14/13 8/21/13 8/28/13 9/4/13 9/11/13 9/18/13 9/25/13
$ Million Municipal Bond Fund Estimated Weekly Net Flows8/14/2013 - 9/25/2013

4
THE YIELD CURVE HAS STEEPENED CONSIDERABLY
• From a demand perspective, Prop 30 has increased the value of tax-exemption for high income investors, as has the increase in Federal income tax rates
─ Retail investors have returned to the primary market in a big way, enticed by new higher yields
• Many market participants expect short term rates to remain ultra low through 2015, increasing the appeal of issuing variable rate debt
1 2 3 4 5 6 7 8 9 10 11 12 13 14 15 16 17 18 19 20 21 22 23 24 25 26 27 28 29 300.00
0.50
1.00
1.50
2.00
2.50
3.00
3.50
4.00
4.50AAA MMD Curve
AAA MMD 5/1/13 AAA MMD 10/8/2013

5
INTEREST RATES REMAIN ATTRACTIVE IN HISTORICAL CONTEXT
• The chart shows the frequency of the AAA-Rated Municipal Market Data (“MMD”) rates at each 1 to 30 year point on the MMD yield curve since 1993. The more intense the color, the more often interest rates are at the given level, moving in intensity from light red to dark red.
Interest Rate Intensity Map(MMD Yields - 1993 to Current)
Term (years)
Interest Rate
10/8/2013 MMD Curve84.9% of the time 30-yr bonds have been above the rate of 4.11% since
1993.
0
1
2
3
4
5
6
7
8
1 3 5 7 9 11 13 15 17 19 21 23 25 27 29
0.00%-3.00% 3.00%-6.00% 6.00%-9.00% 9.00%-12.00%
12.00%-15.00% 15.00%-18.00% 18.00%-21.00% Current

6
AS BORROWERS, THESE LOW RATES HAVE BEEN A BOON TO COUNTIES
2014 2015 2016 2017 2018 2019 2020 2021 2022 2023 2024 2025 2026 2027 2028 2029 2030 20310.000%
1.000%
2.000%
3.000%
4.000%
5.000%
6.000%
4.25% 4.38% 4.45%4.60% 4.70% 4.75% 4.75% 4.75% 4.88% 4.88% 4.88% 4.88% 4.88% 5.00% 5.00% 5.00% 5.00% 5.00%
0.30%
0.67%
1.12%
1.54%
1.91%
2.31%
2.68%2.98%
3.28%3.49%
3.71%3.85%
3.99% 4.07% 4.19% 4.29% 4.36%4.55%
Representative Interest Rate Differential for County COP Refunding
2001B Prior Bond Coupons
2013 Refunding Bond Yields
Savings Potential

7
HISTORICALLY LOW RATES UNLEASHED A TSUNAMI OF REFUNDINGS
California Refunding Volume
Source: CDIAC*January 1, 2013 to August 31, 2013
2009 2010 2011 2012 2013YTD* -
5,000,000,000
10,000,000,000
15,000,000,000
20,000,000,000
25,000,000,000
30,000,000,000
0.0%
5.0%
10.0%
15.0%
20.0%
25.0%
30.0%
35.0%
40.0%
45.0%
Refunding Par ($) % of Total Volume

8
HOWEVER, PREVAILING ULTRA LOW RATES HAVE SOME MATERIAL NEGATIVE CONSEQUENCES FOR COUNTIES
• Investment income remains anemic
• Negative arbitrage adversely impacts advance refundings
• Increased PERS contribution rates
• Retirees’ savings income has shrunk (though roaring stock market has been a plus)

9
MOST COUNTY INVESTMENT POOLS ARE YIELDING 300 BASIS POINTS LOWER THAN JUST FIVE YEARS AGO, CREATING YET ANOTHER REVENUE HOLE IN BUDGETS
Investment Income Effects on Sacramento County's Budget
FY2008 FY2009 FY2010 FY2011 FY2012
Pool Yield (%)* 3.42% 1.41% 0.82% 0.48% 0.39%
Investment Income ($000)
72,706 49,804 15,016 1,250 (648)
Total General Fund Expenditures ($000)
2,018,750 2,071,452 1,809,523 1,854,990 1,801,849
Investment Income / Total GF Expenditures
3.60% 2.40% 0.83% 0.07% -0.04%
Source: Sacramento County CAFRs *For the quarter ended June 30 each year
1977
1979
1981
1983
1985
1987
1989
1991
1993
1995
1997
1999
2001
2003
2005
2007
2009
2011
2013
0.00%
2.00%
4.00%
6.00%
8.00%
10.00%
12.00%
14.00%LAIF June Quarterly Apportionment Rates
Current Rate: 0.24%
Source: California State Treasurer
10
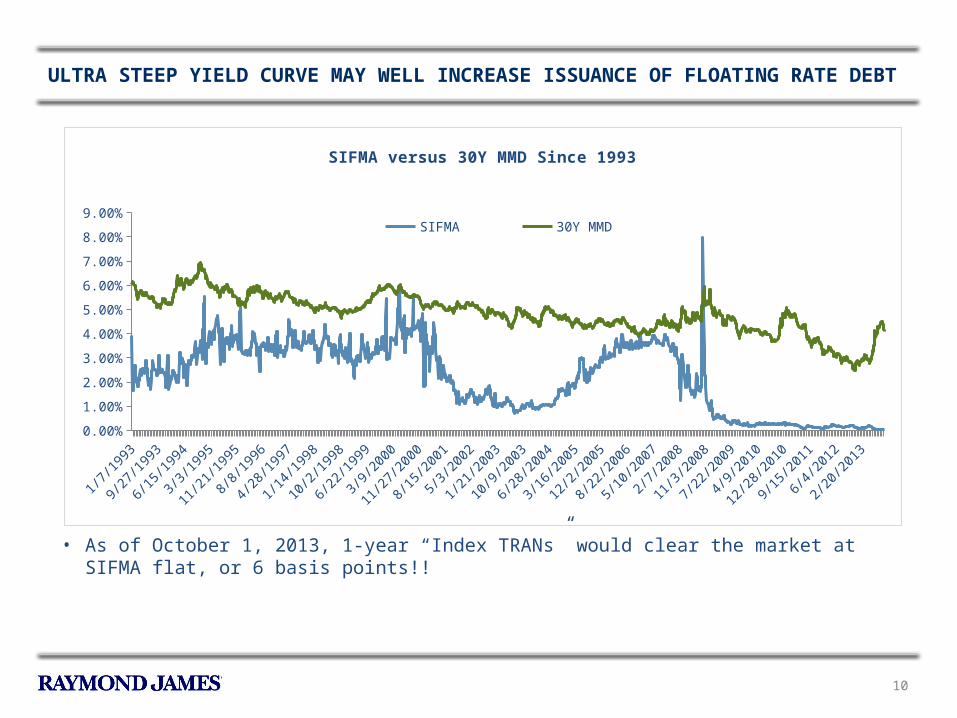
ULTRA STEEP YIELD CURVE MAY WELL INCREASE ISSUANCE OF FLOATING RATE DEBT
• As of October 1, 2013, 1-year “Index TRANs” would clear the market at SIFMA flat, or 6 basis points!!
1993
1993
1994
1995
1995
1996
1997
1997
1998
1999
1999
2000
2001
2001
2002
2003
2003
2004
2005
2005
2006
2007
2007
2008
2009
2009
2010
2011
2011
2012
2013
2013
0.00%
1.00%
2.00%
3.00%
4.00%
5.00%
6.00%
7.00%
8.00%
9.00%
SIFMA versus 30Y MMD Since 1993
SIFMA 30Y MMD

11
LOW SHORT-TERM TREASURY YIELDS ADVERSELY IMPACTS ADVANCE REFUNDINGS
• Typically, municipal bonds have a 10 year call feature that allows issuers to call/refinance bonds prior to maturity and generate budget savings
• In an advance refunding, a county issues refunding bond, placing proceeds in an escrow of Treasury/Agency securities which pays the debt service on the refunded bonds until the call date
• The Fed’s near zero target for short term rates has reduced available defeasance yields well below longer-term tax exempt borrowing rates, producing “negative arbitrage” in refunding escrows
• Typically, issuers measure the efficiency of potential refundings by evaluating net present value savings compared to the par value of refunded – 5% PV savings is often the benchmark for “advance refundings” (where call date is >90 days from closing), while
3% PV savings is the common rule for “current refundings”– Some issuers have adopted a 2:1 rule PV savings must be at least 2x negative arbitrage
• But since net PV savings factors in all transaction costs, including negative arbitrage, one could argue that many issuers have missed the boat on refunding savings by focusing on negative arbitrage
0.00%
1.00%
2.00%
3.00%
4.00%
5.00%
6.00%
7.00%3Y UST 5Y UST 20Y MMD

12
REFLECTING LOWER GLOBAL FIXED INCOME RETURNS, PERS REDUCED ITS ACTUARIAL EARNINGS ASSUMPTION – WITH ATTENDANT BUDGET HIT TO COUNTIES
• Effective July 1, 2012, PERS lowered its 7.75% assumed investment earnings rate to 7.5%
• Additionally, PERS has adopted shorter smoothing and amortization periods that will lead to higher employer rates beginning in FY 15-16 for counties
– Median Miscellaneous Plan employer contributions to rise from ~18% in FY 15-16 to ~23% in FY 20-21 (that’s not 5%...it’s a 27% increase!)
– Median Safety Plan employer contributions to rise from ~30% in FY 15-16 to ~39% in FY 20-21 (12% increase)
13
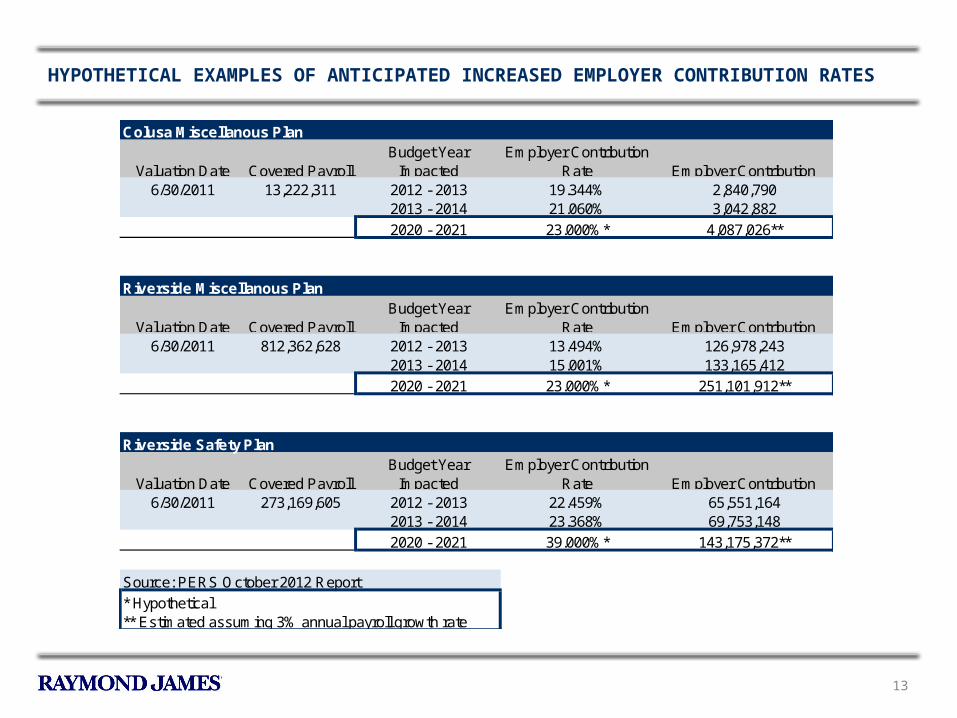
HYPOTHETICAL EXAMPLES OF ANTICIPATED INCREASED EMPLOYER CONTRIBUTION RATES
Colusa Miscellanous Plan
Valuation Date Covered PayrollBudget Year
ImpactedEmployer Contribution
Rate Employer Contribution6/30/2011 13,222,311 2012 - 2013 19.344% 2,840,790
2013 - 2014 21.060% 3,042,8822020 - 2021 23.000%* 4,087,026**
Riverside Miscellanous Plan
Valuation Date Covered PayrollBudget Year
ImpactedEmployer Contribution
Rate Employer Contribution6/30/2011 812,362,628 2012 - 2013 13.494% 126,978,243
2013 - 2014 15.001% 133,165,4122020 - 2021 23.000%* 251,101,912**
Riverside Safety Plan
Valuation Date Covered PayrollBudget Year
ImpactedEmployer Contribution
Rate Employer Contribution6/30/2011 273,169,605 2012 - 2013 22.459% 65,551,164
2013 - 2014 23.368% 69,753,1482020 - 2021 39.000%* 143,175,372**
Source: PERS October 2012 Report
* Hypothetical** Estimated assuming 3% annual payroll growth rate

14
THE FED’S NEAR ZERO TARGET FOR FED FUNDS HAS HAMMERED RETIREES
• Over the next twenty years, nearly 10 million people, or 25% of the State’s population, will be entering retirement age
• The precipitous drop in bond and CD yields has decimated senior citizens’ investment income
2010 2015 2020 2025 2030 2035 2040 2045 2050 2055 20600.0%
5.0%
10.0%
15.0%
20.0%
25.0% % of US Population 65+
Source: Census Bureau, Federal Reserve
1990
1992
1994
1996
1998
2000
2002
2004
2006
2008
2010
2012
0.0%
1.0%
2.0%
3.0%
4.0%
5.0%
6.0%
7.0%
8.0%
9.0%
10.0%
6-month CD Rates

15
SUMMARY
• Volatility is the new normal as the Fed remains the dominant driver of global financial markets
• The Fed-orchestrated decline in rates has been beneficial to counties as borrowers, but has eviscerated local government investment pools’ interest earnings
• PERS’ return to more conservative actuarial assumptions is intended to improve pension plan funded ratios, but counties should be prepared for many years of substantially higher employer contribution rates
• When the Fed ultimately tapers its $85 billion monthly open market purchases, long-term interest rates are likely to rise, with many market participants calling for 5% Treasury rates
• However, until unemployment drops to near 6%, short-term rates are expected to remain low
– County treasury pool investment returns likely to remain depressed
– Counties may find it beneficial to go back to the future by issuing variable rate debt

16
DISCLAIMER
The information contained herein is solely intended to facilitate discussion of potentially applicable financing applications and is not intended to be a specific buy/sell recommendation, nor is it an official confirmation of terms. Any terms discussed herein are preliminary until confirmed in a definitive written agreement. While we believe that the outlined financial structure or marketing strategy is the best approach under the current market conditions, the market conditions at the time any proposed transaction is structured or sold may be different, which may require a different approach. The analysis or information presented herein is based upon hypothetical projections and/or past performance that have certain limitations. No representation is made that it is accurate or complete or that any results indicated will be achieved. In no way is past performance indicative of future results. Changes to any prices, levels, or assumptions contained herein may have a material impact on results. Any estimates or assumptions contained herein represent our best judgment as of the date indicated and are subject to change without notice. Examples are merely representative and are not meant to be all-inclusive. Raymond James shall have no liability, contingent or otherwise, to the recipient hereof or to any third party, or any responsibility whatsoever, for the accuracy, correctness, timeliness, reliability or completeness of the data or formulae provided herein or for the performance of or any other aspect of the materials, structures and strategies presented herein. Raymond James is neither acting as your financial advisor nor Municipal Advisor (as defined in Section 15B of the Exchange Act of 1934, as amended), and expressly disclaims any fiduciary duty to you in connection with the subject matter of this Presentation.
Municipal Securities Rulemaking Board (“MSRB”) Rule G-17 requires that we make the following disclosure to you at the earliest stages of our relationship, as underwriter, with respect to an issue of municipal securities: the underwriter’s primary role is to purchase securities with a view to distribution in an arm’s-length commercial transaction with the issuer and it has financial and other interests that differ from those of the issuer. Raymond James does not provide accounting, tax or legal advice; however, you should be aware that any proposed transaction could have accounting, tax, legal or other implications that should be discussed with your advisors and/or legal counsel. Raymond James and affiliates, and officers, directors and employees thereof, including individuals who may be involved in the preparation or presentation of this material, may from time to time have positions in, and buy or sell, the securities, derivatives (including options) or other financial products of entities mentioned herein. In addition, Raymond James or affiliates thereof may have served as an underwriter or placement agent with respect to a public or private offering of securities by one or more of the entities referenced herein. This Presentation is not a binding commitment, obligation, or undertaking of Raymond James. No obligation or liability with respect to any issuance or purchase of any Bonds or other securities described herein shall exist, nor shall any representations be deemed made, nor any reliance on any communications regarding the subject matter hereof be reasonable or justified unless and until (1) all necessary Raymond James, rating agency or other third party approvals, as applicable, shall have been obtained, including, without limitation, any required Raymond James senior management and credit committee approvals, (2) all of the terms and conditions of the documents pertaining to the subject transaction are agreed to by the parties thereto as evidenced by the execution and delivery of all such documents by all such parties, and (3) all conditions hereafter established by Raymond James for closing of the transaction have been satisfied in our sole discretion. Until execution and delivery of all such definitive agreements, all parties shall have the absolute right to amend this Presentation and/or terminate all negotiations for any reason without liability therefor.