october 21, 2010 - sec · 2017-10-14 · october 21, 2010. safe harbor statement this presentation,...
TRANSCRIPT

Exhibit 99.1
Third Quarter 2010 WebcastOctober 21, 2010
Safe Harbor Statement
This presentation, made on October 21, 2010, includes forward-looking statements based on current expectations and Alcon does not undertake the obligation to update the forward-looking information or statements. These expectations could differ materially from actual results and are subject to a number of uncertaintiesdiffer materially from actual results and are subject to a number of uncertainties and risks as detailed in the company’s form 20-F filed with the SEC on March 16, 2010.
fIn addition, this presentation may include several financial measures, to assist in better understanding our business, that are not prepared in accordance with generally accepted accounting principles (GAAP). These non-GAAP financial measures will be reconciled at the end of this presentation or in associated publicmeasures will be reconciled at the end of this presentation or in associated public information filed with the SEC.
Reports noted above are available on our website at www.alcon.com in the “I t d M di ” ti F f th i f ti t t th Al I t“Investors and Media” section. For further information contact the Alcon Investor Relations Department at (817) 551-8805.

Business OverviewBusiness OverviewKevin BuehlerKevin Buehler
President and Chief Executive Officer

Strong, Consistent Performance
Strong top-line sales growthQ3 2010 organic growth of 8.7% (+9.0% reported)
Solid financial performance
YTD 2010 organic growth of 9.9% (+12.2% reported)
pOperating income
Q3 2010 adjusted growth of 8.7% (-14.4% reported)YTD 2010 adjusted growth of 15 7% (+10 2% reported)YTD 2010 adjusted growth of 15.7% (+10.2% reported)
Net incomeQ3 2010 adjusted growth of 8.5% (-13.4% reported)YTD 2010 adjusted growth of 16.1% (+9.0% reported)
Adjusted operating income and diluted EPS measure the results of the company's operations without certain items that pertain only to the period presented Management
Organic sales growth is a non-GAAP measure presented to give investors a better comparison of operations between years. Reconciliations for organic sales growth are provided at the end of this presentation.
Adjusted operating income and diluted EPS measure the results of the company's operations without certain items that pertain only to the period presented. Management believes these measures are an important measure of the company’s operations because they provide investors with a clearer picture of the core operations of the company. These measures are considered non-GAAP financial measures as defined by Regulation G promulgated by the U.S. Securities and Exchange Commission.

Delivering Sustainable Organic Growth
Global Organic Sales Growth by Quarter2010 Year-to-date organic growth of 9.9%
(+12.2% reported)
9.0% 8.5%9.6%
11.3%
8.7%
12.0%
4.8%3 3%4 0%
8.0%
3.3%
0.0%
4.0%
0.0%Q1 09 Q2 09 Q3 09 Q4 09 Q1 10 Q2 10 Q3 10
Reported Growth -3.4% 5.9% 14.5% 15.3% 12.5%-2.8% 9.0%
Growth rates as compared to same period in prior year.
Organic sales growth is a non-GAAP measure presented to give investors a better comparison of operations between years. Reconciliations for organic sales growth is provided at the end of this presentation.
Growth rates as compared to same period in prior year.

Balanced Global Contributions
$803$357
Reported: +20 2%
Q3 2010 Sales by Geography
U S
Emerging Markets20.3%
$803Reported: +9.5%Organic Growth: +7.9%
Reported: +20.2%Organic Growth: +19.2%
U.S.45.6%
Developed International
34.1%
$600Reported: +2.7%Reported: +2.7%
Organic Growth: +4.3% (dollars in millions)
Growth rates as compared to same period in prior year.
Organic sales growth is a non-GAAP measure presented to give investors a better comparison of operations between years. Reconciliations for organic sales growth is provided at the end of this presentation.
Growth rates as compared to same period in prior year.
Diversified Product Growth
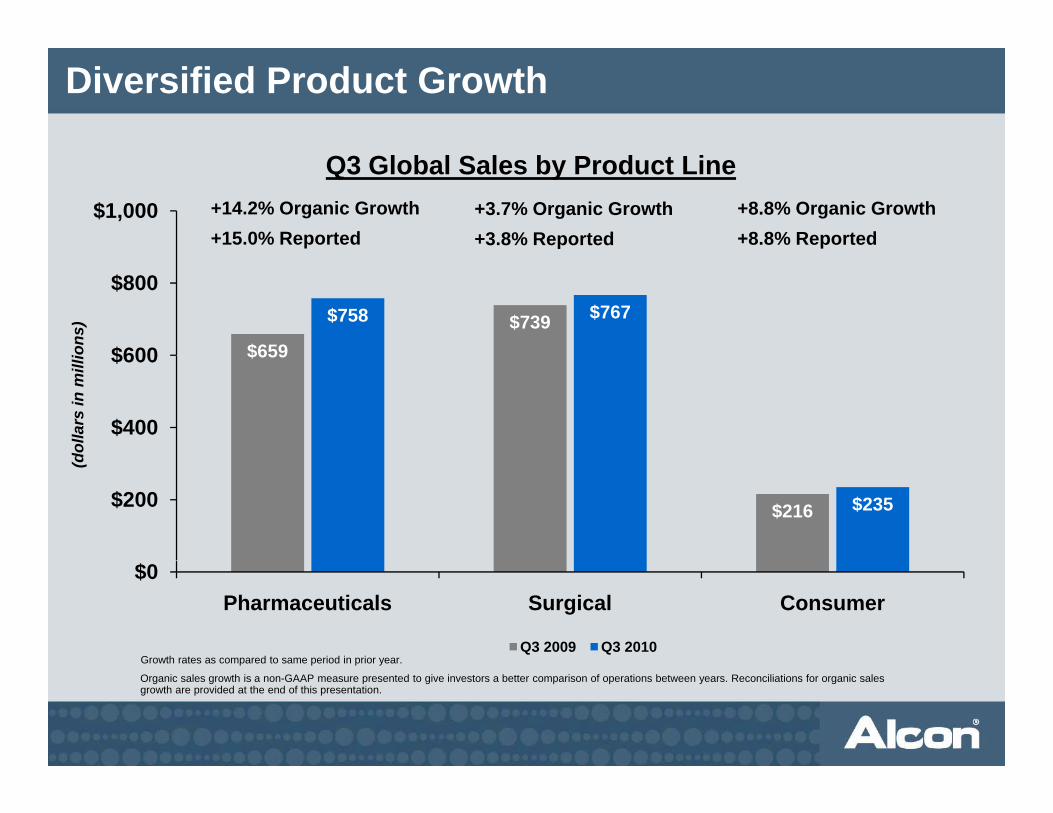
$1,000 +14.2% Organic Growth+15.0% Reported
+3.7% Organic Growth+3.8% Reported
+8.8% Organic Growth+8.8% Reported
Q3 Global Sales by Product Line
$659$739$758 $767
$600
$800
ions
)
$659
$400
$600
dolla
rs in
mill
i
$216 $235$200
(d
$0Pharmaceuticals Surgical Consumer
Q3 2009 Q3 2010Growth rates as compared to same period in prior year.Growth rates as compared to same period in prior year.
Organic sales growth is a non-GAAP measure presented to give investors a better comparison of operations between years. Reconciliations for organic sales growth are provided at the end of this presentation.

Commercial Execution Driving Market Share Gains
RX Growth GlobalAugust YTD
U.S.August YTD
Brand Market Brand Market
TRAVATAN® Family 10.9% 6.7% 9.2% 2.9%
Azopt® + AZARGA® 16 5% 7 5% 7 9% 10 0%Azopt® + AZARGA® 16.5% 7.5% 7.9% 10.0%
Vigamox® * 10.1% 6.2% -2.2% -4.2%
NEVANAC® 39 5% 3 1% 14 9% -0 4%NEVANAC 39.5% 3.1% 14.9% -0.4%
Patanol® + PatadayTM -1.7% -9.6% 4.5% 3.3%
CIPRODEX® * 10.1% 10.2% 5.6% 3.3%Source: Global-IMS** U.S.-WK Health
* Moxifloxacin, the active ingredient in Vigamox®, is licensed to Alcon by Bayer Schering Pharma. CIPRODEX® is a registered trademark of Bayer AG and licensed to Alcon by Bayer Schering Pharma.
** Top 32 countries

U.S. Cataract Procedure Growth Moderating
6.0%
U.S. Cataract Procedure GrowthMarket Scope estimates full-year 2010 U.S. cataract
procedures will rise 2.7%
4.9% 4.7%4.0%
2 3%2.6%
2 0%
%
2.3% 2.1%1.8%
1.3%
2.0%
Source: Market Scope
0.0%Q1 09 Q2 09 Q3 09 Q4 09 Q1 10 Q2 10 Q3 10
Estimated
Source: Market Scope
Growth rates as compared to same period in prior year.

Increasing Penetration Key to AT-IOL Growth
16%
AT-IOLs as a Percentage of Total U.S. IOLs ImplantedRising utilization of both presbyopia-correcting and
toric lenses are driving U.S. AT-IOL penetration
12 8%
13.5%14%
11.2% 11.2%
12.5%12.8%
12%
10.8%10%
8%Q1 09 Q2 09 Q3 09 Q4 09 Q1 10 Q2 10
Source: Market Scope

Durable Opportunity in International Markets
25% 25%
Emerging Market Organic GrowthDeveloped International Organic Growth
15%
20%
15%
20% 18.8%
16.1%18.1%
11 6%
18.7%
5%
10%
5%
10%11.2%
8.5%
11.6%
8.5%6.9%
5.6%
0%
5%
2006 2007 2008 2009 YTD Q3 0%
5%
2006 2007 2008 2009 YTD Q3 2010 2010
Reported Growth 8.6% 19.9% 18.0% 3.7% 21.0% 21.3% 21.5% 1.0%8.0% 24.3%
Growth rates as compared to same period in prior yearOrganic sales growth is a non-GAAP measure presented to give investors a better comparison of operations between years. Reconciliations for organic sales growth are provided at the end of this presentation.
Growth rates as compared to same period in prior year.

2010 Key Late Stage R&D Pipeline Activity2010 SUBMISSIONS 2010 APPROVALS2010 SUBMISSIONS 2010 APPROVALS
FILED PENDING RECEIVED PENDINGALLEGRETTO™ EX-500
refractive laser (EU)AcrySof® IQ Toric expanded
diopter range (Japan)TRAVATAN® Alternative
Preservative System (EU)Patanase® new indication
(US)
ALLEGRETTO™ EX-500 refractive laser (US)
NEVANAC® (Japan)
Moxifloxacin new formulation (US)
TRAVATAN® Alternative Preservative System (EU)
Moxifloxacin new formulation (US)
DuoTrav® Alternative Preservative System (Japan)
ACRYSERT® C (US/EU)
Ex-PRESS® ophthalmic glaucoma device (Japan)
New MPDS (EU)
WaveLight® FS-200 femtosecond laser (US)
AcrySof® IQ ReSTOR® +3.0 (Japan)
WaveLight® FS-200 femtosecond laser (US/EU)
AcrySof® IQ ReSTOR® Toric (EU)
7500 cpm UltraVit™ Probe (US/EU)
W Li ht® FS 200
ALLEGRETTO WAVE®
Eye-Q 400 Hz laser (Japan)
Systane® BALANCE (EU)
DuoTrav® Alternative
WaveLight® FS-200 femtosecond laser (EU)
Systane® BALANCE (US)AcrySof® IQ Toric expanded diopter range (US/EU)
AcrySof® IQ Toric expandedDuoTrav Alternative Preservative System (EU)
Pataday® (Japan) ALLEGRETTO™ EX-500 refractive laser (EU)
New MPDS (US)
AcrySof IQ Toric expanded diopter range (EU)
Indicates activity since Q2 earnings callNew MPDS (US)

Business Development Delivering Growth
Optonol Acquisition
Further broadens Alcon’s extensive glaucoma product offering
Sales of Ex-PRESS® ophthalmic glaucoma device steadily building
DUREZOL® Acquisition
’ f fAdds potent steroid to Alcon’s anti-infective portfolio
Integration exceeding expectationsGenerating near term sales momentumGenerating near-term sales momentum6.0% August 2010 U.S. market share vs. 1.3% August 2009

Leveraging Commercial Capabilities
8%
DUREZOL® U.S. Market ShareAugust 2010 U.S. market share of 6.0%
versus 1.3% in August 2009
6.0%6%
3.2%
4.4%
4%
1.5% 1.6% 1.5% 1.7%2.3%
2%
0%Jan-10 Feb-10 Mar-10 Apr-10 May-10 Jun-10 Jul-10 Aug-10
Source: WK Health

Exciting New Cataract Technology
LenSx Lasers Acquisition
LenSx femtosecond laser improves key steps in cataract surgeryUses technology to automate previously manual proceduresMicron-level laser precision and predictability
Provides new growth driver to Alcon’s leading cataract portfolioComplementary procedure to phacoemulsificationRepresents incremental revenue opportunityRepresents incremental revenue opportunity
Limited product introduction in late 2010, full launch in 2011

Change of Majority Ownership
Alcon remains an independent, publicly-traded company
Potential opportunities to create value for AlconPotential opportunities to create value for Alcon– Within the framework of good corporate governance– Through arm’s length negotiations
Potential to leverage a leadership position in the total healthcare market
Potential access to broad-based pharmaceutical research capability applicable to ophthalmologycapability applicable to ophthalmology

Financial ReviewRick CroarkinRick Croarkin
Senior Vice President, Finance and Chief Financial Officer

Sales
(dollars in millions)
+9.0% Reported
Q3 Sales(dollars in millions)
+12.2% Reported
YTD Sales
$1,850
p+8.7% Organic Growth $5,500
$5,367
p+9.9% Organic Growth
$1,700$1,760
$5,000
$4 784
$1,550$1,614
$4,500
$4,784
$1,400Q3 2009 Q3 2010
$4,000YTD 2009 YTD 2010
Growth rates as compared to same period in prior yearOrganic sales growth is a non-GAAP measure presented to give investors a better comparison of operations between years. Reconciliations for organic sales growth is provided at the end of this presentation.
Growth rates as compared to same period in prior year.

Gross Profit
$1,500
(dollars in millions)
+10.1%
Q3 Gross Profit
$1,300 $1,338
$1,100
$1,215
$900Q3 2009 Q3 2010
% of Sales 75.3% 76.0%
Growth rate as compared to same period in prior year.

Change of Majority Ownership Expenses
Q3 2010 YTD 2010
Other operating expenses $ 133 $ 141
Tax effect (20) (20)
Impact to Net earnings $ 113 $ 121
Impact to diluted EPS $ 0.37 $ 0.40
(dollars in millions, except per share amounts)
Adjusted operating income net income and diluted EPS measure the results of the company's operations without certain items that pertain only to the period presentedAdjusted operating income, net income and diluted EPS measure the results of the company's operations without certain items that pertain only to the period presented. Management believes these measures are an important measure of the company’s operations because they provide investors with a clearer picture of the core operations of the company. These measures are considered non-GAAP financial measures as defined by Regulation G promulgated by the U.S. Securities and Exchange Commission.

Operating Income
$800 (dollars in millions)
-14.4%
Q3 Reported$800
+8.7%
Q3 Adjusted(dollars in millions)
$600$578
14.4%
$600$578
$628
8.7%
$400$495
$400
$200Q3 2009 Q3 2010
$200Q3 2009 Q3 2010
% of Sales 35.8% 28.1%
Adj t d ti i th lt f th ' ti ith t t i it th t t i l t th i d t d M t b li thi
% of Sales 35.8% 35.7%
Growth rates as compared to same period in prior year.
Adjusted operating income measures the results of the company's operations without certain items that pertain only to the period presented. Management believes this measure is an important measure of the company’s operations because it provides investors with a clearer picture of the core operations of the company. This measure is considered a non-GAAP financial measure as defined by Regulation G promulgated by the U.S. Securities and Exchange Commission.

Operating Income
$2,500 (dollars in millions)
+10.2%
YTD Reported$2,500
+15.7%
YTD Adjusted(dollars in millions)
$2,000
$1,899
10.2%
$2,000$2,016
15.7%
$1,500$1,724
$1,500$1,743
$1,000YTD 2009 YTD 2010
$1,000YTD 2009 YTD 2010
% of Sales 36.0% 35.4%
Adj t d ti i th lt f th ' ti ith t t i it th t t i l t th i d t d M t b li thi
% of Sales 36.4% 37.6%
Growth rates as compared to same period in prior year.
Adjusted operating income measures the results of the company's operations without certain items that pertain only to the period presented. Management believes this measure is an important measure of the company’s operations because it provides investors with a clearer picture of the core operations of the company. This measure is considered a non-GAAP financial measure as defined by Regulation G promulgated by the U.S. Securities and Exchange Commission.

Net Earnings and Diluted EPS
$700$700 (dollars in millions)
-13.4%
Q3 Reported Net Earnings
+8.5%
Q3 Adjusted Net Earnings(dollars in millions)
$500
$600
$500
$600
$515
13.4% +8.5%
$515$559EPS $1.71 EPS $1.71
EPS $1.84
$400
$500
$400
$500 $515
$446
$515EPS $1.47
$300Q3 2009 Q3 2010
$300Q3 2009 Q3 2010
31.9% 25.3%
Growth rates as compared to same period in prior year.
% of Sales 31.9% 31.8%% of
Sales
Adj t d ti i th lt f th ' ti ith t t i it th t t i l t th i d t d M t b li thiAdjusted operating income measures the results of the company's operations without certain items that pertain only to the period presented. Management believes this measure is an important measure of the company’s operations because it provides investors with a clearer picture of the core operations of the company. This measure is considered a non-GAAP financial measure as defined by Regulation G promulgated by the U.S. Securities and Exchange Commission.

Net Earnings and Diluted EPS
$2,250$2,250 (dollars in millions)
+9.0%
YTD Reported Net Earnings
+16.1%
YTD Adjusted Net Earnings(dollars in millions)
$1,750$1,750
$1 549$1,689
9.0% +16.1%
$1 563
$1,815EPS $5.15 EPS $5.20
EPS $5.56EPS $5.97
$1,250$1,250
$1,549 $1,563
$750YTD 2009 YTD 2010
$750YTD 2009 YTD 2010
32.4% 31.5%
Growth rates as compared to same period in prior year.
% of Sales 32.7% 33.8%% of
Sales
Adj t d ti i th lt f th ' ti ith t t i it th t t i l t th i d t d M t b li thiAdjusted operating income measures the results of the company's operations without certain items that pertain only to the period presented. Management believes this measure is an important measure of the company’s operations because it provides investors with a clearer picture of the core operations of the company. This measure is considered a non-GAAP financial measure as defined by Regulation G promulgated by the U.S. Securities and Exchange Commission.

Raising 2010 Full Year Adjusted EPS Guidance
• Organic growth in the high single digits
• Diluted earnings per share:
• Includes on-going U.S. health care reform costs– $20 million full-year sales impact
$7.58 - $7.68Adjusted EPS guidance
$ y p
– $0.06 full-year diluted EPS impact
• Project and deal timing will raise R&D spending versus Q3 2010
• Excludes:• Excludes:– $21 million after-tax benefit related to a change in estimate for accrued royalties
– $25 million tax charge due to loss of U.S. deductibility of retiree medical benefits as a result of U.S. health care reform
– Costs related to change of majority ownership to and/or merger with Novartis
• Assumes retroactive renewal of R&E tax credit in Q410
Organic sales growth is a non-GAAP measure presented to give investors a better comparison of operations between years.

Third Quarter 2010 WebcastOctober 21, 2010

Non-GAAP ReconciliationsALCON, INC. AND SUBSIDIARIES
Reconciliation of Non-GAAP Financial MeasuresReconciliation of Non GAAP Financial Measures(in millions, except per share data)
Operating Income
Q3 2010 Q3 2009 Growth %
Q3 2010
% of Sales As Reported $ 495 $ 578 -14.4% 28.1%$ $Change-in-Control Expenses 133 --
As Adjusted $ 628 $ 578 8.7 35.7 Net Earnings
Q3 2010 Q3 2009 Growth % As Reported $ 446 $ 515 -13.4% Change-in-Control Expenses 113 --
As Adjusted $ 559 $ 515 8.5
Diluted EPS
Q3 2010 Q3 2009 Growth % As Reported $ 1.47 $ 1.71 -14.0% Change-in-Control
0 37g
Expenses 0.37 --
As Adjusted $ 1.84 $ 1.71 7.6 Note: Adjusted operating income, net earnings and adjusted diluted EPS measure the results of the company's operations without certain items that did not pertain to the comparable period. Management believes these measures are an important measure of the company’s operations because they provide investors with a clearer picture of the core operations of the p y p y p p pcompany. These measures are considered non-GAAP financial measures as defined by Regulation G promulgated by the U.S. Securities and Exchange Commission.

Non-GAAP ReconciliationsALCON, INC. AND SUBSIDIARIES
Reconciliation of Non-GAAP Financial Measures (in millions, except per share data)
Operating Income
YTD 2010 Q3 2009 Growth %
YTD 2010 % of Sales
As Reported $ 1,899 $ 1,724 10.2% 35.4% Change in ControlChange-in-Control Expenses 141 --
Change in Royalty Adjustment (24) --
Reduction in Force -- 19
As Adjusted $ 2,016 $ 1,743 15.7 37.6 Net Earnings
YTD 2010 Q3 2009 Growth % As Reported $ 1,689 $ 1,549 9.0% Change-in-Control Expenses 121 --Expenses 121
Change in Royalty Adjustment (21) --
U.S. Healthcare Reform * 26 --
Reduction in Force -- 14
A Adj t d $ 1 815 $ 1 563 16 1As Adjusted $ 1,815 $ 1,563 16.1 Note: Adjusted operating income and net earnings measure the results of the company's operations without certain items that did not pertain to the comparable period. Management believes these measures are an important measure of the company’s operations because they provide investors with a clearer picture of the core operations of the company. These measures are considered non-GAAP financial measures as defined by Regulation G promulgated by the U.S. Securities and Exchange Commission. * Related to a change in the tax treatment of retiree medical benefits in the United States.

Non-GAAP Reconciliations
ALCON, INC. AND SUBSIDIARIES Reconciliation of Non-GAAP Financial Measures
(in millions, except per share data)
Diluted EPS
YTD 2010 Q3 2009 Growth % As Reported $ 5.56 $ 5.15 8.0% Change-in-Control
0 40Expenses 0.40 --
Change in Royalty Adjustment (0.08) --
U.S. Healthcare Reform * 0.09 --
Reduction inReduction in Force -- 0.05
As Adjusted $ 5.97 $ 5.20 14.8 Note: Adjusted diluted EPS measures the results of the company's operations without certain items that did not pertain to the
bl i d M t b li thi i i t t f th ’ ti b itcomparable period. Management believes this measure is an important measure of the company’s operations because it provides investors with a clearer picture of the core operations of the company. This measure is considered a non-GAAP financial measure as defined by Regulation G promulgated by the U.S. Securities and Exchange Commission. * Related to a change in the tax treatment of retiree medical benefits in the United States.

Non-GAAP Reconciliations
ALCON, INC. AND SUBSIDIARIES Reconciliation of Non-GAAP Financial Measures
Total Global Sales Reported Change
Foreign Currency Change
Acquisition
Change Organic Change
Q1 2009 (2.8) % (7.6) % -- % 4.8 %
Q2 2009 (3 4) (6 7) 3 3Q2 2009 (3.4) (6.7) -- 3.3
Q3 2009 5.9 (3.1) -- 9.0
Q4 2009 14.5 6.0 -- 8.5
Q1 2010 15.3 5.5 0.2 9.6
Q2 2010 12 5 0 8 0 4 11 3
Note: Organic change presents sales growth without the impact of foreign exchange fluctuations and acquisitions. Management believes organic sales change is an important measure of the company’s operations because it provides
Q2 2010 12.5 0.8 0.4 11.3
Q3 2010 9.0 (0.4) 0.7 8.7
Management believes organic sales change is an important measure of the company s operations because it provides investors with a clearer picture of the core rate of sales growth due to changes in unit volumes and local currency prices. This measure is considered a non-GAAP financial measure as defined by Regulation G promulgated by the U.S. Securities and Exchange Commission.
Non-GAAP ReconciliationsALCON, INC. AND SUBSIDIARIES
Reconciliation of Non-GAAP Financial Measureseco c at o o o G a c a easu es(in millions)
Three Months Ended Foreign September 30, Currency Acquisition Organic 2010 2009 Change Change Change Change
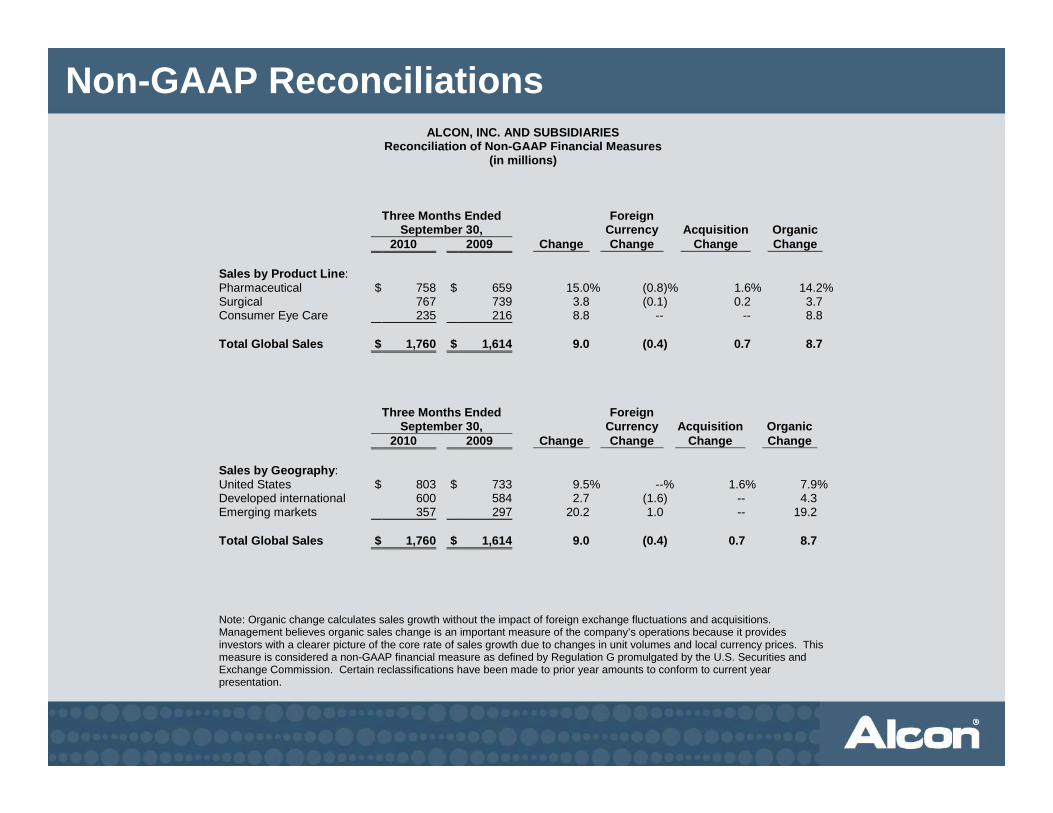
Sales by Product Line: Pharmaceutical $ 758 $ 659 15.0% (0.8)% 1.6% 14.2%Surgical 767 739 3.8 (0.1) 0.2 3.7 Consumer Eye Care 235 216 8.8 -- -- 8.8 Total Global Sales $ 1,760 $ 1,614 9.0 (0.4) 0.7 8.7
Three Months Ended Foreign
September 30, Currency Acquisition Organic 2010 2009 Change Change Change Change
Sales by Geography: United States $ 803 $ 733 9.5% --% 1.6% 7.9%Developed international 600 584 2.7 (1.6) -- 4.3 Emerging markets 357 297 20.2 1.0 -- 19.2 Total Global Sales $ 1,760 $ 1,614 9.0 (0.4) 0.7 8.7 Note: Organic change calculates sales growth without the impact of foreign exchange fluctuations and acquisitions. Management believes organic sales change is an important measure of the company’s operations because it provides investors with a clearer picture of the core rate of sales growth due to changes in unit volumes and local currency prices. This measure is considered a non-GAAP financial measure as defined by Regulation G promulgated by the U.S. Securities and Exchange Commission. Certain reclassifications have been made to prior year amounts to conform to current year presentation.

Non-GAAP ReconciliationsALCON, INC. AND SUBSIDIARIES
Reconciliation of Non-GAAP Financial Measures
Developed International Sales Reported Change
Foreign Currency Change
Acquisition
Change Organic Change
2006 8 6 % 0 1 % % 8 5 %2006 8.6 % 0.1 % -- % 8.5 %
2007 19.9 7.5 0.8 11.6
2008 18.0 6.7 2.8 8.5
2009 3.7 (3.2) -- 6.9
YTD Q3 2010 8.0 2.3 0.1 5.6
YTD Q3 2010 8.0 2.3 0.1 5.6
Emerging Market Sales Reported Change
Foreign Currency Change
Acquisition
Change Organic Change
2006 21.0 % 2.2 % -- % 18.8 %
2007 21.3 5.2 -- 16.1
2008 21.5 3.4 -- 18.1
2009 1.0 (10.2) -- 11.2
YTD Q3 2010 24 3 5 6 18 7 Note: Organic change presents sales growth without the impact of foreign exchange fluctuations and acquisitions. Management believes organic sales change is an important measure of the company’s operations because it provides investors with a clearer picture of the core rate of sales growth due to changes in unit volumes and local currency prices. This measure is considered a non-GAAP financial measure as defined by Regulation G promulgated by the U.S. Securities and
YTD Q3 2010 24.3 5.6 -- 18.7
measure is considered a non GAAP financial measure as defined by Regulation G promulgated by the U.S. Securities and Exchange Commission.

Non-GAAP Reconciliations
ALCON, INC. AND SUBSIDIARIES Reconciliation of Non-GAAP Financial Measures
Q3 2010 Sales Reported Change
Foreign Currency Change
Acquisition
Change Organic Change
Emerging markets 20.2 % 1.0 % -- % 19.2 % Ad d t h l
Advanced technology intraocular lenses 13.5 (0.1) -- 13.6
YTD 2010 Sales Reported Change
Foreign Currency Change
Acquisition
ChangeOrganic Change
Note: Organic change presents sales growth without the impact of foreign exchange fluctuations and acquisitions. Management believes organic sales change is an important measure of the company’s operations because it
g g g g Total Global Sales 12.2 % 1.9 % 0.4 % 9.9 %
provides investors with a clearer picture of the core rate of sales growth due to changes in unit volumes and local currency prices. This measure is considered a non-GAAP financial measure as defined by Regulation G promulgated by the U.S. Securities and Exchange Commission.