october 2015 - citibank · credit system overloaded with bad debts ... fed normalization fattens...
TRANSCRIPT

LOS PRODUCTOS DE INVERSIÓN: • NO ESTÁN ASEGURADOS POR LA FDIC • NO ESTÁN ASEGURADOS POR LA CDIC • NO ESTÁN ASEGURADOS POR EL GOBIERNO • NO TIENEN GARANTÍA BANCARIA • PUEDEN PERDER VALOR
El presente documento es de carácter informativo y de apoyo, no tiene carácter promocionalo de publicidad. Los Productos del Mercado de Valores de CIFS, son promovidos en Colombiapor Citivalores S.A Comisionista de Bolsa en virtud del contrato de Corresponsalía suscrito entre Citivalores S.A y CIFS de acuerdo con lo establecido en el Decreto 2555 de 2010 en materia de promoción de productos del mercado de valores de entidades del exterior. Si usted estuviere interesado en adquirir algún producto o servicio de CIFS la relación contractual que resulte dedicho interés se establece entre usted y CIFS, y se regirá por el respectivo contrato, manual,solicitud o condiciones, según el caso, documentos que contendrán entre otros aspectos la información detallada sobre las condiciones del producto y/o servicio.

Asset Class Focus
INVESTMENT AND INSURANCE PRODUCTS: NOT FDIC INSURED – NOT GOVERNMENT INSURED – NO BANK GUARANTEE – MAY LOSE VALUE
Charles Iragui
Equities October 2015

2 Refer to Important Information at the end of this presentation.
Equity View Summary Citi House Views: Equity Strategist & GIC Recommendations
All forecasts are expressions of opinion and are subject to change without notice and are not intended to be a guarantee of future events. The investor should not base its decision to enter
into a trade solely on the basis of the forecasts.
Global, Citi Research (Rob Buckland): DM growth solid, supporting earnings growth. Bull market is in late stage: on watch for signs of recession and end to the cycle. CDS-adjusted Dividend-Payers and Global Champions recommended. Value seen in Europe, Japan; UK expensive relative to others. Neutral to US and Emerging Markets (EM).
Global, Global Investment Committee (GIC): Favor stocks v. bonds. Overweight Developed Market (DM): Europe, US, Japan, UK (but neutral DM Asia and underweight Canada). Rationale: US growth acceleration and central bank stimulus in ex-US DM. EM overweight in China/Taiwan thru exposure to US growth, in India from reform. Brazil poor macro outlook leads to underweight.
Global SMID, GIC: Bullish on DM Small-Mid Cap (SMID), though all the overweight allocation goes to ex-US DM SMID: US SMID is neutral weighted due to valuation and late cycle.
US, Citi Research (Tobias Levkovich): Long-term Raging Bull thesis, based on flows, energy boom, real estate recovery. His yearend 2016 S&P500 target is 2,200 and its current trailing P/E of about 16.9x is around historical averages. However, Tobias is cautious near term, based on soft 1H15 earnings and Fed hike calendar. Favor: Tech (business spending ramping up), Financials (benefits from lending growth). Neutral: Energy, Utilities and Telecom. Disfavor: everything else as expensive.
US SMID, Citi Research (Scott Chronert): With less international exposure, volatility in small caps has fallen below large caps, and beta less than 1. This unusual circumstance joins seasonal factors to give a positive outlook thru yearend 2015.
US, GIC: Balanced approach across sectors but SMID at neutral. High US valuations relative to other markets can be weighed against better growth prospects than other DM regions and less exposure to global difficulties.
Europe, Citi Research (Jonathan Stubbs): Bull case: economic and earnings trough behind us, modest valuations. Recommend exposure to restructuring, recovery, quality, surplus cash flow and de-equitization. Risks: Russia crisis (energy cutoffs, blows to confidence), Greece debt negotiations (default, exit) and deflation pressures. Key catalyst: central bank QE and higher inflation; more QE expected in Oct/Dec.
Japan, Citi Research (Naoki Iizuka): He expects 15% EPS growth in 2015, after the 20% surge in 2014. A weak yen from policy loosening will likely help corporations. Within this bullish fundamental view: overweight financials, industrials, autos. Continued QE is critical to bullish view.
Europe/Japan, GIC: Eurozone exposure has long been premised on low valuations relative to historic averages. Europe/Japan overweight is based central bank stimulus leading to better growth and inflation; fiscal tightening would risk a costly policy error; more QE needed and expected in both.
EM, Citi Research (Markus Rosgen): Valuations remain low but macro landscape still worsening. We will likely see negative earnings revisions, especially in the commodity space: Asia, as a commodity consumer, is a relative winner. Similar impact from a stronger USD: a boost to Asia, with EMEA and LatAm being the losers. Overweight: China, Taiwan, Neutral: Mexico, and Underweight: Brazil, India, Indonesia, Chile.
Latam, Citi Research: EMEA and Asia have cheaper valuations, better ROE and higher free cash flow margins than Latam: but Latam free cash flow margins may be improving.
EM, GIC: All EM assets are under pressure from Fed hike prospects, leading to a small overweight, unlike a fuller overweight position in DM. Within EM, the GIC prefers Asian countries (China, Taiwan, India) with exposure to US growth and to reform agendas. Brazil has deteriorating domestic fundamentals and exposure to China growth risk.
Global Champions: a list of companies compiled by the global equity strategy team in consultation with sector analysts; companies that have had consistent revenue and earnings
performance through business cycles; less focused on current multiple.

3 Refer to Important Information at the end of this presentation.
Equity View Summary
Key Issues Eurozone, Japan QE: Bull Market dependent on central bank liquidity
− Quantitative Easing: Japan is expected to continue adding to its existing QE in early 2016; the ECB in Oct/Dec 2015.
US Growth Stability: Growth consistent at 2.6% in 2016 − Normalization: Fed policy normalization plans contingent on solid growth. Rate
hikes likely in spring 2016, but could be sooner. If China growth stumbles, rate hikes may be delayed. Global situation may have more impact on US growth than in the past.
− US as Global Catalyst: Growth outside US either still weak (DM ex-US) or softening (EM). US growth acceleration helpful for the rally to broaden globally.
Great Migration: Low DM rates pushing investors from fixed income − How fast: US 10-year 110bp move May to mid-September 2013 was a shock;
Citi forecast is 2.50% at end-2015 and 2.67% by end-2016 (current: 2.26%). − EM Sensitivity: EM stocks would likely be most challenged by higher US rates;
EM bonds sold off in 2013 shock, bringing down EM currencies and equities.
Earnings: Broadly higher around the globe − Global : The bottom-up consensus suggests that global EPS should continue
lifting off the EPS plateau of 2011-13. Global forecast is 9% growth for 2015. All regions are forecast positive EPS growth.
China: Credit system overloaded with bad debts − Total Social Credit: This measure has moved from a stable level before the
2008 financial crisis of about 1x GDP to currently about 2x. Government efforts to deleverage have caused growth softness and markets worry that this will tip the country into recession.
Russia: Simmering Geopolitical Risk − Europe Gas Imports: Europe depends extensively on Russia for energy,
especially gas. Conflict with Russia could lead to mutually damaging sanctions.
Oil: 50% fall in crude prices creates confusion, winners, and losers − Equities: Producers suffer immediately; importers may benefit only slowly.
Recommendations Europe: QE will likely send equities higher. Earnings are good but multiple expansions
will likely play a big role as well
Short Term US: Panic/Euphoria sentiment metric is giving strong buy signals. The Fed’s weak explanation for not hiking has added volatility. China’s economy is hard to understand, also adding volatility.
EM Lows: Weakening currencies favor EM exporters and US-oriented EM growth.
Medium Term: US stocks look to perform (Tobias: Raging Bull secular bull thesis)
− Energy Revolution: Fracking in oil and gas will make US net exporter of energy by 2020; Production, Distribution and Transformation stocks will likely benefit.
− Credit Rebound: Fed normalization fattens bank Net Interest Margin; deleveraging has made borrowers attractive; credit boom should ensue.
− Manufacturing Renaissance: Cheap gas, high tech plants, plentiful credit and better relative employee costs bringing manufacturing back to the US.
− Real Estate Return: Building still below replacement levels and family formation so far delayed; home prices have normalized; mortgages are still very cheap.
− Consumption Revival: Consumer has delevered; future labor force return could propel a virtuous economic cycle, likely including renewed family formation (boon for home renovation, child purchases).
CWMLA Overview
US Sector Outlook SummaryOverweight Neutral UnderweightFinancials Utilities Consumer DiscIT Telecom Health CareIndustrials Materials Consumer StaplesEnergy Indicate change from prior guidance.Source: Citi Research as of 12 October 2015.
All forecasts are opinions and are subject to change without notice and are not intended to guarantee future events

4 Refer to Important Information at the end of this presentation.
Citi Forecasts: EPS versus Price Targets
All forecasts are expressions of opinion and are subject to change without notice and are not intended to be a guarantee of future events. The investor should not base its decision to enter into a trade solely on the basis of the forecasts.
Are Profits Rising As Fast As Earnings? If 2015:
EPS growth < price growth = implied multiple expansion EPS growth > price growth = implied multiple contraction EPS growth = price growth = implied no change in multiple
Buying into easing multiples is ceteris paribus the more conservative move: lower multiples give better fundamental support.
Fundamentals Drive Results Over the Long Run; Earnings Per Share (EPS) v Price
Forecast 2015 EPS
Growth
Price 12/31/14
Target YE2015
Implied Forecast
Rise
Implied Multiple
ExpansionGlobal 9% MSCI AC 472 525 11.2% yesUS 3.3% S&P500 2,059 2,200 6.8% a littleJapan 15% Topix 1,408 1,650 17.2% a littleEuro xUK 10% Stoxx600 343 450 31.2% a lotUK 5-10% FTSE 6,566 7,700 17.3% yesEM 11% MSCI EM 956 1,100 15.1% yesBrazil 13% Bovespa 50,007 59,000 18.0% yesMexico 11% IPC 43,146 47,000 8.9% noSource: Citi Research, Bloomberg, as of September 2015.

5 Charts are for illustrative purposes only. Refer to Important Information at the end of this presentation. Bloomberg charts as of 12 October 2015.
Equities Focused on US Growth, Earnings Recovery and EM Risks
6008001000120014001600180020002200
51525354555657585
Sep 05 Sep 07 Sep 09 Sep 11 Sep 13 Sep 15
S&P 500 Index and Volatility
VIX Index (left scale) S&P 500 Index (right scale)Source: Bloomberg
-60
-30
0
30
60
90
-1.2
-0.6
0.0
0.6
1.2
1.8
Oct 90 Oct 95 Oct 00 Oct 05 Oct 10 Oct 15
US Panic/Euphoria Model (Other PE)
S&P 500 12-Month Forward Return (righ t scale) The Other PE (left scale)
Euphoria
Panic
Source: Citi Research as of 2 October 2015
All forecasts are expressions of opinion and are subject to change without notice and are not intended to be a guarantee of future events. The investor should not base its decision to enter into a trade solely on the basis of the forecasts.
Consensus EPS Estimates & Citi Targets for IndicesP/E EPS YoY % Div Yld End 2016 Target
9/24/15 15E 15E 15E Levels ReturnsGlobal (MSCI World) 445 16.8 4.4 2.5 535 20.2%Developed 17.4 3.1 2.5Emerging 786 12.6 13.3 2.7 980 24.7%US (S&P 500) 1,932 18.3 1.8 2.0 2,200 13.9%Europe (Euro Stoxx) 317 16.4 13.5 3.2 440 38.9%UK (FTSE 100) 5,961 16.4 -9.1 3.9 7,600 27.5%Japan (Topix) 1,427 13.4 7.3 3.1 1,850 29.6%China 58 9.7 30.1 1.6 93 61.3%India 25,864 16.0 5.0 3.2 NA N/ABrazil (Bovespa) 45,292 20.6 34.8 1.8 NA N/AMexico (Bolsa) 42,597 16.6 18.8 3.1 NA N/ARussia 769 13.4 69.8 3.7 NA N/A
P/E, EPS YoY% and Div Yld based on MSCI Indexes. 15E denotes 2015 Estimates. Source: MSCI, Citi Research, 2 October 2015.
Earnings Outlook: The outlook for earnings remains positive globally. US corporate earnings will likely continue to grow in 2015 and 2016, even as earnings have already hit record levels. Europe, EM and Japan earnings will keep rebounding, though China problems could weigh heavier ex-US.
US Outlook: Citi estimates US large caps and small caps will finish 2015 at new highs, primarily contingent on earnings expansion. The near-term outlook is clouded as valuations are rich and the Fed might hike rates.
Emerging Markets: We would focus on countries with exposure to US growth, reform agendas, robust GDP expansion and solid expected earnings growth in 2016. US rate rises, a weak yen (and yuan) and sluggish DM imports are weighing on earnings and cheap valuations.
Japan/Europe: Central bank liquidity will likely support Eurozone and Japan earnings and equity prices. Politics (Greece) and geopolitics (Russia) are the principal risks in Europe; policy mistakes in Japan.
The 12-Month Forward Return indicates the 1-year return recorded from a specified date.
6 Charts are for illustrative purposes only. Refer to Important Information at the end of this presentation. Bloomberg charts as of 12 October 2015.
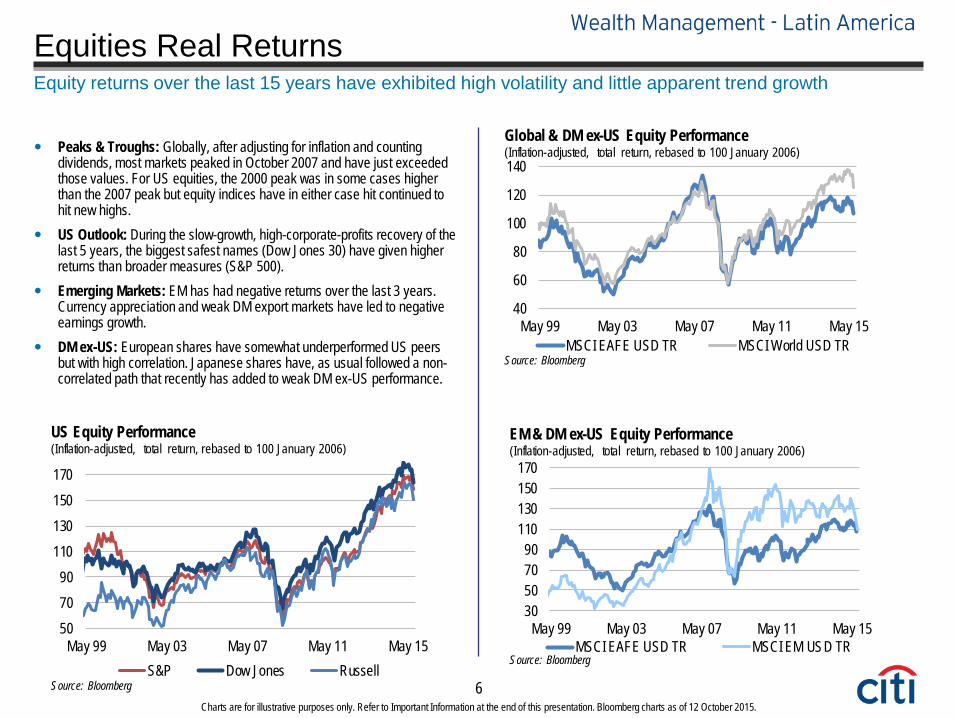
Equities Real Returns Equity returns over the last 15 years have exhibited high volatility and little apparent trend growth
Peaks & Troughs: Globally, after adjusting for inflation and counting dividends, most markets peaked in October 2007 and have just exceeded those values. For US equities, the 2000 peak was in some cases higher than the 2007 peak but equity indices have in either case hit continued to hit new highs.
US Outlook: During the slow-growth, high-corporate-profits recovery of the last 5 years, the biggest safest names (Dow Jones 30) have given higher returns than broader measures (S&P 500).
Emerging Markets: EM has had negative returns over the last 3 years. Currency appreciation and weak DM export markets have led to negative earnings growth.
DM ex-US: European shares have somewhat underperformed US peers but with high correlation. Japanese shares have, as usual followed a non-correlated path that recently has added to weak DM ex-US performance.
507090
110130150170
May 99 May 03 May 07 May 11 May 15S&P Dow Jones Russell
Source: Bloomberg
US Equity Performance(Inflation-adjusted, total return, rebased to 100 January 2006)
40
60
80
100
120
140
May 99 May 03 May 07 May 11 May 15MSCI EAFE USD TR MSCI World USD TR
Source: Bloomberg
Global & DM ex-US Equity Performance(Inflation-adjusted, total return, rebased to 100 January 2006)
30507090
110130150170
May 99 May 03 May 07 May 11 May 15MSCI EAFE USD TR MSCI EM USD TR
Source: Bloomberg
EM & DM ex-US Equity Performance(Inflation-adjusted, total return, rebased to 100 January 2006)

7 Refer to Important Information at the end of this presentation.
Equities Valued Against Earnings Equity value should theoretically track earnings
Theory and Practice: The fit to earnings is not always strong as theory would suggest. Corporate governance (can the minority shareholder derive a fair share of the profit) and government regulation (can the owners hold onto the profits) probably account for much of the looseness of fit.
US : The US exhibits the most clear trend in profit and value growth. The euphoria surrounding the Tech Bubble is visible. Since that time value has become much better supported by earnings.
Germany: Germany experienced less of a divergence between earnings and value during the Tech Bubble period and now seems to have quite supportive, peak earnings levels.
Japan: Trends in Japanese earnings have completely broken down since 1989, making investor frustration with price performance understandable.
5
50
60
600
Dec 69 Dec 79 Dec 89 Dec 99 Dec 09MSCI USA MSCI USA EPS (RHS)
Source: MSCI
US Equity Performance vs Earnings(log scale)
760
600
Dec 69 Dec 79 Dec 89 Dec 99 Dec 09MSCI Japan MSCI Japan EPS (RHS)
Source: MSCI
Japan Equity Performance vs Earnings(log scale)
4
40
60
600
Dec 69 Dec 79 Dec 89 Dec 99 Dec 09MSCI Germany MSCI Germany EPS (RHS)
Source: MSCI
Germany Equity Performance vs Earnings(log scale)
Charts are for illustrative purposes only. MSCI data as of 24 September 2015.

8 Refer to Important Information at the end of this presentation.
Equities Valued Against Earnings Equity returns over the last 15 year have exhibited high volatility and little apparent trend growth
Theory and Practice: The fit to earnings is not always strong as theory would suggest. Corporate governance (can the minority shareholder derive a fair share of the profit) and government regulation (can the owners hold onto the profits) probably account for much of the looseness of fit.
US : The US exhibits the most clear trend in profit and value growth. The euphoria surrounding the Tech Bubble is visible. Since that time value has become much better supported by earnings. The most recent couple of years show greater dependence on multiple expansion, a sign the bull may be aging, making the value of market timing rise (sell before recession).
Germany: Germany experienced less of a divergence between earnings and value during the Tech Bubble period and through 2013 prices were well supported fundamentally. Recent negative trends show the dependence on ECB exceptional policy.
Japan: Japanese EPS exploded on QE in late 2012, supporting the sharp run-up in equities. More gains will likely need more QE and a lower yen.
30
50
70
90
110
130
600
900
1200
1500
1800
2100
Aug 97 Aug 03 Aug 09 Aug 15MSCI USA MSCI USA EPS (RHS)
Source: MSCI
US Equity Performance vs Earnings(index points)
-20
0
20
40
400
600
800
1000
Aug 97 Aug 03 Aug 09 Aug 15MSCI Japan MSCI Japan EPS (RHS)
Source: MSCI
Japan Equity Performance vs Earnings(index points)
10
40
70
300
600
900
Aug 97 Aug 03 Aug 09 Aug 15MSCI Germany MSCI Germany EPS (RHS)
Source: MSCI
Germany Equity Performance vs Earnings(index points)
Charts are for illustrative purposes only. MSCI data as of 24 September 2015.

9 Refer to Important Information at the end of this presentation.
Equities Valued Against Earnings Price / Earnings are lower than in the tech bubble, but have recovered from lows of the Lehman crisis
Charts are for illustrative purposes only. MSCI data as of 24 September 2015.

10 Charts are for illustrative purposes only. Refer to Important Information at the end of this presentation. Bloomberg charts as of 12 October 2015.
Eurozone Weakness & ECB QE The German Yield Curve now looks like stagnant Japan’s, But Citi is bullish on Eurozone Inflation Prospects
Japan Sickness: For decades Japan has been in a deflation trap: expectations of falling prices have depressed activity and led to near zero rates across the curve. And in real terms the rates might not be so low, given even negative inflation expectations.
US Exceptional Policy: Fed QE was specifically aimed at avoiding this outcome in the US: Cut rates aggressively and inject liquidity to keep up inflation expectations and maintain an upward sloping curve, encouraging lending and activity. The UK had very similar policies.
Eurozone Falling Into the Trap: The ECB for various reasons (legal, cultural, moral hazard) had refused to engage in QE and it shows in the yield curve: closer to Japan than the US/UK. New ECB QE (just as BoJ QE since late 2012) is aimed at pushing up the curve
Citi Economists are Bullish on Eurozone Inflation: Citi believes that QE will be executed effectively. The US and Eurozone inflation will begin to move higher, closer to the 2% inflation policy ideal. For that to happen, though, Citi economists see the ECB increasing its QE, in late 2015.
-1.00.01.02.03.0
Jan 00 Jan 04 Jan 08 Jan 12 Jan 16EU Observed EU ForecastUS Observed US ForecastMonetary Policy Goal
Source: Bloomberg, Citi Research, as of 23 September 2015
Inflation(%)
-0.50.00.51.01.52.02.5
1 2 3 4 5
German Government Yield Curves(%)
Last 20-Apr-15 Start 2015 Start 2014Source: Bloomberg
3-mo 2-yr 5-yr 10-yr 30-yr
77
26
68
177
Last20-Apr-15Start 2015Start 2014Source: Bloomberg
German Government Yield Curve Steepness(10-yr yield minus 3-mo yield, in basis points)
All forecasts are opinions and are subject to change without notice and are not intended to guarantee future events

11 Charts are for illustrative purposes only. Refer to Important Information at the end of this presentation. Bloomberg charts as of 12 October 2015.
The Fed Not In a Rush to Normalize
All forecasts are expressions of opinion and are subject to change without notice and are not intended to be a guarantee of future events. The investor should not base its decision to enter into a trade solely on the basis of the forecasts.
0.00%
1.00%
2.00%
3.00%
4.00%
Jan 13 Jul 13 Jan 14 Jul 14 Jan 15 Jul 15FF Future Dec 2015 FF Future Dec 2016Fed Forecast Dec 2015 Fed Forecast Dec 2016Fed Forecast Long Run
Source: Bloomberg
Fed Funds Futures(%)
After its September 2013 reversal on Tapering, the Fed has not regained Market confidence on Rate Hikes
See CWMLA Citi Market View: Fed Hike Uncertainty
1
2
3
4
5
6
7
8
Aug 00 Aug 03 Aug 06 Aug 09 Aug 12 Aug 1530-Y Mort. Real Mort.30-Y Mort. - Ave. PCE 4Q16 Mort. ForecastAve. 30-Y Mort. 1/1992 to 1/2001
Source: Bloomberg. Note: "Real Mortgage Rate" is 30-Year Fixed minus PCE Core.Note: "Ave. PCE" is the mean of PCE Core between Dec 1988 to Dec 2014.
Mortgage Costs(%)

12 Charts are for illustrative purposes only. Refer to Important Information at the end of this presentation. Bloomberg charts as of 12 October 2015.
The Fed Not In a Rush to Normalize One Lesson from the Taper Tantrum of May-September 2013: EM Equities are more sensitive to the Fed
850
900
950
1000
1050
1100
1150
0.00%
0.25%
0.50%
0.75%
1.00%
1.25%
1.50%
Jan 13 Jul 13 Jan 14FF Future Dec 2015 Fed Forecast Dec 2015MSCI EM Index
Source: Bloomberg
Fed Funds Futures v EM Stock Performance(%, Index Points)
1400
1500
1600
1700
1800
1900
2000
0.00%
0.25%
0.50%
0.75%
1.00%
1.25%
1.50%
Jan 13 Jul 13 Jan 14FF Future Dec 2015 Fed Forecast Dec 2015S&P500 Index
Source: Bloomberg
Fed Funds Futures v US Stock Performance(%, Index Points)
All forecasts are opinions and are subject to change without notice and are not intended to guarantee future events

13 Charts are for illustrative purposes only. Refer to Important Information at the end of this presentation. Bloomberg charts as of 12 October 2015.
Sector Outlook
Global Sector Outlook in Detail Rob Buckland believes it makes sense for sector strategy to have a
pro-cyclical tilt, as cheap oil should help consumption. His sector model reflects a tilt towards sectors with decent EPS
momentum and reasonable valuations. This favors Financials across the globe. It also favors IT (especially in US) and Healthcare (particularly outside the US).
Energy has been upgraded as distressed pricing makes the sector looked fairly valued, though oil prices looks set to stay persistently low .
US Sector Outlook in Detail Tobias Levkovich has had a preference for sectors benefiting from a
pickup in capital investment (IT) and lending (Financials). Industrials point to Tobias’s conviction that the business cycle in the
US is not over. Materials upgrade from underweight is a significant call for a cyclical sector that has underperformed.
Energy is a new overweight, another significant call, though less a cyclical signal (the sector is more coincident than leading, so not really part of the cyclical tilt). Value is now attractive for survivors.
Global Sector Outlook SummaryOverweight Neutral UnderweightIT Materials Consumer StaplesFinancials Industrials UtilitiesHealth Care TelecomsConsumer Disc Energy Indicate change from prior guidance.Source: Citi Research as of 2 October 2015.
US Sector Outlook SummaryOverweight Neutral UnderweightFinancials Utilities Consumer DiscIT Telecom Health CareIndustrials Materials Consumer StaplesEnergy Indicate change from prior guidance.Source: Citi Research as of 12 October 2015.
All forecasts are opinions and are subject to change without notice and are not intended to guarantee future events

14 Charts are for illustrative purposes only. Refer to Important Information at the end of this presentation. Bloomberg charts as of 12 October 2015.
Sector Outlook: Oil
Oil Breaks Lower, After Years of Relative Stability Crude prices had traded within a range over much of the past 5
years, with US Energy trading close to the S&P500 through the summer of 2014. Neither the S&P500 nor the MSCI EM performance had shown much correlation to oil: S&P500 traded higher despite high oil prices and EM has traded within its own range regardless of the recent oil tumble.
Cheaper oil has many winners and losers but a general comment can be made: the negative shock of price moves lower occurs more quickly than the benefits show up in the global economy.
Oil Shock No surprise that the Energy sector has fallen with its main underlying
commodity (crude oil), but the magnitude has been smaller, as the sector’s range of business activities extends far beyond mere extraction and ownership of reserves of crude.
The price movement in EM has been more correlated to the behavior of the Energy sector. Energy is well represented in EM (though in Latam mostly by economic effect as energy exporters: oil companies are frequently national) but EM suffers from the Contagion factor and from fragile macroeconomics.
50
75
100
125
150
175
200
Sep 10 Sep 11 Sep 12 Sep 13 Sep 14 Sep 15
S&P500 MSCI EM WTI Crude S&P Energy
Source: Bloomberg. Note: all indices are Total Return.
S&P500 Selected Sectors(weekly, rebased to 100 on 31 Dec 2009)
30
65
100
Jun 14 Aug 14 Oct 14 Dec 14 Feb 15 Apr 15 Jun 15 Aug 15
S&P500 MSCI EM WTI Crude S&P Energy
Source: Bloomberg. Note: the equity indices are Total Return.
S&P500 Selected Sectors(weekly, rebased to 100 on 30 Jun 2014)
WTI Crude is an indicative price and cannot be directly invested in

15 Charts are for illustrative purposes only. Refer to Important Information at the end of this presentation. Bloomberg charts as of 12 October 2015.
US Sectors
All forecasts are expressions of opinion and are subject to change without notice and are not intended to be a guarantee of future events. The investor should not base its decision to enter into a trade solely on the basis of the forecasts.
0
50
100
150
200
250
Dec 06 Dec 08 Dec 10 Dec 12 Dec 14S&P500 S&P Pharma Bio TechS&P Homebuilders S&P FinancialsS&P REIT S&P Info Tech
Source: Bloomberg. Note: all indices are Total Return.
S&P500 Selected Sectors(monthly, rebased to 100 on 31 Dec 2006)
Innovation Sectors Have Dominated US Equities In the aftermath of the 2008 financial crisis, real estate and finance
have rebounded weakly, while innovative sectors Bio Tech and Info Tech have exceeded the strong performance of the broader market.
We believe that abundant credit continues to favor innovation in the near term. But the onset of a Fed tightening cycle should make investors vigilant for signs of business cycle turns.
US Market Resilience S&P500 movement higher has stalled:
Solid earnings (Citi: +7% 2015 EPS for S&P500) US equities losing leadership (QE) Expectation that DM central bank policy divergence will
drive the dollar higher (negative effect on mega cap EPS).
95
100
105
110
115
120
125
Oct-14 Dec-14 Feb-15 Apr-15 Jun-15 Aug-15 Oct-15Financials HealthcareIndustrials TechSmall Cap Growth S&P500
Source: Bloomberg
S&P500 v Selected Sector Performances(rebased to 100, 1 October 2014)

16 Charts are for illustrative purposes only. Refer to Important Information at the end of this presentation. Bloomberg charts as of 12 October 2015.
The Credit/Equity Cycle
Source: Citi Investment Research
Phase 1
Immature Bull
Phase 2
Phase 3
Phase 4
Credit Equities
Credit Equities
Credit Equities
Credit Equities
Mature Bull Historical Patterns Don’t Count Any Longer? The above schema diagrams a business-cycle driven asset pricing norm.
− As a recovery takes hold, investors first seek debt as less risky than equity (and companies focus on strengthening their balance sheets, favoring creditors). − Next, as investor confidence rises, investors push equities higher in sync with debt. − As the Bull Market matures, investors lose interest in fixed income returns and favor equity (and companies begin raising dividends and buybacks, favoring equity holders). − As the business cycle enters recession, investors dump corporate assets, as earnings fall and bankruptcies rise.
The recovery since 2009 has not been normal: low growth, continuing high unemployment, household deleveraging, exceptional Fed support (QE drives down credit costs). However, as rates begin to rise, we may be entering a Mature Bull, meaning equity holders should be aggressive, but attentive to initial signs of recessionary trends. Watch US Labor Force Participation: if the labor force broadens, the recovery can extend longer.
Recovery
Recession

17 Charts are for illustrative purposes only. Refer to Important Information at the end of this presentation. Bloomberg charts as of 12 October 2015.
Citi Private Bank Asset Allocations: Our Active Stance Adaptive Valuation Strategies (AVS) and Global Investment Committee (GIC)
Our Active Tactical Stance on Asset Allocation Tilt Toward Risk: overweight equities, underweight to fixed
income. Underweight to High Grade (HG) corporate debt,
overweight High Yield (HY) bonds (US and especially European).
Large underweight to developed markets (DM) sovereign debt and small underweight to emerging markets (EM) debt.
Overweight DM equities (Europe large and small/mid cap, UK, US large, Japan). Small overweight EM North Asia equities (China, Taiwan, India). Small underweight Brazil. Neutral US SMID.
Change to Tactical Asset Allocation Due to richer spreads to sovereign debt, HG has been
lifted to overweight. Funding for this move comes mostly from cash and less from HY.
The shift from HY to HG expresses the GIC’s desire to move away from risky assets over time.
The cash reduction should not add to risk as HG will have diversifying benefits to the portfolio (hedge to economic weakness).
October 2015 Over/Underweights: with AlternativesLevel 1 Level 2 Level 3 Level 4 Level 5
Cash 0.0% 0.0% 0.0% 0.0% 0.0%Fixed Income -2.2% -3.7% -5.5% -6.0% 0.0%Developed Sovereign FI -5.5% -6.7% -5.9% -4.0% 0.0%North America -0.6% -0.9% -1.1% -1.0% 0.0%Europe -1.8% -2.3% -2.1% -1.6% 0.0%Asia ex Japan -0.1% -0.1% -0.1% 0.0% 0.0%Japan -3.2% -3.6% -2.6% -1.3% 0.0%Supranational/Agencies 0.1% 0.1% 0.0% -0.1% 0.0%Developed Investment Grade FI 2.0% 1.6% -0.1% -1.9% 0.0%Developed High Yield FI 1.5% 1.7% 1.0% 0.2% 0.0%Emerging Market FI -0.2% -0.3% -0.5% -0.2% 0.0%Emerging Market Asia FI 0.0% 0.0% -0.1% -0.1% 0.0%Emerging Market EMEA FI -0.1% -0.2% -0.3% -0.1% 0.0%Emerging Market LatAm FI 0.0% -0.1% -0.1% 0.0% 0.0%Equities 2.2% 3.7% 5.5% 6.0% 0.0%Developed Market EQ 1.9% 3.1% 4.6% 4.9% -0.3%North America Large Cap 0.9% 1.4% 1.7% 1.6% -1.2%North America Small/Mid Cap 0.1% 0.1% 0.0% -0.1% -0.7%Europe Equities 0.6% 1.2% 2.2% 2.6% 1.4%Japan Equities 0.2% 0.4% 0.7% 0.8% 0.5%Asian Equities 0.1% 0.1% 0.0% -0.0% -0.3%Emerging Markets EQ 0.3% 0.5% 0.9% 1.0% 0.3%Emerging Latin America Equities 0.0% -0.1% -0.4% -0.6% -0.9%Emerging EMEA Equities 0.0% 0.0% 0.0% 0.0% -0.2%Emerging Asia Equities 0.2% 0.6% 1.3% 1.7% 1.4%Hedge Funds 0.0% 0.0% 0.0% 0.0% 0.0%Precious Metals 0.0% 0.0% 0.0% 0.0% 0.0%Total 0.0% 0.0% 0.0% 0.0% 0.0%Source: Citi Private Bank's Global Investment Committee, 23 September 2015

18 Charts are for illustrative purposes only. Refer to Important Information at the end of this presentation. Bloomberg charts as of 12 October 2015.
Citi Forecasts versus Consensus
All forecasts are expressions of opinion and are subject to change without notice and are not intended to be a guarantee of future events. The investor should not base its decision to enter into a trade solely on the basis of the forecasts.
Policy Rate 10Y Sov2015F 2016F 2015F 2016F 4Q16F 4Q16F
United States Citi 2.5% 2.6% 0.3% 1.6% 1.00% 2.30%Consensus 2.5% 2.7% 0.3% 2.0% 0.55% 2.47%
Japan Citi 0.6% 1.2% 0.8% 0.5% 0.10% 0.50%Consensus 0.7% 1.2% 0.8% 1.0% 0.10% 0.46%
Euro Area Citi 1.5% 1.5% 0.1% 1.1% 0.05% 0.80%Consensus 1.4% 1.7% 0.1% 1.2% 0.05% NA
United Kingdom Citi 2.6% 2.5% 0.1% 1.1% 0.75% 2.00%Consensus 2.6% 2.4% 0.2% 1.5% 0.50% 2.13%
China Citi 6.8% 6.3% 1.5% 1.9% 1.50% 3.70%Consensus 6.9% 6.5% 1.6% 2.0% 4.45% 3.43%
Brazil Citi -2.7% -1.1% 8.8% 7.4% 14.25% 14.38%Consensus -2.4% -0.5% 8.8% 6.2% 14.25% NA
Mexico Citi 2.3% 2.8% 2.8% 3.8% 3.75% 6.50%Consensus 2.4% 3.1% 2.9% 3.5% 3.25% 6.28%
Source: Citi Research, 23 September 2015. Consensus from Bloomberg.
GDP Growth CPI Inflation

19 Charts are for illustrative purposes only. Refer to Important Information at the end of this presentation. Bloomberg charts as of 12 October 2015.
Performance Monitor Equity and Asset Performance
Notable Data 2014 was a Tough Year Outside the US: An improving economy gave fundamental support in the US, but Europe was hurt by economic slowdown
and stimulus in Japan wasn’t enough. This year ex-US DM is catching up, and with QE flowing this could continue, despite currency losses. Latam Still Suffering: LatAm underperformed in 2014 and so far this year even among weak EM: soft commodities, Fed normalization, weak
domestic demand. These are indicative prices/yields and cannot be directly invested in.
Equity Indices (Changes in %, USD Terms) Fixed Income Indices (Changes in %, BarCap)Last Close 1-wk 1-mo YTD 2014 2013 2012 Last Close 1-wk 1-mo YTD 2014 2013 2012
S&P500 2,017 1.5% 2.9% -2.0% 11.4% 29.6% 13.4% US Gov t 2,111 -0.2% 0.5% 1.6% 4.9% -2.6% 2.0%Dow Jones Industrial 17,132 2.1% 4.3% -3.9% 7.5% 26.5% 7.3% US High Grade 724 0.5% 0.4% -0.6% 7.9% -0.9% 11.1%Nasdaq Composite 4,839 1.2% 0.3% 2.2% 13.4% 38.3% 15.9% US High Yield 1,615 2.0% -1.1% -0.4% 2.5% 7.4% 15.8%Russell2000 1,164 2.0% 0.6% -3.3% 3.5% 37.0% 14.6% Euro Agg Gov t 249 1.4% 1.6% -4.8% -1.3% 6.7% 12.3%FTSE100 6,371 2.5% 3.7% -4.4% -8.5% 16.7% 10.8% Global EM 341 1.0% 0.7% 1.2% 0.5% -2.2% 4.8%Topix 1,515 3.7% 2.7% 6.9% -4.9% 24.1% 5.5% FedFund Future Dec 15 0.19% 0.19% 0.28% 0.61% 0.74% 0.57% NAEuroStox x 600 362 2.7% 2.0% -0.7% -8.4% 22.6% 16.5% FedFund Future Dec 16 0.65% 0.62% 0.81% 1.56% 1.95% NA NARussia RTSI 876 8.9% 9.7% 10.8% -45.2% -5.5% 10.5% Rates (Changes in Basis Points)India Sensex 26,904 1.0% 7.7% -4.5% 27.1% -3.5% 21.8% Last Close 1-wk 1-mo YTD 2014 2013 2012China Shanghai 3,288 8.3% 3.6% -0.2% 49.1% -3.9% 4.2% UST 2-Year 0.64 3 -7 -3 28 13 1Brazil Bov espa 49,338 8.1% 9.8% -30.4% -13.4% -26.8% -2.0% UST 5-Year 1.40 6 -12 -26 -9 102 -11Mex ico Bolsa 44,314 3.4% 6.0% -7.9% -10.3% -3.5% 27.0% UST 10-Year 2.09 3 -10 -8 -86 127 -12MSCI Emerging Markets 865 5.4% 7.8% -9.5% -4.6% -5.0% 15.1% Currencies (Currency versus USD, Changes in %)MSCI World 405 2.6% 3.4% -2.9% 2.1% 20.3% 13.4% Last Close 1-wk 1-mo YTD 2014 2013 2012Sectors (Changes in %) Euro 1.14 1.5% 0.2% -6.1% -12.0% 4.2% 1.8%
Last Close 1-wk 1-mo YTD 2014 2013 2012 Pound 1.53 1.3% -0.5% -1.5% -5.9% 1.9% 4.6%S&P500 REITS 186 1.6% 7.9% -1.2% 26.1% -2.2% 15.9% Yen 120 0.3% 0.5% -0.3% -12.0% -17.6% -11.3%S&P500 Homebuilding 720 0.5% -2.3% 10.9% 10.5% 8.9% 102.8% Sw iss 0.96 1.3% 0.7% 3.3% -10.2% 2.5% 2.6%S&P500 Info Tech 698 1.7% 3.4% 0.9% 18.2% 26.2% 13.1% Brazilian Real 3.76 4.0% 2.9% -29.6% -10.8% -13.2% -9.1%S&P500 Financials 314 0.4% 1.0% -5.9% 13.1% 33.2% 26.3% Mex ican Peso 16.46 2.0% 2.3% -10.4% -11.7% -1.4% 8.5%S&P500 Metals & Mining 82 4.7% 6.9% -29.3% -16.5% -2.1% -12.8% Commodities (Changes in %)S&P500 Energy 501 3.6% 8.6% -14.6% -10.0% 22.3% 2.3% Last Close 1-wk 1-mo YTD 2014 2013 2012S&P500 Industrials 463 3.2% 4.7% -4.8% 7.5% 37.6% 12.5% WTI 47.1 1.8% 5.5% -11.6% -45.9% 7.2% -7.1%S&P500 Consumer Discretion 620 1.5% 3.7% 8.2% 8.0% 41.0% 21.9% LME Copper 5,310 2.3% -1.5% -16.6% -13.7% -6.7% 4.2%S&P500 Consumer Staples 509 2.0% 6.0% 1.9% 12.9% 22.7% 7.5% Gold 1,164 2.5% 5.1% -1.8% -1.7% -28.0% 7.1%S&P500 Healthcare 793 0.2% -2.6% 0.1% 23.3% 38.7% 15.2% Silv er 15.8 1.1% 8.4% 0.8% -19.3% -35.8% 9.0%S&P500 Pharma Biotech Life 747 -0.2% -3.3% -2.2% 22.3% 41.6% 15.9% CBOT Corn 3.81 -3.2% -1.6% -9.6% -9.5% NA NAS&P500 Utilities 225 0.7% 7.2% -6.5% 24.3% 8.8% -2.9% CBOT Soy beans 8.88 0.4% 1.5% -11.7% -10.8% NA NA
Source: Bloomberg as of market close of 12-Oct-2015
Past performance is not indicative of future return. Real results may vary.

20 Charts are for illustrative purposes only. Refer to Important Information at the end of this presentation. Bloomberg charts as of 12 October 2015.
Equity Asset Class Performance The Case for Diversification (USD Total Returns)
2007 2008 2009 2010 2011 2012 2013 2014 2015 YTDMSCI LatAm Index50.4%
Topix Index-25.8%
MSCI LatAm Index103.8%
DJ Equity REIT Index27.7%
DJ Equity REIT Index7.5%
Eurostox x 50 Index20.2%
Russell 2000 Small Cap Index38.8%
DJ Equity REIT Index28.0%
Topix Index8.8%
MSCI Emerging Markets39.4%
Russell 2000 Small Cap Index-33.8%
MSCI Emerging Markets78.5%
Russell 2000 Small Cap Index26.9%
S&P 500 Large Cap Index2.1%
DJ Equity REIT Index19.6%
S&P 500 Large Cap Index32.4%
S&P 500 Large Cap Index13.7%
DJ Equity REIT Index0.5%
Eurostox x 50 Index21.2%
S&P 500 Large Cap Index-37.0%
FTSE Index41.1%
MSCI Emerging Markets18.9%
FTSE Index-2.7%
MSCI Emerging Markets18.2%
Eurostox x 50 Index27.0%
Russell 2000 Small Cap Index4.9%
S&P 500 Large Cap Index-0.4%
FTSE Index8.8%
DJ Equity REIT Index-37.6%
Eurostox x 50 Index29.1%
S&P 500 Large Cap Index15.1%
Russell 2000 Small Cap Index-4.2%
Russell 2000 Small Cap Index16.3%
Topix Index26.5%
MSCI Emerging Markets-2.2%
Eurostox x 50 Index-0.8%
S&P 500 Large Cap Index5.5%
Eurostox x 50 Index-44.9%
DJ Equity REIT Index28.5%
MSCI LatAm Index14.7%
Topix Index-11.9%
S&P 500 Large Cap Index16.0%
FTSE Index21.0%
Topix Index-3.0%
FTSE Index-1.4%
Russell 2000 Small Cap Index-1.6%
FTSE Index-47.3%
Russell 2000 Small Cap Index27.2%
Topix Index14.1%
Eurostox x 50 Index-16.7%
FTSE Index15.2%
DJ Equity REIT Index2.7%
FTSE Index-5.3%
Russell 2000 Small Cap Index-2.4%
Topix Index-6.2%
MSCI LatAm Index-51.4%
S&P 500 Large Cap Index26.5%
FTSE Index8.7%
MSCI Emerging Markets-18.4%
MSCI LatAm Index8.7%
MSCI Emerging Markets-2.6%
Eurostox x 50 Index-8.7%
MSCI Emerging Markets-8.3%
DJ Equity REIT Index-15.6%
MSCI Emerging Markets-53.3%
Topix Index5.2%
Eurostox x 50 Index-9.4%
MSCI LatAm Index-19.4%
Topix Index8.1%
MSCI LatAm Index-13.4%
MSCI LatAm Index-12.3%
MSCI LatAm Index-20.4%
Source: Bloomberg, 12 Oct 2015

21 Charts are for illustrative purposes only. Refer to Important Information at the end of this presentation. Bloomberg charts as of 12 October 2015.
Brazilian Bovespa: The Bovespa Index is a gross total return index weighted by traded volume and is comprised of the most liquid stocks traded on the Sao Paulo Exchange. The
Bovespa Index has been divided 10 times by a factor of 10 since Jan 1, 1985: 12/02/85, 08/29/88, 04/14/89, 01/12/90, 05/28/91, 01/21/92, 01/26/93, 08/27/93, 02/10/94, and 03/03/97.
Citigroup Global Markets High Yield Market Index: The High-Yield Market Index includes cash-pay, deferred-interest, and Rule 144A bonds with remaining maturities of at least one
year and a minimum amount outstanding of $100 million. The issuers must be domiciled in the United States or Canada for consideration in this index.
Citigroup Global Emerging Market Sovereign Bond Index: The Global Emerging Market Sovereign Bond Index (ESBI) includes Brady bonds and US dollar-denominated emerging
market sovereign debt issued in the global, Yankee, and Eurodollar markets excluding loans. The ESBI offers diversification benefits with respect to the geographical and asset class
dimensions. It comprises debt in Africa, Asia, Europe, and Latin America.
CPI Inflation: Consumer Price Index (CPI) - The CPI, as it is called, measures the prices of consumer goods and services and is a measure of the pace of US inflation. The US
Department of Labor publishes the CPI every month.
Core & Periphery Europe: The Eurozone is commonly divided into “core” (Germany, France and other northern nations with strong economies) and “periphery” (Italy, Spain, Portugal,
Greece and other southern nations with weak economies)..
Currency Abbreviations: AUD: Australia; NZD: New Zealand; NOK: Norway; GBP: UK; EUR: Euro Zone; SEK: Sweden; CAD: Canada; CHF: Switzerland; JPY: Japan; ZAR: South
Africa; PLN: Poland; BRL: Brazil; RUB: Russia; KRW: Korea; TRY: Turkey; MXN: Mexico; CNY: China; INR: India
DJIA: Dow Jones Industrial Average - The best known U.S. index of stocks. A price-weighted average of 30 actively traded blue-chip stocks, primarily industrials including stocks that
trade on the New York Stock Exchange. The Dow, as it is called, is a barometer of how shares of the largest US companies are performing.
DXY Index: The DXY Index represents a basket of currencies, giving a price level for the US dollar.
Event Driven: In the context of hedge funds, a style of management that combines many different types of hedge fund investing such as merger arbitrage, distressed securities and high
yield investing, in conjunction with an important "event" that is supposed to unlock firm value (like a merger announcement, earnings announcement, or a regulator decision).
Fiscal Balance: The Fiscal Balance represents the difference between General Government revenues over expenses. It includes capital expenditure, but excludes depreciation.
Global Macro: Directional Macro strategies frequently employ leverage and may trade futures, options on future contracts and foreign exchange contracts as well as trade in diversified
markets or focus on one market sector. Two types of strategies employed by directional macro managers are discretionary and systematic trading.
Industrial Production: Measures the output of the industrial sector of an economy. The industrial sector includes manufacturing, mining, and utilities.
LIBOR: London Interbank Offered Rate - A short-term interest rate often quoted as a 1,3,6-month rate for U.S. dollars.
Managed Futures: In the context of hedge funds, a style of management that focuses on short-term trading in the futures market.
Mexican Bolsa: A capitalization weighted index of the leading stocks traded on the Mexican Stock Exchange. The index was developed with a base level of .78 as of October 30, 1978.
Glossary

22 Charts are for illustrative purposes only. Refer to Important Information at the end of this presentation. Bloomberg charts as of 12 October 2015.
Glossary (Cont’d) MSCI World Consumer Discretionary Price Index: An index measuring the performance of the Consumer Discretionary equities of developed countries including U.S.; a useful
benchmark for global funds.
MSCI World Free Index: An index measuring the performance of equities of developed and EM countries; a useful benchmark for global funds.
Nikkei 225 Index: Applies mainly to international equities. Price-weighted average of 225 stocks of the first section of the Tokyo Stock Exchange started on May 16, 1949. Japanese
equivalent of the US Dow.
PMI: Purchasing Managers Index is a measure of manufacturing activity, in which a read of greater than 50 indicates manufacturing expansion and less than 50, contraction.
ROE: Return on Equity is a measure of corporate financial performance, with profit as a numerator and capital as a denominator.
Russell Top 200 Growth Index: A market capitalization-weighted benchmark index made up of the largest 200 US companies by market cap that exhibit growth characteristics.
Russell Top 200 Value Index: A market capitalization-weighted benchmark index made up of the largest 200 US companies by market cap that exhibit value characteristics.
Russell 2000 Index: A market capitalization-weighted benchmark index made up of the 2000 smallest US companies in the Russell 3000.
S&P/ Case-Shiller US National is the broadest national measurement of home prices, with coverage going beyond the 20 MSAs that make up the composites.
S&P/Case-Shiller Composite-20 Home Price Index reflects price changes for Atlanta, Charlotte, Cleveland, Dallas, Detroit, Minneapolis, Phoenix, Portland, Seattle, Tampa, Boston,
Chicago, Denver, Las Vegas, Los Angeles, Miami, New York, San Diego, San Francisco and Washington DC. In addition to those 10 markets.
S&P 400 Index: A market capitalization-weighted benchmark index made up of 400 securities with market values between $200 million and $5 billion
S&P 500 Index: Index of 500 widely held common stocks that measures the general performance of the market. VIX Index: The Chicago Board Options Exchange SPX Volatility Index reflects a market estimate of future volatility, based on the weighted average of the implied volatilities for a wide range of strikes 1st & 2nd month expirations are used until 8 day from expiration, then the 2nd and 3rd are used. U.S. Treasuries: Interest-bearing obligations if the U.S. government issued by the U.S. Department of the Treasury as a means of borrowing money to meet government expenditures
not covered by tax revenues. There are three types of marketable Treasury securities-bills, notes and bonds.
U.S. Investment-Grade Bonds: A bond that is assigned a rating in the top four categories by commercial credit rating companies. S&P classifies investment-grade bonds as BBB or
higher, and Moody's classifies investment grade bonds as BAA or higher. Related: High-yield bond.
U.S. High Yield Bonds: A bond with a speculative credit rating of BB (S&P) or BA (Moody's) or lower. Junk or high-yield bonds offer investors higher yields than bonds of financially
sound companies. Two agencies, Standard & Poors and Moody's Investor Services, provide the rating systems for companies' credit.
Wilshire 5000 Index: Measures the performance of all US equity securities with readily available price data. Over 5,000 capitalization weighted security returns are used to adhust the
index. The Wilshire 5000 base is its 12/31/1980 capitalization of $1,404.596 billion.

23 Charts are for illustrative purposes only. Refer to Important Information at the end of this presentation. Bloomberg charts as of 12 October 2015.
Glossary (Agency Ratings)
Moody's Investment grade Aaa: Moody judges obligations rated Aaa to be the highest quality, with the "smallest degree of risk". Aa1, Aa2, Aa3: Moody judges obligations rated Aa to be high quality, with "very low credit risk", but "their susceptibility to long-term risks appears somewhat greater". A1, A2, A3: Moody judges obligations rated A as "upper-medium grade", subject to "low credit risk", but that have elements "present that suggest a susceptibility to impairment over the long term". Baa1, Baa2, Baa3: Moody judges obligations rated Baa to be "moderate credit risk". They are considered medium-grade and as such "protective elements may be lacking or may be characteristically unreliable". Speculative grade Ba1, Ba2, Ba3: Moody judges obligations rated Ba to have "questionable credit quality B1, B2, B3: Moody judges obligations rated B as speculative and "subject to high credit risk", and have "generally poor credit quality." Caa1, Caa2, Caa3: Moody judges obligations rated Caa as of "poor standing and are subject to very high credit risk", and have "extremely poor credit quality. Such banks may be in default..." Ca: Moody judges obligations rated Ca as "highly speculative" and are "usually in default on their deposit obligations". C: Moody judges obligations rated C as "the lowest rated class of bonds and are typically in default," and "potential recovery values are low".
S&P Investment Grade AAA: the best quality borrowers, reliable and stable (many of them governments) AA: quality borrowers, a bit higher risk than AAA A: economic situation can affect finance BBB: medium class borrowers, which are satisfactory at the moment Non-Investment Grade BB: more prone to changes in the economy B: financial situation varies noticeably CCC: currently vulnerable and dependent on favorable economic conditions to meet its commitments CC: highly vulnerable, very speculative bonds C: highly vulnerable, perhaps in bankruptcy or in arrears but still continuing to pay out on obligations CI: past due on interest R: under regulatory supervision due to its financial situation SD: has selectively defaulted on some obligations D: has defaulted on obligations and S&P believes that it will generally default on most or all obligations NR: not rated
Fitch Investment grade AAA: the best quality companies, reliable and stable AA: quality companies, a bit higher risk than AAA A: economic situation can affect finance BBB: medium class companies, which are satisfactory at the moment Non-investment grade BB: more prone to changes in the economy B: financial situation varies noticeably CCC: currently vulnerable and dependent on favorable economic conditions to meet its commitments CC: highly vulnerable, very speculative bonds C: highly vulnerable, perhaps in bankruptcy or in arrears but still continuing to pay out on obligations D: has defaulted on obligations and Fitch believes that it will generally default on most or all obligations NR: not publicly rated

24 Charts are for illustrative purposes only. Refer to Important Information at the end of this presentation. Bloomberg charts as of 12 October 2015.
Important Information
In any instance where distribution of this communication (“Communication”) is subject to the rules of the U.S. Commodity Futures Trading Commission (“CFTC”), this communication constitutes an invitation to consider entering into a derivatives transaction under U.S. CFTC Regulations §§ 1.71 and 23.605, where applicable, but is not a binding offer to buy/sell any financial instrument. This Communication is intended for clients of Citi Wealth Management Latin America ("CWMLA") is a division of Citigroup Inc. ("Citigroup") comprised of Citi Private Bank Latin America ("CPB"), Citigold® Private Client ("CPC"), Citigold® International ("CI") and International Personal Banking ("IPB") in the United States of America and Banca Patrimonial Banamex ("Banca Patrimonial") and Banca Privada Banamex ("Banca Privada") in Mexico. provides its clients access to a broad array of products and services available through Citigroup, its bank and non-bank affiliates worldwide (collectively, “Citi”). In the U.S. securities and brokerage products and services are available through Citi Personal Investments International a business of Citigroup Inc., which offers securities through Citigroup Global Markets Inc. (CGMI), member SIPC, an investment advisor and broker-dealer registered with the Securities and Exchange Commission. Or through Citi International Financial Services, LLC (CIFS), member FINRA/SIPC, a broker-dealer registered with the Securities and Exchange Commission that offers brokerage products and services to Non-US residents/citizens. Accounts are carried by Pershing LLC, member FINRA/NYSE/SIPC. CGMI, CLA, CIFS, Banca Patrimonial, Banca Privada and Citibank, N.A. are affiliated companies under the common control of Citigroup. Insurance is offered through Citigroup Life Agency LLC (CLA). In California, CLA does business as Citigroup Life Insurance Agency, LLC (license number 0G56746). Not all products and services are provided by all affiliates, or are available at all locations. CWMLA personnel are not research analysts, and the information in this Communication is not intended to constitute “research”, as that term is defined by applicable regulations. Unless otherwise indicated, any reference to a research report or research recommendation is not intended to represent the whole report and is not in itself considered a recommendation or research report. This Communication is provided for information and discussion purposes only, at the recipient’s request. The recipient should notify CWMLA immediately should it at any time wish to cease being provided with such information. Unless otherwise indicated, (i) it does not constitute an offer or recommendation to purchase or sell any security, financial instrument or other product or service, or to attract any funding or deposits, and (ii) it does not constitute a solicitation if it is not subject to the rules of the CFTC (but see discussion above regarding communication subject to CFTC rules) and (iii) it is not intended as an official confirmation of any transaction.

25 Charts are for illustrative purposes only. Refer to Important Information at the end of this presentation. Bloomberg charts as of 12 October 2015.
Important Information
Unless otherwise expressly indicated, this Communication does not take into account the investment objectives, risk profile or financial situation of any particular person and as such, investments mentioned in this document may not be suitable for all investors. Citi is not acting as an investment or other advisor, fiduciary or agent. The information contained herein is not intended to be an exhaustive discussion of the strategies or concepts mentioned herein or tax or legal advice. Recipients of this Communication should obtain advice based on their own individual circumstances from their own tax, financial, legal and other advisors about the risks and merits of any transaction before making an investment decision, and only make such decisions on the basis of their own objectives, experience, risk profile and resources. The information contained in this Communication is based on generally available information and, although obtained from sources believed by Citi to be reliable, its accuracy and completeness cannot be assured, and such information may be incomplete or condensed. Any assumptions or information contained in this Communication constitute a judgment only as of the date of this document or on any specified dates and is subject to change without notice. Insofar as this Communication may contain historical and forward looking information, past performance is neither a guarantee nor an indication of future results, and future results may not meet expectations due to a variety of economic, market and other factors. Further, any projections of potential risk or return are illustrative and should not be taken as limitations of the maximum possible loss or gain. Any prices, values or estimates provided in this Communication (other than those that are identified as being historical) are indicative only, may change without notice and do not represent firm quotes as to either price or size, nor reflect the value Citi may assign a security in its inventory. Forward looking information does not indicate a level at which Citi is prepared to do a trade and may not account for all relevant assumptions and future conditions. Actual conditions may vary substantially from estimates which could have a negative impact on the value of an instrument. Views, opinions and estimates expressed herein may differ from the opinions expressed by other Citi businesses or affiliates, and are not intended to be a forecast of future events, a guarantee of future results, or investment advice, and are subject to change without notice based on market and other conditions. Citi is under no duty to update this document and accepts no liability for any loss (whether direct, indirect or consequential) that may arise from any use of the information contained in or derived from this Communication. Investments in financial instruments or other products carry significant risk, including the possible loss of the principal amount invested. Financial instruments or other products denominated in a foreign currency are subject to exchange rate fluctuations, which may have an adverse effect on the price or value of an investment in such products. This Communication does not purport to identify all risks or material considerations which may be associated with entering into any transaction.

26 Charts are for illustrative purposes only. Refer to Important Information at the end of this presentation. Bloomberg charts as of 12 October 2015.
Important Information
Structured products can be highly illiquid and are not suitable for all investors. Additional information can be found in the disclosure documents of the issuer for each respective structured product described herein. Investing in structured products is intended only for experienced and sophisticated investors who are willing and able to bear the high economic risks of such an investment. Investors should carefully review and consider potential risks before investing. OTC derivative transactions involve risk and are not suitable for all investors. Investment products are not insured, carry no bank or government guarantee and may lose value. Before entering into these transactions, you should: (i) ensure that you have obtained and considered relevant information from independent reliable sources concerning the financial, economic and political conditions of the relevant markets; (ii) determine that you have the necessary knowledge, sophistication and experience in financial, business and investment matters to be able to evaluate the risks involved, and that you are financially able to bear such risks; and (iii) determine, having considered the foregoing points, that capital markets transactions are suitable and appropriate for your financial, tax, business and investment objectives. This material may mention options regulated by the U.S. Securities and Exchange Commission. Before buying or selling options you should obtain and review the current version of the Options Clearing Corporation booklet, Characteristics and Risks of Standardized Options. A copy of the booklet can be obtained upon request from Citigroup Global Markets Inc., 390 Greenwich Street, 3rd Floor, New York, NY 10013 or by clicking the following links, http://www.theocc.com/components/docs/riskstoc.pdf http://www.theocc.com/components/docs/about/publications/november_2012_supplement.pdf If you buy options, the maximum loss is the premium. If you sell put options, the risk is the entire notional below the strike. If you sell call options, the risk is unlimited. The actual profit or loss from any trade will depend on the price at which the trades are executed. The prices used herein are historical and may not be available when you order is entered. Commissions and other transaction costs are not considered in these examples. Option trades in general and these trades in particular may not be appropriate for every investor. Unless noted otherwise, the source of all graphs and tables in this report is Citi. Because of the importance of tax considerations to all option transactions, the investor considering options should consult with his/her tax advisor as to how their tax situation is affected by the outcome of contemplated options transactions. None of the financial instruments or other products mentioned in this Communication (unless expressly stated otherwise) is (i) insured by the Federal Deposit Insurance Corporation or any other governmental authority, or (ii) deposits or other obligations of, or guaranteed by, Citi or any other insured depository institution.

27 Charts are for illustrative purposes only. Refer to Important Information at the end of this presentation. Bloomberg charts as of 12 October 2015.
Important Information
Citi often acts as an issuer of financial instruments and other products, acts as a market maker and trades as principal in many different financial instruments and other products, and can be expected to perform or seek to perform investment banking and other services for the issuer of such financial instruments or other products. The author of this Communication may have discussed the information contained therein with others within or outside Citi, and the author and/or such other Citi personnel may have already acted on the basis of this information (including by trading for Citi's proprietary accounts or communicating the information contained herein to other customers of Citi). Citi, Citi's personnel (including those with whom the author may have consulted in the preparation of this communication), and other customers of Citi may be long or short the financial instruments or other products referred to in this Communication, may have acquired such positions at prices and market conditions that are no longer available, and may have interests different from or adverse to your interests. IRS Circular 230 Disclosure: Citi and its employees are not in the business of providing, and do not provide, tax or legal advice to any taxpayer outside Citi. Any statement in this Communication regarding tax matters is not intended or written to be used, and cannot be used or relied upon, by any taxpayer for the purpose of avoiding tax penalties. Any such taxpayer should seek advice based on the taxpayer’s particular circumstances from an independent tax advisor. Neither Citi nor any of its affiliates can accept responsibility for the tax treatment of any investment product, whether or not the investment is purchased by a trust or company administered by an affiliate of Citi. Citi assumes that, before making any commitment to invest, the investor and (where applicable, its beneficial owners) have taken whatever tax, legal or other advice the investor/beneficial owners consider necessary and have arranged to account for any tax lawfully due on the income or gains arising from any investment product provided by Citi. This Communication is for the sole and exclusive use of the intended recipients, and may contain information proprietary to Citi which may not be reproduced or circulated in whole or in part without Citi’s prior consent. The manner of circulation and distribution may be restricted by law or regulation in certain countries. Persons who come into possession of this document are required to inform themselves of, and to observe such restrictions. Citi accepts no liability whatsoever for the actions of third parties in this respect. Any unauthorized use, duplication, or disclosure of this document is prohibited by law and may result in prosecution.

28 Charts are for illustrative purposes only. Refer to Important Information at the end of this presentation. Bloomberg charts as of 12 October 2015.
Important Information
This communication is issued by a member of the sales and trading department of Citigroup Global Markets Inc. or one of its affiliates. Sales and trading department personnel are not research analysts, and the information in this communication is not intended to constitute “research” as that term is defined by applicable regulations. Unless otherwise indicated, any reference to a research report or research recommendation is not intended to represent the whole report and is not in itself considered a recommendation or research report. All views, opinions and estimates expressed in this communication (i) may change without notice and (ii) may differ from those views, opinions and estimates held or expressed by Citi or other Citi personnel. This communication is provided for information and discussion purposes only. Unless otherwise indicated, (i) it does not constitute an offer or recommendation to purchase or sell any financial instruments or other products, (ii) it does not constitute a solicitation if it is not subject to the rules of the CFTC (but see discussion above regarding communications subject to CFTC rules), and (iii) it is not intended as an official confirmation of any transaction. Unless otherwise expressly indicated, this communication does not take into account the investment objectives or financial situation of any particular person. Citi is not acting as an advisor, fiduciary or agent. Recipients of this communication should obtain advice based on their own individual circumstances from their own tax, financial, legal and other advisors about the risks and merits of any transaction before making an investment decision, and only make such decisions on the basis of the investor's own objectives, experience and resources. The information contained in this communication is based on generally available information and, although obtained from sources believed by Citi to be reliable, its accuracy and completeness cannot be assured, and such information may be incomplete or condensed. Any assumptions or information contained in this document constitute a judgment only as of the date of this document or on any specified dates and is subject to change without notice.

29 Charts are for illustrative purposes only. Refer to Important Information at the end of this presentation. Bloomberg charts as of 12 October 2015.
Important Information
Investments in financial instruments or other products carry significant risk, including the possible loss of the principal amount invested. Financial instruments or other products denominated in a foreign currency are subject to exchange rate fluctuations, which may have an adverse effect on the price or value of an investment in such products. This document does not purport to identify all risks or material considerations which may be associated with entering into any transaction. Citi accepts no liability for any loss (whether direct, indirect or consequential) that may arise from any use of the information contained in or derived from this communication. This document may contain historical and forward looking information. Past performance is not a guarantee or indication of future results. Any prices, values or estimates provided in this communication (other than those that are identified as being historical) are indicative only may change without notice and do not represent firm quotes as to either price or size, nor reflect the value Citi may assign a security in its inventory. Forward looking information does not indicate a level at which Citi is prepared to do a trade and may not account for all relevant assumptions and future conditions. Actual conditions may vary substantially from estimates which could have a negative impact on the value of an instrument. You should contact your local representative directly if you are interested in buying or selling any financial instrument or other product or pursuing any trading strategy that may be mentioned in this communication. For more important information, visit: http://www.citibank.com/wealthmanagementlatinamerica/homepage/disclosure/disc_EN.htm Products and strategies are not suitable for every investor and may have eligibility requirements that must be met prior to investing. Information in this report has been prepared without taking account of the objectives, financial situation or needs of any particular investor. Accordingly, investors should, before acting on the information, consider its appropriateness, having regard to their objectives, financial situation and needs. Any decision to purchase securities mentioned herein should be made based on a review of your particular circumstances with your Citi investments professional.