october 19, 2016 diwali -...
TRANSCRIPT

IDBI Capital Markets & Securities Ltd | Retail Research www.idbidirect.in
DIWALI PICKS 20161
October 19, 2016
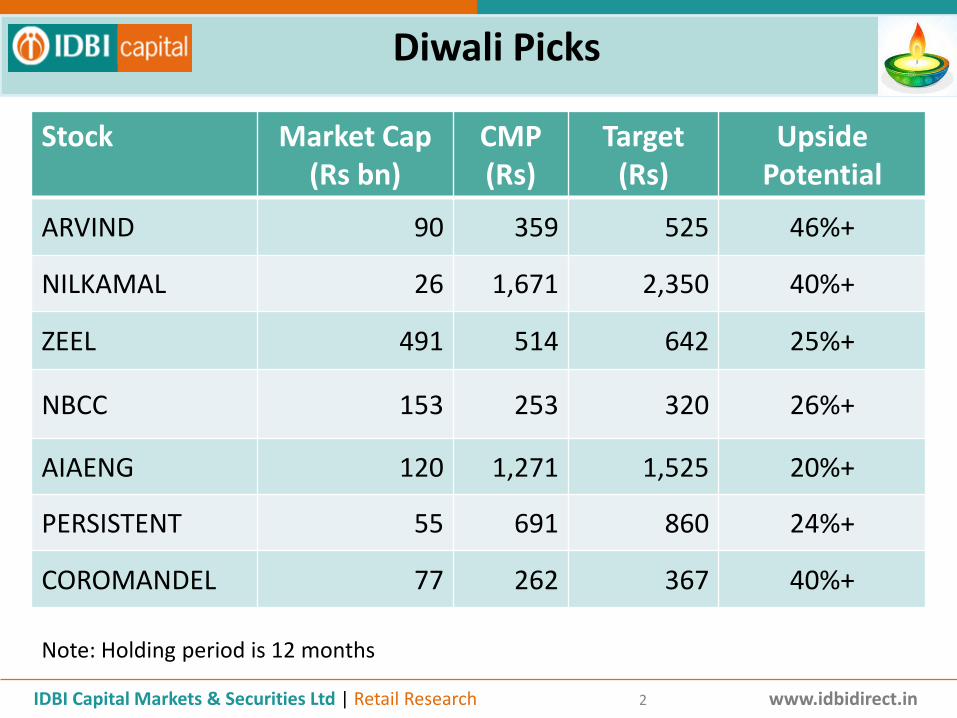
Stock Market Cap (Rs bn)
CMP(Rs)
Target (Rs)
Upside Potential
ARVIND 90 359 525 46%+
NILKAMAL 26 1,671 2,350 40%+
ZEEL 491 514 642 25%+
NBCC 153 253 320 26%+
AIAENG 120 1,271 1,525 20%+
PERSISTENT 55 691 860 24%+
COROMANDEL 77 262 367 40%+
Diwali Picks
IDBI Capital Markets & Securities Ltd | Retail Research www.idbidirect.in2
Note: Holding period is 12 months

Arvind Ltd.
Key Triggers:
Established in 1931, Arvind Limited (Arvind) is a textile manufacturer and the flagship company of the Arvind Group. Itmanufactures cotton shirting, denim, knits and bottom-weights fabrics. The company is one of the largest producers of denim in theworld, with an annual capacity of 108 mn metres.
As of FY16, Arvind had 953 stores under Arvind Lifestyle Brands. Also, Arvind has 30 brands out of which 4 are power brands.
Denims have evolved from a volume business to a value-added offering. Consequently, the company has consciously cut in capacities(reduction of 36 mn metres over FY05-09) and focused on higher realization (8% CAGR over FY07-16). The longstanding relationship withbrands and learning curve from over two and half decades of operations has helped it move up the value chain.
Arvind has launched global brands successfully and also scaled up a few of them to such a level that it has now four power brands, Arrow,Flying Machine, US Polo and Tommy Hilfiger which have been well-received by the markets.
According to FICCI, the textile industry is expected to grow at 10.6% CAGR to $223 bn over 2015-2021. Arvind, with its big size and scale,remains well-poised to benefit from this growth.
Valuation: The stock is currently trading at a FY18 PE multiple of 16x (based on Bloomberg consensus estimate). We have a positive viewon the stock.
Financial snapshot (Rs mn)
Year Revenue EBITDA EBITDA (%) Adj. PAT EPS (Rs) PE (x) EV/EBITDA (x) RoE (%) RoCE (%)
FY13 52,925 6,874 13.0 2,484 9.6 8.0 6.1 11.6 12.7
FY14 68,621 9,340 13.6 3,703 14.3 12.7 7.9 15.3 13.0
FY15 78,514 10,129 12.9 3,954 15.3 20.5 10.2 14.0 11.0
FY16 84,504 6,510 7.7 4,002 14.0 19.5 9.7 13.0 9.0
IDBI Capital Markets & Securities Ltd | Retail Research www.idbidirect.in3
CMP: 359 Tgt:525
Nilkamal Ltd.
Key Triggers:
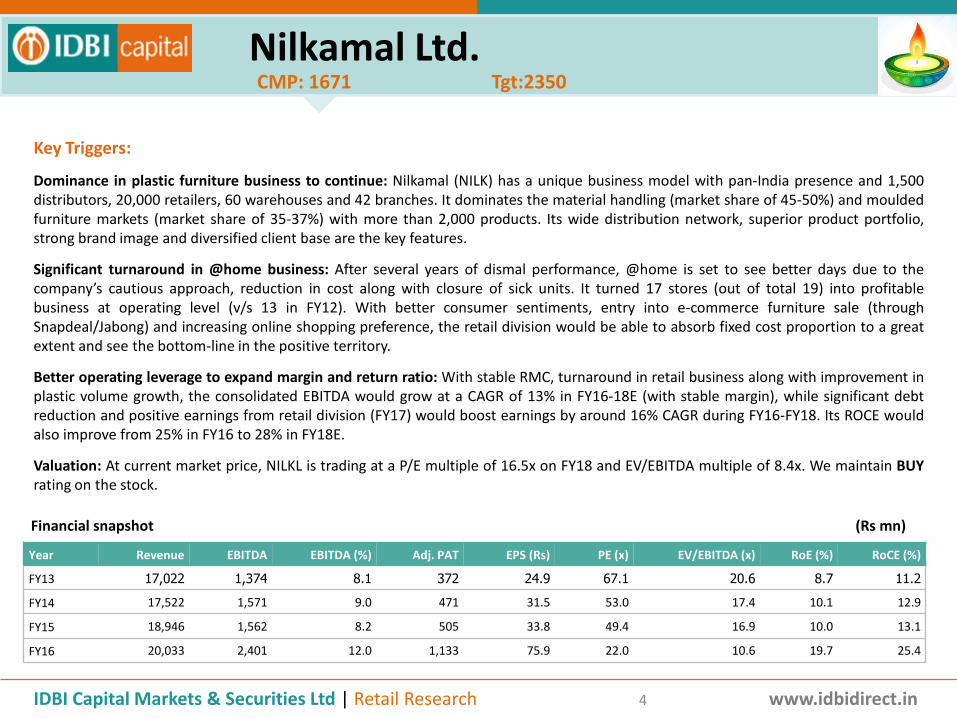
Dominance in plastic furniture business to continue: Nilkamal (NILK) has a unique business model with pan-India presence and 1,500distributors, 20,000 retailers, 60 warehouses and 42 branches. It dominates the material handling (market share of 45-50%) and mouldedfurniture markets (market share of 35-37%) with more than 2,000 products. Its wide distribution network, superior product portfolio,strong brand image and diversified client base are the key features.
Significant turnaround in @home business: After several years of dismal performance, @home is set to see better days due to thecompany’s cautious approach, reduction in cost along with closure of sick units. It turned 17 stores (out of total 19) into profitablebusiness at operating level (v/s 13 in FY12). With better consumer sentiments, entry into e-commerce furniture sale (throughSnapdeal/Jabong) and increasing online shopping preference, the retail division would be able to absorb fixed cost proportion to a greatextent and see the bottom-line in the positive territory.
Better operating leverage to expand margin and return ratio: With stable RMC, turnaround in retail business along with improvement inplastic volume growth, the consolidated EBITDA would grow at a CAGR of 13% in FY16-18E (with stable margin), while significant debtreduction and positive earnings from retail division (FY17) would boost earnings by around 16% CAGR during FY16-FY18. Its ROCE wouldalso improve from 25% in FY16 to 28% in FY18E.
Valuation: At current market price, NILKL is trading at a P/E multiple of 16.5x on FY18 and EV/EBITDA multiple of 8.4x. We maintain BUYrating on the stock.
Financial snapshot (Rs mn)
Year Revenue EBITDA EBITDA (%) Adj. PAT EPS (Rs) PE (x) EV/EBITDA (x) RoE (%) RoCE (%)
FY13 17,022 1,374 8.1 372 24.9 67.1 20.6 8.7 11.2
FY14 17,522 1,571 9.0 471 31.5 53.0 17.4 10.1 12.9
FY15 18,946 1,562 8.2 505 33.8 49.4 16.9 10.0 13.1
FY16 20,033 2,401 12.0 1,133 75.9 22.0 10.6 19.7 25.4
IDBI Capital Markets & Securities Ltd | Retail Research www.idbidirect.in4
CMP: 1671 Tgt:2350

ZEE Entertainment Enterprises Ltd.
Key Triggers: A excellent compounding story
Broadcasters to benefit from digitization of television network: All the 4 phases of digitization are expected to be completed by end-CY17. Based on the implementation in Phase I-II, largely completed, broadcasters remain the key beneficiaries of digitization withbenefit on both subscription front and advertisement. We believe that large broadcasters like Zee are best placed to take advantage ofthe same.
Ad revenue – sector outperformance to continue: The television advertising market is expected to grow at a CAGR of 15% over the next3 years. We expect Zee to outperform the sector post a strong 29% growth in FY16. FMCG spends, which account for ~55% of ZEE’s adrevenue, is expected to continue to do well. Telcos, Autos and Consumer Durables (~4-5% of ZEE’s ad revenue) are likely to see pick-up ingrowth with pick-up in growth in these sectors and entry of new players in Telco segment.
Regional portfolio is expected to do well: ZEE’s Marathi youth channel, ‘Yuva’ added much-needed ad inventory in its dominated Marathigenre . Further, sustenance in viewership growth in Tamil, Telugu and Kannada would enable Zee improve its ad monetizationsignificantly in the medium to long-term.
Sale of sports business to improve balance sheet and profitability: Zee sold its sports business to Sony for US$385mn (~4x FY16 sales).This will strengthen its balance sheet and also remove the negative impact of profitability (sports business had EBITDA loss of Rs350mnin FY16). We expect the sales proceeds to be used to buyback of its redeemable preference shares of Rs20bn.
Valuation: At current market price, Zee is trading at a P/E multiple of 38x/30x on FY17/FY18. We expect Zee to continue to trade atpremium valuation as we are confident of 20%+ EPS CAGR over the next three years.
Financial snapshot (Rs mn)
Year Revenue EBITDA EBITDA (%) Adj. PAT EPS (Rs) PE (x) EV/EBITDA (x) RoE (%) RoCE (%)
FY13 36,833 9,580 26.0 7,086 7.4 69.5 51.9 19.6 19.5
FY14 43,699 12,068 27.6 8,773 9.1 56.5 41.2 26.6 20.6
FY15 48,730 12,583 25.8 8,112 8.5 60.5 39.5 26.6 18.9
FY16 58,450 15,266 26.1 9,010 9.4 54.7 32.6 22.8 17.4
IDBI Capital Markets & Securities Ltd | Retail Research www.idbidirect.in5
CMP: 514 Tgt: 642

NBCC (India) Ltd.
Key Triggers :
Core competency: National Buildings Construction Corporation (NBCC) is a Navratna organization that comes under category-I, owned bythe Govt. of India. This company is engaged in the Real Estate Development & Construction business. Note, 85-90% of the revenue comesfrom asset-light project management consultancy business. In the entire Indian infrastructure value chain, there is hardly a company thatcan beat NBCC’s core return on capital employed. Note, they are in in excess of 200%. However, holding cash and real estate land parcelsin balance sheet, which ekes out paltry returns, brings down the return on equity to 25-30%.
And strong visibility: Today, NBCC has a revenue visibility for eleven years — when even industry stalwarts like L&T has it for not morethan 3 years. And that is not all: Here is a company that is targeting the order-backlog to move up to Rs1 tn, from the current Rs.720bn.Thereby, the visibility is on improving trend. In FY17 itself, company is guiding for order backlog to end at Rs800 bn. However, the revenuewill not kick start in FY17. Nearly half the order-backlog — mainly from marquee projects like Sarojini, Netaji and Nauroji are scheduledfor execution from Q1FY18 onwards.
Attractive valuation: We forecast revenue CAGR of 33% over the next two fiscals. With unmatched revenue visibility, we think NBCC is yetto open the-rabbit-out-of-hat. Further, we anticipate better consultancy margins — primarily led by operating leverage. However,adjusting for pay hikes, we think the net profit could grow 40% CAGR over the next two fiscals. We think urban infrastructure projects area priority. Thereby, the visibility for smart cities, affordable housing and railways will benefit NBCC in the entire value chain. We continuewith a PEG multiple to ~1x. We have a target price to Rs309. And we maintain a BUY recommendation.
Risks: First, redevelopment projects run a litany of classical urban infrastructure risks. In the past, redevelopment project of Southextension-II and Kidwai Nagar was quashed off by High Court, once, as “urban slums.” Though that is not the case anymore, we seekcomfort from Transit-oriented development model where NBCC can rely on Delhi Metro’s execution pace to evacuate urban designingissues. Second, Govt. of India acts unilaterally. If the debt of sick units, proposed for acquisition/merger is absorbed by NBCC, we mightchange our stance. Third, for the time, NBCC has hinted that it will no longer have higher exposure to real estate land-developmentmodel. Should there be a flip-flop in company strategy, our multiples risk to be downgraded.
Financial snapshot (Rs mn)
Year Revenue EBITDA EBITDA (%) Adj. PAT EPS (Rs) PE (x) EV/EBITDA (x) RoE (%) RoCE (%)
FY13 32,323 1,891 5.9 2,039 3.4 74.4 72.1 23.4 20.9
FY14 40,701 2,398 5.9 2,572 4.3 59.0 58.3 24.6 22.5
FY15 46,741 2,894 6.2 2,784 4.6 54.5 48.8 22.5 23.0
FY16 58,383 3,526 6.0 3,112 5.2 48.8 39.8 21.9 24.6
IDBI Capital Markets & Securities Ltd | Retail Research www.idbidirect.in6
CMP: 253 Tgt:320

AIA Engineering Ltd.
Key Triggers:
Established in 1979, AIA Engineering (AIA), is India’s largest manufacturer and supplier of corrosion and abrasion resistant high chromemill internals (HCMIs), which are used as wear parts in crushing (or grinding) operations in cement, mining and thermal power plants.
Scalable opportunity in the mining segment, resurrection of operating margins back to historical levels and aspirations to become thelargest player globally make AIA Engineering (AIA) an interesting play in the oligopolistic high chrome mill internals (HCMI) industry.
The key positive surprise in 1QFY17 was the pick-up in mining segment volumes (+23.4% YoY) to 29,178 tonnes. However, themanagement commentary suggests a ramp up in volumes will augment from 3QFY17 and segments like gold and copper will add tovolume growth.
The management expects additional 20,000-25000 tonnes of incremental volumes for FY17 on the back of new capex and improvementin prices of global commodities.
Valuation: The stock is currently trading at a FY18 PE multiple of 24x (based on Bloomberg consensus estimate). We have a positive viewon the stock.
Financial snapshot (Rs mn)
Year Revenue EBITDA EBITDA (%) Adj. PAT EPS (Rs) PE (x) EV/EBITDA (x) RoE (%) RoCE (%)
FY13 17,513 3,102 17.7 2,108 22.4 14.2 7.0 14.8 17.3
FY14 20,168 5,023 24.9 3,250 34.5 16.2 9.3 20.5 15.9
FY15 21,835 5,494 25.2 4,132 43.8 27.4 18.9 20.0 22.5
FY16 21,004 6,093 29.0 4,178 44.3 20.9 13.1 17.5 21.0
IDBI Capital Markets & Securities Ltd | Retail Research www.idbidirect.in7
CMP: 1271 Tgt:1525

Persistent Systems Ltd.
Key Triggers: An early mover in transition to digital technologies
Focus on Enterprise digital transformation is paying off: Persistent has always had a differentiated business model with focus onoutsourced product development, IP and platforms rather there than traditional application development and maintenance (ADM) work.Importantly, Persistent has been proactive in transforming from a outsourced product development company into a partner to enterprisecustomer in their digital transformation. Its Enterprise Solutions segment is now 27% of revenue and grew by 35% YoY in FY16. It hasbeen focusing on Life Sciences and Financial Services verticals in this segment which saw a strong growth of 14% and 42% respectively inFY16. We expect Persistent’s enterprise segment to grow at 20%+ for the next 3 years.
Alliance with IBM Watson is a great move: The deal for IoT with IBM is progressing well. It is expected to add revenue of US$53mn or15% of FY16 revenue. Persistent will have to make investments upfront which will result in -200bps impact on over-all EBITDA margin inFY17. However we believe that such investments are important especially for getting high growth in digital technologies like IoT.Persistent should be able to offset part of this impact through productivity gains, offshoring and other operational efficiencies.
US$0.5bn should come in FY18 and moving towards becoming a US$1bn company: We believe that Persistent has all the ingredients tobecome a US$1bn company. Importantly this will be excluding traditional ADM or infrastructure management services work.
Valuation: At current market price, Persistent is trading at a P/E multiple of 17.5x/14.5x on FY17/FY18. We expect PSYS to outperform thesector growth over the next three years. As a result, we expect we expect Persistent Systems to be one of the top performing IT stock inthe next three years
Financial snapshot (Rs mn)
Year Revenue EBITDA EBITDA (%) Adj. PAT EPS (Rs) PE (x) EV/EBITDA (x) RoE (%) RoCE (%)
FY13 12,965 3,368 26.0 1,876 24.31 28.4 14.6 20.2 20.2
FY14 16,692 4,326 25.9 2,493 32.03 21.6 11.3 22.3 22.2
FY15 18,913 3,904 20.6 2,906 36.84 18.7 12.6 22.1 22.1
FY16 23,123 4,138 17.9 2,974 37.17 18.6 11.9 19.5 19.5
IDBI Capital Markets & Securities Ltd | Retail Research www.idbidirect.in8
CMP: 691 Tgt:860

Coromandel International Ltd.Key Triggers:After two years of below normal rainfall, the 2016 monsoon season has ended with rainfall at 97 per cent of LPA; this qualifies as anormal monsoon. This should augur well for fertilizer companies like Coromandel International (CRIN).
Higher exposure to Non-Subsidy products: First, the Indian Agro Chemicals market is tilted towards Fertilizers (Urea), PhosphateFertilizers (DAP, Complex fertilizers, SSP, MOP). Urea continues to suffer from regulations. However, phosphate fertilizers are decontrolled.Yet they are regulated under the NBS Scheme. With considerable pricing freedom, the days could be brighter ahead. CRIN, with aproduction capacity of 3.6mnt of DAP and complex fertilizers, is a leading player. Note, in NPK market, CRIN has a market share of 22%.With the acquisition of the Liberty group, the company increased its footprint into the Northern/Western SSP sector. With this, SSPmanufacturing capacity exceeds 1mnt. The current market share in this segment is 16%. A fraction of revenue though, CRIN has acomplete range of products to offer including Urea as it has bagged government contracts for handling Urea at Kakinada and Karaikalports.
Vertical integration to help in low cost: CRIN has strategic alliances. First, it has a long term tie-up with Foskor, South Africa and GroupChemique, Tunisia for inputs. Second, it has a supply agreement with Mitsui for ammonia and sulphur; and potash with Canpotex. Third,with strategic locations of Phosphoric acid plants, Visak and Ennore refinery helps in bringing down the cost. Fourth, freight cost is lower.Fifth, with stake in APGENCO, the power cost, too, remains lower.
Strong marketing network: CRIN has 7000+ dealers. This could put, arguably, CRIN in top-three. The width of distribution and farmerengagement is key for industry players to be able to differentiate their offerings given the generic nature of the Indian crop protectionmarket and the lack of exclusivity from retailers and dealers.
Valuation and view: Coromandel is targeting an improvement in the non-subsidy business. The target envisaged, over the next fouryears, could contribute as high as 50% to EBITDA (from the current 36%). Further, Specialty nutrients will lead the show. Even with 70%capacity utilization, CRIN could achieve 15% RoE. If gross margins could maintained at FY16 levels, EBITDA could jump three folds in100% capacity utilization. In fact, company guides for 85% capacity utilization in the fiscal to come.
Financial snapshot (Rs mn)
Year Revenue EBITDA EBITDA (%) Adj. PAT EPS (Rs) PE (x) EV/EBITDA (x) RoE (%) RoCE (%)
FY13 90,337 7,679 8.5 4,333 15.3 17.3 12.9 18.9 13.1
FY14 100,532 7,926 7.9 3,669 13.0 20.4 11.2 16.4 14.8
FY15 113,064 8,495 7.5 4,063 14.3 18.5 11.1 18.1 17.2
FY16 114,598 7,123 6.2 3,609 12.4 21.1 14.1 15.6 12.3
IDBI Capital Markets & Securities Ltd | Retail Research www.idbidirect.in9
CMP: 262 Tgt:367

10
Team
IDBI Capital Markets & Securities Ltd.

Research HeadA. K. Prabhakar [email protected]
DisclaimerThis document has been prepared by IDBI Capital Markets& Securities Ltd (formerly known as “IDBI Capital Market Services Ltd.) (IDBI Capital) and is meant for the recipient only foruse as intended and not for circulation. This document should not be reproduced or copied or made available to others. No person associated with IDBI Capital is obligated to call orinitiate contact with you for the purposes of elaborating or following up on the information contained in this document. The Report and information contained herein is strictlyconfidential and meant for solely for the selected recipient and may not be altered in any way, transmitted to copied or distributed, in part or in whole , to any other person or to themedia or reproduced in any form, without the prior written consent of IDBI Capital.Recipients may not receive this report at the same time as other recipients. IDBI Capital will not treat recipients as customers by virtue of their receiving this report.The information contained herein is from the public domain or sources believed to be reliable. While reasonable care has been taken to ensure that information given is at the timebelieved to be fair and correct and opinions based thereupon are reasonable, due to the very nature of research it cannot be warranted or represented that it is accurate or completeand it should not be relied upon as such. In so far as this report includes current or historical information, it is believed to be reliable, although its accuracy and completeness cannotbe guaranteed.Opinions expressed are current opinions as of the date appearing on this material only. While we endeavor to update on a reasonable basis, the information discussed in this material,IDBI Capital, its directors, employees are under no obligation to update or keep the information current. Further there may be regulatory, compliance, or other reasons that preventus from doing so.Prospective investors and others are cautioned that any forward-looking statements are not predictions and may be subject to change without notice.IDBI Capital, its directors and employees and any person connected with it, will not in any way be responsible for the contents of this report or for any losses, costs, expenses, charges,including notional losses/lost opportunities incurred by a recipient as a result of acting or non acting on any information/material contained in the report.This is not an offer to sell or a solicitation to buy any securities or an attempt to influence the opinion or behaviour of investors or recipients or provide any investment/tax advice.This report is for information only and has not been prepared based on specific investment objectives. The securities discussed in this report may not be suitable for all investors.Investors must make their own investment decision based on their own investment objectives, goals and financial position and based on their own analysis.Trading in stocks, stock derivatives, and other securities is inherently risky and the recipient agrees to assume complete and full responsibility for the outcomes of all trading decisionsthat the recipient makes, including but not limited to loss of capital.Opinions, projections and estimates in this report solely constitute the current judgment of the author of this report as of the date of this report and do not in any way reflect theviews of IDBI Capital, its directors, officers, or employees.This report is not directed or intended for distribution to, or use by, any person or entity who is a citizen or resident of or located in any locality, state, country or other jurisdiction,where such distribution, publication, availability or use would be contrary to law, regulation or which would subject IDBI Capital and associates to any registration or licensingrequirement within such jurisdiction. The securities described herein may or may not be eligible for sale in all jurisdictions or to certain category of investors. Persons in whosepossession this document may come are required to inform themselves of and to observe such restriction.E-mail is not a secure method of communication. IDBI Capital Markets& Securities Ltd(formerly known as “IDBI Capital Market Services Ltd.)cannot accept responsibility for theaccuracy or completeness of any e-mail message or any attachment(s).This transmission could contain viruses, be corrupted, destroyed, incomplete, intercepted, lost or arrive late. IDBI Capital, its directors or employees or associates accept no liability forany damage caused, directly or indirectly, by this email.
Disclosures and Analyst Information
IDBI Capital Markets & Securities Ltd. (formerly known as “IDBI Capital Market Services Ltd.)(A wholly owned subsidiary of IDBI Bank Ltd.)
Retail Research DeskRegd. Office: 3rd Floor, Mafatlal Centre, Nariman Point, Mumbai – 400 021. Phones: (91-22) 4322 1212; Fax: (91-22) 2285 0785; Email: [email protected] Registration: BSE & NSE (Cash & FO) – INZ000007237, NSDL – IN-DP-NSDL-12-96, Research – INH000002459, CIN – U65990MH1993GOI075578Compliance Officer: Christina D’souza; Email: [email protected]; Telephone: (91-22) 4322 1212
IDBI Capital Markets & Securities Ltd | Retail Research www.idbidirect.in11

Analyst Disclosures : -I, A.K. Prabhakar, hereby certify that the views expressed in this report accurately reflect my personal views about the subject companies and / or securities . I also certify that no part of my compensation was, is or will be directly or indirectly related to the specific recommendations or views expressed in this report Other Disclosures : -IDBI Capital Markets& Securities Ltd(formerly known as “IDBI Capital Market Services Ltd.)“IDBI Capital” was incorporated in the year 1993 under Companies Act, 1956and is a wholly owned subsidiary of IDBI Bank Limited.IDBI Capital is one of India’s leading securities firm which offers a full suite of products and services to individual , institutional and corporate clients namely Stock broking (Institutional and Retail) , Distribution of financial products, Merchant Banking, Corporate Advisory Services, Debt Arranging & Underwriting , Porffolio Manager Services and providing Depository Services.IDBI Capital registered trading and clearing member of BSE Ltd. (BSE) and National Stock Exchange of India Limited (NSE). IDBI Capital is also a SEBI registered Merchant Banker , Portfolio Manager and Research Analyst.IDBI Capital is also a SEBI registered depository participant with National Securities Depository Limited (NSDL) and is also a Mutual Fund Advisor registered with Association of Mutual Funds in India (AMFI).IDBI Capital Markets& Securities Ltd. (formerly known as “IDBI Capital Market Services Ltd.)and its associates(IDBI Bank Ltd.(Holding Company),IDBI Intech Ltd. (Fellow Subsidiary) ,IDBI Asset Management Ltd. (Fellow Subsidiary)and IDBI Trusteeship Services Ltd. (Fellow Subsidiary).IDBI Group are a full-serviced banking, integrated investment banking, investment management, brokerage and financing group. Details in respect of which are available on www.idbicapital.comIDBI Capital along with its associates are leading underwriter of securities and participants in virtually all securities trading markets in India. We and our associates have investment banking and other business relationships with a significant percentage of the companies covered by our Research Department. Investors should assume that IDBI Capital and/or its associates are seeking or will seek investment banking or other business from the company or companies that are the subject of this material. IDBI Capital generally prohibits its analysts, persons reporting to analysts, and their dependant family members having a financial conflict of interest in the securities or derivatives of any companies that the analysts cover. Additionally, IDBI Capital generally prohibits its analysts and persons reporting to analysts from serving as an officer, director, or advisory board member of any companies that the analysts cover. Our salespeople, traders, and other professionals may provide oral or written market commentary or trading strategies to our clients that reflect opinions that are contrary to the opinions expressed herein, and our proprietary trading and investing businesses may make investment decisions that are inconsistent with the recommendations expressed herein. In reviewing these materials, you should be aware that any or all of the foregoing, among other things, may give rise to real or potential conflicts of interest. Additionally, other important information regarding our relationships with the company or companies that are the subject of this material is provided herein. This material should not be construed as an offer to sell or the solicitation of an offer to buy any security in any jurisdiction where such an offer or solicitation would be illegal. We are not soliciting any action based on this material. It is for the general information of clients of IDBI Capital. It does not constitute a personal recommendation or take into account the particular investment objectives, financial situations, or needs of individual clients. Before acting on any advice or recommendation in this material, clients should consider whether it is suitable for their particular circumstances and, if necessary, seek professional advice. The price and value of the investments referred to in this material and the income from them may go down as well as up, and investors may realize losses on any investments. Past performance is not a guide for future performance, future returns are not guaranteed and a loss of original capital may occur. We and our assocaites, officers, directors, and employees, including persons involved in the preparation or issuance of this material, may from time to time have “long” or “short” positions in, act as principal in, and buy or sell the securities or derivatives thereof of companies mentioned herein. For the purpose of calculating whether IDBI Capital Markets& Securities Ltd(formerly known as “IDBI Capital Market Services Ltd.)and its assocaitesholds beneficially owns or controls, including the right to vote for directors, 1% of more of the equity shares of the subject issuer of a research report, the holdings does not include accounts managed by IDBI Asset Management Company/ IDBI Mutual Fund. IDBI Capital hereby declare that our activities were neither suspended nor we have materially defaulted with any Stock Exchange authority with whom we are registered in last five years. However SEBI, Exchanges and Depositories have conducted the routine inspection and based on their observations have issued advise letters or levied minor penalty on IDBI Capital for certain operational deviations. We have not been debarred from doing business by any Stock Exchange / SEBI or any other authorities; nor has our certificate of registration been cancelled by SEBI at any point of time.IDBI Capital, its directors or employees or associates, may from time to time, have positions in, or options on, and buy and sell securities referred to herein. IDBI Capital or its associates, during the normal course of business, from time to time, may solicit from or perform investment banking or other services for any company mentioned in this document or their connected persons or be engaged in any other transaction involving such securities and earn brokerage or other compensation or act as a market maker in the financial instruments of the company(ies) discussed herein or their affiliate companies or act as advisor or lender / borrower to such company(ies)/associates companies or have other potential conflict of interest.This report may provide hyperlinks to other websites. Except to the extent to which the report refers to the website of IDBI Capital, IDBI Capital states that it has not reviewed the linked site and takes no responsibility for the content contained in such other websites. Accessing such websites shall be at recipient's own risk.IDBI Capital encourages the practice of giving independent opinion in research report preparation by the analyst and thus strives to minimize the conflict in preparation of research report. Accordingly, neither IDBI Capital nor Research Analysts have any material conflict of interest at the time of publication of this report.We offer our research services to primarily institutional investors and their employees, directors , fund managers, advisors who are registered with us.The Research Analyst has not served as an officer, director or employee of Subject Company. We or our associates may have received compensation from the subject company in the past 12 months. We or our associates may have managed or co-managed public offering of securities for the subject company in the past 12 months. We or our associates may have received compensation for investment banking or merchant banking or brokerage services from the subject company in the past 12 months. We or our associates may have received any compensation for products or services other than investment banking or merchant banking or brokerage services from the subject company in the past 12 months. We or our associates may have received any compensation or other benefits from the Subject Company or third party in connection with the research report. Research Analyst or his/her relative’s may have financial interest in the subject company. IDBI Capital Markets& Securities Ltd(formerly known as “IDBI Capital Market Services Ltd.)or its associates may have financial interest in the subject company. Research Analyst or his/her relatives does not have actual/beneficial ownership of 1% or more securities of the subject company at the end of the month immediately preceding the date of publication of Research Report. IDBI Capital or its associates may have actual/beneficial ownership of 1% or more securities of the subject company at the end of the month immediately preceding the date of publication of Research Report. The Subject Company may have been a client during twelve months preceding the date of distribution of the research report. Price history of the daily closing price of the securities covered in this note is available at bseindia.com ,nseindia.com and economictimes.indiatimes.com/markets/stocks/stock-quotes.
IDBI Capital Markets & Securities Ltd | Retail Research www.idbidirect.in12