ocr as and a level chemistry a delivery guide - … · by using graphs to determine reaction rate,...
TRANSCRIPT

CHEMISTRY A
AS and A LEVELDelivery Guide
H032/H432
Theme: RatesDecember 2015
We will inform centres about any changes to the specification. We will also publish changes on our website. The latest version of our specification will always be the one on our website (www.ocr.org.uk) and this may differ from printed versions.
Copyright © 2015 OCR. All rights reserved.
Copyright OCR retains the copyright on all its publications, including the specifications. However, registered centres for OCR are permitted to copy material from this specification booklet for their own internal use.
Oxford Cambridge and RSA Examinations is a Company Limited by Guarantee. Registered in England. Registered company number 3484466.
Registered office: 1 Hills Road Cambridge CB1 2EU
OCR is an exempt charity.

3
CONTENTS
Introduction Page 4
Curriculum Content Page 5
Thinking Conceptually Page 7
Thinking Contextually Page 11
Learner Resources Page 14
AS and A LEVELCHEMISTRY AAS and A LEVELCHEMISTRY A

4
Delivery guides are designed to represent a body of knowledge about teaching a particular topic and contain:
• Content: A clear outline of the content covered by the delivery guide;
• Thinking Conceptually: Expert guidance on the key concepts involved, common difficulties students may have, approaches to teaching that can help students understand these concepts and how this topic links conceptually to other areas of the subject;
• Thinking Contextually: A range of suggested teaching activities using a variety of themes so that different activities can be selected which best suit particular classes, learning styles or teaching approaches.
If you have any feedback on this Delivery Guide or suggestions for other resources you would like OCR to develop, please email [email protected].
KEYClick to view associated resources within this document.
Click to view external resources
Introduction
only AS Level content only

5
Content (from A Level)3.2.2 Reaction rates
(a) the effect of concentration, including the pressure of gases, on the rate of a reaction, in terms of frequency of collisions
(b) calculation of reaction rate from the gradients of graphs measuring how a physical quantity changes with time
(c) explanation of the role of a catalyst:
(i) in increasing reaction rate without being used up by the overall reaction
(ii) in allowing a reaction to proceed via a different route with lower activation energy, as shown by enthalpy profile diagrams
(d) (i) explanation of the terms homogeneous and heterogeneous catalysts
(ii) explanation that catalysts have great economic importance and benefits for increased sustainability by lowering temperatures and reducing energy demand from combustion of fossil fuels with resulting reduction in CO2 emissions
(e) the techniques and procedures used to investigate reaction rates including the measurement of mass, gas volumes and time
(f ) qualitative explanation of the Boltzmann distribution and its relationship with activation energy (see also 3.2.1 c)
(g) explanation, using Boltzmann distributions, of the qualitative effect on the proportion of molecules exceeding the activation energy and hence the reaction rate, for:
(i) temperature changes
(ii) catalytic behaviour (see also 3.2.2 c).
Curriculum Content

6
5.1.1 How fast?
(a) explanation and use of the terms: rate of reaction, order, overall order, rate constant, half-life, rate-determining step
(b) deduction of:
(i) orders from experimental data
(ii) a rate equation from orders of the form: rate = k[A]m[B]n, where m and n are 0, 1 or 2
(c) calculation of the rate constant, k, and related quantities, from a rate equation including determination of units
(d) from a concentration–time graph:
(i) deduction of the order (0 or 1) with respect to a reactant from the shape of the graph
(ii) calculation of reaction rates from the measurement of gradients (see also 3.2.2 b)
(e) from a concentration–time graph of a first order reaction, measurement of constant half-life, t1/2
(f ) for a first order reaction, determination of the rate constant, k, from the constant half-life, t1/2, using the relationship: k = ln 2/t1/2
(g) from a rate–concentration graph:
(i) deduction of the order (0, 1 or 2) with respect to a reactant from the shape of the graph
(ii) determination of rate constant for a first order reaction from the gradient
(h) the techniques and procedures used to investigate reaction rates by the initial rates method and by continuous monitoring, including use of colorimetry (see also 3.2.2 e)
(i) for a multi-step reaction, prediction of,
(i) a rate equation that is consistent with the rate-determining step
(ii) possible steps in a reaction mechanism from the rate equation and the balanced equation for the overall reaction
(j) a qualitative explanation of the effect of temperature change on the rate of a reaction and hence the rate constant (see 3.2.2 f–g)
(k) the Arrhenius equation:
(i) the exponential relationship between the rate constant, k and temperature, T given by the Arrhenius equation, k = Ae–Ea/RT
(ii) determination of Ea and A graphically using: ln k = –Ea /RT + ln A derived from the Arrhenius equation.
Curriculum Content

7
Approaches to teaching the content
Students will be familiar with reaction rate and collision theory from GCSE but Module 3 develops the idea of activation energy and that the overwhelming majority of collisions do not lead on to reaction. Simulations are useful in showing this, although the frequency of successful collisions is necessarily greatly exaggerated. The activation energy concept can then be applied to the role of catalysts and to the effects of temperature on the Boltzmann distribution of molecular velocity.
Rate is a topic which provides plenty of opportunities for students to develop practical skills and gain greater familiarity with different ways of analysing their results, especially by using graphs to determine reaction rate, half life and activation energy.
The mathematical relationship between rate and concentration is introduced in module 5 and applied to abstract ideas such as rate determining steps and reaction mechanisms. Plenty of examples will help students learn to apply these concepts.
Common misconceptions or difficulties students may have
Students will have an intuitive concept of what ‘rate of reaction’ means, probably in terms of the amount of product made in a certain time, but in module 5 they are introduced to the more rigorous definition as ‘rate of change of concentration of a particular reactant’. They will also have difficulties with the concept of ‘zero order’, where, counter-intuitively, the concentration of one reactant has no effect on the rate of reaction.
The idea of a multistep reaction in which one step is potentially slower than the rest is not easy to grasp but analogies may help students understand the idea of a rate determining step, as will references to some of the mechanisms they have already encountered in Organic Chemistry.
Many students will need support with the mathematical demands of this topic, which include rearranging equations, using logarithms, and calculating and using gradients. The ‘Maths for Chemistry’ website (http://discovermaths.rsc.org/, under development, October 2014) may be helpful.
Thinking Conceptually

8
Conceptual links to other areas of the specification – useful ways to approach this topic to set students up for topics later in the course.
Rate and equilibrium are closely related and if students are introduced first to the effects of temperature on rate they can practise applying these to equilibrium conditions, where the rate of forward and back reactions are exactly balanced.
The concept of catalysts providing an alternative reaction pathway can be explored by reference to the role of radicals in the destruction of the ozone layer and the reactions between halogens and hydrocarbons.
Studies of rate of reaction provide evidence for the reaction mechanisms encountered in the Organic Chemistry modules. Possible rate-determining steps could be considered when these mechanisms are introduced or revised.
Thinking Conceptually
Activities Resources
Rate of reaction graphsRoyal Society of Chemistry: Assessment for Learning
Section 35 from http://www.rsc.org/education/teachers/resources/aflchem
Students are presented with graphs for the reaction of marble chips and acid under different conditions and have to decide which graph relates to which conditions. This is a good introductory task to test recall and understanding from GCSE.
Collision Theory SimulationSimchemistry
http://www.simchemistry.co.uk
The rates and equilibrium model simulates collisions between particles, most of which are ‘unsuccessful’ even when the temperature is raised. Graphs are displayed showing the number of reactant and product particles against time. A quick introduction to collision theory and activation energy.

9
Thinking Conceptually
Activities Resources
Rate SimulationUniversity of Colorado PhET project
https://phet.colorado.edu/en/simulation/reactions-and-rates
Students can use this simulation to experiment with the effects of temperature and concentration on reaction rate. There is a useful graphic which superimposes the average energy of the system on an enthalpy profile and counters to display how the numbers of reactant and product particles change. The simulation can also be used to investigate equilibria.
Advanced Rate Graphshttp://www.tes.co.uk/teaching-resource/Rates-graphs-higher-level-6409891/
Students are presented with unlabelled reaction graphs and asked to identify the axes and suggest a title. This is an excellent check to see whether they can distinguish between plots of concentration v time and rate v concentration.
Rate Determining StepVideo: Richard Thornley
http://www.youtube.com/watch?v=swnJeRo-u8Q
This is one of a series of videos to support IB Chemistry but most are relevant to the A Level course. The videos are concise and very well put together. This one provides a simple visual analogy for a multi-stage reaction with a rate-determining step. Others explain the rate constant and its units, the graphical determination of activation energy and other topics which many students find difficult.
The whole series is available at www.youtube.com/user/richthornley
This is potentially a very useful site as an idea bank for teachers and for use by students.

10
Thinking Conceptually
Activities Resources
Assessment for LearningRoyal Society of Chemistry: Learn Chemistry
http://www.rsc.org/learn-chemistry/resource/res00000954/starters-for-ten
Section 7 deals with rate of reaction graphs and the Maxwell-Boltzmann distribution.
http://www.rsc.org/learn-chemistry/resource/res00001358/advanced-starters-for-ten
Section 1 has worksheets on the rate determining step, rate equations and the Arrhenius equation.

11
ACTIVITIES
Rate and order of reaction are empirical concepts so it is important that students have the chance to carry out experiments to measure rate and see how it is affected by concentration and temperature. Several different methods can be used for continuous monitoring of reactions, such as measuring volumes of gas produced, removing samples for titration and colorimetry (the latter lends itself to datalogging). Initial rates methods can also be used, such as the iodine-clock, where the concentration of iodide ions remains constant and the ‘end-point’ occurs when a certain amount of iodine has been produced.
When carrying out practical work students should be aware of relative amounts of each reactant so that they can decide which concentrations are changing significantly. For example, in the reaction between marble chips and HCl the reaction rate slows down as the acid is used up, whereas in the similar reaction between magnesium ribbon and HCl the acid is almost certain to be in excess.
In addition to the practical components this topic also contains mathematical and other theoretical concepts, such as reaction mechanism, activation energy and the Boltzmann distribution. These provide opportunities to use videos and ICT simulations. Students may also find ICT useful in graph plotting and for analysing the results of their experiments.
Thinking Contextually
Activities Resources
A visible activated complexRoyal Society of Chemistry: Classic Demonstrations
http://www.rsc.org/learn-chemistry/resource/res00000828/a-visible-activated-complex
This colourful demonstration of the role of cobalt ions in catalysis provides a perfect answer to any student who believes “a catalyst is not involved in a reaction” and can lead on to a discussion of their role in providing an alternative reaction pathway with lower activation energy.

12
Activities Resources
Reaction Kinetics: Calcium Carbonate + Hydrochloric AcidNuffield Foundation
http://www.nuffieldfoundation.org/practical-work-learning/reaction-kinetics
This resource comprises a detailed lesson plan and associated material for explaining the concept of rate equations and half life. It includes a student worksheet for determining the order of the reaction between marble chips and HCl and explains how the concentration of HCl at any time can be deduced from the amount of CO2 produced.
Reaction Kinetics: Magnesium + Hydrochloric AcidNuffield Foundation
http://www.nuffieldfoundation.org/practical-chemistry/rate-reaction-magnesium-hydrochloric-acid
The worksheet describes how to measure the rate of reaction by collecting hydrogen gas in a measuring cylinder. A Level students could use a burette to improve precision. The reaction can be repeated with different concentrations of HCl. In this case the HCl is in considerable excess so initial rates should be compared rather than attempting a concentration v time graph.
Reaction Kinetics: Iodine and PropanoneThe acid-catalysed reaction between iodine and propanone is a good example of a reaction which is zero order with respect to one reactant (iodine). The worksheet gives practical details for determining the rate of change of concentration of iodine by removing samples and titrating them with sodium thiosulfate. It includes data which students can use to determine the overall rate equation and suggest a possible series of steps.
Thinking Contextually

13
Thinking ContextuallyThinking Contextually
Activities Resources
A colorimetric kinetics experimentScottish Schools Education Research Centre
http://www.sserc.org.uk/index.php/bulletins226/2008/225-summer-2008/1224-advanced-higher-chemistry-determining-the-rate-constant-and-the-order-of-a-reaction239
This paper provides experimental details for using a colorimeter to follow the reaction between blue food dye and household bleach. Sample results are included. The paper uses the integrated forms of rate equations (which are not on the specification) but students can plot absorbance or concentration against time and either measure the rate at different concentrations or find the half life to determine the order with respect to dye concentration. They can also compare the initial rates with different concentrations of bleach.
Hydrolysis of BromobutaneData and questions about the rate equation for the hydrolysis of two bromoalkanes, leading on to questions about rate determining steps and reaction mechanisms. This provides some of the evidence for the nucleophilic substitution mechanism encountered in Module 4.
Determining Activation EnergyRoyal Society of Chemistry: Learn Chemistry
http://www.rsc.org/learn-chemistry/resource/res00000448/the-effect-of-temperature-on-reaction-rate?cmpid=CMP00000518
The worksheet provides a method for following the reaction between sodium thiosulfate and hydrochloric acid. The initial rate of the reaction will be proportional to the rate constant. So the gradient of a graph of
The same approach can be used for ‘clock reactions’, such as the reaction between potassium iodide and potassium iodate. http://www.nationalstemcentre.org.uk/elibrary/resource/9644/rate-of-reaction-the-effects-of-concentration-and-temperature
time1In ( ) v temperature
1 (K) will be EaR

14
Iodine reacts with propanone in a substitution reaction which is catalysed by H+ ions. The overall equation is:
CH3COCH3 (aq) + I2 (aq) CH3COCH2I (aq) + HI (aq)
This reaction can be studied using a colorimeter to measure the rate at which iodine is decolourised, but the procedure below uses a titration technique to determine the amount of iodine present in the reaction mixture at various time intervals. Samples are removed from the reaction mixture and poured into sodium hydrogencarbonate solution. This quenches the reaction by neutralising the acid catalyst. The samples are then titrated with sodium thiosulfate solution to determine how much iodine is present.
ProcedureUse a measuring cylinder to place 10 cm3 of sodium hydrogencarbonate solution into each of five conical flasks.
Fill a burette with 0.010 mol dm–3 sodium thiosulfate solution.
Mix 25 cm3 of 1.0 mol dm–3 propanone solution and 25 cm3 of 1mol dm–3 sulfuric acid in a 250 cm3 conical flask. Measure out 50 cm3 of 0.02 mol dm–3 iodine solution in a measuring cylinder. Mix this with the other reactants and immediately start timing the reaction. Swirl the flask well to mix the reactants.
Continue swirling the flask for about a minute, then withdraw 10 cm3 of the reaction mixture, using a pipette and filler. Run the contents of the pipette into one of the flasks of sodium hydrogen carbonate solution, noting the time. Shake the flask until bubbling ceases, then titrate the contents of the flask with sodium thiosulfate solution until the iodine colour is pale yellow. Add a drop of starch solution to turn the remaining iodine blue-black and continue the titration until the colour is completely discharged.
At five minute intervals, remove further 10 cm3 samples from the reaction flask and quench them with sodium hydrogencarbonate solution as before. Note the times when the samples are removed. Titrate them with sodium thiosulfate solution as above.
Tabulate the results of the experiment. Plot a graph of volume of sodium thiosulfate required against time. (Why can you plot a graph of the volume of thiosulfate use in the titration rather than the concentration of iodine?)
Use your graph to deduce the order of the reaction with respect to iodine.
Learner resource 1 The kinetics of the reaction between iodine and propanone
Safety1 mol dm–3 sulfuric acid is irritant
Propanone is highly flammable

15
Deducing the overall rate equation for the reactionIn the experiment overleaf, the concentration of iodine was much lower than the concentrations of the other reactants (propanone and sulfuric acid). Because of this, we were able to consider the effect of iodine concentration in isolation.
An alternative approach is to estimate the rate of change of concentration of iodine at the start of the reaction, ie the initial rate. In this experiment, four different mixtures were set up and the time taken for the colour of the iodine to disappear was estimated.
Learner resource 1
Expt A Expt B Expt C Expt D
Concentration of HCl (mol dm-3) 1.0 0.5 1.0 1.0
Concentration of propanone (mol dm-3) 0.5 0.5 0.25 0.5
Concentration of iodine (mol dm-3) 0.001 0.001 0.001 0.0005
Time taken for colour to disappear(s) 125 264 243 58
Rate of reaction (mol dm-3 s-1)
Calculate the initial rate of each reaction:
Now compare each of the experiments in turn.
Experiments A and B show that halving the concentration of HCl ........................................ the order of the reaction with respect to H+ ions is ...........
16
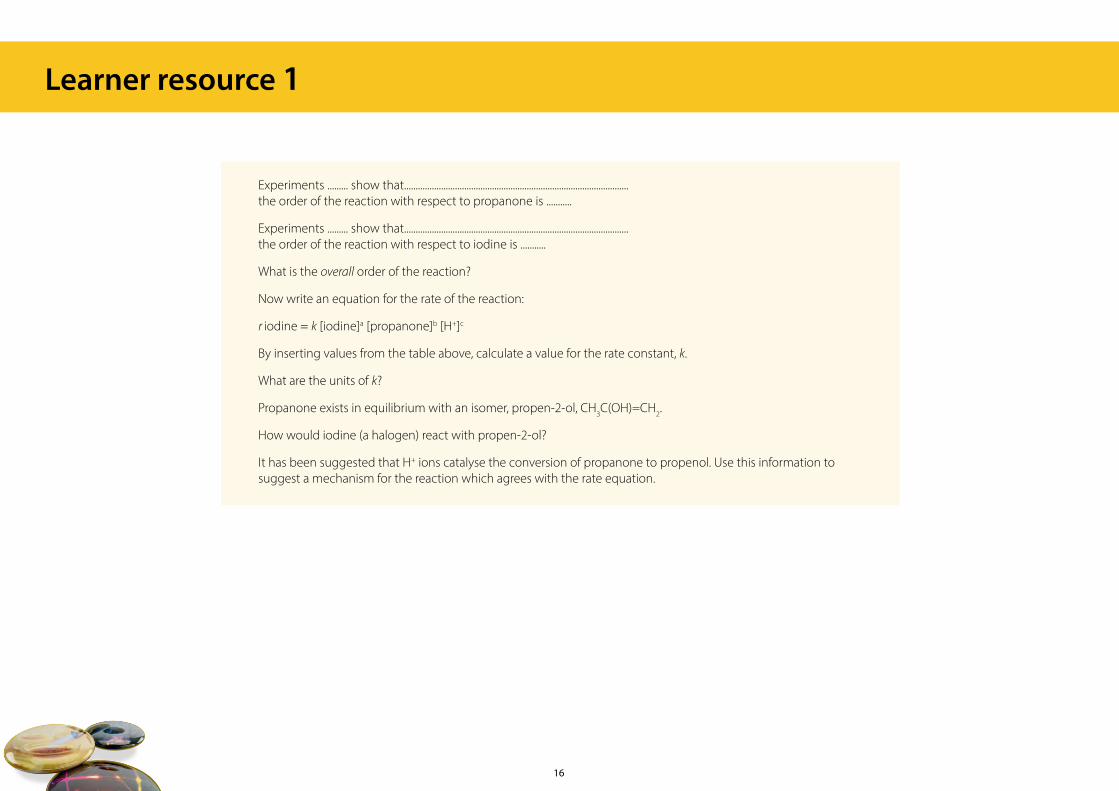
Experiments ......... show that................................................................................................. the order of the reaction with respect to propanone is ...........
Experiments ......... show that................................................................................................. the order of the reaction with respect to iodine is ...........
What is the overall order of the reaction?
Now write an equation for the rate of the reaction:
r iodine = k [iodine]a [propanone]b [H+]c
By inserting values from the table above, calculate a value for the rate constant, k.
What are the units of k?
Propanone exists in equilibrium with an isomer, propen-2-ol, CH3C(OH)=CH2.
How would iodine (a halogen) react with propen-2-ol?
It has been suggested that H+ ions catalyse the conversion of propanone to propenol. Use this information to suggest a mechanism for the reaction which agrees with the rate equation.
Learner resource 1

17
Equimolar amounts of 1-bromobutane and sodium hydroxide were mixed at 51oC. Samples were removed at intervals and the concentration of hydroxide ions was determined.
1. How could the concentration of hydroxide ions be measured?
Learner resource 2 The hydrolysis of 1-bromobutane
Time (hours) [OH-]/mol dm-3 Time (hours) [OH-]/mol dm-3
0.04 0.241 12.0 0.084
0.5 0.225 14.0 0.077
1.5 0.195 22.0 0.058
2.5 0.172 27.0 0.050
3.5 0.155 33.0 0.044
4.5 0.140 38.0 0.040
6.5 0.118 47.0 0.035
9.0 0.099 59.0 0.028

18
These results give the following graph.
2. What reaction order does this graph show?
Note: this is an overall order, since the initial concentrations of bromobutane and hydroxide ions were the same and they are being used up at the same rate.
Learner resource 2

19
Learner resource 2
In another experiment, the initial rate of the reaction was measured:
3. What is the order of the reaction with respect to the concentration of hydroxide ions? (Explain your reasoning clearly)
4. What is the order with respect to bromobutane concentration?
Draw the mechanism for the nucleophilic substitution reaction between bromobutane and OH- ions.
5. Refer to the mechanism to explain why increasing the concentration of either bromobutane or hydroxide ions would increase the rate of the reaction.
The hydrolysis of some haloalkanes is believed to take place by a two-step mechanism. For example, with 2-bromo-2-methylpropane:
Step 1. (CH3)3CBr (CH3)3C+ + Br- (formation of a carbocation)
Step 2. (CH3)3C+ + OH- (CH3)3COH
6. Step 2 is much faster than step 1. Suggest a reason for this.
7. Suggest the likely rate equation for this reaction, showing the orders with respect to the concentration of bromoalkane and hydroxide ions.
Initial concentrations (mol dm-3) Initial rate (mol dm-3 s-1)
[OH-] [C4H9Br]
Experiment A 0.10 0.25 3.2 x 10⁻⁶
Experiment B 0.10 0.50 6.6 x 10⁻⁶
Experiment C 0.50 0.50 33 x 10-6

20
Answers1. Samples were removed, cooled quickly and titrated with acid.
2. The concentration-time graph is clearly not zero order and it does not show a constant half-life so students would be justified in suggesting that the reaction is second order overall.
3. Comparing experiments B and C shows that when the hydroxide ion concentration is increased 5-fold the rate also increases 5-fold. The reaction is first order with respect to the concentration of hydroxide ions.
4. Comparing experiments A and B shows that when the bromobutane concentration is doubled the rate also doubles. The reaction is first order with respect to the concentration of bromobutane.
5. The conventional mechanism shows nucleophilic attack by a hydroxide ion on a molecule of bromobutane. Increasing the concentration of either reactant would increase the frequency of effective collisions between them.
6. Step 2 would be faster because the two particles have opposite charges and would be attracted to each other. Step 1 involves fission of a covalent bond, which is a very endothermic process.
7. Step 1 is the rate determining step so the only reactant which will figure in the rate equation is the bromoalkane. The expected rate equation would be:
Rate = k[bromomethylpropane]1
Learner resource 2

OCR Resources: the small printOCR’s resources are provided to support the teaching of OCR specifications, but in no way constitute an endorsed teaching method that is required by the Board and the decision to use them lies with the individual teacher. Whilst every effort is made to ensure the accuracy of the content, OCR cannot be held responsible for any errors or omissions within these resources. We update our resources on a regular basis, so please check the OCR website to ensure you have the most up to date version.
© OCR 2015 - This resource may be freely copied and distributed, as long as the OCR logo and this message remain intact and OCR is acknowledged as the originator of this work.
OCR acknowledges the use of the following content:Thumbs up and down: alexwhite/Shutterstock.com
Please get in touch if you want to discuss the accessibility of resources we offer to support delivery of our qualifications: [email protected]
We’d like to know your view on the resources we produce. By clicking on the ‘Like’ or ‘Dislike’ button you can help us to ensure that our resources work for you. When the email template pops up please add additional comments if you wish and then just click ‘Send’. Thank you.
If you do not currently offer this OCR qualification but would like to do so, please complete the Expression of Interest Form which can be found here: www.ocr.org.uk/expression-of-interest

For staff training purposes and as part of our quality assurance programme your call may be recorded or monitored.
©OCR 2015 Oxford Cambridge and RSA Examinations is a Company Limited by Guarantee. Registered in England. Registered office 1 Hills Road, Cambridge CB1 2EU. Registered company number 3484466. OCR is an exempt charity.
OCR customer contact centreGeneral qualificationsTelephone 01223 553998Facsimile 01223 552627Email [email protected]