ocmdi evaluation report final
TRANSCRIPT
Southern California Priority Corridor Showcase Program Evaluation
Orange County Model Deployment Initiative
(OCMDI) Evaluation Report
FINAL
VERSION 1
February 20, 2004
Document No. 65A0030/0040 Task No. 5-16
Prepared for California Department of Transportation
Division of Research & Innovation, MS-83 1227 O Street
Post Office Box 942873 Sacramento, California 94273-0001
Prepared By BOOZ ALLEN HAMILTON INC
1615 Murray Canyon Road, Suite 220 San Diego, California 92108
OCMDI Evaluation Report
i
CONTENTS Disclaimer ...................................................................................................................................... ii Abbreviations & Acronyms ........................................................................................................ iii Executive Summary...................................................................................................................... 1
BACKGROUND ............................................................................................................................................................1 EVALUATION FINDINGS, CONCLUSIONS, AND RECOMMENDATIONS...........................................................................2
1 Introduction ............................................................................................................................ 4 1.1 PURPOSE AND SCOPE OF THIS REPORT............................................................................................................4 1.2 EVALUATION DESIGN AND APPROACH ...........................................................................................................5 1.3 ORGANIZATION OF THIS REPORT ....................................................................................................................7 1.4 PRIVACY CONSIDERATIONS............................................................................................................................7 1.5 CONSTRAINTS & ASSUMPTIONS .....................................................................................................................8 1.6 PROJECT BACKGROUND .................................................................................................................................8
2 Project/System Technical Description................................................................................ 11 3 System Performance Evaluation......................................................................................... 16
3.1 THE PROJECT/SYSTEM DEVELOPMENT PROCESS AND TIMELINE ..................................................................16 3.2 SYSTEM RELIABILITY, AVAILABILITY, COMPATIBILITY, AND SCALABILITY................................................17 3.3 IMPACT OF SHOWCASE INTEGRATION ON PROJECT DEPLOYMENT AND SYSTEM PERFORMANCE..................18
4 Cost Evaluation .................................................................................................................... 20 4.1 CONSTRAINTS & ASSUMPTIONS ...................................................................................................................20 4.2 PROJECT BUDGET & ESTIMATED DEVELOPMENT COSTS..............................................................................20 4.3 ESTIMATED OPERATIONS & MAINTENANCE COSTS .....................................................................................23
5 Institutional Impacts Evaluation ........................................................................................ 25 5.1 IMPACTS TO OPERATIONS AND MAINTENANCE PROCEDURES AND POLICIES................................................25 5.2 IMPACTS TO STAFFING/SKILL LEVELS AND TRAINING..................................................................................25 5.3 IMPACTS TO THE COMPETITIVE ENVIRONMENT ............................................................................................27 5.4 IMPACTS TO LOCAL PLANNING PROCESSES, POLICY DEVELOPMENT, AND THE MAINSTREAMING OF ITS ...28
6 Traveler and Transportation Information Management Evaluation ............................. 29 6.1 EXTENT OF REGIONAL AND INTERREGIONAL TRANSPORTATION AND TRAVELER INFORMATION INTEGRATION BETWEEN AGENCIES..........................................................................................................................29
7 Transportation System Impacts Evaluation...................................................................... 31 7.1 IMPACTS TO MODE SHIFTING AND INTERMODALISM ....................................................................................31 7.2 IMPACTS TO TRAFFIC SAFETY AND ACCIDENT REDUCTION..........................................................................31 7.3 IMPACTS TO TRAFFIC CONGESTION ..............................................................................................................33 7.4 IMPACTS TO ENVIRONMENTAL EFFECTS OF TRAFFIC....................................................................................35 7.5 IMPACTS ON TRANSIT OPERATIONS..............................................................................................................37
8 Conclusions and Recommendations ................................................................................... 38 Endnotes/References................................................................................................................... 40

OCMDI Evaluation Report
ii
Disclaimer The contents of this report reflect the views of the author who is responsible for the facts and accuracy of the data presented herein. The contents do not necessarily reflect the official views or policies of the State of California, Caltrans or the U.S. Federal Highway Administration. This report does not constitute a standard, specification, or regulation.

OCMDI Evaluation Report
iii
Abbreviations & Acronyms ATIS Advanced Traveler Information System ATMS Advanced Transportation Management System AVL Automatic Vehicle Location Caltrans California Department of Transportation CCTV Closed-circuit Television surveillance camera CEO Chief Executive Officer CFO Chief Financial Officer CHP California Highway Patrol CM Configuration Management CMP Configuration Management Plan CMS Changeable Message Sign CORBA Common Object Request Broker Architecture COTS Commercial Off-the-Shelf CTC California Transportation Commission CVO Commercial Vehicle Operations CW Corridor-wide CWATIS Corridor-wide Advanced Traveler Information System Project CWATMS Corridor-wide Advanced Transportation Management System Project CWCVO Corridor-wide Commercial Vehicle Operations Project CWSIP Corridor-wide Systems Integration Project CWSPP Corridor-wide Strategic Planning Project DOIT Department of Information Technology DRI Caltrans Division of Research & Innovation (formerly NTR) EAP Evaluation Activity Plan EP Evaluation Plan FHWA Federal Highway Administration FSR Feasibility Study Report FTA Federal Transit Administration FTE Full-Time Equivalent (one full-time employee) GPRA Government Performance and Results Act GUI Graphical User Interface HP Hewlett-Packard HQIT Headquarters - Information Technology (division of Caltrans) IDL Interface Definition Language IPR Intellectual Property Rights ISP Information Service Provider ISSC Information Systems Service Center (division of Caltrans) ISTEA Intermodal Surface Transportation Efficiency Act (of 1991) ITS Intelligent Transportation Systems LACDPW Los Angeles County Department of Public Works LADOT City of Los Angeles Department of Transportation LAN Local Area Network MOU Memorandum of Understanding
OCMDI Evaluation Report
iv
MPO Metropolitan Planning Organization MTA Los Angeles County Metropolitan Transportation Authority MTBF Mean Time Between Failure NDA Non-Disclosure Agreement NET National Engineering Technology Corporation NTCIP National Transportation Communications for ITS Protocol NTR Caltrans Division of New Technology & Research (now DRI) OCMDI Orange County Model Deployment Initiative OCTA Orange County Transportation Authority O&M Operations and Maintenance OS Operating system (such as Windows, Unix, Linux, et. al.) PC Personal Computer (typically Intel-based) RCTC Riverside County Transportation Commission RFP Request for Proposals RTP Regional Transportation Plan RTPA Regional Transportation Planning Agency RWS Remote Workstation SANBAG San Bernardino Association of Governments SANDAG San Diego Association of Governments SCAG Southern California Association of Governments SCAQMD South Coast Air Quality Management District SCPCSC Southern California Priority Corridor Steering Committee TANN Traveler Advisory News Network TEA-21 Transportation Equity Act for the 21st Century THE PARTNERSHIP Southern California Economic Partnership TMC Transportation Management Center TTO TANN Transportation Object USDOT United States Department of Transportation VCTC Ventura County Transportation Commission VDS Vehicle Detector Station VMT Vehicle Miles Traveled VOS Volume/Occupancy/Speed WAN Wide Area Network

OCMDI Evaluation Report
1
Executive Summary
Background As required by federal law, all Intelligent Transportation System (ITS) projects that receive federal funding must undergo an evaluation to help assess the costs and benefits of ITS. This document is one of 23 reports produced as part of the Southern California ITS Priority Corridor Showcase Program Evaluation to help planners and decision-makers at the federal, state and local levels make better-informed decisions regarding future ITS deployments. This report presents the experiences, costs, and lessons learned from Southern California’s OCMDI project. In 1993, the U.S. Department of Transportation designated Southern California as one of four Priority Corridors in which ITS could have particular benefit. Southern California suffers from extreme traffic congestion, limited room for expanding transportation facilities, and above-average air pollution levels. The Southern California Priority Corridor is one of the most populated, traveled, and visited regions in the country, and consists of four adjoining regions:
Los Angeles/Ventura Orange County San Diego County Inland Empire (San Bernardino and Riverside Counties).
The ITS Showcase Program is one of several programs that have been implemented in Southern California’s Priority Corridor to help aid mobility and mitigate traffic congestion and its associated environmental impacts. The Showcase Program consists of 17 ITS projects that collectively form a corridor-wide intermodal transportation management and information network between Los Angeles, Orange County, San Diego, and the Inland Empire. Each Showcase project deploys a piece of this corridor-wide ITS network, including regional Advanced Traveler Information Systems (ATIS), regional Advanced Transportation Management Systems (ATMS), and regional and interregional communications infrastructure. Eleven of the projects are regional in nature, while the remaining six are corridor-wide. The Orange County Model Deployment Initiative (OCMDI) is one of the eleven regional projects within the Southern California Priority Corridor ITS Showcase Program. The OCMDI extends the region's traveler information infrastructure by developing a hardware/software system and instituting the Traveler Advisory News Network (TANN). Technologically, the intent of the OCMDI project was to develop a single interface point through which a wide variety of transportation data would be gathered from an assortment of public agencies and be made available to private sector Information Service providers (ISPs). The ISPs then use the data to provide traveler information to the public via a wide range of products, including in-vehicle units, hand-held devices, pagers, Internet/Intranet, cable TV, etc. Institutionally, the TANN organization is the service and
OCMDI Evaluation Report
2
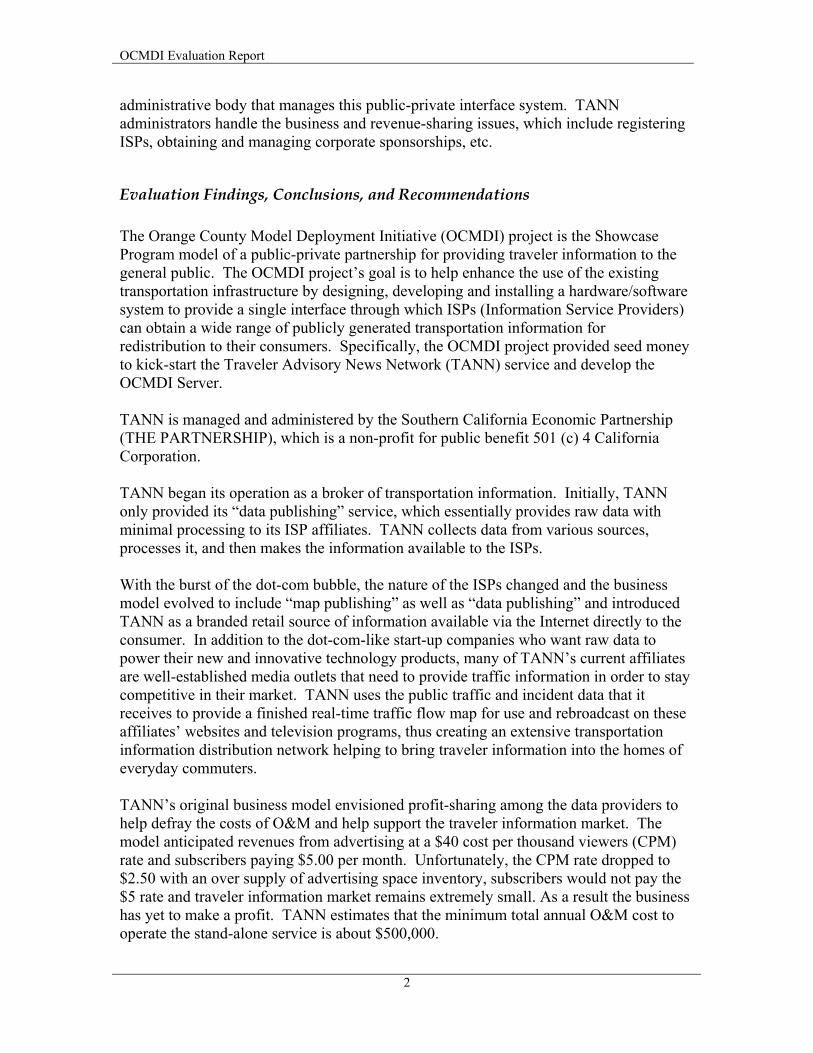
administrative body that manages this public-private interface system. TANN administrators handle the business and revenue-sharing issues, which include registering ISPs, obtaining and managing corporate sponsorships, etc.
Evaluation Findings, Conclusions, and Recommendations The Orange County Model Deployment Initiative (OCMDI) project is the Showcase Program model of a public-private partnership for providing traveler information to the general public. The OCMDI project’s goal is to help enhance the use of the existing transportation infrastructure by designing, developing and installing a hardware/software system to provide a single interface through which ISPs (Information Service Providers) can obtain a wide range of publicly generated transportation information for redistribution to their consumers. Specifically, the OCMDI project provided seed money to kick-start the Traveler Advisory News Network (TANN) service and develop the OCMDI Server. TANN is managed and administered by the Southern California Economic Partnership (THE PARTNERSHIP), which is a non-profit for public benefit 501 (c) 4 California Corporation. TANN began its operation as a broker of transportation information. Initially, TANN only provided its “data publishing” service, which essentially provides raw data with minimal processing to its ISP affiliates. TANN collects data from various sources, processes it, and then makes the information available to the ISPs. With the burst of the dot-com bubble, the nature of the ISPs changed and the business model evolved to include “map publishing” as well as “data publishing” and introduced TANN as a branded retail source of information available via the Internet directly to the consumer. In addition to the dot-com-like start-up companies who want raw data to power their new and innovative technology products, many of TANN’s current affiliates are well-established media outlets that need to provide traffic information in order to stay competitive in their market. TANN uses the public traffic and incident data that it receives to provide a finished real-time traffic flow map for use and rebroadcast on these affiliates’ websites and television programs, thus creating an extensive transportation information distribution network helping to bring traveler information into the homes of everyday commuters. TANN’s original business model envisioned profit-sharing among the data providers to help defray the costs of O&M and help support the traveler information market. The model anticipated revenues from advertising at a $40 cost per thousand viewers (CPM) rate and subscribers paying $5.00 per month. Unfortunately, the CPM rate dropped to $2.50 with an over supply of advertising space inventory, subscribers would not pay the $5 rate and traveler information market remains extremely small. As a result the business has yet to make a profit. TANN estimates that the minimum total annual O&M cost to operate the stand-alone service is about $500,000.
OCMDI Evaluation Report
3
The OCMDI Server portion of the project followed a systems engineering process and was successfully completed in 24 months. Although the OCMDI project was eventually successful in designing and implementing the specified OCMDI Server system, TANN management decided about a year into the contract that the server was taking too long to develop and TANN had business obligations that were not being met. As a result, TANN concurrently developed its own server in-house with less time and money than the OCMDI Server project. TANN management believes that publicly-funded system development contracts are too “process driven” and do not focus enough on the desired end products or respond quickly enough to changes in market conditions. The server developed under the OCMDI project was never used in TANN’s day-to-day business operations. Although partially funded through the Showcase Program, the TANN system does not utilize the Showcase Network; it uses the Internet and other leased services to implement its ITS Architecture. TANN had hoped to integrate with and receive local Orange County data from TravelTIP, a fellow Showcase project; however, design changes within TravelTIP discouraged and indefinitely delayed this integration. The fact that TANN operates like a private enterprise enables it to be flexible and react quickly to changing ATIS market conditions. For example, TANN uses a third-party Internet hosting service (XO Communications) to lease enough hardware, bandwidth and technical support to match its business demand and provide fast, reliable service to its clients. These items can be easily adjusted as conditions change. Commuters seem to like the service, though network-wide benefits are still not clearly evident. 87% of the respondents to a TANN User Survey conducted by the Volpe Center reported that the system has saved them travel time, although highway statistics from Caltrans and California’s Partnership for Advanced Transit and Highways (PATH) do not show clear evidence of any aggregate, network-wide savings or improvements.
OCMDI Evaluation Report
4
1 Introduction
1.1 Purpose and Scope of this Report As required by federal law1, all Intelligent Transportation System (ITS) projects that receive federal funding must undergo an evaluation to help assess the costs and benefits of ITS. The information provided in this report is intended to help planners and decision-makers at the federal, state and local levels make better-informed decisions regarding future ITS deployments based on the experiences of Southern California’s OCMDI project. This document is one of 23 reports produced as part of the Southern California ITS Priority Corridor Showcase Program Evaluation, and covers only the events and findings resulting from the OCMDI evaluation. The complete set of findings from the Showcase Program Evaluation are found in the following collection of documents: Document Type/Title Date Document Number 17 Individual Project Evaluation Reports
Corridor-wide ATIS Project Report 7/16/2003 65A0030/0033 Corridor-wide ATMS Project Report TBD Corridor-wide CVO Project Report TBD Corridor-wide Rideshare Project Report TBD Corridor-wide Strategic Planning Project Report 10/29/2002 65A0030/0028 Fontana-Ontario ATMIS Project Report TBD IMAJINE Project Report 3/17/2003 65A0030/0029 IMTMC Project Report TBD InterCAD Project Report 4/2/2003 65A0030/0030 Kernel Project Report 5/30/2003 65A0030/0031 LA ATIS Project Report TBD Mission Valley ATMIS Project Report TBD Mode Shift Project Report TBD OCMDI Project Report 2/20/2004 65A0030/0040 Traffic Signal Integration Project Report TBD Transit Mgt System Project Report TBD TravelTIP Project Report 2/16/2004 65A0030/0036
5 Cross-Cutting Evaluation Reports System Performance Cross-Cutting Report TBD Costs Cross-Cutting Report TBD Institutional Issues Cross-Cutting Report TBD Information Management Cross-Cutting Report TBD Transportation System Impacts Cross-Cutting Report TBD
Final Summary Evaluation Report Showcase Program Evaluation Summary Report TBD
“TBD” indicates a future deliverable that is not yet available.
OCMDI Evaluation Report
5
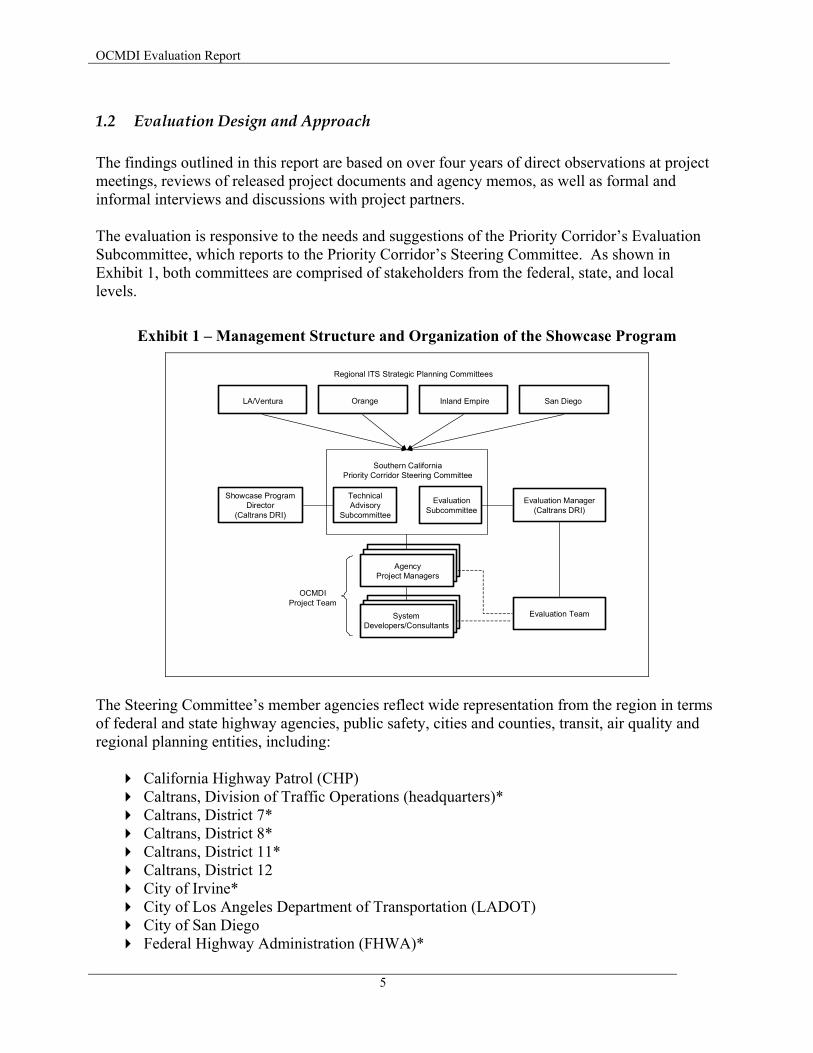
1.2 Evaluation Design and Approach The findings outlined in this report are based on over four years of direct observations at project meetings, reviews of released project documents and agency memos, as well as formal and informal interviews and discussions with project partners. The evaluation is responsive to the needs and suggestions of the Priority Corridor’s Evaluation Subcommittee, which reports to the Priority Corridor’s Steering Committee. As shown in Exhibit 1, both committees are comprised of stakeholders from the federal, state, and local levels.
Exhibit 1 – Management Structure and Organization of the Showcase Program
LA/Ventura Orange Inland Empire San Diego
TechnicalAdvisory
Subcommittee
EvaluationSubcommittee
Southern CaliforniaPriority Corridor Steering Committee
Evaluation Manager(Caltrans DRI)
Regional ITS Strategic Planning Committees
Evaluation Team
Showcase Program Director
(Caltrans DRI)
AgencyProject Managers
SystemDevelopers/Consultants
OCMDIProject Team
The Steering Committee’s member agencies reflect wide representation from the region in terms of federal and state highway agencies, public safety, cities and counties, transit, air quality and regional planning entities, including:
California Highway Patrol (CHP) Caltrans, Division of Traffic Operations (headquarters)* Caltrans, District 7* Caltrans, District 8* Caltrans, District 11* Caltrans, District 12 City of Irvine* City of Los Angeles Department of Transportation (LADOT) City of San Diego Federal Highway Administration (FHWA)*

OCMDI Evaluation Report
6
Federal Transit Administration (FTA) Los Angeles County Metropolitan Transportation Authority (MTA) Orange County Transportation Authority (OCTA) Riverside County Transportation Commission (RCTC) San Bernardino Association of Governments (SANBAG) San Diego Association of Governments (SANDAG) South Coast Air Quality Management District (SCAQMD) Southern California Association of Governments (SCAG).
* Indicates an Evaluation Subcommittee member The Showcase Program’s Evaluation Design is based on a set of evaluation Goals and supporting Objectives and Measures that were developed by the Evaluation Team in partnership with federal, state and local stakeholders, and documented in the “Showcase Program Evaluation Approach” in 1998. Each individual Showcase project is evaluated based on an applicable subset of these Goals, Objectives, and Measures in order to help ensure that summary evaluation results can be aggregated from across the multiple Showcase project evaluations. The Showcase Program’s five evaluation Goals include:
Evaluate System Performance
Evaluate Costs
Evaluate Institutional Issues and Impacts
Evaluate the Use and Management of Transportation/Traveler Information
Evaluate Transportation System Impacts. As the OCMDI project evolved, project-specific refinements to the evaluation design were documented in a high-level Evaluation Plan (EP) and a detailed Evaluation Activity Plan (EAP). In general, the EP describes the project and/or system under evaluation, and lays the foundation for further evaluation activities by developing consensus among the Evaluation Subcommittee and project partners as to which of Showcase’s evaluation Goals, Objectives, and Measures best apply to the project. As the project matured, and after the EP had been approved, an EAP was developed to plan, schedule, and describe specific activities (e.g., interviews, surveys) and step-by-step procedures for conducting the evaluation. Data collection began after both plans had been reviewed and subsequently approved by the Evaluation Subcommittee and the project’s partners.
OCMDI Evaluation Report
7
1.3 Organization of this Report The OCMDI Evaluation Report provides a background description of the Southern California Priority Corridor and the transportation challenges facing Orange County. This is followed by descriptions of the Showcase Program and the OCMDI project, including a detailed technical description. In general, each Showcase evaluation report is subdivided and ordered into the five topic areas described below: System Performance where appropriate, provides important benchmark information regarding system availability, reliability, scalability and compatibility. The evaluation quantifies those items and could be used to identify needed improvements and help develop specifications for future systems. Cost provides important benchmark information regarding project budget, funding sources, software licensing, development costs, costs to re-deploy elsewhere or expand the system, and operations and maintenance (O&M) costs. This section includes an estimate of how much it might cost to re-deploy the system "from scratch" elsewhere, and also looks at the incremental costs for integrating additional partners and/or peripherals into the existing system. Institutional Impacts provides important information regarding the administrative, procedural and legal impacts resulting from the project. Such impacts include changes in operator workloads, responsibilities and job turnover rates, as well as changes and limitations of agency-wide policies, procedures and guidelines. Transportation & Traveler Information Management provides important benchmark information on system usage and user acceptance (by both agency operators and the general public). This report provides both quantitative and qualitative findings on those items and can be used to identify user demand, needed improvements and potential areas of future growth. Transportation System Impacts where appropriate, provides important information regarding the project's impacts on transit usage, traffic congestion, air quality, and traffic safety. The report concludes with a summary, final remarks and recommendations for next steps. Several appendices contain supporting documentation such as technical designs and copies of evaluation data collection instruments (blank questionnaires and survey).
1.4 Privacy Considerations Some of the information acquired in the interview and discussion process could be considered sensitive and has been characterized in this report without attribution. The Evaluation Team has taken precautions to safeguard responses and maintain their confidentiality. Wherever possible, interview responses have been aggregated during analysis such that individual responses have become part of a larger aggregate response. The names of individuals and directly attributable
OCMDI Evaluation Report
8
quotes have not been used in this document unless the person has reviewed and expressly consented to its use.
1.5 Constraints & Assumptions The OCMDI evaluation is subject to the following constraints and assumptions:
The project’s consultant was not required to disclose actual project expenses, so the project’s cost is based on the fixed-price budget stipulated in the OCMDI contract and its amendments. The budget reflects the expenses and costs for services paid by the client agency, but not necessarily the actual detailed costs for goods and services comprising the project.
1.6 Project Background
1.6.1 The Southern California Priority Corridor In 1993, the U.S. Department of Transportation designated Southern California as one of four Priority Corridors in which Intelligent Transportation Systems (ITS) could have particular benefit. The Southern California Priority Corridor, illustrated in Exhibit 2, is one of the most populated, traveled, and visited regions in the country. Roughly two-thirds of the state’s population – about 20 million people – resides in or around the Southern California Priority Corridor. It suffers from extreme traffic congestion, limited room for expanding transportation facilities, and above-average air pollution levels. The Southern California Priority Corridor consists of four distinct regions that correspond with the four Southern California Caltrans districts:
Los Angeles/Ventura (Caltrans District 7) San Diego (Caltrans District 11) Orange County (Caltrans District 12) Inland Empire (Caltrans District 8)

OCMDI Evaluation Report
9
Exhibit 2 – The Southern California Priority Corridor and Vicinity
MEXICO
Exhibit 3 – Population and Number of Registered Vehicles by County
County Population2 (as of 7/1/2001)
Registered Vehicles3* (as of 12/31/2000)
Caltrans District
Los Angeles 9.7 million 6.2 million 7 Orange 2.9 million 2.1 million 12 San Diego 2.9 million 2.1 million 11 San Bernardino 1.8 million 1.1 million 8 Riverside 1.6 million 1.1 million 8 Ventura 0.8 million 0.6 million 7 Imperial 0.15 million 0.1 million 11 Total 19.85 million 12.7 million
*Includes autos, trucks, and motorcycles. Trailers not included.
1.6.2 The Southern California Priority Corridor’s ITS Showcase Program The ITS Showcase Program is one of several programs that have been implemented in Southern California’s Priority Corridor to help aid mobility and mitigate traffic congestion and its associated environmental impacts. The Southern California ITS Showcase Program consists of 17 individual ITS projects that collectively form a corridor-wide intermodal transportation management and information network between Los Angeles, Orange County, San Diego, and the Inland Empire. Eleven of the projects are regional in nature, while the remaining six are corridor-wide in scope. The OCMDI project is one of the eleven regional projects.
OCMDI Evaluation Report
10
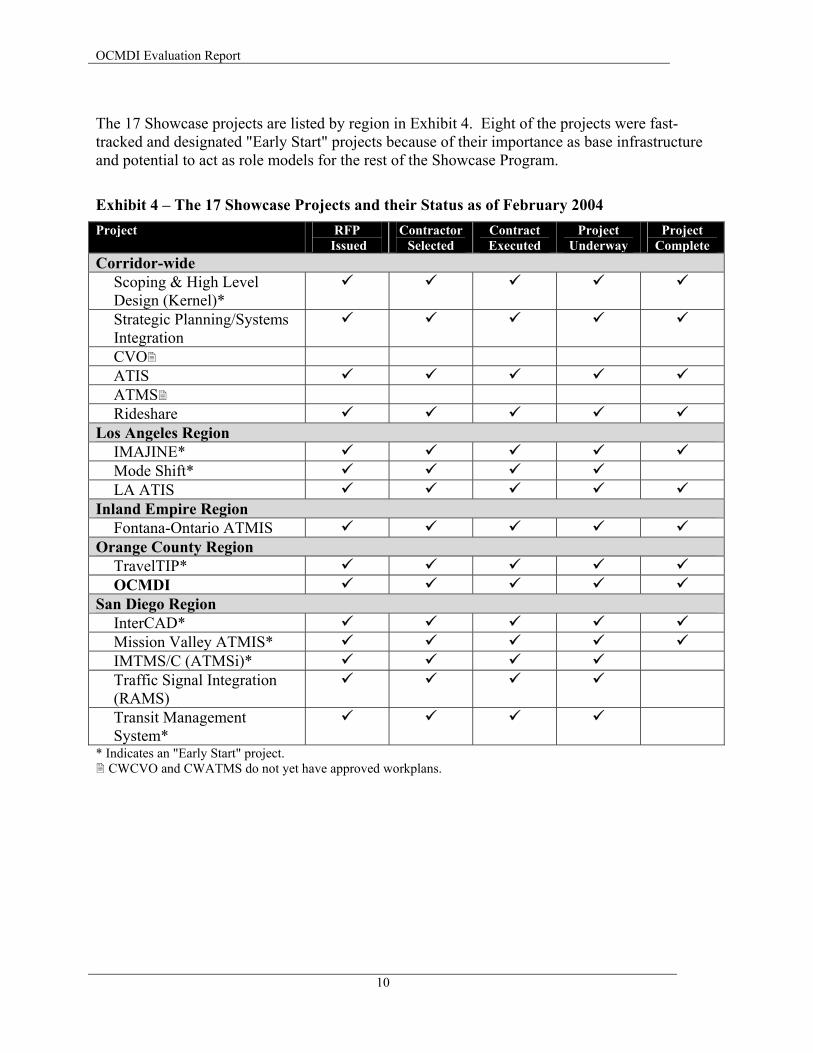
The 17 Showcase projects are listed by region in Exhibit 4. Eight of the projects were fast-tracked and designated "Early Start" projects because of their importance as base infrastructure and potential to act as role models for the rest of the Showcase Program.
Exhibit 4 – The 17 Showcase Projects and their Status as of February 2004 Project RFP
Issued Contractor
Selected Contract Executed
Project Underway
Project Complete
Corridor-wide Scoping & High Level Design (Kernel)*
Strategic Planning/Systems Integration
CVO ATIS ATMS Rideshare
Los Angeles Region IMAJINE* Mode Shift* LA ATIS
Inland Empire Region Fontana-Ontario ATMIS
Orange County Region TravelTIP* OCMDI
San Diego Region InterCAD* Mission Valley ATMIS* IMTMS/C (ATMSi)* Traffic Signal Integration (RAMS)
Transit Management System*
* Indicates an "Early Start" project. CWCVO and CWATMS do not yet have approved workplans.
OCMDI Evaluation Report
11
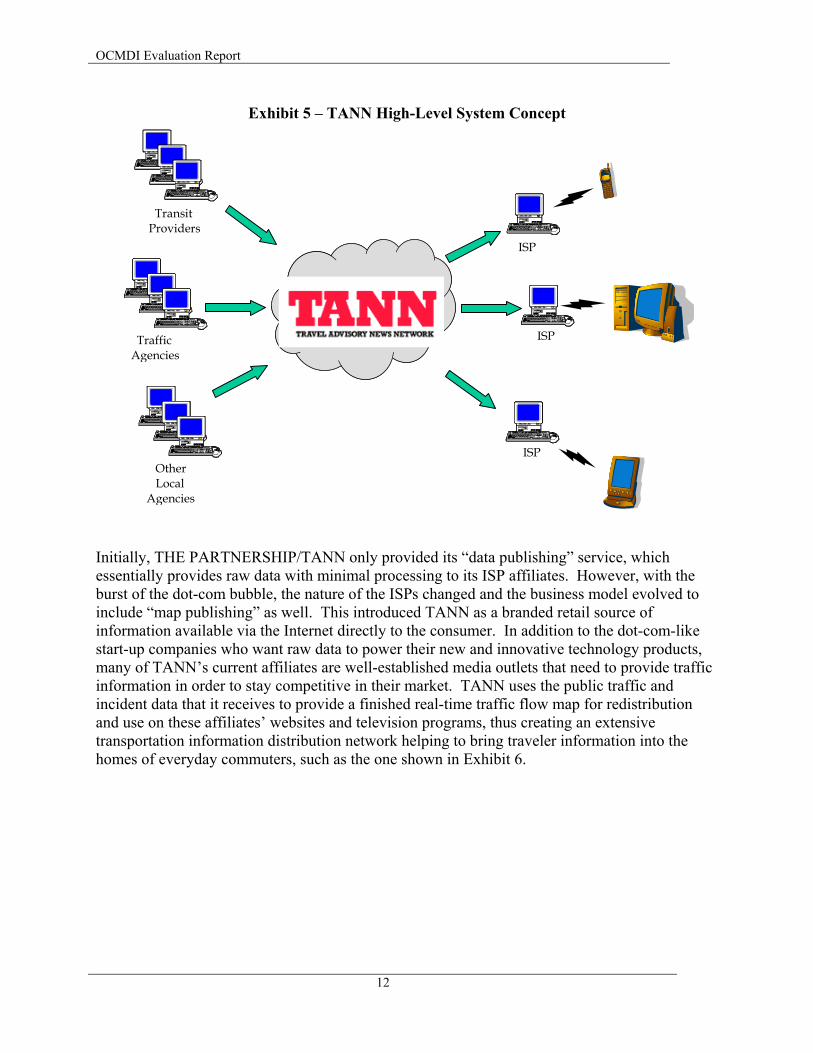
2 Project/System Technical Description The Orange County Model Deployment Initiative (OCMDI) project is the Showcase Program model of a public-private partnership for providing traveler information to the general public. The OCMDI's project goal is to help enhance the use of the existing transportation infrastructure by designing, developing and installing a hardware/software system to provide a single interface through which ISPs (Information Service Providers) can obtain a wide range of publicly generated transportation information for redistribution to their consumers. This widespread traveler information distribution service has been branded the Traveler Advisory News Network (TANN). TANN is managed and administered by the Southern California Economic Partnership (THE PARTNERSHIP), which is a non-profit for public benefit 501 (c) 4 California Corporation. The Partnership was established in 1994 by the Southern California Association of Governments (SCAG), the South Coast Air Quality Management District (SCAQMD), and Caltrans as an entity that would utilize market forces to influence the reduction of traffic congestion and mobile source emissions in the region. The Partnership, with a 15-member public/private board of directors has the mission to “Accelerate Deployment of Advanced Transportation Technologies.” The Partnership originally proposed the TANN concept in 1996 as response to a FHWA Model Deployment Initiative (MDI) RFP. The Partnership was later selected through an OCTA RFP process to implement the TANN concept. THE PARTNERSHIP/TANN started out essentially as a broker of transportation information. It collects data from various sources, processes it, and then makes the information available to the ISPs. TANN refers to this as its “data publishing” business. There are a number of anticipated benefits to this approach:
1. Public agencies would only ever have to deal with THE PARTNERSHIP/TANN. In the past, public agencies such as Caltrans would be approached by many different ISPs who all wanted similar data, but maybe in particular formats or under specific institutional arrangements tailored to them. In the case of Caltrans, this forced the agency to develop and maintain several essentially redundant systems and agreements. Through the work of the OCMDI project, these public agencies would only have to maintain one system and one agreement to provide data in a standard format to TANN.
2. Similarly, ISPs would have a single, one-stop source for all of their transportation data
needs. ISPs would no longer have to approach every transportation agency in the region in order to get complete data coverage. Through the OCMDI project, ISPs would only have to negotiate and maintain a single data feed from TANN.
OCMDI Evaluation Report
12
Exhibit 5 – TANN High-Level System Concept
Transit Providers
Traffic Agencies
Other Local
Agencies
ISP
ISP
ISP
Initially, THE PARTNERSHIP/TANN only provided its “data publishing” service, which essentially provides raw data with minimal processing to its ISP affiliates. However, with the burst of the dot-com bubble, the nature of the ISPs changed and the business model evolved to include “map publishing” as well. This introduced TANN as a branded retail source of information available via the Internet directly to the consumer. In addition to the dot-com-like start-up companies who want raw data to power their new and innovative technology products, many of TANN’s current affiliates are well-established media outlets that need to provide traffic information in order to stay competitive in their market. TANN uses the public traffic and incident data that it receives to provide a finished real-time traffic flow map for redistribution and use on these affiliates’ websites and television programs, thus creating an extensive transportation information distribution network helping to bring traveler information into the homes of everyday commuters, such as the one shown in Exhibit 6.

OCMDI Evaluation Report
13
Some of TANN’s affiliates include:
AccessTimeWarner.com Los Angeles Daily News (DailyNews.com) AvantGo Los Angeles Times (LATimes.com) Cue MetroCommute Fox Channel 11, Los Angeles Metro Dynamics InfoMove Oakland Tribune Group (InsideBayArea.com) Inland Empire Press Enterprise Orange County Register (OCRegister.com) Iteris StarTraffic KABC Channel 7, Los Angeles TeleAtlas (formerly Etak) KNX AM 1070 TrafficCast LA.com Traffic.com
The following exhibit is a screenshot of the AccessTimeWarner.com website and the TANN traffic flow map for the greater Los Angeles area.
Exhibit 6 – Screenshot of TANN Traffic Flowmap for Los Angeles
Technologically, the interface between the public agencies, TANN and the ISPs is accomplished through a single server running custom-developed object-oriented software. This server

OCMDI Evaluation Report
14
processes the incoming stream of data from public agencies and makes it available to ISPs in XML format as TANN Transportation Objects (TTOs). The various TTOs are optimized (i.e., smaller) versions of Showcase standard objects, and are designed for faster and more efficient transfer over the Internet. While the OCMDI project was still ongoing, and in order to keep pace with its own contractual commitments and the rapid advancements in technology occurring at the time, THE PARTNERSHIP/TANN chose to begin development of a second, more state-of-the-art server in-house. This evaluation report refers to that second server as the “TANN Server,” which should not be confused with the TANN Server named in the OCMDI project’s documentation. This evaluation report refers to the server developed by Iteris under contract to OCTA for the OCMDI project as the “OCMDI Server.” A high-level diagram of TANN’s system design is provided below as Exhibit 7.
Exhibit 7 – TANN High-Level System Diagram
Data in from providers
Data and maps out to ISPs and other TANN affiliates
Application Servers at TANN Headquarters
‘TANN Server’ at XO Communications
Leased T1 line
Data in from providers
Data and maps out to ISPs and other TANN affiliates
Application Servers at TANN Headquarters
‘TANN Server’ at XO Communications
Leased T1 line
The “TANN Server” currently resides at XO Communications, which is a third-party web-hosting service provider. The server hardware, communications bandwidth, and operations and

OCMDI Evaluation Report
15
maintenance support for the TANN Server are all leased from XO Communications. This server runs TANN’s custom software for gathering raw data from providers and publishing formatted data and real-time traffic maps back out to the ISPs and other affiliates. The actual processing of the raw data and the production of the real-time traffic maps occurs on four application servers hosted, owned, operated and maintained by TANN at its headquarters facility in Diamond Bar, California. Communications access to and from the headquarters facility is provided by a leased T1 landline.
OCMDI Evaluation Report
16
3 System Performance Evaluation
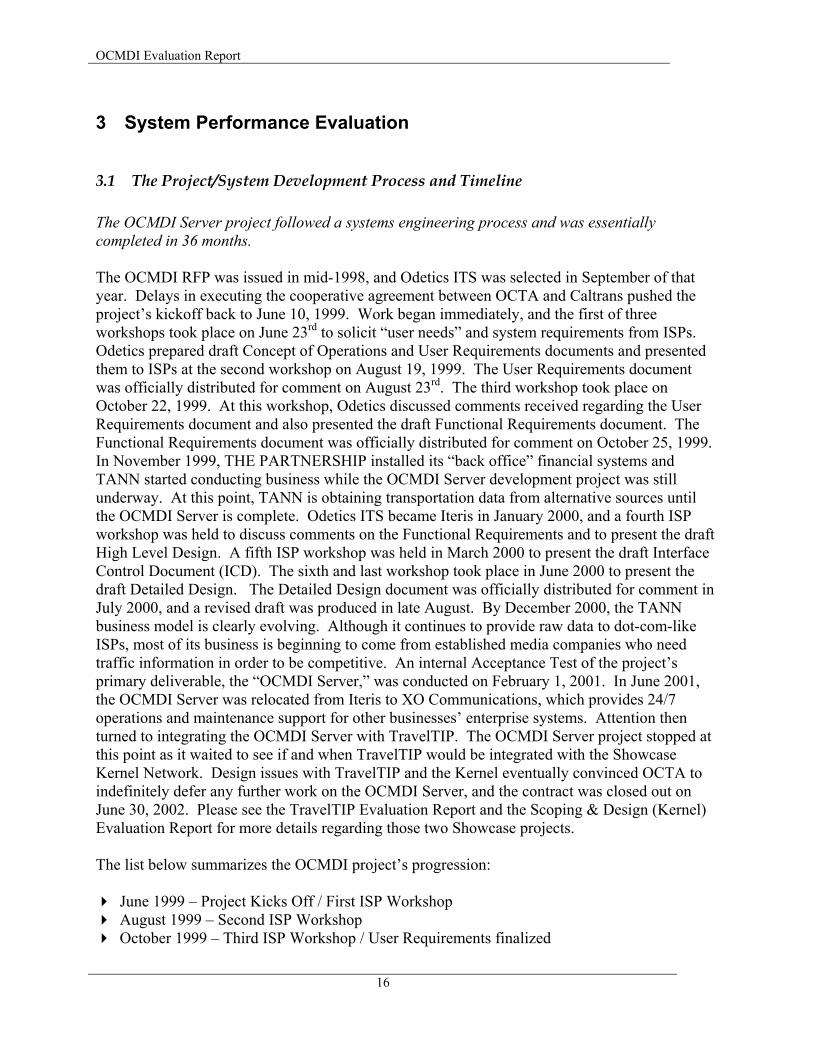
3.1 The Project/System Development Process and Timeline The OCMDI Server project followed a systems engineering process and was essentially completed in 36 months. The OCMDI RFP was issued in mid-1998, and Odetics ITS was selected in September of that year. Delays in executing the cooperative agreement between OCTA and Caltrans pushed the project’s kickoff back to June 10, 1999. Work began immediately, and the first of three workshops took place on June 23rd to solicit “user needs” and system requirements from ISPs. Odetics prepared draft Concept of Operations and User Requirements documents and presented them to ISPs at the second workshop on August 19, 1999. The User Requirements document was officially distributed for comment on August 23rd. The third workshop took place on October 22, 1999. At this workshop, Odetics discussed comments received regarding the User Requirements document and also presented the draft Functional Requirements document. The Functional Requirements document was officially distributed for comment on October 25, 1999. In November 1999, THE PARTNERSHIP installed its “back office” financial systems and TANN started conducting business while the OCMDI Server development project was still underway. At this point, TANN is obtaining transportation data from alternative sources until the OCMDI Server is complete. Odetics ITS became Iteris in January 2000, and a fourth ISP workshop was held to discuss comments on the Functional Requirements and to present the draft High Level Design. A fifth ISP workshop was held in March 2000 to present the draft Interface Control Document (ICD). The sixth and last workshop took place in June 2000 to present the draft Detailed Design. The Detailed Design document was officially distributed for comment in July 2000, and a revised draft was produced in late August. By December 2000, the TANN business model is clearly evolving. Although it continues to provide raw data to dot-com-like ISPs, most of its business is beginning to come from established media companies who need traffic information in order to be competitive. An internal Acceptance Test of the project’s primary deliverable, the “OCMDI Server,” was conducted on February 1, 2001. In June 2001, the OCMDI Server was relocated from Iteris to XO Communications, which provides 24/7 operations and maintenance support for other businesses’ enterprise systems. Attention then turned to integrating the OCMDI Server with TravelTIP. The OCMDI Server project stopped at this point as it waited to see if and when TravelTIP would be integrated with the Showcase Kernel Network. Design issues with TravelTIP and the Kernel eventually convinced OCTA to indefinitely defer any further work on the OCMDI Server, and the contract was closed out on June 30, 2002. Please see the TravelTIP Evaluation Report and the Scoping & Design (Kernel) Evaluation Report for more details regarding those two Showcase projects. The list below summarizes the OCMDI project’s progression: June 1999 – Project Kicks Off / First ISP Workshop August 1999 – Second ISP Workshop October 1999 – Third ISP Workshop / User Requirements finalized

OCMDI Evaluation Report
17
November 1999 – TANN becomes operational January 2000 – Odetics ITS becomes Iteris / Fourth ISP Workshop / Functional Requirements finalized March 2000 – Fifth ISP Workshop / High Level Design finalized June 2000 – Sixth ISP Workshop August 2000 – Detailed Design finalized February 2001 – “OCMDI Server” Internal Acceptance Test June 2001 – “OCMDI Server” moved to XO Communications June 2002 – OCMDI Server contract closed out.
3.2 System Reliability, Availability, Compatibility, and Scalability
3.2.1 System Reliability and Availability There has been no evidence of any system failures. Although never put into revenue service, the OCMDI Server was successfully completed and tested. It has been demonstrated on several occassions, and performed well each time. The TANN Server, though not funded by the Showcase Program, has been used in TANN’s day-to-day operations since November 1999.
3.2.2 Compatibility There are no indications of any system incompatibilities. Compatibility is the ability of two or more systems or components to perform their required functions while sharing the same hardware or software environment. There have not been any system failures or anomalies that would indicate an incompatibility with the existing software/hardware environment.
3.2.3 Scalability TANN’s scalability is demonstrated by its growth and how quickly it can react to the needs of its clients. TANN started off in late 1999 with five ISP partners focused on Orange County and Los Angeles. Over the past four years, it has grown to more than 16 affiliates in 10 metropolitan markets nationwide.

OCMDI Evaluation Report
18
While TANN started with only data publishing, it quickly began to offer map publishing for Internet applications and then map publishing for PDAs and WAP Cell Phones. Data publishing was modified to XML accommodated text to voice messages and in-vehicle navigation requirements. In 2001, KABC Channel 7 in Los Angeles approached TANN to provide content for an on-air traffic report. TANN was able to make the necessary changes and provide the desired content within 24 hours of the request.
The use of a third-party service provider (XO Communications) enables TANN to lease enough service to match its demand. TANN/THE PARTNERSHIP leases server hardware, high-bandwidth Internet access and 24/7 operations and maintenance support from XO Communications. At the moment, the current server hardware and communications bandwidth is sufficient; however, should the load on this system increase, more capability could be purchased.
3.3 Impact of Showcase Integration on Project Deployment and System Performance The OCMDI is one of 17 projects that make up the Showcase Program and Network. As such, many interdependencies developed between the projects as plans were made for eventual regional and corridor-wide integration. This section describes how these interdependencies may have impacted the OCMDI and other Showcase projects.
3.3.1 Impact of the OCMDI on other Showcase Projects The San Diego ATIS project may borrow lessons from the OCMDI business model The OCMDI project, and TANN, is Southern California’s latest and boldest attempt at a public-private partnership for providing traveler information to the public. In its three years of operation, TANN has had the opportunity to learn what does and does not work, and refine its business model in order to become a more sustainable enterprise. The San Diego ATIS/Corridorwide CVO (CWCVO) project could benefit from the lessons learned by TANN during the OCMDI experience.
3.3.2 Impact of other Showcase Projects on OCMDI TravelTIP’s Kernel-lite Discouraged Integration with the OCMDI The OCMDI had planned to integrate with and obtain much of its Southern California data from TravelTIP and the Showcase Network; however, a number of technical and institutional issues
OCMDI Evaluation Report
19
have indefinitely deferred that integration. The first issue is TravelTIP’s reliance on “Kernel-lite,” which was a stopgap measure taken by OCTA to mitigate the schedule impacts of the delayed Showcase Kernel. Kernel-lite is custom software developed by TravelTIP’s System Integrator to provide only the most essential Kernel services in the absence of the official Showcase Kernel. Although development of Kernel-lite enabled the development of TravelTIP to continue, it made TravelTIP incompatible with the rest of the Showcase Network. OCTA, as the contract manager, chose not to integrate the OCMDI system with TravelTIP until this incompatibility is corrected. However, questions about the future of the Showcase Kernel have indefinitely delayed further work on correcting TravelTIP’s reliance on Kernel-lite.
OCMDI Evaluation Report
20
4 Cost Evaluation The cost evaluation draws information from documented costs and personal interviews. Budget information was taken directly from the project's contract and amendments, while operations and maintenance costs were obtained from discussions with agency personnel. Informal interviews were conducted to verify information and fill in any "holes" that were discovered during analysis.
4.1 Constraints & Assumptions There are two primary considerations for the Cost Evaluation: Since OCMDI was funded through a firm fixed price contract, the project’s budget
information reflects the expenses and costs for services paid by the client agency, but not necessarily the actual detailed costs for goods and services comprising the project. Operations and maintenance (O&M) costs have been estimated based on available information and certain assumptions indicated later in this section.
4.2 Project Budget & Estimated Development Costs This section addresses the project’s contracted tasks and budget, as well as its role in supporting the Showcase Program’s “design once, deploy many times” philosophy.
4.2.1 Project Budget The OCMDI provided seed money to start TANN and develop the OCMDI Server, but TANN developed its own server with less time and money. A total of $2,500,000 was made available through the Orange County Transportation Authority (OCTA) for the OCMDI project, and three contracts were used to pull together the project team. These contracts were between OCTA and the following entities:
Iteris (formerly Odetics ITS) Metro Dynamics THE PARTNERSHIP
Scope and budget information regarding each of these contracts follows.

OCMDI Evaluation Report
21
Exhibit 8 – Project Budget per Contract per Task4 Task/Cost Item Iteris
(Odetics) Metro
Dynamics THE
PARTNERSHIP TOTAL
Task 0 – Project/Contract Management $208,343 $208,343 Task 1 – User Needs Assessment $57,575 $57,575 Task 2 – Requirements $178,434 $178,434 Task 3 – MDI Architecture High Level Design $317,720 $317,720 Subtask 3.3 – Contract Addendum/Revenue Sharing
$25,000 $25,000
Task 4 – Project Deployment Subtask 4.1 – Traffic Check Television $225,000 $225,000 Subtask 4.2 – FM Subcarrier Communication $180,000 $180,000 Subtask 4.3 – Intranet/Web Server Program $220,000 $220,000 $440,000 Subtask 4.4a – Handheld PC Program $80,000 $80,000 Subtask 4.4b – Pager Program $75,000 $75,000 Task 5 – System Integration & Test $272,928 $272,928 Task 6 – Marketing/Information Broker Subtask 6.1 – Broker Business $90,000 $90,000 Subtask 6.2 – Business Operations $90,000 $90,000 Subtask 6.3 – Network Affiliates Operations $50,000 $50,000 Subtask 6.4 – Business Agreements $40,000 $40,000 Subtask 6.5 – Marketing & Sales $75,000 $75,000 Subtask 6.6 – Promotion/Outreach/Education $70,000 $70,000 Subtask 6.7 – Project Evaluation $25,000 $25,000 TOTAL BUDGET $1,035,000 $220,000 $1,245,000 $2,500,000 The OCMDI Server and ancillary system was developed within the $1,035,000 contract with Iteris. Exhibit 9 graphically shows the budget distribution by task for development of the OCMDI Server.
Exhibit 9 – Distribution of Iteris Contract/OCMDI Server Budget by Task
Architecture/ High Level
Design31%
System Integration &
Test26%
Requirements17%
User Needs Assessment
6%
Project/ContractManagement
20%
Architecture/ High Level
Design31%
System Integration &
Test26%
Requirements17%
User Needs Assessment
6%
Project/ContractManagement
20%

OCMDI Evaluation Report
22
Equipment costs for the OCMDI Server system – specifically COTS hardware and software items – are itemized below in exhibits 10 and 11.
Exhibit 10 – Cost of OCMDI System COTS Hardware Items
Hardware Item Description Quantity Unit Cost
Total Cost
OCMDI Application Server 733 MHz PC 1 $3910 $3910 Database Server 550 MHz PC 1 $2094 $2094 Operator Console/Workstation 550 MHz PC 1 $1750 $1750 Router Cisco 3620 1 $2220 $2220 Switch Cisco 2924 1 $1825 $1825 Router Cisco 1602 1 $1295 $1295 Network Cabling miscellaneous 1 $1000 $1000 $14,094
Cost at time of purchase in 1999.
Exhibit 11 – Cost of OCMDI System COTS Software Items
Software Item Quantity Unit Cost
Total Cost
Weblogic v4.51 Developer’s License 2 $2000 $4000 Weblogic Developer Annual Upgrade & Support 2 $400 $800 Weblogic Application Server 1 $10,000 $10,000 Weblogic Annual Upgrade & Support 1 $2000 $2000 Weblogic Maintenance Contract Extension 1 $2000 $2000 Iona OrbixWeb Developer License 1 $2995 $2995 Iona OrbixWeb License Support 1 $650 $650 Iona OrbixWeb Runtime License 1 $5000 $5000 Iona OrbixWeb Runtime Support 1 $750 $750 Fiorano Developer’s License 1 $2000 $2000 Fiorano JMS Runtime License 1 $6000 $6000 $36,195
Cost at time of purchase in 1999. As exhibits 10 and 11 show, COTS hardware and software were only a small part (5%) of the overall project cost. Combined, they cost the OCMDI project $50,289. What may be surprising is that the total cost of COTS software licenses was more than 2.5 times that of the COTS hardware.
OCMDI Evaluation Report
23
4.2.2 Comparison with the TANN Server THE PARTNERSHIP advises managers of certain technology projects to start small (or simple) and allow systems to grow and evolve as needs dictate. THE PARTNERSHIP/TANN reported dissatisfaction with the OCMDI project because of its requirement to follow a formal, time- and labor-intensive system engineering process. TANN felt that the project was too "process driven," whereas it should have been more "market, product or outcome driven.” Delays caused by this process (not by the contractor, Iteris), conflicts with market changes, demands from TANN business obligations, as well as technology advancements during the project, all prompted TANN to develop its own "TANN Server" in-house. Whereas the OCMDI project spent two years developing a "do everything" server for $1 million, the TANN Server started at a minimal design at minimal cost, and was upgraded as market conditions dictated. TANN built and upgraded the TANN Data Server; developed, operated and upgraded the TANN Internet Web Server Program; maintained the servers plus performed the Marketing/Information Broker tasks during a four-year period for a total of $560,000. The system has continued to operate on a 24/7 basis for 4 years.
4.2.3 Design Once, Deploy Many Times The OCMDI project supported the “design once, deploy many times” philosophy through the use of the Showcase Program’s high-level Kernel-Seed architecture, object-oriented technology, and standardized objects and interfaces. “Design Once, Deploy Many Times” is the Priority Corridor’s philosophy for achieving cost efficiency through a modular system design, software re-use, and “economy of scale.” In general, the OCMDI supported the “design once, deploy many times” philosophy through the use of object-oriented technology and standardized objects and interfaces (CORBA IDL). The OCMDI’s design specifies the use of standard objects and interfaces to help ensure system-to-system interoperability between data providers, TANN, and the ISPs. The OCMDI Server is capable of reading standard Showcase objects, such as the VDS object developed under the TravelTIP project, and converting them to TTOs and XML for delivery to ISPs.
4.3 Estimated Operations & Maintenance Costs TANN’s original business model included profit-sharing to help defray the costs of O&M, but the business has yet to make a profit. The sharing of public transportation data through TANN was negotiated as a profit-sharing enterprise. Profits resulting from advertising revenues were to be distributed back to the public
OCMDI Evaluation Report
24
sector agencies and the ISP partners. As the data broker, TANN would negotiate and manage the financial agreements and transactions on behalf of all the parties involved. However, TANN has yet to make a profit, so the profit-sharing plan has not been implemented. TANN estimates that its total annual service O&M cost is about $500,000. As its service has grown, TANN has added additional servers to handle the workload. It now has five servers to do the work. The “TANN Server” captures raw data from public agencies as well as publishes maps and formatted data out to ISPs and other affiliates. TANN leases this server hardware and bandwidth communications from XO Communications, which also hosts the server and provides 24/7 support. This service costs $1095 per month. In addition, TANN maintains four other servers at its facility in Diamond Bar, California. TANN pays $899 per month for T1 communications access at this site.
4.3.1 Maintenance Maintenance of the TANN Server hardware is covered under XO Communications’ monthly service charge. TANN’s technical staff handle maintenance of the TANN Server software and the other four servers.
OCMDI Evaluation Report
25
5 Institutional Impacts Evaluation
5.1 Impacts to Operations and Maintenance Procedures and Policies THE PARTNERSHIP is a non-profit 501(c)4 public purpose California corporation, and was selected via the RFP process to build and operate TANN. Since THE PARTNERSHIP is an independent entity, there were no O&M impacts to OCTA or SCAG. THE PARTNERSHIP/TANN is an independent entity apart from OCTA and SCAG. Although the OCMDI project provided seed funding to kick-start the business, TANN is otherwise financially and operationally self-reliant. Neither OCTA nor SCAG operate or maintain any of the TANN service. As far as O&M, TANN’s semi-private nature gives it the independence and flexibility to react more quickly to changing needs and market conditions. It is not bound by the same procurement rules and processes that government agencies face. For example:
1. TANN is not required to formally publish a solicitation and subsequently document a minimum of three independent bids before purchasing COTS hardware or software.
2. When making such a purchase, TANN is not required to select the lowest bidder; rather,
it may opt to choose the bidder who provides the best value. Also, because TANN developed the TANN Server in-house, it did not have to follow and document a rigorous systems engineering process with several deliverable milestones. It could focus directly on achieving the end product. Milestone deliverable documents such as the Requirements and High-Level Design cost the OCMDI project over $500,000 (or about 50% of the development cost of the OCMDI Server).
5.2 Impacts to Staffing/Skill Levels and Training A highly qualified full-time staff of professionals was hired to create, manage, operate and grow TANN. A number of professionals were hired with OCMDI seed money to build TANN from the ground up and establish a self-supporting enterprise. TANN’s management staff include: John C. Cox Jr., President and Chief Executive Officer (CEO) of THE PARTNERSHIP and TANN. As President of POSTV (Point-of-Sale Television Network), Mr. Cox oversaw the creation and delivery of a revolutionary new digital advertising program service into 33,000 retail stores nationwide. The advertising agency he founded, Cox and Burch, was highly recognized for the campaigns created for high-profile automotive firms including Toyota and

OCMDI Evaluation Report
26
Nissan. In addition, Mr. Cox has served 16 years as an elected official developing public policy regarding transportation issues and has been actively involved with numerous projects involving cooperative arrangements between and among local governments and private enterprises.
Rita Lynn Stewart, Senior Vice President and the Chief Financial Officer (CFO). Ms. Stewart has almost two decades of hands-on experience in strategic planning, budgeting, cash flow management, financial analysis and corporate client relations for top-tier organizations in both the public and private sectors.
Marnie Tenden, Senior Vice President of Marketing. Ms. Tenden is a marketing and
advertising strategist with 20 years of experience for both the public and private sectors, and has functioned as the chief strategist in both national and international agencies. Ms. Tenden is responsible for the development and execution of both corporate and cooperative marketing communications and advertising programs, and she was the primary author of TANN's Business Model and Plan.
Rob Fox, Vice President of Business Development. Mr. Fox is the chief network sales strategist responsible for negotiations and relationships with Media Affiliates and Advertisers. He comes to TANN directly from Media One, where he was in charge of syndicated programming sales to network consortiums across the country. Prior to that, he held the top sales position at Shadow Broadcast Services, one of the premier providers of live traffic information to radio and TV stations in major metropolitan markets nationwide.
Julie Cha, Director of Communications and Marketing. Ms. Cha is the newest member of TANN. She is responsible for the development and execution of TANN's public relations and publicity activities. Julie's prior experience includes overseeing client relations, communications, advertising and research for both private and public sector businesses and organizations.
Grizelda "Griz" Reed, Administrative Officer. Ms. Reed provides all levels of program support for TANN's multiple business activities. She has 17 years of combined experience working for both private companies and for state and local government agencies involved with environmental and advanced transportation issues.
In addition, TANN employs a single full-time technical staff member to assist with system development and maintenance, and oversee the work of support contractors. During the OCMDI project, TANN retained as many as three independent contractors to provide various technical support services. Today, due to the growth of the enterprise and the introduction of additional products and services, TANN retains six independent contractors on an as-needed basis to provide such services.
OCMDI Evaluation Report
27
5.3 Impacts to the Competitive Environment TANN’s profit-sharing program is designed to aid and help support the traveler information market. TANN acts as a cooperative for traveler information providers. Its profit-sharing program rewards ISP affiliates by sharing profit generated through network advertising based on the number of “audience impressions” each ISP generates. This program encourages the expansion of advertising “impressions,” and serves as an incentive for ISPs to carry TANN-generated ads. TANN only enters into limited exclusive agreements regarding withholding public data from other ISPs. The media market is very competitive. Although TANN may agree to provide its services exclusively to only one particular media affiliate in one metropolitan market, this does not prevent it from making a similar deal in another metropolitan market. For example, although TANN may agree to provide its map only to the ABC affiliate in Los Angeles, the agreement would only apply to that market and TANN would be free to negotiate similar deals with any other media company elsewhere (e.g., NBC, CBS or a cable television provider in San Francisco, Seattle, Chicago, etc.). Agencies are not required to distribute their data through TANN, thus eliminating the possibility of a monopoly. Furthermore, public agencies are not required to provide their data to TANN. TANN must negotiate agreements with each agency, and, ultimately, an agency may choose to provide its data to the private sector by some other channel, perhaps directly to the ISPs. This maintains the potential for other data brokers to compete with TANN. The traveler information market has changed greatly in the last 7+ years. Since the TANN concept was initiated in 1996, a lot of changes have taken place in the marketplace. The advent of the Internet, wireless services and low cost technology has had the most dramatic impact. While the initial concept utilized some costly landline communications, the Internet provided nearly cost free communications from a number of data sources to a number of information display devices. Not only was TANN able to quickly collect speed sensor, camera, CMS and incident data from all Caltrans and CHP sources throughout California but cover a number of US metro markets as well.
OCMDI Evaluation Report
28
Even though the initial project envisioned only speed and incident data published on the Internet, Cable TV and Pagers, TANN was able to respond to changing market conditions and expand the distribution network to include Broadcast Television, PDAs, WAP Cell Phones and In-Vehicle Navigation systems. And the players changed as well. Some of the original companies, Roadirector, Fastline and CUE went out of business. Maxwell Technology was acquired by SmartRoute Systems, which was subsequently purchased by Westwood One, owned by CBS, and merged with Metro Traffic and Shadow Traffic. ETAK was purchased by Tele Atlas. TrafficStation came into business and went out of business. And today, nearly eight years later, a number of private companies compete with TANN to provide the same broker data/map publishing business. The companies joining TANN in the transportation information data collection and distribution business are Iteris, Tele Atlas, Traffic.Com (Mobility Technology), SigAlert, Traffic411, MetroCommute, and TrafficCast. The public sector includes Caltrans and CHP.
5.4 Impacts to Local Planning Processes, Policy Development, and the Mainstreaming of ITS
TANN helps bring traveler information into the homes of everyday commuters. TANN has been successful in increasing the distribution of traveler information by providing it to established media outlets such as television stations and local area news websites. TANN reports that “page views” of its maps has tripled to 3 million per month (nationwide, but mostly in Southern California) in the last 18 months. This was aided a great deal by its partnership with the ABC television affiliate in Los Angeles.
OCMDI Evaluation Report
29
6 Traveler and Transportation Information Management Evaluation
6.1 Extent of Regional and Interregional Transportation and Traveler Information Integration Between Agencies
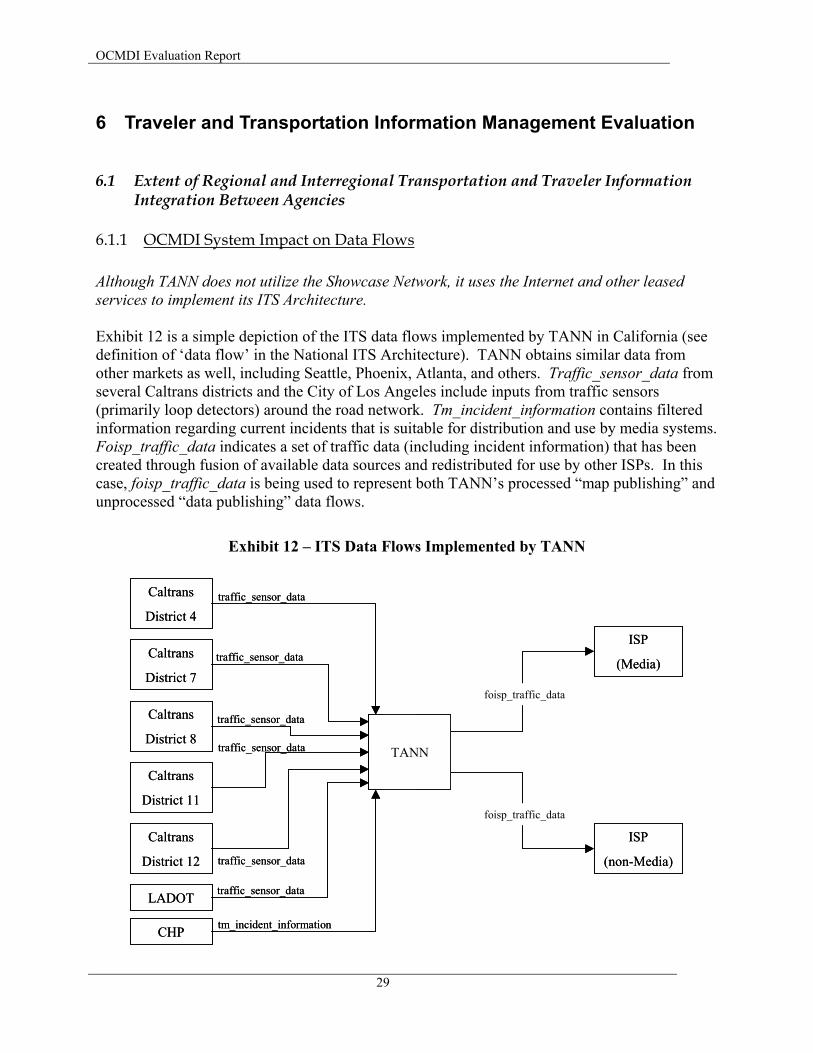
6.1.1 OCMDI System Impact on Data Flows Although TANN does not utilize the Showcase Network, it uses the Internet and other leased services to implement its ITS Architecture. Exhibit 12 is a simple depiction of the ITS data flows implemented by TANN in California (see definition of ‘data flow’ in the National ITS Architecture). TANN obtains similar data from other markets as well, including Seattle, Phoenix, Atlanta, and others. Traffic_sensor_data from several Caltrans districts and the City of Los Angeles include inputs from traffic sensors (primarily loop detectors) around the road network. Tm_incident_information contains filtered information regarding current incidents that is suitable for distribution and use by media systems. Foisp_traffic_data indicates a set of traffic data (including incident information) that has been created through fusion of available data sources and redistributed for use by other ISPs. In this case, foisp_traffic_data is being used to represent both TANN’s processed “map publishing” and unprocessed “data publishing” data flows.
Exhibit 12 – ITS Data Flows Implemented by TANN
LADOT
Caltrans
District 4
Caltrans
District 7
Caltrans
District 8
Caltrans
District 11
Caltrans
District 12
CHP
ISP
(Media)
ISP
(non-Media)
TANN
foisp_traffic_data
foisp_traffic_data
traffic_sensor_data
tm_incident_information
traffic_sensor_data
traffic_sensor_data
traffic_sensor_data
traffic_sensor_data
traffic_sensor_data

OCMDI Evaluation Report
30
6.1.2 Operators Perceptions on Impact to Communications Public agencies report that the TANN website is a useful tool. TANN obtains its raw data with very little if any disruption or demands on agency operations. In fact, TANN obtains much of its data by “scrubbing” existing public traffic websites, which is undetectable by the host agencies. Furthermore, one Caltrans TMC operator reports that he uses TANN to obtain incident information from other jurisdictions. Speaking specifically about TANN’s traffic website he reported, “We really don't have ATMS tied in to our adjacent Districts yet, so the Internet maps are useful. I really just like the way it looks, and the way it works.”

OCMDI Evaluation Report
31
7 Transportation System Impacts Evaluation Although the OCMDI project was sponsored by the OCTA, TANN provides traveler information services to both Orange County and Los Angeles County. This chapter describes the impacts of the OCMDI project and TANN on the transportation networks in both counties.
7.1 Impacts to Mode Shifting and Intermodalism In a survey conducted in Los Angeles by the Volpe Center, a relative minority of respondents indicated that they would shift transportation modes if they learned of an incident impacting their typical route. For the morning commute to work or school, 6% indicated that they would change modes. This percentage drops to 4% for the afternoon commute home.
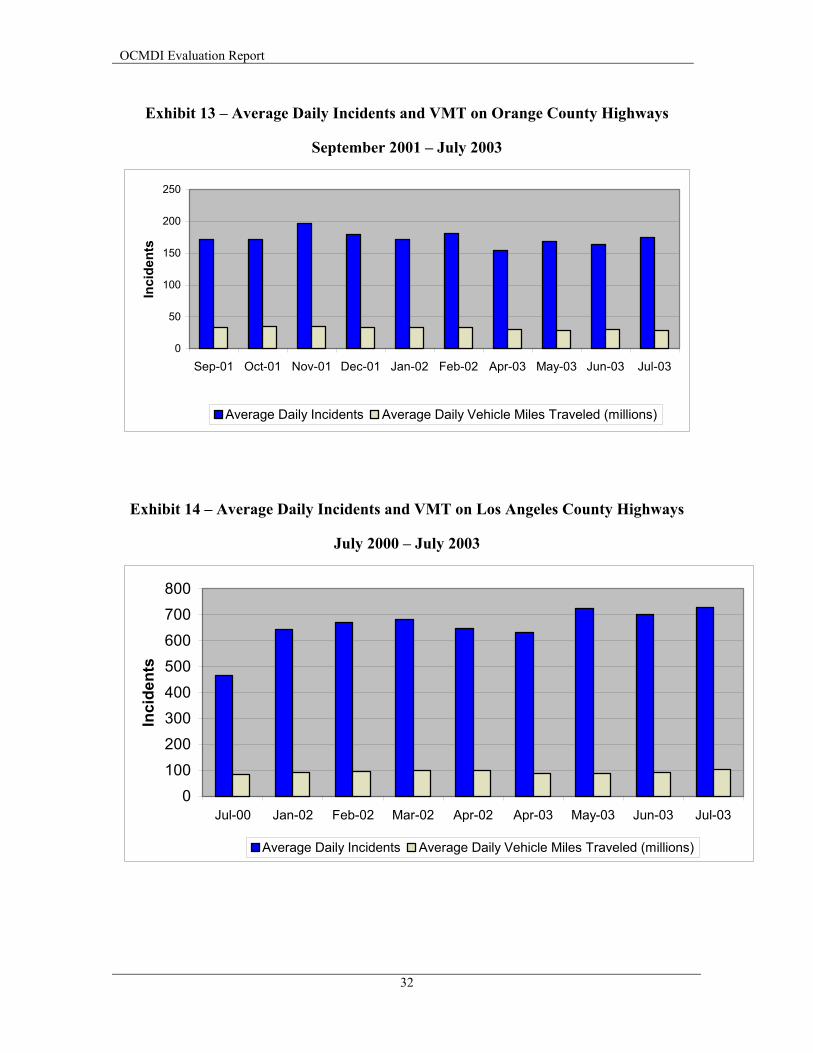
7.2 Impacts to Traffic Safety and Accident Reduction An analysis of archived incident data was conducted using California’s Highway Performance Measurement System (PeMS). PeMS is the result of a joint effort between Caltrans and the Partnership for Advanced Transit and Highways (PATH) at UC-Berkeley. The system collects, validates, and archives incident statistics and real-time loop detector data from around the state, as well as provides access to various analytical tools via a web-enabled interface. Because PeMS is still relatively new, the database contains many “holes” of missing or unavailable data within the time period studied here. The earliest incident data in the PeMS database is from 2000, which makes it impossible to study the preconditions before TANN’s start-up of operations in June 1999. However, the PeMs data is valuable for studying incident trends over the previous three years that TANN has been in operation. Exhibit 13 shows average daily incidents and average daily VMT for those months that data from Orange County is available in PeMS. According to this data, the average daily incident rate in Orange County seems to have remained relatively constant since September 2001, while VMT has dropped off slightly since February 2002. Exhibit 14, which shows available PeMS data for the Los Angeles area, implies that incidents and VMT have both been on the rise in that area. While some might argue that this data suggests that traveler information has been ineffectual at reducing incidents and VMT, others might interpret the data as a growing need for even more traveler information.
OCMDI Evaluation Report
32
Exhibit 13 – Average Daily Incidents and VMT on Orange County Highways
September 2001 – July 2003
0
50
100
150
200
250
Sep-01 Oct-01 Nov-01 Dec-01 Jan-02 Feb-02 Apr-03 May-03 Jun-03 Jul-03
Inci
dent
s
Average Daily Incidents Average Daily Vehicle Miles Traveled (millions)
Exhibit 14 – Average Daily Incidents and VMT on Los Angeles County Highways
July 2000 – July 2003
0100200300400500600700800
Jul-00 Jan-02 Feb-02 Mar-02 Apr-02 Apr-03 May-03 Jun-03 Jul-03
Inci
dent
s
Average Daily Incidents Average Daily Vehicle Miles Traveled (millions)
OCMDI Evaluation Report
33
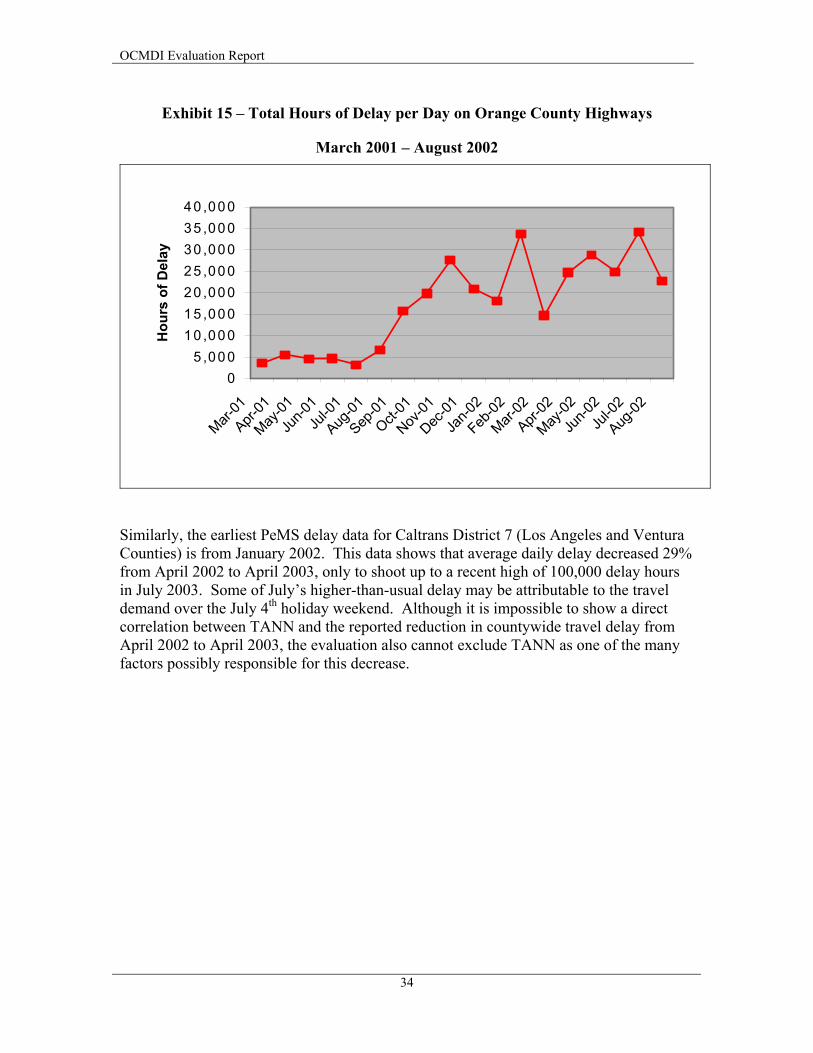
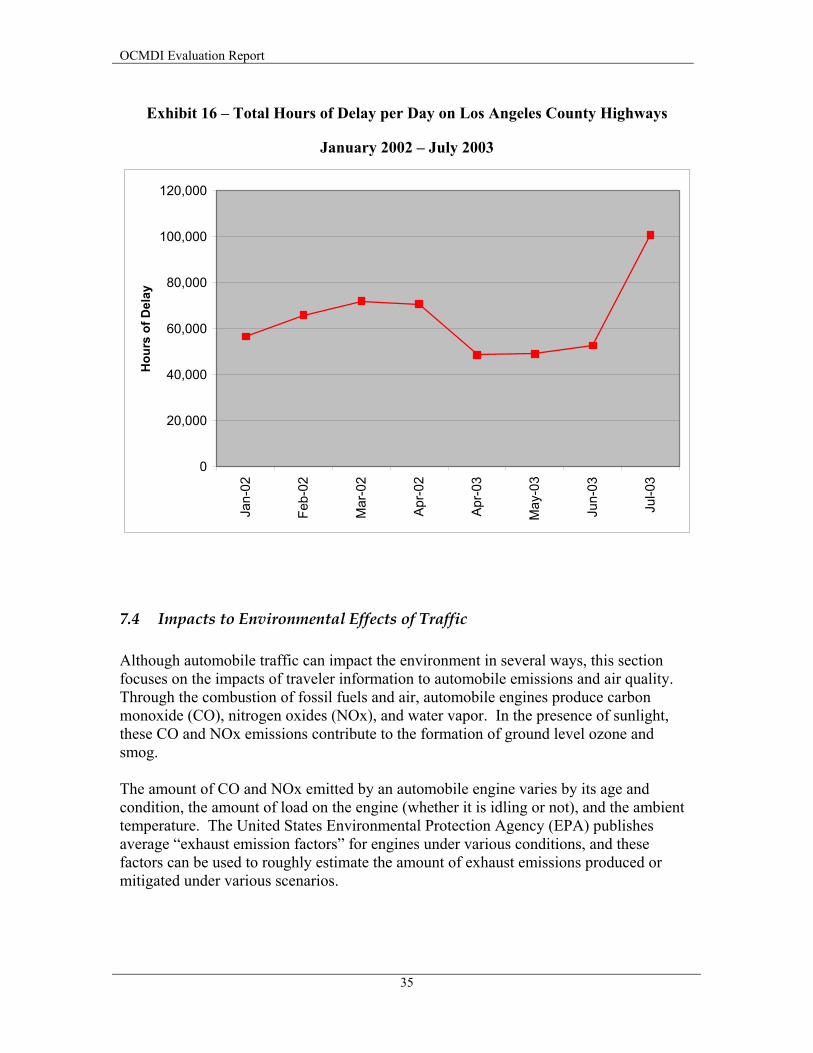
7.3 Impacts to Traffic Congestion In a survey of TANN website users conducted by the Volpe Center, 66% reported a likeliness to change their departure time when learning of an incident before leaving home to go to work or school. A similar number of TANN survey respondents (67%) are also just as likely to take an alternate route. 19% would run errands or make stops that they otherwise would not have made, while 27% report that they would make no changes to their morning commute and travel as normal. Behaviors during the afternoon commute from work/school back home follow a similar trend. 71% of respondents say they would change their departure time when learning of an incident. 70% would make minor route changes, while 60% would consider entirely different routes. As might be expected, respondents are more likely to run errands or make otherwise unplanned stops during the afternoon commute (33%) than during the morning commute (19%). Perhaps more revealing, 87% of TANN survey respondents reported that traffic information has saved them time, and 78% report that the traffic information has helped them avoid traffic problems. To investigate the impacts of these drivers’ behaviors on overall traffic conditions, a before-and-after analysis of archived traffic data was conducted using PeMS. The earliest delay data available in PeMS for Orange County (Caltrans District 12) is from March 2001. As shown in Exhibit 15, an analysis of the aggregate average daily delay on Orange County’s highways and freeways shows gradually increasing delay since August 2001. It is not clear why the overall delay shot up so drastically (roughly 500%) between August 2001 and December 2001. Further study is required to research this finding more thoroughly.
OCMDI Evaluation Report
34
Exhibit 15 – Total Hours of Delay per Day on Orange County Highways
March 2001 – August 2002
05 ,000
10 ,00015 ,00020 ,00025 ,00030 ,00035 ,00040 ,000
Mar-01
Apr-01
May-01
Jun-0
1Ju
l-01
Aug-01
Sep-01
Oct-01
Nov-01
Dec-01
Jan-0
2
Feb-02
Mar-02
Apr-02
May-02
Jun-0
2Ju
l-02
Aug-02
Hou
rs o
f Del
ay
Similarly, the earliest PeMS delay data for Caltrans District 7 (Los Angeles and Ventura Counties) is from January 2002. This data shows that average daily delay decreased 29% from April 2002 to April 2003, only to shoot up to a recent high of 100,000 delay hours in July 2003. Some of July’s higher-than-usual delay may be attributable to the travel demand over the July 4th holiday weekend. Although it is impossible to show a direct correlation between TANN and the reported reduction in countywide travel delay from April 2002 to April 2003, the evaluation also cannot exclude TANN as one of the many factors possibly responsible for this decrease.
OCMDI Evaluation Report
35
Exhibit 16 – Total Hours of Delay per Day on Los Angeles County Highways
January 2002 – July 2003
0
20,000
40,000
60,000
80,000
100,000
120,000
Jan-
02
Feb-
02
Mar
-02
Apr-0
2
Apr-0
3
May
-03
Jun-
03
Jul-0
3
Hou
rs o
f Del
ay
7.4 Impacts to Environmental Effects of Traffic Although automobile traffic can impact the environment in several ways, this section focuses on the impacts of traveler information to automobile emissions and air quality. Through the combustion of fossil fuels and air, automobile engines produce carbon monoxide (CO), nitrogen oxides (NOx), and water vapor. In the presence of sunlight, these CO and NOx emissions contribute to the formation of ground level ozone and smog. The amount of CO and NOx emitted by an automobile engine varies by its age and condition, the amount of load on the engine (whether it is idling or not), and the ambient temperature. The United States Environmental Protection Agency (EPA) publishes average “exhaust emission factors” for engines under various conditions, and these factors can be used to roughly estimate the amount of exhaust emissions produced or mitigated under various scenarios.

OCMDI Evaluation Report
36
Exhibit 17 – Exhaust Emissions Factors in Grams/Mile at Various Vehicle Speeds at Low Altitude and 75°F Ambient Temperature5
2.5MPH (Idle)
35MPH 55MPH 65MPH
Carbon Monoxide (CO)
83.58 9.80 7.45 15.90
Nitrogen Oxides (NOx)
3.14 2.04 2.65 3.51
Consider a scenario in which a vehicle encounters an incident that has caused traffic to back up for one mile. According to the EPA’s Exhaust Emissions Factors, that one vehicle would generate roughly 84 grams of CO and just over 3 grams of NOx while inching through the backup at 2.5 MPH. A total traffic standstill would generate even more emissions. The emissions factors in Exhibit 17 imply certain emissions-related benefits to using traveler information to avoid traffic congestion. These benefits are described in general below. Since there are virtually endless scenarios to consider, the reader is invited to use the information provided in this section to quantify his own specific benefits.
Exhibit 18 – Anticipated Air Quality/Emissions Benefits of Using Traveler Information
Mitigating Action Benefit Change Departure Time Enables vehicle to travel at higher speed by picking a time when congestion is less
severe. Consider a scenario in which an “average” vehicle typically travels 30 miles between home and work, with 7 miles of travel on local streets at 35MPH and 23 miles of travel on freeways at 65MPH. On a typical day, CO output from this trip might be roughly 434.3 grams. However, a one-mile delay (travel at 2.5MPH) on the arterial portion of the trip would inflate the total CO production to 508.08 grams, while a one-mile delay on the freeway portion would result in the production of 501.98 grams. Under this scenario, each vehicle that avoids the traffic congestion could avoid producing as much as 17% greater CO emissions.
Cancel Trip At best, canceling the trip means that no emissions are generated. At worst, the emissions that would have been generated during the trip are simply deferred to another time.
Take Alternate Route Since the amount of CO produced at idle is so much more than that produced at higher vehicle speeds, a vehicle could take an alternate route that is longer than the normal route taken and still produce less total exhaust emissions in the process. Using the scenario above, this vehicle could travel up to twice as far on an alternate set of arterials, or roughly 20% farther on an alternate set of freeways.
Take Transit/Carpool One less vehicle on the road means that much fewer emissions generated. The fewer the vehicles on the road, the higher the travel speeds, which can also reduce emissions further.
OCMDI Evaluation Report
37
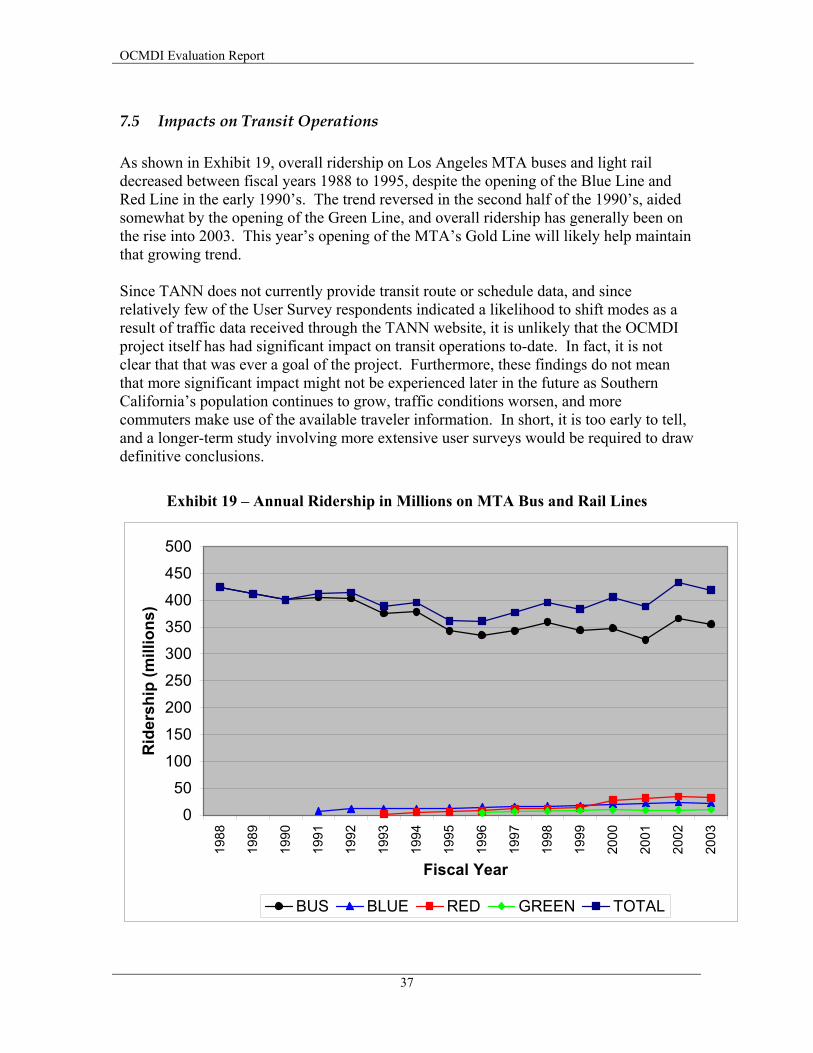
7.5 Impacts on Transit Operations As shown in Exhibit 19, overall ridership on Los Angeles MTA buses and light rail decreased between fiscal years 1988 to 1995, despite the opening of the Blue Line and Red Line in the early 1990’s. The trend reversed in the second half of the 1990’s, aided somewhat by the opening of the Green Line, and overall ridership has generally been on the rise into 2003. This year’s opening of the MTA’s Gold Line will likely help maintain that growing trend. Since TANN does not currently provide transit route or schedule data, and since relatively few of the User Survey respondents indicated a likelihood to shift modes as a result of traffic data received through the TANN website, it is unlikely that the OCMDI project itself has had significant impact on transit operations to-date. In fact, it is not clear that that was ever a goal of the project. Furthermore, these findings do not mean that more significant impact might not be experienced later in the future as Southern California’s population continues to grow, traffic conditions worsen, and more commuters make use of the available traveler information. In short, it is too early to tell, and a longer-term study involving more extensive user surveys would be required to draw definitive conclusions.
Exhibit 19 – Annual Ridership in Millions on MTA Bus and Rail Lines
050
100150200250300350400450500
1988
1989
1990
1991
1992
1993
1994
1995
1996
1997
1998
1999
2000
2001
2002
2003
Fiscal Year
Rid
ersh
ip (m
illio
ns)
BUS BLUE RED GREEN TOTAL
OCMDI Evaluation Report
38
8 Conclusions and Recommendations The Orange County Model Deployment Initiative (OCMDI) is the Showcase Program model of a public-private partnership for providing traveler information to the general public. The OCMDI project’s goal is to help enhance the use of the existing transportation infrastructure by designing, developing and installing a hardware/software system to provide a single interface through which ISPs (Information Service Providers) can obtain a wide range of publicly generated transportation information for redistribution to their consumers. Specifically, the OCMDI project provided seed money to kick-start the Traveler Advisory News Network (TANN) and develop the OCMDI Server. TANN is managed and administered by the Southern California Economic Partnership (THE PARTNERSHIP), which is a non-profit for public benefit 501 (c) 4 California Corporation. TANN is essentially a broker of transportation information. Initially, TANN only provided its “data publishing” service, which essentially provides raw data with minimal processing to its ISP affiliates. TANN collects data from various sources, processes it, and then makes the information available to the ISPs. With the burst of the dot-com bubble, the nature of the ISPs changed and the business model evolved to include “map publishing” as well as “data publishing” and introduced TANN as a branded retail source of information available via the Internet distributed directly to the consumer for use on the desktop, PDA, WAP phone, 511 or in-vehicle navigation. In addition to the dot-com-like start-up companies who want raw data to power their new and innovative technology products, many of TANN’s current affiliates are well-established media outlets that need to provide traffic information in order to stay competitive in their market. TANN uses the public traffic and incident data that it receives to provide a finished real-time traffic flow map for use and rebroadcast on these affiliates’ websites and television programs, thus creating an extensive transportation information distribution network helping to bring traveler information into the homes of everyday commuters. TANN’s original business model envisioned profit-sharing among the data providers to help defray the costs of O&M and help support the traveler information market. The model anticipated revenues from advertising at a $40 cost per thousand viewers (CPM) rate and subscribers paying $5.00 per month. Unfortunately, the CPM rate dropped to $2.50 with an over supply of advertising space inventory, subscribers would not pay the $5 rate and traveler information market remains extremely small. As a result the business has yet to make a profit. TANN estimates that the minimum total annual O&M cost to operate the stand-alone service is about $500,000. The OCMDI project followed a systems engineering process and was successfully completed in 24 months. Although the OCMDI project was eventually successful in
OCMDI Evaluation Report
39
designing and implementing the specified OCMDI Server system, TANN management decided about a year into the contract that the project was taking too long. As a result, TANN concurrently developed its own server in-house with less time and money than the OCMDI project. TANN management believes that publicly-funded system development contracts are too “process driven” and do not focus enough on the desired end product. The server developed under the OCMDI project was never used in TANN’s day-to-day business operations. Although partially funded through the Showcase Program, the TANN system does not utilize the Showcase Network; it uses the Internet and other leased services to implement its ITS Architecture. TANN had hoped to integrate with and receive local Orange County data from TravelTIP, a fellow Showcase project; however, design changes within TravelTIP discouraged and indefinitely delayed this integration. The fact that TANN operates like a private enterprise enables it to be flexible and react quickly to changing ATIS market conditions. For example, TANN uses a third-party Internet hosting service (XO Communications) to lease enough hardware, bandwidth and technical support to match its business demand and provide fast, reliable service to its clients. These items can be easily adjusted as conditions change. Public agencies report that the TANN website is a useful tool. One TMC employee reported that he uses TANN to monitor traffic conditions in the neighboring jurisdiction. Speaking specifically about TANN’s traffic website he reported, “We really don't have ATMS tied in to our adjacent Districts yet, so the Internet maps are useful. I really just like the way it looks, and the way it works.” Commuters also seem to like the service, although network-wide benefits are still not clearly evident. 87% of the respondents to a TANN User Survey conducted by the Volpe Center reported that the system has saved them travel time, although highway statistics from Caltrans and California’s Partnership for Advanced Transit and Highways (PATH) do not show clear evidence of any aggregate, network-wide savings or improvements.
OCMDI Evaluation Report
40
Endnotes/References 1 ISTEA requires that “operational tests utilizing federal funds have a written evaluation of the Intelligent Vehicle Highway Systems technologies investigated and the results of the investigation.” Although Showcase is not officially an operational test, it deploys and demonstrates ITS services, functions, and technologies under “real world” conditions, similar to an operational test. 2 California Statistical Abstract, Table B-4. California Department of Finance, Sacramento, CA. October 2001. 3 California Statistical Abstract, Table J-4. California Department of Finance, Sacramento, CA. October 2001. 4 The total project budget numbers are accurate and come from the several OCTA project contracts (C-9-0090, C-9-0057, and C-9-9224) and any amendments. 5 United States Environmental Protection Agency, Office of Mobile Sources, AP-42, Air Pollutant Emissions Factors, Tables 1.08-1.21, 1998.