oceanography microbes, monitoring, · carried out a series of epidemiologi-cal studies at marine...
TRANSCRIPT

Oceanography Vol. 19, No. 2, June 200672
Microbes, Monitoring,
and Human Health
T H E O C E A N S A N D H U M A N H E A LT H
B Y A L F R E D P. D U F O U R A N D
L A R R Y J . W Y M E R
Microbes, Monitoring,
and Human Health
Microbes, Monitoring,
and Human Health
Microbes, Monitoring,
and Human Health
Oceanography Vol. 19, No. 2, June 200672
Th
is article has b
een p
ub
lished
in O
cean
ograp
hy, V
olu
me 19, N
um
ber 2, a q
uarterly jo
urn
al of Th
e O
ceano
graph
y Society. C
op
yright 2006 b
y Th
e Ocean
ograp
hy So
ciety. All righ
ts reserved. Perm
ission
is granted
to co
py th
is article for u
se in teach
ing an
d research
. Rep
ub
lication
, systemm
atic repro
du
ction
,
or co
llective redistirb
utio
n o
f any p
ortio
n o
f this article b
y ph
oto
cop
y mach
ine, rep
ostin
g, or o
ther m
eans is p
ermitted
on
ly with
the ap
pro
val of Th
e O
ceano
graph
y Society. Sen
d all co
rrespo
nd
ence to
: info
@to
s.org o
r Th
e Ocean
ograp
hy So
ciety, PO
Bo
x 1931, Ro
ckville, MD
20849-1931, USA
.
Oceanography Vol. 19, No. 2, June 2006 73
There are about 20,000 wastewater treat-
ment plants in the United States. These
plants discharge about 50 trillion gal-
lons of wastewater daily into the nation’s
surface waters (Dorfman, 2004). Most
wastewater contains human feces, which
are a potential source of microbial
pathogens. Pathogens that may be found
in the sewage include bacteria, viruses,
and protozoa. Table 1 lists some of the
pathogens that have been isolated from
wastewaters. All of these microorganisms
are transmitted via the fecal-oral route;
therefore, if wastewater is discharged to
surface waters, they pose a health risk to
anyone who comes in contact with the
water or who consumes food harvested
from the water. The potential risks that
are associated with wastewater make dis-
posal and control of wastewater a signifi -
cant public health issue.
RECREATIONAL WATER S AND HUMAN HEALTHThe human populations most at risk
of being exposed to these wastewaters
are recreational users who swim or par-
ticipate in other water-related activi-
ties, such as surfi ng, sailboarding, and
snorkeling. In the years 1999–2000,
more than 25 percent of the population
16 years and older participated in coastal
water swimming (Leeworthy and Wiley,
2001). This represents a swimming pop-
ulation of 52.6 million individuals, and
an estimated 758 million days of swim-
ming activity. Similarly, it is estimated
that 10.5 million individuals undertook
92 million days of snorkeling; 2.8 million
individuals spent an estimated 23 million
days of scuba diving; 33 million surfers
participated in 76 million days of surfi ng;
and somewhat less than 800,000 wind
surfers participated in 5.8 million days of
windsurfi ng. All of these modes of water
exposures pose potential health risks to
recreational users of coastal waters.
The health effects associated with wa-
ter activities, however, are not easily de-
tected. One approach to establishing the
linkage between illnesses in swimmers
and swimming activity is to use surveil-
lance systems to detect outbreaks of dis-
ease when they occur. Outbreaks of dis-
ease are usually detected when individu-
als who become ill after engaging in the
same activity are identifi ed by physicians
as having a common linkage to the same
exposure factor. Between 1971 and 2002,
only two outbreaks of disease associated
with swimming in marine waters were
reported (Craun et al., 2005). During
that same period, 257 outbreaks of dis-
ease were reported from freshwater and
treated water (swimming pool) environ-
ments. The reason for the small number
of marine water outbreaks is not known,
but one can speculate that marine wa-
ters may be of higher quality than those
of freshwaters; or that many freshwater
outbreaks are due to swimmer to swim-
mer transmission through the water; or
because swimmers at ocean beaches tend
to travel further, marine water outbreaks
may be less well reported.
The other approach to identifying
health effects associated with recreational
waters is through epidemiological stud-
ies in which a large group of individuals
who are exposed to risk factors are com-
pared to a control group after a period of
time to determine if there are differences
in their respective health status. Between
1972 and 1978, the United States Envi-
ronmental Protection Agency (US EPA)
carried out a series of epidemiologi-
cal studies at marine bathing beaches
(Cabelli, 1983). The objective of those
studies was to determine the relationship
between domestic sewage-contaminated
beach water and swimming-associated
illness, and further, to determine the best
way to measure the contamination. The
studies were conducted at beaches where
the water quality was barely acceptable
and at beaches where the water quality
was good. Swimmers and non-swim-
mers were given an initial interview, and
then, seven to ten days later, a follow-up
interview was given in order to deter-
mine their health status in the interven-
ing time period. The difference in illness
rates of these two groups was attributed
to the level of fecal contaminants in the
water at the barely acceptable beach, as
Oceanography Vol. 19, No. 2, June 2006 73

Oceanography Vol. 19, No. 2, June 200674
measured by a number of potential fecal
indicator bacteria. There were no excess
health effects observed at beaches with
good quality water.
The microbial indicator group that
showed the best relationship to swim-
ming-associated gastrointestinal dis-
ease was the enterococci bacteria. These
studies indicated that the illness rate
among swimmers increased as the en-
terococci density increased. The studies
also showed very clearly that illness in
swimmers was associated with human or
animal excreta. Although the pathogens
causing the illness in swimmers were not
identifi ed, the symptoms—vomiting,
nausea, and diarrhea—and illness dura-
tion for one to two days were very simi-
lar to those resulting from infection with
enteric viruses.
Another epidemiological study that
examined the relationship between
contaminated coastal water and illness
in swimmers was conducted in south-
ern California (Haile et al., 1999). This
study looked at the effect of runoff from
storm drains that emptied onto coastal
beaches. The highest densities of indica-
tor bacteria were observed at the mouth
of the drain, with levels decreasing with
increasing distance from the source. In-
dividuals of all ages who immersed their
heads into water were potential subjects
for this study. Nine to fourteen days fol-
lowing the beach interview, a follow-up
Alfred P. Dufour ([email protected])
is Senior Research Microbiologist, National
Exposure Research Laboratory, Environmen-
tal Protection Agency, Cincinnati, OH, USA.
Larry J. Wymer is Statistician, National Ex-
posure Research Laboratory, Environmental
Protection Agency, Cincinnati, OH, USA.
Table 1. Pathogens Associated with Wastewaters
Organism
Concentration in Wastewater (per 100 mL) Disease
Bacteria
Campylobacter 3,700–100,000 Gastroenteritis
Pathogenic E. coli 30,000–10,000,000 Gastroenteritis
Salmonella 0.2–11,000 Salmonellosis
S. typhi Typhoid fever
Shigella 0.1–1,000 Shigellosis
Vibrio cholera Cholera
Vibrio spp. exc. V. cholera 10–10,000 Gastroenteritis
Yersinia Yersinosis
Viruses
Adenovirus 10–10,000Respiratory disease,
gastroenteritis, pneumonia
Astrovirus Gastroenteritis
Norovirus
(including Norwalk-
like viruses)
Gastroenteritis
EchovirusHepatitis, respiratory infection,
aseptic meningitis
Enterovirus
(includes polio, enceph-
alitis, conjunctivitis, and
coxsackie viruses)
0.05–1000,000Gastroenteritis, heart anomalies,
aseptic meningitis, polio
Reovirus 0.1–125 Gastroenteritis
Rotavirus 0.1–85,000 Gastroenteritis
Parasites
Cryptosporidium 3–13,700 Cryptosporidiosis
Entamoeba 4–52 Amoebiasis (amoebic dysentery)
Giardia 2–200,000 Giardiasis
Source: US EPA (2004).

Oceanography Vol. 19, No. 2, June 2006 75
telephone interview was conducted to
determine the occurrence of symptoms
associated with gastroenteritis, respira-
tory illness, and eye and ear infections.
Symptoms were combined to develop a
highly credible gastrointestinal (HCGI)
illness category. During the course of the
beach interviews, the subject’s distance
from the source of the runoff was noted.
Results of this study indicated that
there were higher risks for gastrointes-
tinal and respiratory symptoms when
swimmers were closer to the storm
drains, in water with a high density of
indicator bacteria or a low ratio of total
coliforms to fecal coliforms, and in water
where enteric viruses were detected. The
symptomatic end-points in this study
were the same as those defi ned in previ-
ous US EPA studies and, as in these US
EPA studies, the etiological agents re-
sponsible for illness and infections were
not known. This study and previous US
EPA studies clearly showed that there
was a strong association between the
level of fecal contamination in the wa-
ter and the rate of illness in swimmers.
Table 2 indicates that above densities of
35 enterococci per 100 ml, the illness
rates were approximately 24 HCGI ill-
nesses per thousand swimmers from the
US EPA study, and 20 or more HCGI
illnesses per thousand swimmers from
the California study. These fi ndings show
that the contamination of coastal waters
may pose a signifi cant risk to individuals
exposed to these waters.
SHELLFISHIndividuals who eat uncooked molluscan
shellfi sh are also at risk if the shellfi sh are
harvested from waters contaminated by
wastewater. Early in the 20th century, the
most prevalent disease associated with
shellfi sh was typhoid fever caused by the
bacterium Salmonella typhi (Table 3).
However, in the 1930s, water chlorina-
tion was introduced, and in the late
1940s antibiotics were used to treat in-
fectious diseases. These practices were
instrumental in lowering the number
of illnesses, especially those transmitted
by the fecal-oral route. The effectiveness
of both of these practices can be seen in
Table 3. From 1980 to 1990, the number
of shellfi sh-associated outbreaks of dis-
ease caused by Salmonella typhi had de-
creased to zero.
Outbreaks where the causative agent
was unknown appeared to increase in
the 1980s relative to the number of cases
observed before 1980. Between 1980 and
1990, a number of outbreaks occurred
Table 2. Epidemiological Studies of Swimmers’ Risk:
Gastrointestinal Illness Attributable to Swimming in Sewage Contaminated
Water as Measured by Indicator Bacteria
Study Illness1
Exposure(Enterococci/100 mL) N
Illness Rate (per 1000)
Attributable Risk(per 1000)2
Cabelli, 1983 HCGI
0 (non-swimmers) 9,162 12.3
≤ 35 11,937 20.9 8.6
35+ – 104 1,348 37.1 24.8
> 104 2,995 36.4 24.1
Haile et al., 1999 HCGI 1
≤ 35 7,689 6.5
35+ – 104 1,863 26.8 20.3
> 104 857 58.3 51.8
1 “Highly Credible Gastrointestinal Illness” indicated by the occurrence within 10 days (9-14 days for Haile et al. [1999]) of one of the
following sets of symptoms: (1) vomiting; (2) diarrhea accompanied by a fever or disabling enough to remain home, remain in bed
or seek medical advice; or (3) stomachache or nausea accompanied by fever. Haile et al. (1999) also reports results for an alternative
defi nition for highly credible gastrointestinal (HCGI), not shown here.2 Swimming-associated illnesses per 1000 = diff erence in rate between swimmers and non-swimmers, or, for Haile et al. (1999), diff er-
ence in rate between swimmers and minimally exposed (≤ 35 enterococci per 100 mL) swimmers.

Oceanography Vol. 19, No. 2, June 200676
that were caused by Norwalk virus and
Norwalk-like viruses (viruses that cause
gastrointestinal infection) that had not
been reported previously. These apparent
increases, however, may have been due
to better surveillance and reporting tech-
niques rather than actual increases in the
number of outbreaks caused by micro-
bial pathogens. Most of the outbreaks
were associated with the consumption of
oysters and clams, two molluscan species
that are frequently eaten raw.
STANDARDS AND COASTAL WATER MONITORINGThere are two approaches to controlling
the risk associated with the discharge of
sewage into coastal waters. First, the haz-
ard may be controlled (i.e., wastewaters
may be treated to eliminate the microbial
pathogens that may be present therein);
or second, exposure to waters contami-
nated with fecal material potentially con-
taining microbial pathogens may be con-
trolled. Although many authorities have
taken steps to prevent hazards through
the use of disinfectants, more effective
treatment processes, and the construc-
tion of long-distance outfalls (pipes that
discharge treated sewage into the ocean)
that carry waste further offshore, away
from human activities; the current ap-
proach in many jurisdictions is to con-
trol human exposure to wastewaters.
In the United States, standards for the
quality of surface waters have been used
since the fi rst quarter of the 20th century.
All of the standards have been based on
the presence of feces in the water. Fe-
ces traditionally have been measured
through the use of indicator bacteria,
such as coliforms, fecal coliforms, E. coli
and enterococci, which are found in very
Table 3. Shellfi sh-Borne Disease Cases and Outbreaks
by Microbial Agent and Shellfi sh Species
1894–1979 1980–1990
Cases Outbreaks4 Cases Outbreaks
Microbial Agent
Salmonella typhi 3336 79 0 0
Unknown/various1 2543 73 5852 174
Hepatitis A 1724 36 104 7
Salmonella 122 2 8 1
V. parahaemolyticus 36 2 95 7
Shigella 35 2 76 2
Cholera non-012 34 4 108 10
Hepatitis c 16 1 1 0
V. vulnifi cus 11 1 146 7
Staphylococcus 5 1 0 0
B. cereus 4 1 0 0
V. cholera 2 1 14 1
E. coli 2 1 0 0
Vibrio spp. 1 0 1 0
Norwalk virus 0 0 175 3
Snow Mtn. virus 0 0 71 2
Campylobacter 0 0 27 1
Plesiomonas 0 0 18 1
V. hollisae 0 0 15 0
V. mimicus 0 0 14 0
V. fl uvialis 0 0 8 1
Aeromonas 0 0 7 1
V. alginolyticus 0 0 1 0
Total 7,871 204 6,741 218
Shellfi sh Species
Oyster 3875 67 1815 74
Hard clam 2539 77 3276 113
Unknown/various3 1212 46 1506 17
Mussel 191 10 18 4
Clamc 39 2 96 2
Soft clam 15 2 28 7
Scallop 0 0 2 1
Total 7,871 204 6,741 218
1 Agent not identifi ed or multiple agents reported 2 Non-O1 serotypes3 Type/species not specifi ed4 Two or more instances of the disease from the same source
Source: Rippey (1991)

Oceanography Vol. 19, No. 2, June 2006 77
high and constant densities in feces. The
high densities of these organisms in feces
allow them to be used as indirect mea-
sures of the amount of feces present in
contaminated surface waters. Currently,
enterococci are recommended for mea-
suring the quality of marine waters in
the United States.
As previously discussed, these micro-
organisms, which are enumerated in wa-
ter samples using membrane fi lter proce-
dures, have been shown to be correlated
with gastrointestinal illness in swimmers
(i.e., as the density of enterococci in-
crease in the water, the gastrointestinal
illness rate increases in swimmers). This
relationship has been used to develop
guidelines and standards for recreational
water. Table 4 shows the US EPA recom-
mended limits for marine waters in the
United States. A geometric mean limit
and a single sample limit are given for
enterococci.
Most coastal states and municipalities
in the United States routinely monitor
recreational waters. The annual data col-
lected from beach waters are regularly
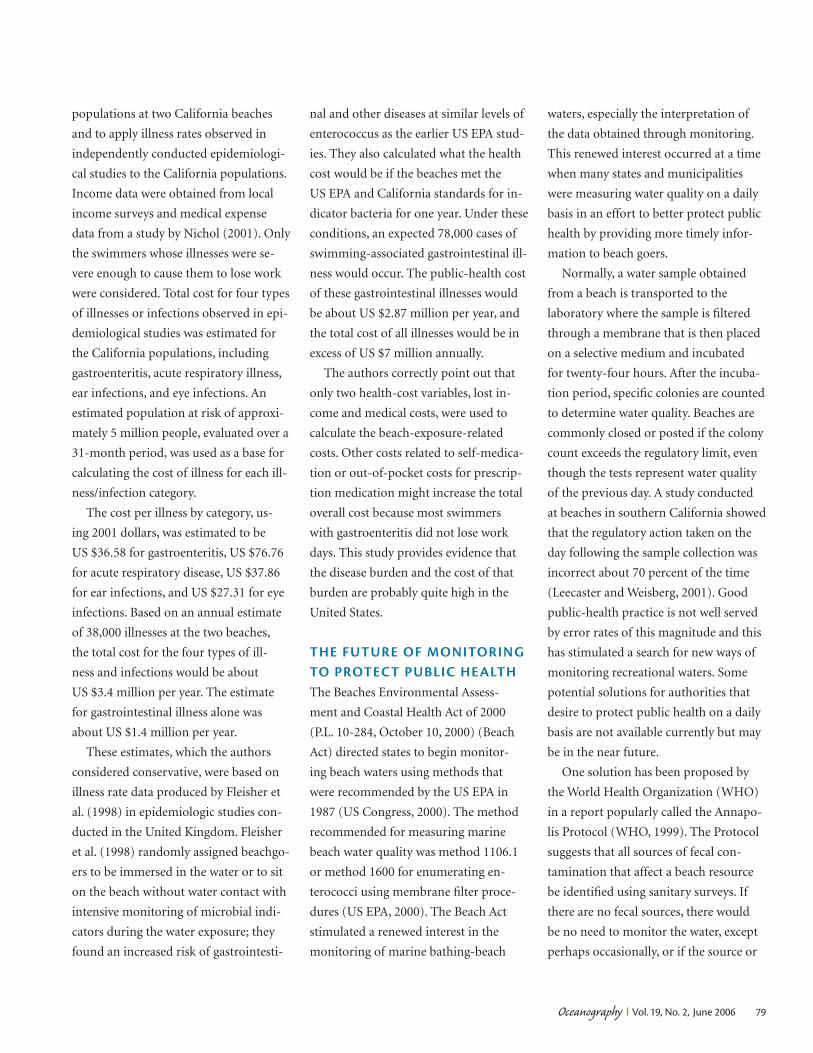
made available to the public. Table 5 lists
the beach closings and postings of ma-
rine and estuarine beaches for the year
2004 in the United States. This shows
that about 3.7 percent of the total esti-
mated beach days were closed or posted
in 2003 and that about 89 percent of the
closings were due to a non-compliance
with microbial limits. The other 11 per-
cent of closings and postings were prob-
ably associated with preemptive actions
associated with expected rainfall.
The microbial indicator used to mea-
sure the quality of shellfi sh-harvesting
waters is fecal coliforms. Fecal coliforms
are a heterogeneous group of bacteria
that have common characteristics, such
as a rod-shaped form, the ability to fer-
ment lactose, and the ability to grow at a
temperature of 44.5°C, which allow these
organisms to be detected and measured.
The standards for shellfi sh-harvest-
ing waters have been in place since the
mid-1930s. Early standards were based
on the growth of coliforms in a series of
10 tubes containing 1 ml each of sample
water. If growth occurred in more than
half of the tubes, the limit would be
Table 4. Microbial Standards for Marine Water Quality
Having Designated Uses of Recreation and Shellfi sh Harvesting
Use Indicator Classifi cation Limit Description
Geometric Mean Limits
RecreationEnterococci
(CFU per 100 ml)All Beaches 35
From at least 5
samples over a
30-day period
Shellfi sh
Harvesting
Fecal coliforms
(MPN or CFU
per 100 ml)
Approved1/
Conditionally
Approved2
14 At minimum
from the most
recent 15 samples
(at least 2 or 5
samples per year4)
Restricted3/
Conditionally
Restricted2
88
Single Sample/Percentile Limits
RecreationEnterococci
(CFU per 100 ml)
Designated Beach 104
Single sample
maximum values
Moderate FBC5 158
Light Use FBC 276
Infrequent Use FBC 501
Shellfi sh
Harvesting
Fecal coliforms
(MPN or CFU
per 100 ml)
Approved/
Conditionally
Approved
43610% of samples8
or calculated 90th
percentile9 not to
exceed this limitRestricted/
Conditionally
Restricted
2607
1 Approved shellfi sh growing area.2 Closed to harvesting based on a pollution event (rainfall, river fl ow, etc.).3 By special license; shellstock subject to relaying or depuration after harvest.4 2 per yr. in remote status areas, 5 per yr. in areas impacted by point/non-point sources of pollution. 5 Full body contact.6 MPN (most probable number) per 100 ml based on 5-tube decimal dilution; other limits apply for
3-tube decimal dilution (49), 12-tube single dilution (28), and membrane fi ltration (31 colony forming
units [CFU]).7 MPN per 100 ml based on 5-tube decimal dilution; other limits apply for 3-tube decimal dilution (300)
and 12-tube single dilution (173). 8 When not impacted by non-point pollution sources. 9 If impacted by non-point pollution sources.
Sources: US EPA (1986) and National Shellfi sh Sanitation Program (2003).
Oceanography Vol. 19, No. 2, June 200678
exceeded. Later on, mathematicians us-
ing probability theory determined that
a water sample containing 70 coliforms
per 100 ml would result in an average of
half of the 10 tubes containing 1 ml of
sample being positive. In the early 1970s,
it was determined that 14 fecal coliforms
per 100 ml was equivalent to 70 total
coliforms per 100 ml. The resulting stan-
dard used by most jurisdictions today
is that the geometric mean from at least
15 samples should not exceed 14 fecal
coliforms per 100 ml and that no more
than 10 percent of the time should a sin-
gle sample exceed 43 fecal coliforms per
100 ml (see Table 4).
THE ECONOMICS OF SWIMMINGASSOCIATED ILLNESSThe economic impact of illnesses associ-
ated with exposure to fecal-contaminat-
ed marine bathing waters was recently
studied by Dwight et al. (2005). Their
approach was to look at beach-going
Table 5. Closings and Advisories for Marine and Estuarine Beaches Among Coastal States, 2004
Coastal Beaches Monitored1 Closings & Advisories1
Number Beach Days2 Number Beach Days % of Total Beach Days
% Due to Bacteria3
Alabama 26 3146 19 24 0.8 100
California 272 49776 992 4691 9.4 91
Connecticut 104 9464 96 178 1.9 11
Delaware 19 2052 1 5 0.2 100
Florida 303 110595 972 4816 4.4 100
Georgia 29 10585 77 412 3.9 100
Louisiana 15 2745 7 153 5.6 100
Maine 41 2501 15 56 2.2 100
Maryland 71 6532 29 197 3.0 90
Massachusetts 784 76832 243 738 1.0 100
Mississippi 21 7665 1 17 0.2 100
New Hampshire 15 915 3 6 0.7 100
New Jersey 228 28044 77 168 0.6 63
New York 310 33790 375 1108 3.3 30
N. Carolina 245 44100 47 363 0.8 100
Oregon 52 4732 16 432 9.1 100
Rhode Island 68 6188 28 766 12.4 100
S. Carolina 23 3519 130 395 11.2 24
Texas 49 7448 378 834 11.2 100
Virginia 49 5782 36 261 4.5 100
Washington 71 7597 9 72 0.9 71
Total 2,795 424,008 3,551 15,692 3.7% 89%1 Excludes “permanent closures” (beaches closed 13 or more weeks).2 Number of beaches monitored x length, in days, of swimming season.3 Percent of beach days closed or under advisory that were due to indicator bacteria levels in exceedence of standards.
Source: Natural Resources Defense Council (2005).
Oceanography Vol. 19, No. 2, June 2006 79
populations at two California beaches
and to apply illness rates observed in
independently conducted epidemiologi-
cal studies to the California populations.
Income data were obtained from local
income surveys and medical expense
data from a study by Nichol (2001). Only
the swimmers whose illnesses were se-
vere enough to cause them to lose work
were considered. Total cost for four types
of illnesses or infections observed in epi-
demiological studies was estimated for
the California populations, including
gastroenteritis, acute respiratory illness,
ear infections, and eye infections. An
estimated population at risk of approxi-
mately 5 million people, evaluated over a
31-month period, was used as a base for
calculating the cost of illness for each ill-
ness/infection category.
The cost per illness by category, us-
ing 2001 dollars, was estimated to be
US $36.58 for gastroenteritis, US $76.76
for acute respiratory disease, US $37.86
for ear infections, and US $27.31 for eye
infections. Based on an annual estimate
of 38,000 illnesses at the two beaches,
the total cost for the four types of ill-
ness and infections would be about
US $3.4 million per year. The estimate
for gastrointestinal illness alone was
about US $1.4 million per year.
These estimates, which the authors
considered conservative, were based on
illness rate data produced by Fleisher et
al. (1998) in epidemiologic studies con-
ducted in the United Kingdom. Fleisher
et al. (1998) randomly assigned beachgo-
ers to be immersed in the water or to sit
on the beach without water contact with
intensive monitoring of microbial indi-
cators during the water exposure; they
found an increased risk of gastrointesti-
nal and other diseases at similar levels of
enterococcus as the earlier US EPA stud-
ies. They also calculated what the health
cost would be if the beaches met the
US EPA and California standards for in-
dicator bacteria for one year. Under these
conditions, an expected 78,000 cases of
swimming-associated gastrointestinal ill-
ness would occur. The public-health cost
of these gastrointestinal illnesses would
be about US $2.87 million per year, and
the total cost of all illnesses would be in
excess of US $7 million annually.
The authors correctly point out that
only two health-cost variables, lost in-
come and medical costs, were used to
calculate the beach-exposure-related
costs. Other costs related to self-medica-
tion or out-of-pocket costs for prescrip-
tion medication might increase the total
overall cost because most swimmers
with gastroenteritis did not lose work
days. This study provides evidence that
the disease burden and the cost of that
burden are probably quite high in the
United States.
THE FUTURE OF MONITORING TO PROTECT PUBLIC HEALTHThe Beaches Environmental Assess-
ment and Coastal Health Act of 2000
(P.L. 10-284, October 10, 2000) (Beach
Act) directed states to begin monitor-
ing beach waters using methods that
were recommended by the US EPA in
1987 (US Congress, 2000). The method
recommended for measuring marine
beach water quality was method 1106.1
or method 1600 for enumerating en-
terococci using membrane fi lter proce-
dures (US EPA, 2000). The Beach Act
stimulated a renewed interest in the
monitoring of marine bathing-beach
waters, especially the interpretation of
the data obtained through monitoring.
This renewed interest occurred at a time
when many states and municipalities
were measuring water quality on a daily
basis in an effort to better protect public
health by providing more timely infor-
mation to beach goers.
Normally, a water sample obtained
from a beach is transported to the
laboratory where the sample is fi ltered
through a membrane that is then placed
on a selective medium and incubated
for twenty-four hours. After the incuba-
tion period, specifi c colonies are counted
to determine water quality. Beaches are
commonly closed or posted if the colony
count exceeds the regulatory limit, even
though the tests represent water quality
of the previous day. A study conducted
at beaches in southern California showed
that the regulatory action taken on the
day following the sample collection was
incorrect about 70 percent of the time
(Leecaster and Weisberg, 2001). Good
public-health practice is not well served
by error rates of this magnitude and this
has stimulated a search for new ways of
monitoring recreational waters. Some
potential solutions for authorities that
desire to protect public health on a daily
basis are not available currently but may
be in the near future.
One solution has been proposed by
the World Health Organization (WHO)
in a report popularly called the Annapo-
lis Protocol (WHO, 1999). The Protocol
suggests that all sources of fecal con-
tamination that affect a beach resource
be identifi ed using sanitary surveys. If
there are no fecal sources, there would
be no need to monitor the water, except
perhaps occasionally, or if the source or
Oceanography Vol. 19, No. 2, June 200680
sources of fecal wastes cannot be rem-
edied, the beach should not be used for
swimming purposes until the source or
sources are eliminated. For those beaches
between these two extremes, a monitor-
ing scheme can be used to determine the
occurrence of any fecal events that may
pose a risk to swimmers. This approach
minimizes monitoring while protecting
public health.
A second solution is to minimize the
lag time so that the public can be noti-
fi ed in a timely manner whether the wa-
ter is fi t for swimming. Earlier warning
can be accomplished by the use of newly
developed, rapid quantitative poly-
merase chain reaction (QPCR) methods
used to amplify DNA. The amplifi ca-
tion of unique DNA target sequences
from indicator bacteria to detectable
levels can be accomplished in less than
two hours and the results compared to
a standard curve in order to quantify
the results in terms of cell equivalents
(Haugland et al., 2005). The US EPA is
evaluating the QPCR approach to deter-
mine if this rapid method can be related
to swimming-associated health effects
(Wade et al., 2006).
A third solution would be to use a
forecasting system based on meteoro-
logical or hydrographical data. Such data
could be used to forecast water quality
on a site-by-site basis at least one day
into the future. Recent studies that ad-
dressed forecasting of water quality have
showed promise that this approach may
work, at least at certain locations (Acker-
man and Weisberg, 2003; Olyphant and
Whitman, 2004). These new approaches
represent signifi cant changes from the
traditional monitoring schemes that
have been practiced in the last century
and promise new and better ways of con-
trolling the exposure of individuals to
recreational waters contaminated by hu-
man and animal excreta.
REFERENCESAckerman, D. and S.B. Weisberg. 2003. Relation-
ship between rainfall and beach bacterial con-
centrations on Santa Monica Bay beaches. Jour-
nal of Water Health 1(2):85–89.
Cabelli, V.J. 1983. Health Effects Criteria for Marine
Recreational Waters. EPA-600/1-80-031. US
Environmental Protection Agency, Research Tri-
angle Park, NC.
Craun, G.F., R.L. Calderon, and M.F. Craun. 2005.
Outbreaks associated with recreational water in
the United States. International Journal of Envi-
ronmental Health Research 15(4):243–262.
Dorfman, M. 2004. Swimming in Sewage. Natural
Resources Defense Council, Environmental
Integrity Project, New York, NY.
Dwight, R.H., L.M. Fernandez, D.B. Baker, J.C.
Semenza, and B. Olsen. 2005. Estimating the
economic burden from illnesses associated with
recreational coastal water pollution—A case
study in Orange County, California. Journal of
Environmental Management 76:95–103.
Fleisher, J., D. Kay, M.D. Wyer, and A.F. Godfree.
1998. Estimates of the severity of illnesses asso-
ciated with bathing in marine recreational wa-
ters contaminated with domestic sewage. Inter-
national Journal of Epidemiology 27:722–726.
Haile, R.W., J.S. Witte, M. Gold, R. Cressey, C.
McGee, R.C. Millikan, A. Glasser, N. Harawa,
C. Ervin, P. Harmon, J. Harper, J. Dermand, J.
Alamillo, K. Barrett, M. Nides, and G.-Y. Wang.
1999. The health effects of swimming in ocean
water contaminated by storm drain runoff. Epi-
demiology 10(4):355–363.
Haugland, R.A., S.C. Siefring, L.J. Wymer, K.P.
Brenner, and A.P. Dufour. 2005. Comparison of
Entercoccus measurements in freshwater at two
recreational beaches by quantitative polymerase
reaction and membrane fi lter culture analysis.
Water Research 39:559–568.
Leecaster, M., and S.B. Weisberg. 2001. Effect of
sampling frequency on shoreline microbiol-
ogy assessments. Marine Pollution Bulletin
42(11):1,150–1,154.
Leeworthy, V.R., and P.C. Wiley. 2001. National
Survey on Recreation and the Environment 2000.
US Department of Commerce, National Oce-
anic and Atmospheric Administration, National
Ocean Service, Silver Spring, MD.
Natural Resources Defense Council. 2005. Testing
the Waters 2005: A Guide to Water Quality at
Vacation Beaches. Natural Resources Defense
Council, Washington, D.C.
National Shellfi sh Sanitation Program. 2003. Guide
to the Control of Molluscan Shellfi sh. Interstate
Shellfi sh Sanitation Conference. US Food and
Drug Administration, Washington, D.C.
Nichol, K. 2001. Cost benefi t analysis of a strat-
egy to vaccinate healthy working adults
against infl uenza. Archives of Internal Medicine
161(5):749–759.
Olyphant, G.A., and R.L. Whitman. 2004. Elements
of a predictive model for determining beach
closures on a real time basis: The case of 63rd
Street beach, Chicago. Environmental Monitor-
ing Assessment 98:175–190.
Rippey, S.R. 1991. Shellfi sh Sanitation Program
Technical Report: Shellfi sh Borne Disease Out-
breaks. US Food and Drug Administration,
Department of Health and Human Services,
Washington, D.C.
U.S. Environmental Protection Agency. 1986. Am-
bient Water Quality Criteria for Bacteria—1986.
EPA 440/5-84-002. U.S. Environmental Protec-
tion Agency, Washington, D.C.
U.S. Environmental Protection Agency. 2000.
Improved Enumeration Methods for the Recre-
ational Water Quality Indicators: Enterococci and
Escherichia coli. EPA/821/R-97/004. U.S. Envi-
ronmental Protection Agency, Washington, D.C.
U.S. Environmental Protection Agency. 2004. Re-
port to Congress—Impacts and Control of CSOs
and SSOs. EPA 833-R-04-001. U.S. Environ-
mental Protection Agency, Washington, D.C.
Wade, T.J., R.L. Calderon, E. Sams, M. Beach, K.P.
Brenner, A.H. Williams, and A.P. Dufour. 2006.
Rapidly measured indicators of recreational
water quality are predictive of swimming-as-
sociated gastrointestinal illness. Environmental
Health Perspectives 114(1):24–28.
World Health Organization (WHO). 1999. Health-
Based Monitoring of Recreational Waters: The
Feasibility of a New Approach, Geneva, Switzer-
land.