oceano dunes svra - ca state...
TRANSCRIPT
Oceano Dunes SVRA Economic Impact Analysis Report 2010-2011
Final Report
Photo Credit: www.slostateparks.com
Oceano Dunes SVRA
2
Table of Contents
Executive Summary 4 Project Overview 5 Section 1: Respondent Characteristics 9 1.1 Demographic Characteristics 9 1.2 Geographic Origin 10
Section 2: Respondent Trip Behavior 12 2.1 Visitor Type 12 2.2 Overnight Camping 12 2.3 Length of Stay 13 2.4 Non-In Park Camping 14 2.5 Travel Party Size 15 2.6 Presence of Children in Travel Group 16
Section 3: Activity Participation 17 3.1 Activity Participation within the Park 17 3.2 Activity Participation outside the Park 19
Section 4: Park Importance 20 Section 5: Travel Spending 21 5.1 Overall Travel Spending 21 5.2 In Park Revenue Capture 23
Section 6: Economic Impact 24 6.1 Economic Impact Results 24
.03
Oceano Dunes SVRA
3
List of Figures
Figure 1 Geographic Origin 10 Figure 2 Visitor Type 12 Figure 3 Camped in Park 12 Figure 4 Type of Camping in Park 13 Figure 5 Length of Stay 13 Figure 6 Non-In the Park Camping Lodging 14 Figure 7 Average Party Size 15 Figure 8 Average Party Size by Visitor Type 16 Figure 9 Percent of Groups with Children 16 Figure 10 Activity Participation within the Park 17 Figure 11 Activity Participation outside the Park 19 Figure 12 Would still Visit SLOC if No Oceano Dunes 20 Figure 13 Would still Visit SLOC if No Oceano Dunes By Visitor Type 20 Figure 14 Visitor Spending By Category by Percent 21 Figure 15 Visitor Spending By Category by Amount 22 Figure 16 In Park Revenue Capture 23
List of Tables Table 1 Summary Demographic Characteristics 9 Table 2 California Market 11 Table 3 Visitor Markets by Mileage 11 Table 4 Activity Participation by Visitor Type 18 Table 5 Spending Category Elements 21 Table 6 Estimated Economic Impact 24 Table 6 Estimated Economic Impact by Top 5 Sectors 24 Table 7 Estimated Employment 25 Table 8 Estimated Employment by Top 5 Sectors 25 Table 9 State and Local Taxes 26 Table 10 Federal Taxes 27
Oceano Dunes SVRA
4
Executive Summary
The majority of respondents were White (71%), and a significant minority (22%) were Hispanic.
Survey respondents were more likely to be married (60%). Significantly more men participated
in the survey than women (76% and 24%, respectively).
The average age of survey respondents was 37 years, with the median age at 35.9 years.
The average household income of survey respondents was $88,000.
Almost all respondents lived in California (96%), and a significant percentage of these were from
Southern California.
12% of respondents identified themselves as local residents, residing in San Luis Obispo County.
Another 16% indicated they were day visitors from outside of San Luis Obispo County and 72%
indicated they were overnight visitors from outside of San Luis Obispo County.
76% of the overnight visitors from outside San Luis Obispo County said they camped overnight
in the Park (on the beach /campgrounds) on their last trip.
The average length of stay of all respondents was 3.1 nights.
The average party size of all respondents was 13 people.
A full two-thirds (66%) of all respondents had children between the ages of 0 and 17 in their
immediate Group, suggesting they believe the available activities are suitable for and have
interest to family groups.
Survey respondents were specifically asked if they would still visit San Luis Obispo County if the
Oceano Dunes Park was not in existence. Two-thirds (67%) said they would not.
Overall travel spending for all visitors to the Park during their visits was approximately $1,544
per travel group.
Survey respondents were asked how much of their total group expenditure was spent inside the
Park itself; the average portion was $235, representing 15% of an immediate travel party’s total
trip expenditure.
The overall Economic Impact of visitors to the Oceano Dunes Park is estimated to be $160M
(This total includes Direct Spending, Indirect Spending and Induced Spending). Direct Spending
alone is estimated at $98M.
Overall Economic Impact is estimated to be $171M (Direct + Indirect + Induced Spending). Total economic impact by day visitors is estimated to be $10.6m and overnight visitor impact was $160.9M.
Oceano Dunes SVRA
5
Project Overview
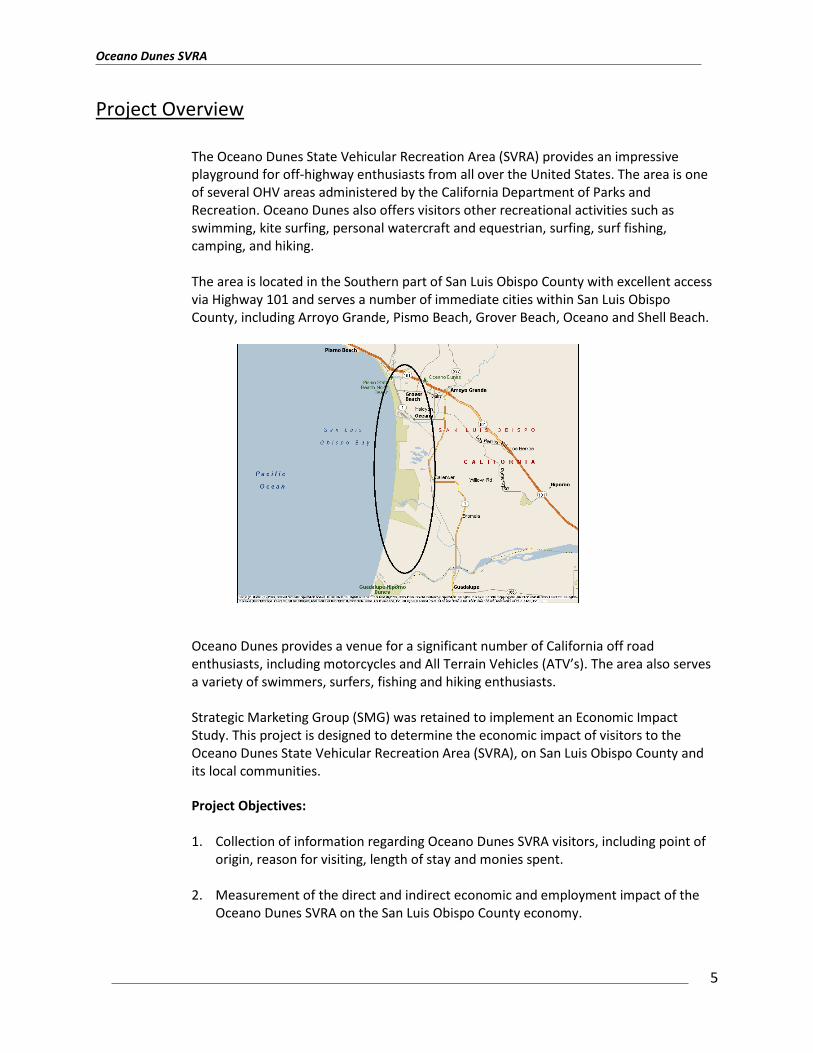
The Oceano Dunes State Vehicular Recreation Area (SVRA) provides an impressive playground for off-highway enthusiasts from all over the United States. The area is one of several OHV areas administered by the California Department of Parks and Recreation. Oceano Dunes also offers visitors other recreational activities such as swimming, kite surfing, personal watercraft and equestrian, surfing, surf fishing, camping, and hiking.
The area is located in the Southern part of San Luis Obispo County with excellent access via Highway 101 and serves a number of immediate cities within San Luis Obispo County, including Arroyo Grande, Pismo Beach, Grover Beach, Oceano and Shell Beach.
Oceano Dunes provides a venue for a significant number of California off road enthusiasts, including motorcycles and All Terrain Vehicles (ATV’s). The area also serves a variety of swimmers, surfers, fishing and hiking enthusiasts.
Strategic Marketing Group (SMG) was retained to implement an Economic Impact Study. This project is designed to determine the economic impact of visitors to the Oceano Dunes State Vehicular Recreation Area (SVRA), on San Luis Obispo County and its local communities.
Project Objectives:
1. Collection of information regarding Oceano Dunes SVRA visitors, including point of
origin, reason for visiting, length of stay and monies spent.
2. Measurement of the direct and indirect economic and employment impact of the Oceano Dunes SVRA on the San Luis Obispo County economy.
Oceano Dunes SVRA
6
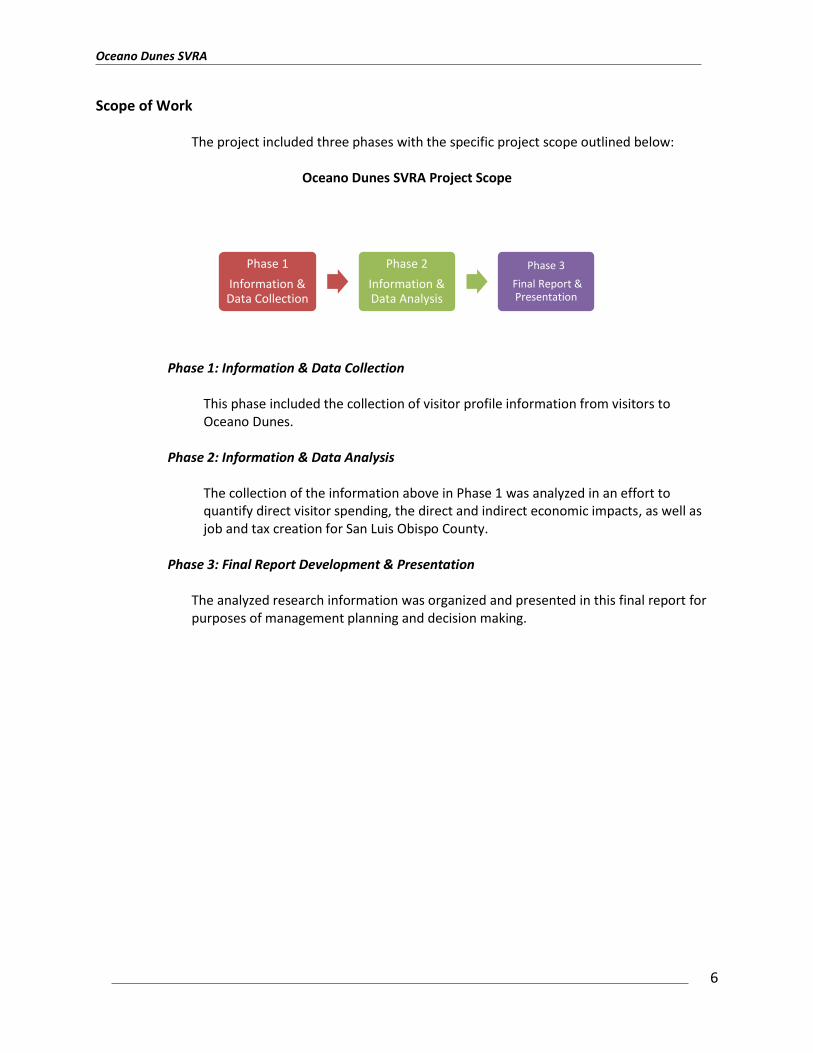
Scope of Work The project included three phases with the specific project scope outlined below:
Oceano Dunes SVRA Project Scope
Phase 1: Information & Data Collection
This phase included the collection of visitor profile information from visitors to Oceano Dunes.
Phase 2: Information & Data Analysis
The collection of the information above in Phase 1 was analyzed in an effort to quantify direct visitor spending, the direct and indirect economic impacts, as well as job and tax creation for San Luis Obispo County.
Phase 3: Final Report Development & Presentation
The analyzed research information was organized and presented in this final report for purposes of management planning and decision making.
Phase 1
Information & Data Collection
Phase 2
Information & Data Analysis
Phase 3
Final Report & Presentation
Oceano Dunes SVRA
7
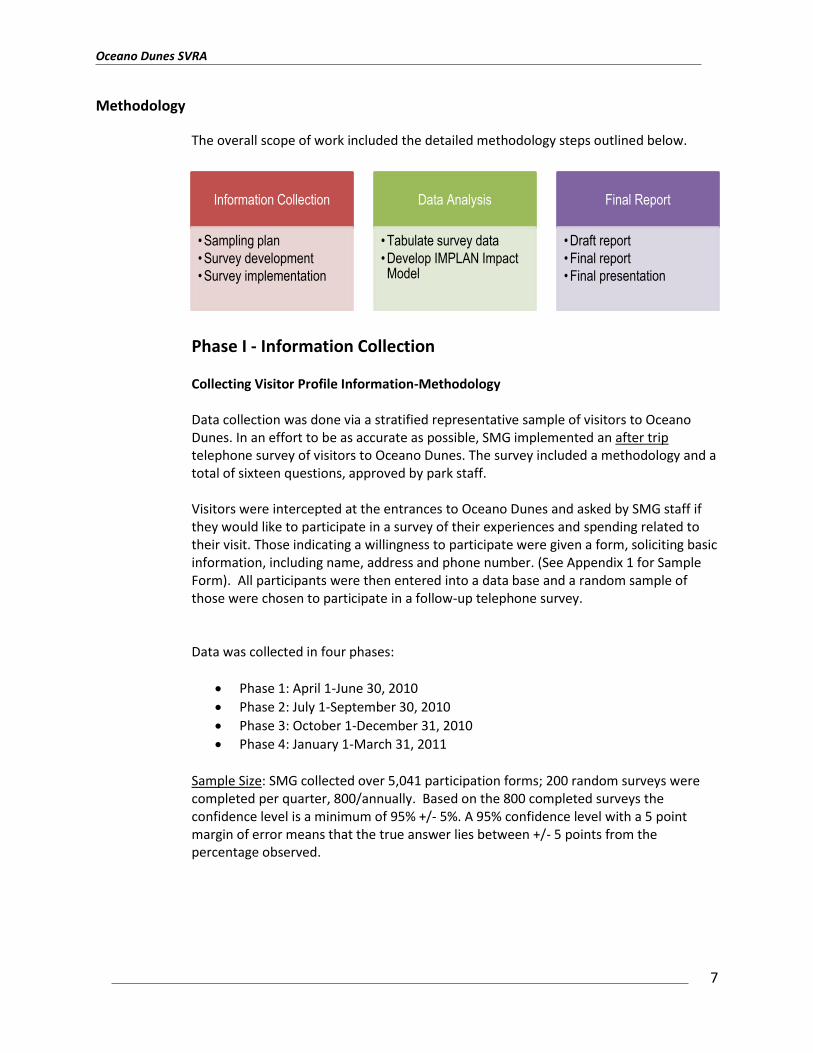
Methodology
The overall scope of work included the detailed methodology steps outlined below.
Phase I - Information Collection
Collecting Visitor Profile Information-Methodology
Data collection was done via a stratified representative sample of visitors to Oceano Dunes. In an effort to be as accurate as possible, SMG implemented an after trip telephone survey of visitors to Oceano Dunes. The survey included a methodology and a total of sixteen questions, approved by park staff.
Visitors were intercepted at the entrances to Oceano Dunes and asked by SMG staff if they would like to participate in a survey of their experiences and spending related to their visit. Those indicating a willingness to participate were given a form, soliciting basic information, including name, address and phone number. (See Appendix 1 for Sample Form). All participants were then entered into a data base and a random sample of those were chosen to participate in a follow-up telephone survey. Data was collected in four phases:
Phase 1: April 1-June 30, 2010
Phase 2: July 1-September 30, 2010
Phase 3: October 1-December 31, 2010
Phase 4: January 1-March 31, 2011
Sample Size: SMG collected over 5,041 participation forms; 200 random surveys were completed per quarter, 800/annually. Based on the 800 completed surveys the confidence level is a minimum of 95% +/- 5%. A 95% confidence level with a 5 point margin of error means that the true answer lies between +/- 5 points from the percentage observed.
Information Collection
• Sampling plan
• Survey development
• Survey implementation
Data Analysis
• Tabulate survey data
• Develop IMPLAN Impact Model
Final Report
• Draft report
• Final report
• Final presentation
Oceano Dunes SVRA
8
Phase 2- Data Analysis
SMG tabulated the collected information from Phase 1 above, analyzed the survey information and issued a top line report after each phase of data collection. Additionally SMG utilized the collected visitor data, park attendance information and Implan economic analysis software to develop economic impact, employment and tax projections.
Phase 3 - Final Report and Presentation Package
In this final phase, SMG developed the final report for California Department of Parks and Recreation.
Oceano Dunes SVRA
9
Section 1: Respondent Characteristics 1.1 Demographic Characteristics
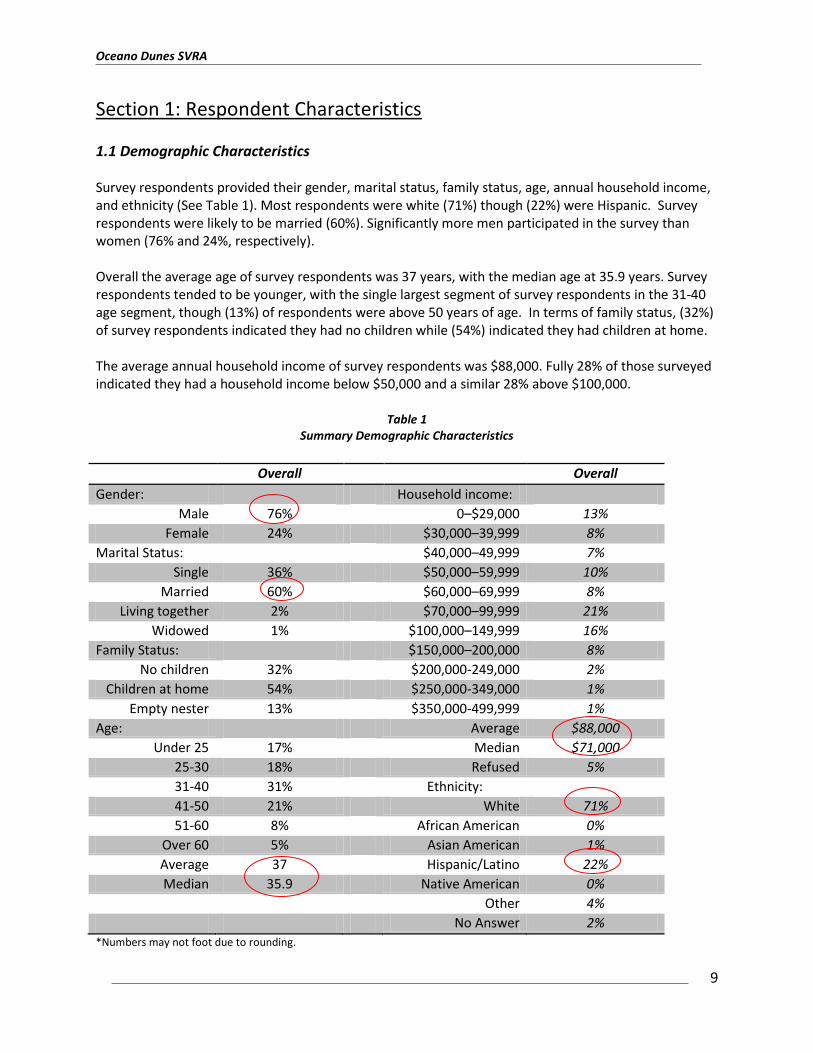
Survey respondents provided their gender, marital status, family status, age, annual household income, and ethnicity (See Table 1). Most respondents were white (71%) though (22%) were Hispanic. Survey respondents were likely to be married (60%). Significantly more men participated in the survey than women (76% and 24%, respectively).
Overall the average age of survey respondents was 37 years, with the median age at 35.9 years. Survey respondents tended to be younger, with the single largest segment of survey respondents in the 31-40 age segment, though (13%) of respondents were above 50 years of age. In terms of family status, (32%) of survey respondents indicated they had no children while (54%) indicated they had children at home.
The average annual household income of survey respondents was $88,000. Fully 28% of those surveyed indicated they had a household income below $50,000 and a similar 28% above $100,000.
Table 1
Summary Demographic Characteristics
Overall Overall
Gender: Household income: Male 76% 0–$29,000 13%
Female 24% $30,000–39,999 8% Marital Status: $40,000–49,999 7%
Single 36% $50,000–59,999 10% Married 60% $60,000–69,999 8%
Living together 2% $70,000–99,999 21% Widowed 1% $100,000–149,999 16%
Family Status: $150,000–200,000 8% No children 32% $200,000-249,000 2%
Children at home 54% $250,000-349,000 1% Empty nester 13% $350,000-499,999 1%
Age: Average $88,000 Under 25 17% Median $71,000
25-30 18% Refused 5% 31-40 31% Ethnicity: 41-50 21% White 71% 51-60 8% African American 0%
Over 60 5% Asian American 1% Average 37 Hispanic/Latino 22% Median 35.9 Native American 0%
Other 4%
No Answer 2% *Numbers may not foot due to rounding.
Oceano Dunes SVRA
10
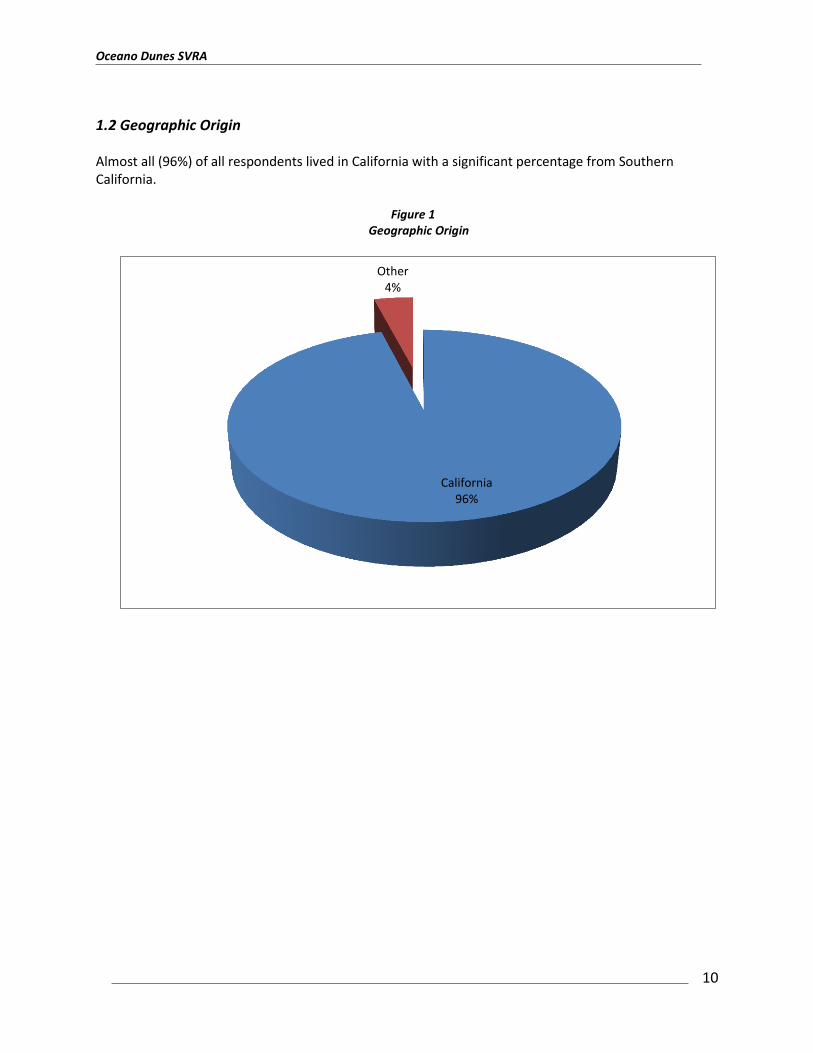
1.2 Geographic Origin Almost all (96%) of all respondents lived in California with a significant percentage from Southern California.
Figure 1
Geographic Origin
California 96%
Other 4%
Oceano Dunes SVRA
11
Over half of all respondents were from Southern California (56 %), 24% reside in the Central California Valley, and another 10% from the Bay Area.
Table 2
California Market
% of Total % of CA
Bay Area 10% 11%
10% 11.00%
Sacramento 3% 3%
3% 3.00%
Central Valley 24% 25%
24% 25%
Southern California 56% 58%
LA Basin 9% 10%
Orange County/San Diego 3% 4.0%
Riverside/San Bernardino 4% 4.0%
Ventura/Santa Barbara 5% 5.0%
San Luis Obispo 14% 14%
Other 21% 21%
From a travel distance perspective, approximately 64% of total visitors surveyed live within 400 miles of the park and approximately 51% are within 200 miles, making the park a strong regional attraction.
Table 3 Visitor Markets by Mileage
Market Miles % of Total Visitors Cumulative
San Luis Obispo <25 14%
Ventura/Santa Barbara 56-120 5% 19%
LA Basin 121-200 9% 27%
Central Valley 121-200 24% 51%
Orange County/San Diego 200-400 3% 54%
Bay Area 200-400 10% 64%
Oceano Dunes SVRA
12
Section 2: Respondent Trip Behavior
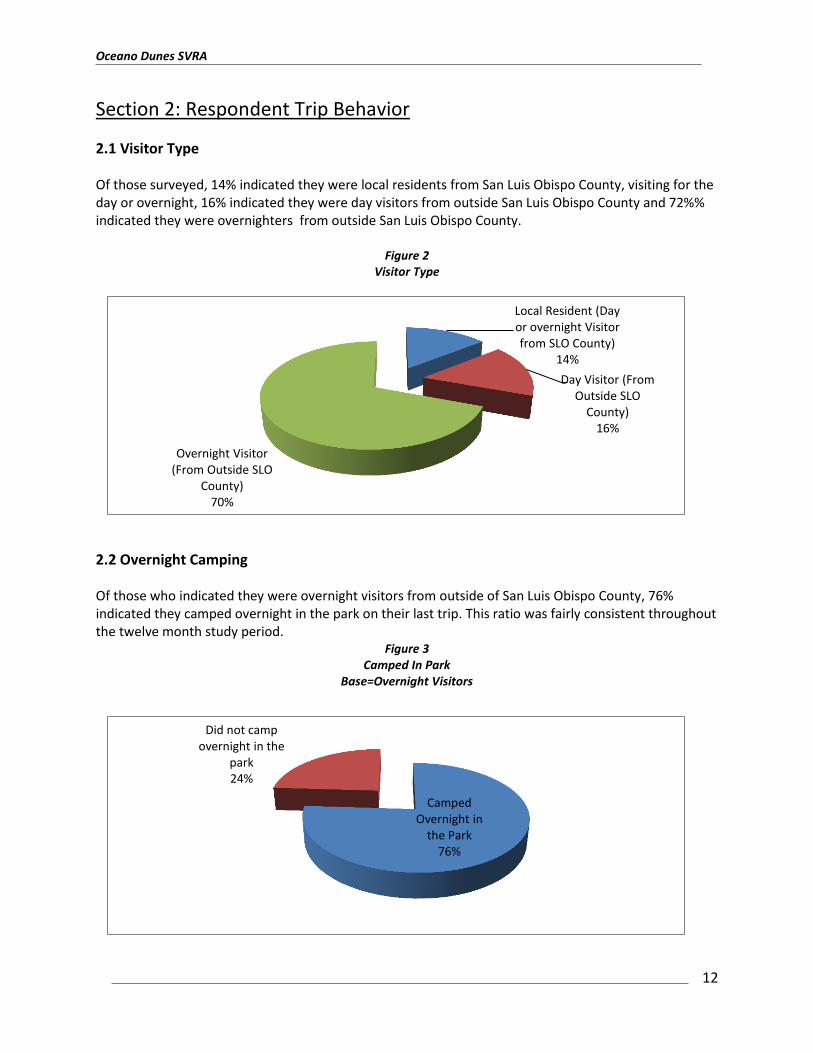
2.1 Visitor Type Of those surveyed, 14% indicated they were local residents from San Luis Obispo County, visiting for the day or overnight, 16% indicated they were day visitors from outside San Luis Obispo County and 72%% indicated they were overnighters from outside San Luis Obispo County.
Figure 2 Visitor Type
2.2 Overnight Camping Of those who indicated they were overnight visitors from outside of San Luis Obispo County, 76% indicated they camped overnight in the park on their last trip. This ratio was fairly consistent throughout the twelve month study period.
Figure 3 Camped In Park
Base=Overnight Visitors
Local Resident (Day or overnight Visitor from SLO County)
14%
Day Visitor (From Outside SLO
County) 16%
Overnight Visitor (From Outside SLO
County) 70%
Camped Overnight in
the Park 76%
Did not camp overnight in the
park 24%
Oceano Dunes SVRA
13
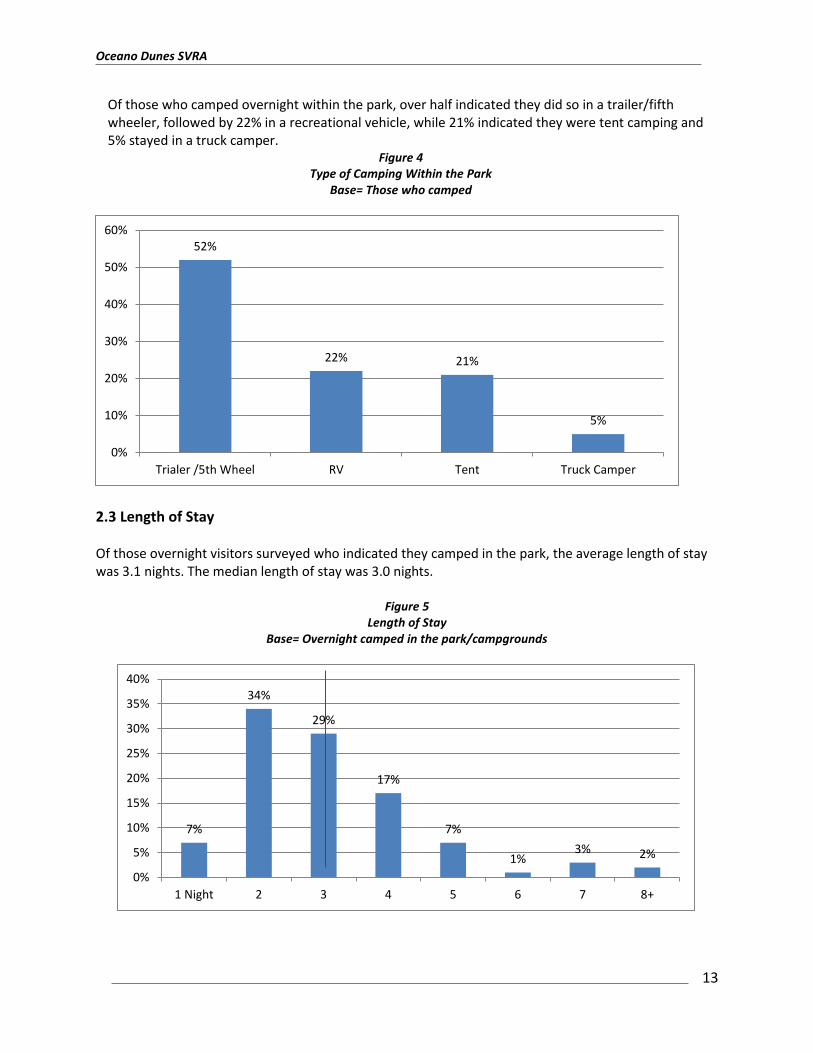
Of those who camped overnight within the park, over half indicated they did so in a trailer/fifth wheeler, followed by 22% in a recreational vehicle, while 21% indicated they were tent camping and 5% stayed in a truck camper.
Figure 4 Type of Camping Within the Park
Base= Those who camped
2.3 Length of Stay Of those overnight visitors surveyed who indicated they camped in the park, the average length of stay was 3.1 nights. The median length of stay was 3.0 nights.
Figure 5 Length of Stay
Base= Overnight camped in the park/campgrounds
52%
22% 21%
5%
0%
10%
20%
30%
40%
50%
60%
Trialer /5th Wheel RV Tent Truck Camper
7%
34%
29%
17%
7%
1% 3% 2%
0%
5%
10%
15%
20%
25%
30%
35%
40%
1 Night 2 3 4 5 6 7 8+
Oceano Dunes SVRA
14
The highest concentration of visitation was two nights, which would tend to be consistent with the exhibited visitor pattern, of over half of those surveyed traveling from within 200 miles of the park.
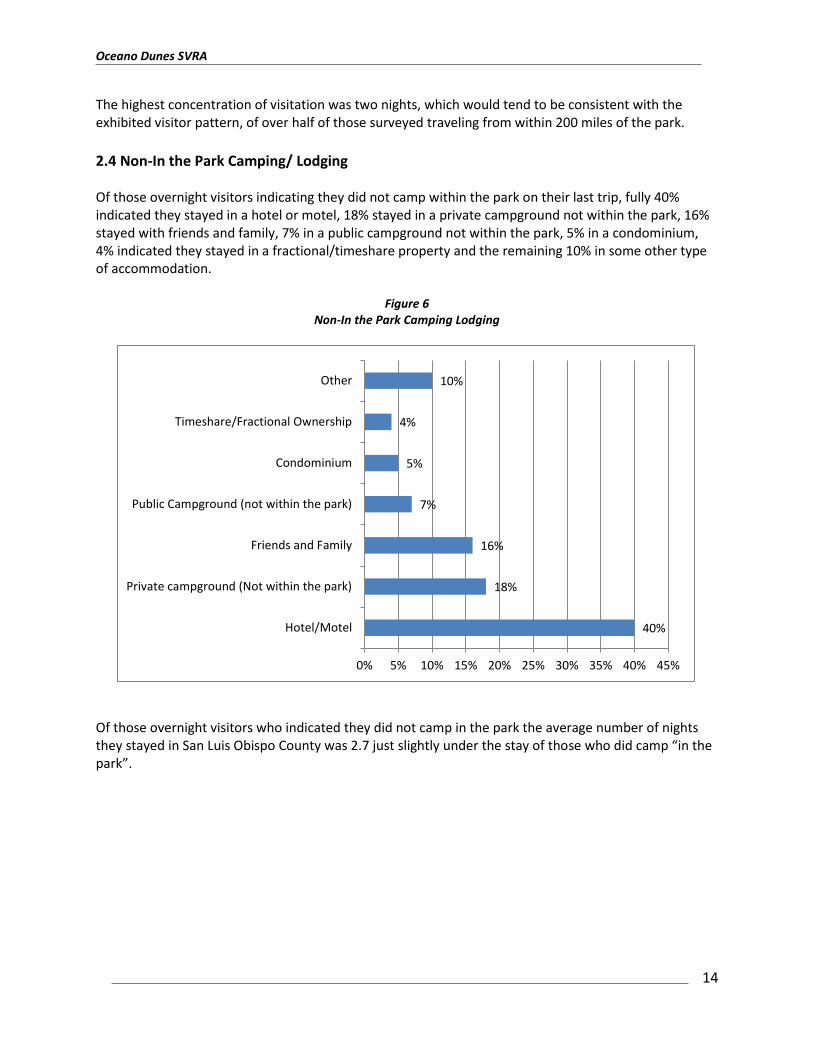
2.4 Non-In the Park Camping/ Lodging Of those overnight visitors indicating they did not camp within the park on their last trip, fully 40% indicated they stayed in a hotel or motel, 18% stayed in a private campground not within the park, 16% stayed with friends and family, 7% in a public campground not within the park, 5% in a condominium, 4% indicated they stayed in a fractional/timeshare property and the remaining 10% in some other type of accommodation.
Figure 6 Non-In the Park Camping Lodging
Of those overnight visitors who indicated they did not camp in the park the average number of nights they stayed in San Luis Obispo County was 2.7 just slightly under the stay of those who did camp “in the park”.
40%
18%
16%
7%
5%
4%
10%
0% 5% 10% 15% 20% 25% 30% 35% 40% 45%
Hotel/Motel
Private campground (Not within the park)
Friends and Family
Public Campground (not within the park)
Condominium
Timeshare/Fractional Ownership
Other
Oceano Dunes SVRA
15
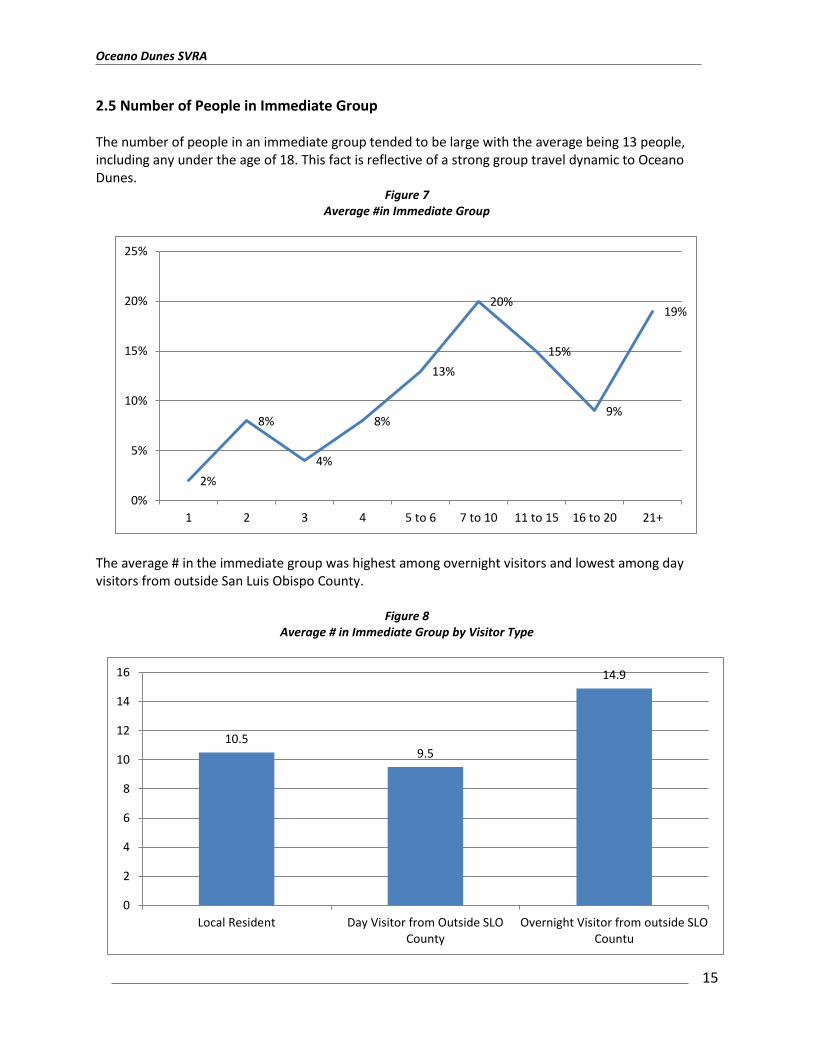
2.5 Number of People in Immediate Group The number of people in an immediate group tended to be large with the average being 13 people, including any under the age of 18. This fact is reflective of a strong group travel dynamic to Oceano Dunes.
Figure 7 Average #in Immediate Group
The average # in the immediate group was highest among overnight visitors and lowest among day visitors from outside San Luis Obispo County.
Figure 8
Average # in Immediate Group by Visitor Type
2%
8%
4%
8%
13%
20%
15%
9%
19%
0%
5%
10%
15%
20%
25%
1 2 3 4 5 to 6 7 to 10 11 to 15 16 to 20 21+
10.5 9.5
14.9
0
2
4
6
8
10
12
14
16
Local Resident Day Visitor from Outside SLOCounty
Overnight Visitor from outside SLOCountu
Oceano Dunes SVRA
16
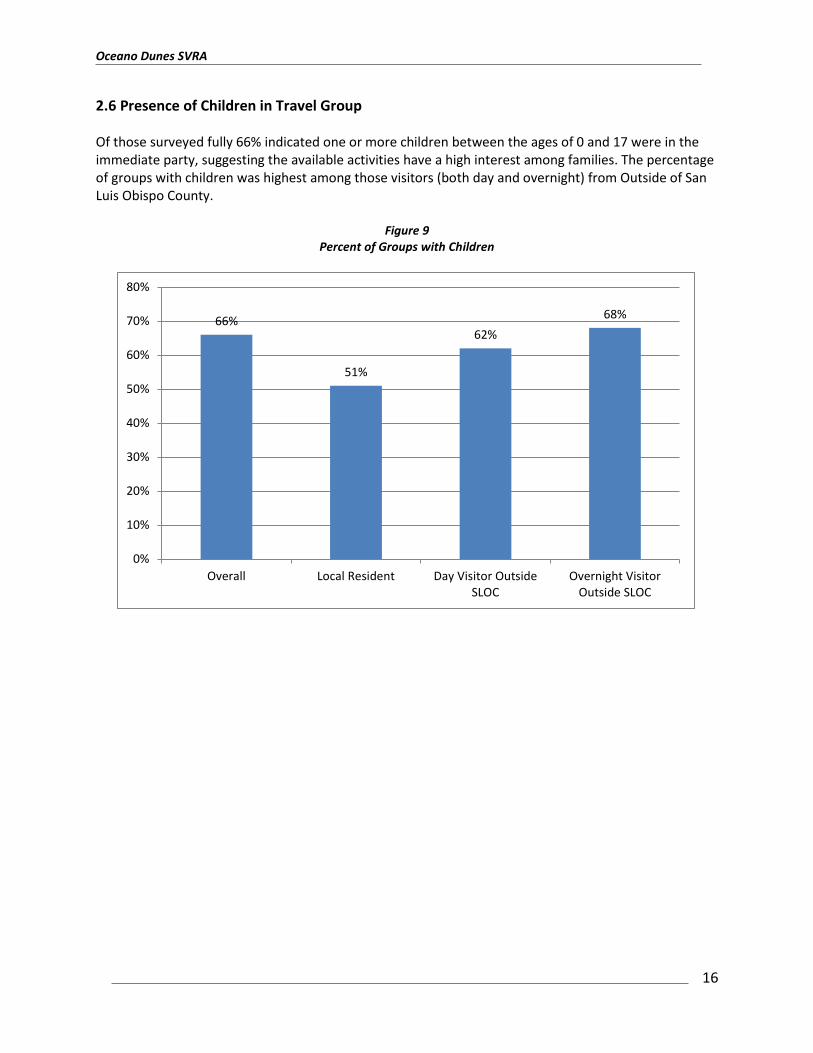
2.6 Presence of Children in Travel Group Of those surveyed fully 66% indicated one or more children between the ages of 0 and 17 were in the immediate party, suggesting the available activities have a high interest among families. The percentage of groups with children was highest among those visitors (both day and overnight) from Outside of San Luis Obispo County.
Figure 9 Percent of Groups with Children
66%
51%
62%
68%
0%
10%
20%
30%
40%
50%
60%
70%
80%
Overall Local Resident Day Visitor OutsideSLOC
Overnight VisitorOutside SLOC
Oceano Dunes SVRA
17
Section 3: Activity Participation
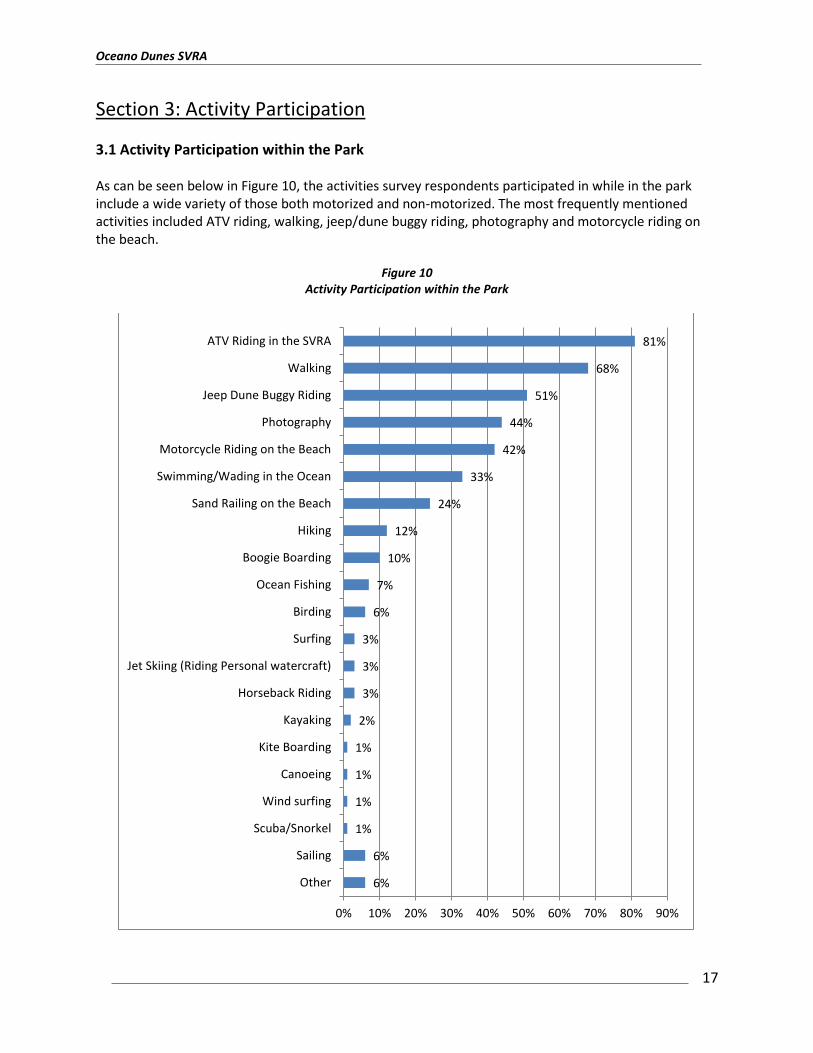
3.1 Activity Participation within the Park As can be seen below in Figure 10, the activities survey respondents participated in while in the park include a wide variety of those both motorized and non-motorized. The most frequently mentioned activities included ATV riding, walking, jeep/dune buggy riding, photography and motorcycle riding on the beach.
Figure 10 Activity Participation within the Park
6%
6%
1%
1%
1%
1%
2%
3%
3%
3%
6%
7%
10%
12%
24%
33%
42%
44%
51%
68%
81%
0% 10% 20% 30% 40% 50% 60% 70% 80% 90%
Other
Sailing
Scuba/Snorkel
Wind surfing
Canoeing
Kite Boarding
Kayaking
Horseback Riding
Jet Skiing (Riding Personal watercraft)
Surfing
Birding
Ocean Fishing
Boogie Boarding
Hiking
Sand Railing on the Beach
Swimming/Wading in the Ocean
Motorcycle Riding on the Beach
Photography
Jeep Dune Buggy Riding
Walking
ATV Riding in the SVRA
Oceano Dunes SVRA
18
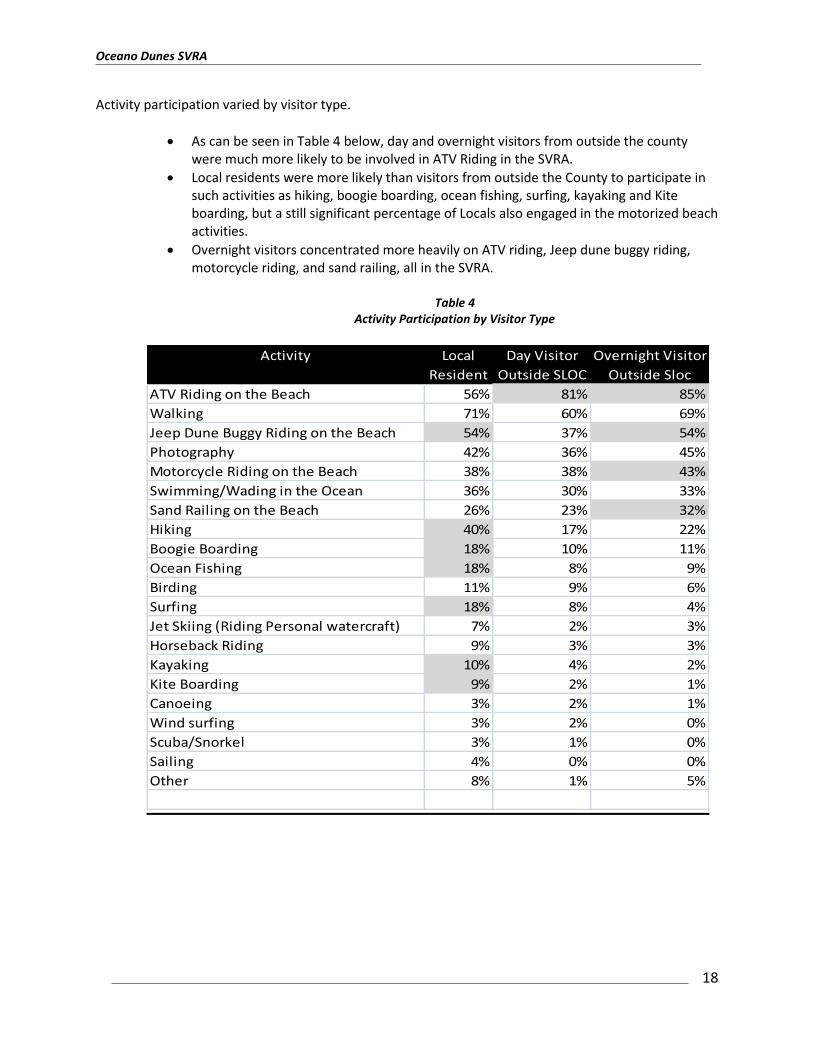
Activity participation varied by visitor type.
As can be seen in Table 4 below, day and overnight visitors from outside the county were much more likely to be involved in ATV Riding in the SVRA.
Local residents were more likely than visitors from outside the County to participate in such activities as hiking, boogie boarding, ocean fishing, surfing, kayaking and Kite boarding, but a still significant percentage of Locals also engaged in the motorized beach activities.
Overnight visitors concentrated more heavily on ATV riding, Jeep dune buggy riding, motorcycle riding, and sand railing, all in the SVRA.
Table 4 Activity Participation by Visitor Type
Activity Local Day Visitor Overnight Visitor
Resident Outside SLOC Outside Sloc
ATV Riding on the Beach 56% 81% 85%
Walking 71% 60% 69%
Jeep Dune Buggy Riding on the Beach 54% 37% 54%
Photography 42% 36% 45%
Motorcycle Riding on the Beach 38% 38% 43%
Swimming/Wading in the Ocean 36% 30% 33%
Sand Railing on the Beach 26% 23% 32%
Hiking 40% 17% 22%
Boogie Boarding 18% 10% 11%
Ocean Fishing 18% 8% 9%
Birding 11% 9% 6%
Surfing 18% 8% 4%
Jet Skiing (Riding Personal watercraft) 7% 2% 3%
Horseback Riding 9% 3% 3%
Kayaking 10% 4% 2%
Kite Boarding 9% 2% 1%
Canoeing 3% 2% 1%
Wind surfing 3% 2% 0%
Scuba/Snorkel 3% 1% 0%
Sailing 4% 0% 0%
Other 8% 1% 5%
Oceano Dunes SVRA
19
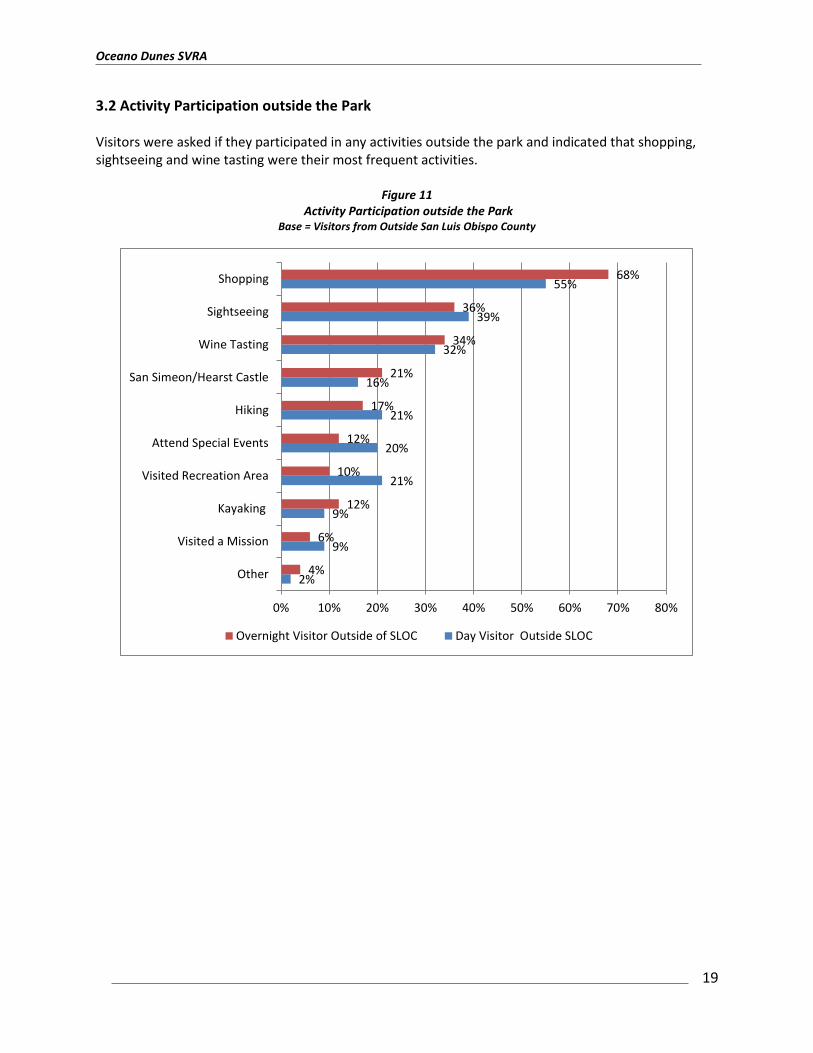
3.2 Activity Participation outside the Park Visitors were asked if they participated in any activities outside the park and indicated that shopping, sightseeing and wine tasting were their most frequent activities.
Figure 11 Activity Participation outside the Park
Base = Visitors from Outside San Luis Obispo County
2%
9%
9%
21%
20%
21%
16%
32%
39%
55%
4%
6%
12%
10%
12%
17%
21%
34%
36%
68%
0% 10% 20% 30% 40% 50% 60% 70% 80%
Other
Visited a Mission
Kayaking
Visited Recreation Area
Attend Special Events
Hiking
San Simeon/Hearst Castle
Wine Tasting
Sightseeing
Shopping
Overnight Visitor Outside of SLOC Day Visitor Outside SLOC
Oceano Dunes SVRA
20
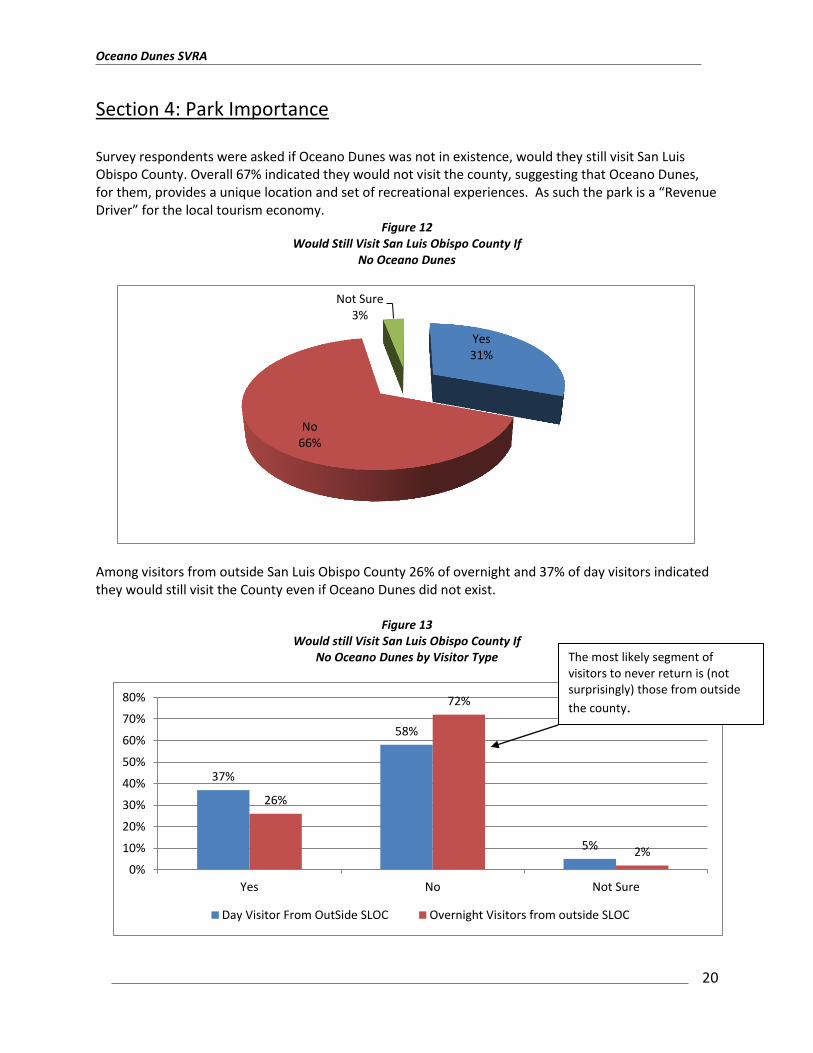
Section 4: Park Importance Survey respondents were asked if Oceano Dunes was not in existence, would they still visit San Luis Obispo County. Overall 67% indicated they would not visit the county, suggesting that Oceano Dunes, for them, provides a unique location and set of recreational experiences. As such the park is a “Revenue Driver” for the local tourism economy.
Figure 12 Would Still Visit San Luis Obispo County If
No Oceano Dunes
Among visitors from outside San Luis Obispo County 26% of overnight and 37% of day visitors indicated they would still visit the County even if Oceano Dunes did not exist.
Figure 13
Would still Visit San Luis Obispo County If No Oceano Dunes by Visitor Type
Yes 31%
No 66%
Not Sure 3%
37%
58%
5%
26%
72%
2%
0%
10%
20%
30%
40%
50%
60%
70%
80%
Yes No Not Sure
Day Visitor From OutSide SLOC Overnight Visitors from outside SLOC
The most likely segment of visitors to never return is (not surprisingly) those from outside
the county.
Oceano Dunes SVRA
21
Section 5: Travel Spending
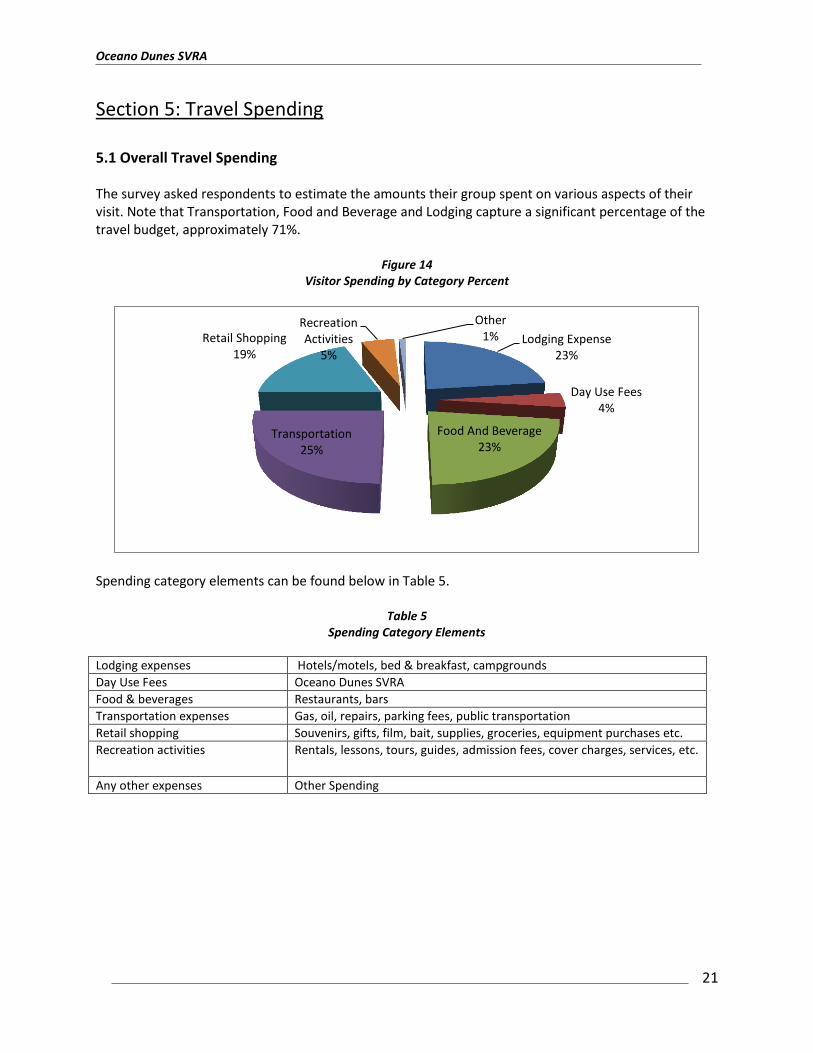
5.1 Overall Travel Spending The survey asked respondents to estimate the amounts their group spent on various aspects of their visit. Note that Transportation, Food and Beverage and Lodging capture a significant percentage of the travel budget, approximately 71%.
Figure 14 Visitor Spending by Category Percent
Spending category elements can be found below in Table 5.
Table 5 Spending Category Elements
Lodging expenses Hotels/motels, bed & breakfast, campgrounds
Day Use Fees Oceano Dunes SVRA
Food & beverages Restaurants, bars
Transportation expenses Gas, oil, repairs, parking fees, public transportation
Retail shopping Souvenirs, gifts, film, bait, supplies, groceries, equipment purchases etc.
Recreation activities
Rentals, lessons, tours, guides, admission fees, cover charges, services, etc.
Any other expenses Other Spending
Lodging Expense 23%
Day Use Fees 4%
Food And Beverage 23%
Transportation 25%
Retail Shopping 19%
Recreation Activities
5%
Other 1%
Oceano Dunes SVRA
22
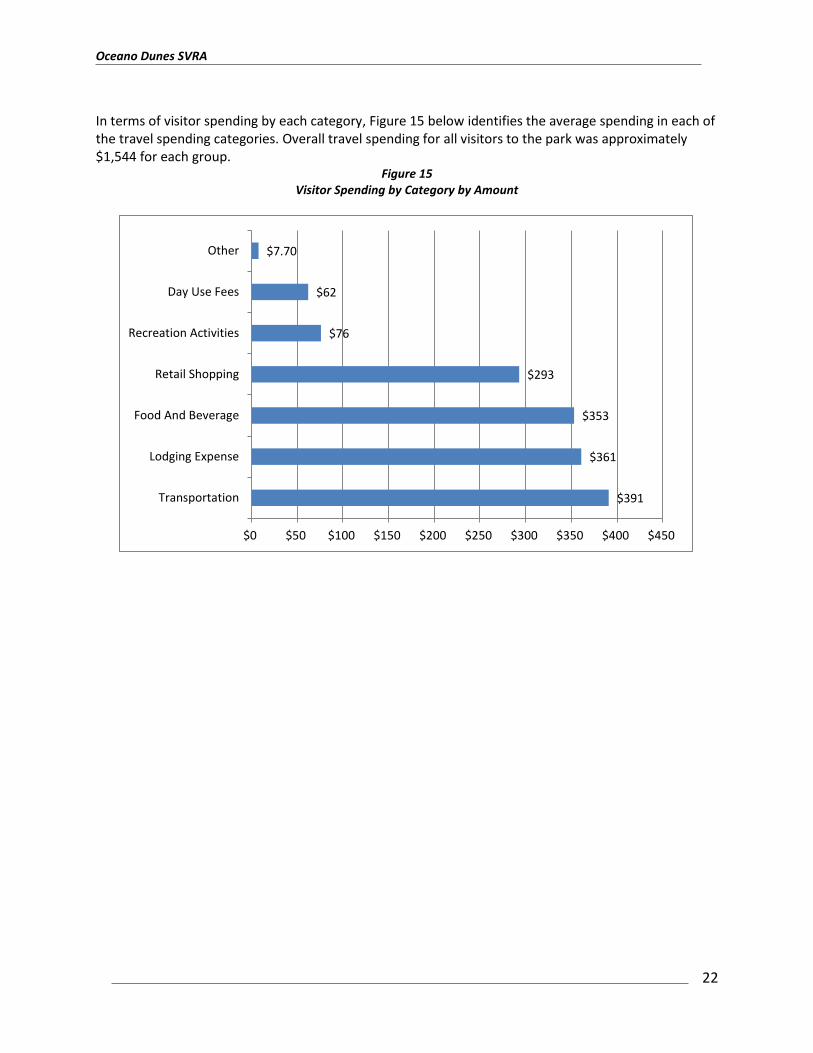
In terms of visitor spending by each category, Figure 15 below identifies the average spending in each of the travel spending categories. Overall travel spending for all visitors to the park was approximately $1,544 for each group.
Figure 15 Visitor Spending by Category by Amount
$391
$361
$353
$293
$76
$62
$7.70
$0 $50 $100 $150 $200 $250 $300 $350 $400 $450
Transportation
Lodging Expense
Food And Beverage
Retail Shopping
Recreation Activities
Day Use Fees
Other
Oceano Dunes SVRA
23
5.2 In Park Revenue Capture
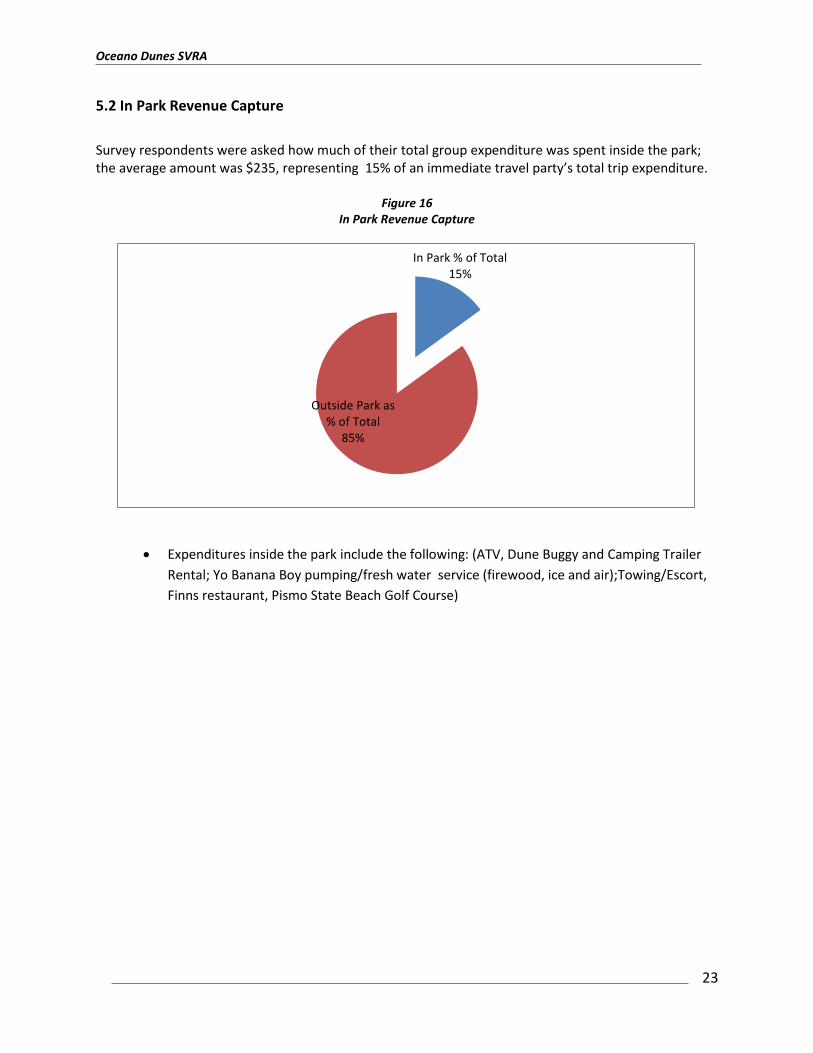
Survey respondents were asked how much of their total group expenditure was spent inside the park; the average amount was $235, representing 15% of an immediate travel party’s total trip expenditure.
Figure 16 In Park Revenue Capture
Expenditures inside the park include the following: (ATV, Dune Buggy and Camping Trailer
Rental; Yo Banana Boy pumping/fresh water service (firewood, ice and air);Towing/Escort,
Finns restaurant, Pismo State Beach Golf Course)
In Park % of Total 15%
Outside Park as % of Total
85%
Oceano Dunes SVRA
24
Section 6: Economic Impact
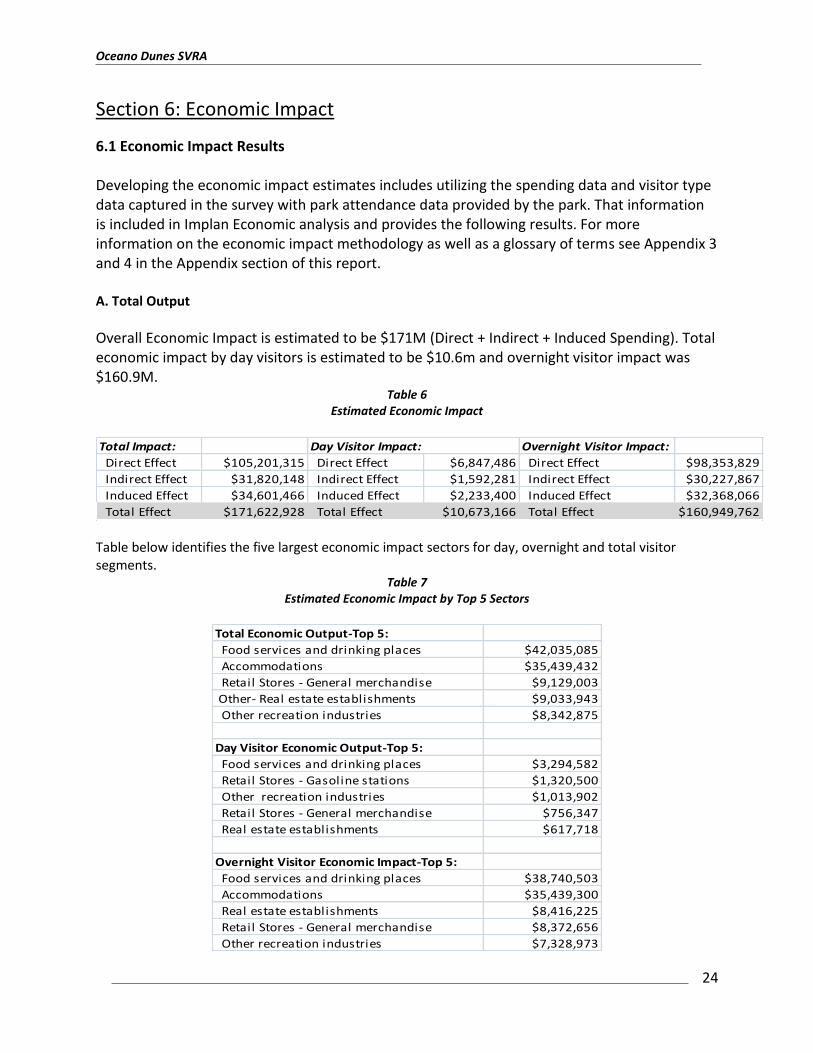
6.1 Economic Impact Results Developing the economic impact estimates includes utilizing the spending data and visitor type data captured in the survey with park attendance data provided by the park. That information is included in Implan Economic analysis and provides the following results. For more information on the economic impact methodology as well as a glossary of terms see Appendix 3 and 4 in the Appendix section of this report. A. Total Output
Overall Economic Impact is estimated to be $171M (Direct + Indirect + Induced Spending). Total economic impact by day visitors is estimated to be $10.6m and overnight visitor impact was $160.9M.
Table 6 Estimated Economic Impact
Total Impact: Day Visitor Impact: Overnight Visitor Impact:
Direct Effect $105,201,315 Direct Effect $6,847,486 Direct Effect $98,353,829
Indirect Effect $31,820,148 Indirect Effect $1,592,281 Indirect Effect $30,227,867
Induced Effect $34,601,466 Induced Effect $2,233,400 Induced Effect $32,368,066
Total Effect $171,622,928 Total Effect $10,673,166 Total Effect $160,949,762
Table below identifies the five largest economic impact sectors for day, overnight and total visitor segments.
Table 7 Estimated Economic Impact by Top 5 Sectors
Total Economic Output-Top 5:
Food services and drinking places $42,035,085
Accommodations $35,439,432
Retail Stores - General merchandise $9,129,003
Other- Real estate establishments $9,033,943
Other recreation industries $8,342,875
Day Visitor Economic Output-Top 5:
Food services and drinking places $3,294,582
Retail Stores - Gasoline stations $1,320,500
Other recreation industries $1,013,902
Retail Stores - General merchandise $756,347
Real estate establishments $617,718
Overnight Visitor Economic Impact-Top 5:
Food services and drinking places $38,740,503
Accommodations $35,439,300
Real estate establishments $8,416,225
Retail Stores - General merchandise $8,372,656
Other recreation industries $7,328,973
Oceano Dunes SVRA
25
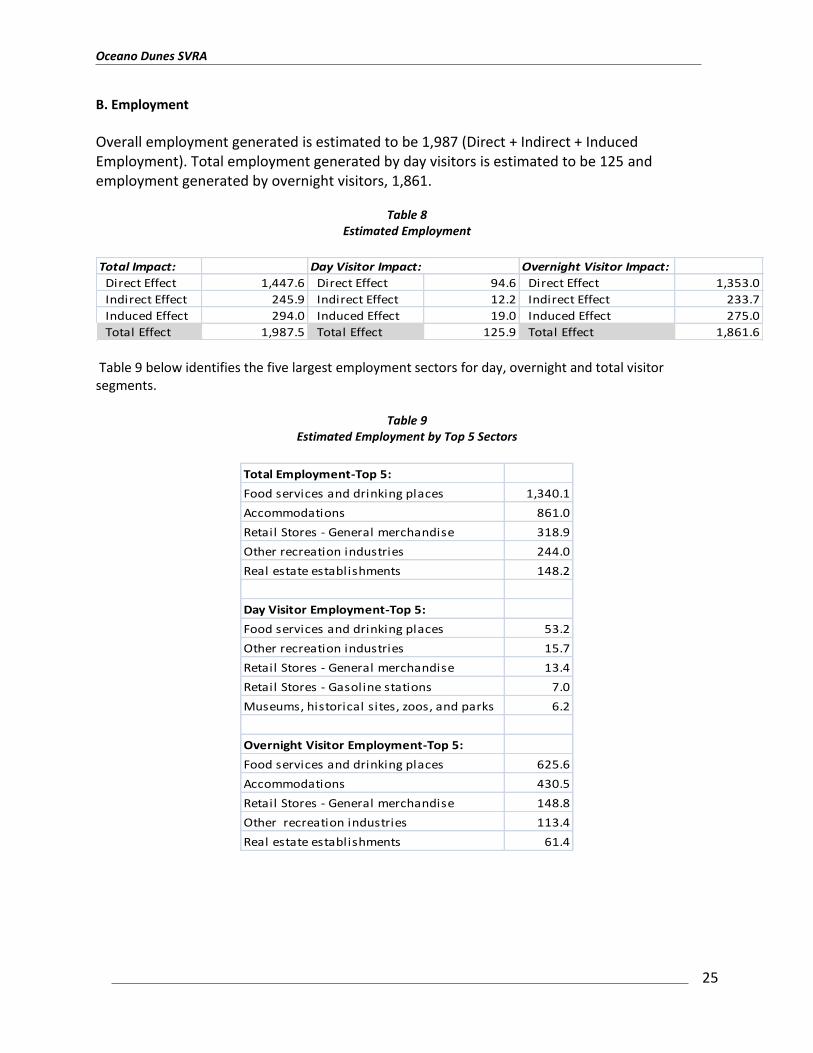
B. Employment
Overall employment generated is estimated to be 1,987 (Direct + Indirect + Induced Employment). Total employment generated by day visitors is estimated to be 125 and employment generated by overnight visitors, 1,861.
Table 8
Estimated Employment
Total Impact: Day Visitor Impact: Overnight Visitor Impact:
Direct Effect 1,447.6 Direct Effect 94.6 Direct Effect 1,353.0
Indirect Effect 245.9 Indirect Effect 12.2 Indirect Effect 233.7
Induced Effect 294.0 Induced Effect 19.0 Induced Effect 275.0
Total Effect 1,987.5 Total Effect 125.9 Total Effect 1,861.6
Table 9 below identifies the five largest employment sectors for day, overnight and total visitor segments.
Table 9 Estimated Employment by Top 5 Sectors
Total Employment-Top 5:
Food services and drinking places 1,340.1
Accommodations 861.0
Retail Stores - General merchandise 318.9
Other recreation industries 244.0
Real estate establishments 148.2
Day Visitor Employment-Top 5:
Food services and drinking places 53.2
Other recreation industries 15.7
Retail Stores - General merchandise 13.4
Retail Stores - Gasoline stations 7.0
Museums, historical sites, zoos, and parks 6.2
Overnight Visitor Employment-Top 5:
Food services and drinking places 625.6
Accommodations 430.5
Retail Stores - General merchandise 148.8
Other recreation industries 113.4
Real estate establishments 61.4
Oceano Dunes SVRA
26
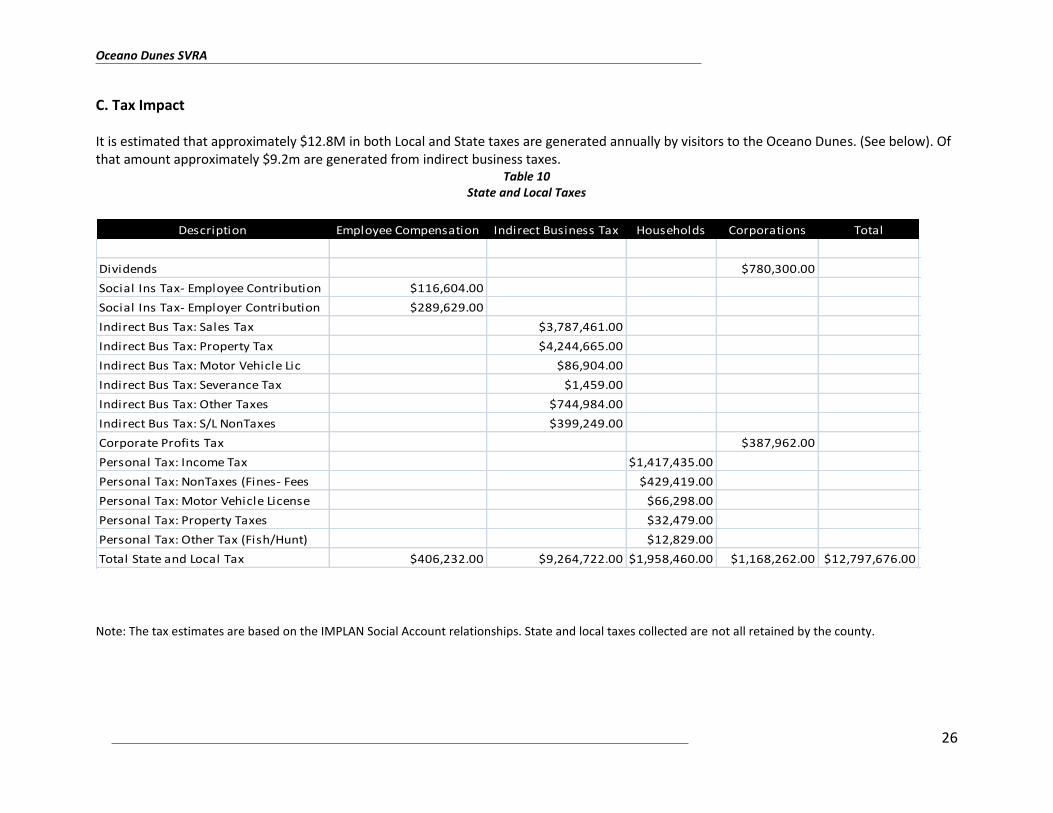
C. Tax Impact It is estimated that approximately $12.8M in both Local and State taxes are generated annually by visitors to the Oceano Dunes. (See below). Of that amount approximately $9.2m are generated from indirect business taxes.
Table 10 State and Local Taxes
Description Employee Compensation Indirect Business Tax Households Corporations Total
Dividends $780,300.00
Social Ins Tax- Employee Contribution $116,604.00
Social Ins Tax- Employer Contribution $289,629.00
Indirect Bus Tax: Sales Tax $3,787,461.00
Indirect Bus Tax: Property Tax $4,244,665.00
Indirect Bus Tax: Motor Vehicle Lic $86,904.00
Indirect Bus Tax: Severance Tax $1,459.00
Indirect Bus Tax: Other Taxes $744,984.00
Indirect Bus Tax: S/L NonTaxes $399,249.00
Corporate Profits Tax $387,962.00
Personal Tax: Income Tax $1,417,435.00
Personal Tax: NonTaxes (Fines- Fees $429,419.00
Personal Tax: Motor Vehicle License $66,298.00
Personal Tax: Property Taxes $32,479.00
Personal Tax: Other Tax (Fish/Hunt) $12,829.00
Total State and Local Tax $406,232.00 $9,264,722.00 $1,958,460.00 $1,168,262.00 $12,797,676.00
Note: The tax estimates are based on the IMPLAN Social Account relationships. State and local taxes collected are not all retained by the county.
Oceano Dunes SVRA
27
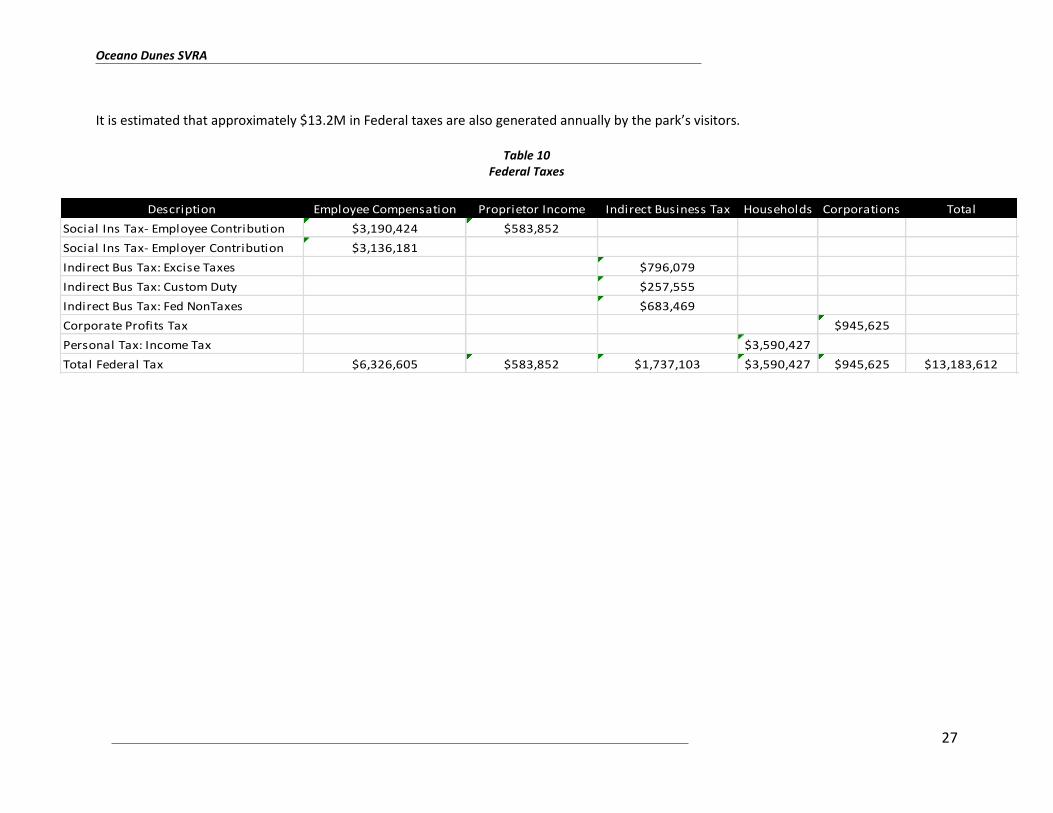
It is estimated that approximately $13.2M in Federal taxes are also generated annually by the park’s visitors.
Table 10 Federal Taxes
Description Employee Compensation Proprietor Income Indirect Business Tax Households Corporations Total
Social Ins Tax- Employee Contribution $3,190,424 $583,852
Social Ins Tax- Employer Contribution $3,136,181
Indirect Bus Tax: Excise Taxes $796,079
Indirect Bus Tax: Custom Duty $257,555
Indirect Bus Tax: Fed NonTaxes $683,469
Corporate Profits Tax $945,625
Personal Tax: Income Tax $3,590,427
Total Federal Tax $6,326,605 $583,852 $1,737,103 $3,590,427 $945,625 $13,183,612

Oceano Dunes SVRA
28
Appendix
Oceano Dunes SVRA
29
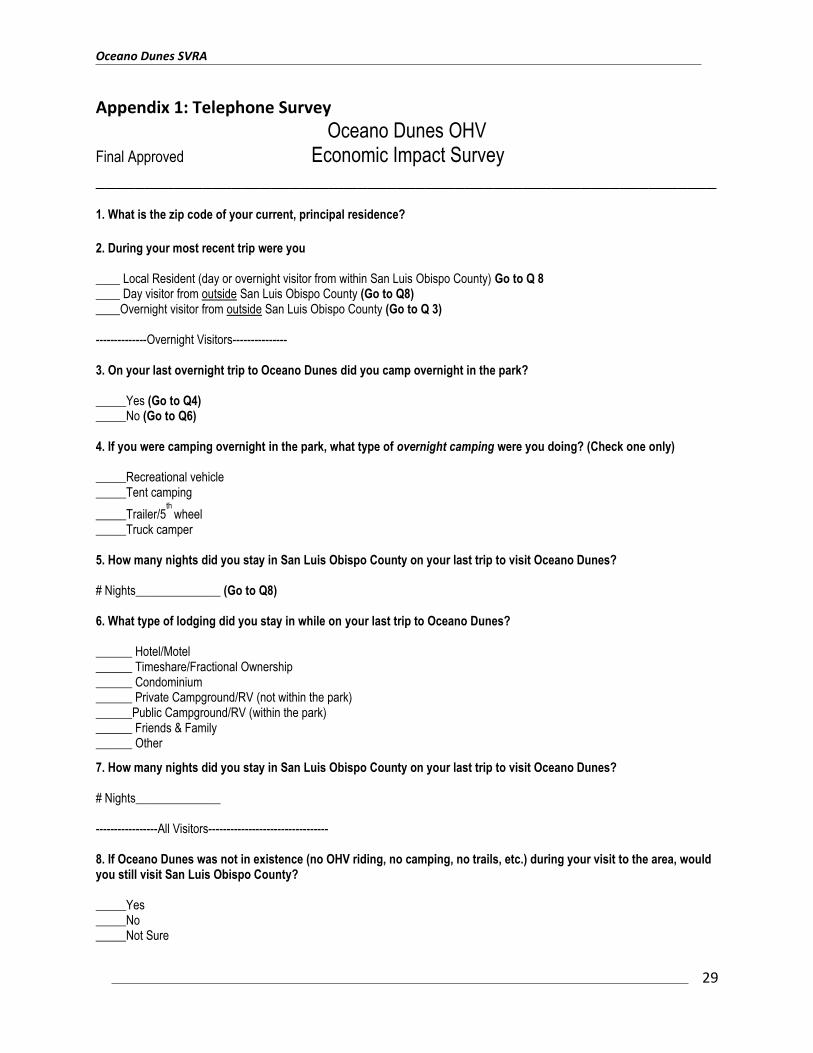
Appendix 1: Telephone Survey
Oceano Dunes OHV Final Approved Economic Impact Survey ________________________________________________________________ 1. What is the zip code of your current, principal residence?
2. During your most recent trip were you ____ Local Resident (day or overnight visitor from within San Luis Obispo County) Go to Q 8 ____ Day visitor from outside San Luis Obispo County (Go to Q8) ____Overnight visitor from outside San Luis Obispo County (Go to Q 3) --------------Overnight Visitors--------------- 3. On your last overnight trip to Oceano Dunes did you camp overnight in the park? _____Yes (Go to Q4) _____No (Go to Q6) 4. If you were camping overnight in the park, what type of overnight camping were you doing? (Check one only) _____Recreational vehicle _____Tent camping
_____Trailer/5th
wheel _____Truck camper 5. How many nights did you stay in San Luis Obispo County on your last trip to visit Oceano Dunes? # Nights______________ (Go to Q8) 6. What type of lodging did you stay in while on your last trip to Oceano Dunes? ______ Hotel/Motel ______ Timeshare/Fractional Ownership ______ Condominium ______ Private Campground/RV (not within the park) ______Public Campground/RV (within the park) ______ Friends & Family ______ Other
7. How many nights did you stay in San Luis Obispo County on your last trip to visit Oceano Dunes? # Nights______________ -----------------All Visitors--------------------------------- 8. If Oceano Dunes was not in existence (no OHV riding, no camping, no trails, etc.) during your visit to the area, would you still visit San Luis Obispo County? _____Yes _____No _____Not Sure
Oceano Dunes SVRA
30
9A. Which of these recreational activities did your group participate in, within the park during your most recent visit to Oceano Dunes SVRA? (Check all that apply) ATV riding on the beach Motorcycle riding on the beach Jeep/Dune Buggy riding on the beach Sand railing on the beach Kayaking Ocean fishing Swimming/wading in the ocean Kite boarding Canoeing Sailing Jet skiing (riding personal watercraft) Wind surfing Boogie boarding Surfing Scuba/snorkel Horseback riding Hiking Walking Birding Photography Other______________________________ (List) 9B. Did you participate in any of the following activities outside the park? _____ Wine tasting _____ Kayaking _____ Visited San Simeon / Hearst Castle _____ Shopping _____ Sightseeing _____ Visited a Mission _____ Hiking _____ Visited another recreation area (Lopez Lake, Nacimiento Lake, San Antonio Lake, _____ Attended an event (Mid-State Fair, concert, Car Show, St. Anthony’s, Wine Festival) _____ Other: __________________________________________________________ 10. How many people (including yourself) were in your immediate group when visiting Oceano Dunes SVRA?
Adults (18 +) _________________ Children (0-17)________________ Total ____________________
Continue>>>>>>>>>>>>>>>>>>>>>>>>>>>>>>>>>>>>>>>>>>
Oceano Dunes SVRA
31
11A. To better understand the economic impact of visitors to Oceano Dunes SVRA on San Luis Obispo County we are interested in finding out the approximate amount of money you and other visitors in your immediate group spent in San Luis Obispo County during your most recent visit to Oceano Dunes SVRA. We understand that this is a difficult question, but please do your best because your responses are very important to our efforts. During your visit, what is the approximate amount your entire group spent in each of the following categories? A. Lodging expenses (hotels/motels, bed & breakfast, campgrounds) $
B. Day-use fees at Oceano Dunes SVRA $
C. Food & beverages at restaurants, bars $
D. Transportation expenses (gas, oil, repairs, parking fees, public transportation) $
E. Retail shopping (souvenirs, gifts, film, bait, supplies, groceries, equipment purchases etc.) $
F. Recreation activities (rentals, lessons, tours, guides, admission fees, cover charges, services, etc.) $
G. Any other expenses
Please specify $
11B. Of the total amount you and your immediate party spent how much do you estimate you spent inside the park on
the following: : (ATV, Dune Buggy and Camping Trailer Rental, Yo Banana Boy pumping/fresh water service, (firewood,
ice and air)Towing/Escort, Finns restaurant, Pismo State Beach Golf Course)
$_______________________
12. Gender _____ Male _____ Female 13. What is your marital status? _____ Single _____ Married _____ Widowed _____ Living Together 14. Do you have children? _____ No children _____ Yes, Children at Home _____ Yes, Empty Nester
Oceano Dunes SVRA
32
Appendix 2: Participation Form
Become eligible to win a free 3 days/ 2 night stay in San Luis Obispo County!
Oceano Dunes District Economic Impact Study Participation Form
Please tell us about your experience at Ocean Dunes by participating in a CONFIDENTIAL telephone survey.
____ Yes, please contact me via telephone after my trip Please complete the following contact information. At minimum a contact name and phone number is required. Your information will be kept confidential and used for statistical purposes only!
*Name: _____________________________________________________________________ *Phone: Home: _________________________________ Cell__________________________________ Address: ___________________________________________________________________ City: _________________________________________ State: ________________ Zip: _________________________ Your information will be kept confidential, your name will not be sold and the information you provide will be destroyed after it is tabulated assuring your confidentiality. By participating you will be eligible to win a free 3 days/ 2 night stay in San Luis Obispo County!
Thank You!
Oceano Dunes SVRA
33
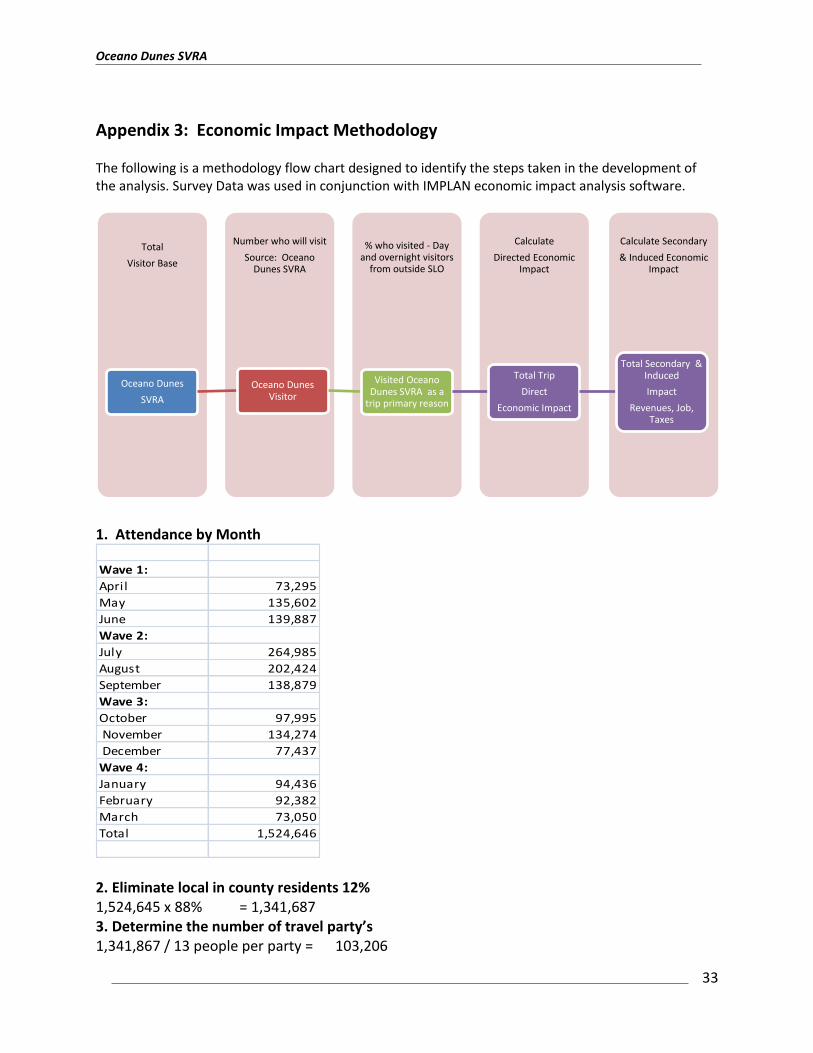
Appendix 3: Economic Impact Methodology The following is a methodology flow chart designed to identify the steps taken in the development of the analysis. Survey Data was used in conjunction with IMPLAN economic impact analysis software.
1. Attendance by Month
Wave 1:
April 73,295
May 135,602
June 139,887
Wave 2:
July 264,985
August 202,424
September 138,879
Wave 3:
October 97,995
November 134,274
December 77,437
Wave 4:
January 94,436
February 92,382
March 73,050
Total 1,524,646
2. Eliminate local in county residents 12% 1,524,645 x 88% = 1,341,687 3. Determine the number of travel party’s 1,341,867 / 13 people per party = 103,206
Calculate Secondary
& Induced Economic Impact
Calculate
Directed Economic Impact
% who visited - Day and overnight visitors
from outside SLO
Number who will visit
Source: Oceano Dunes SVRA
Total
Visitor Base
Oceano Dunes
SVRA
Oceano Dunes Visitor
Visited Oceano Dunes SVRA as a
trip primary reason
Total Trip
Direct
Economic Impact
Total Secondary & Induced
Impact
Revenues, Job, Taxes
Oceano Dunes SVRA
34
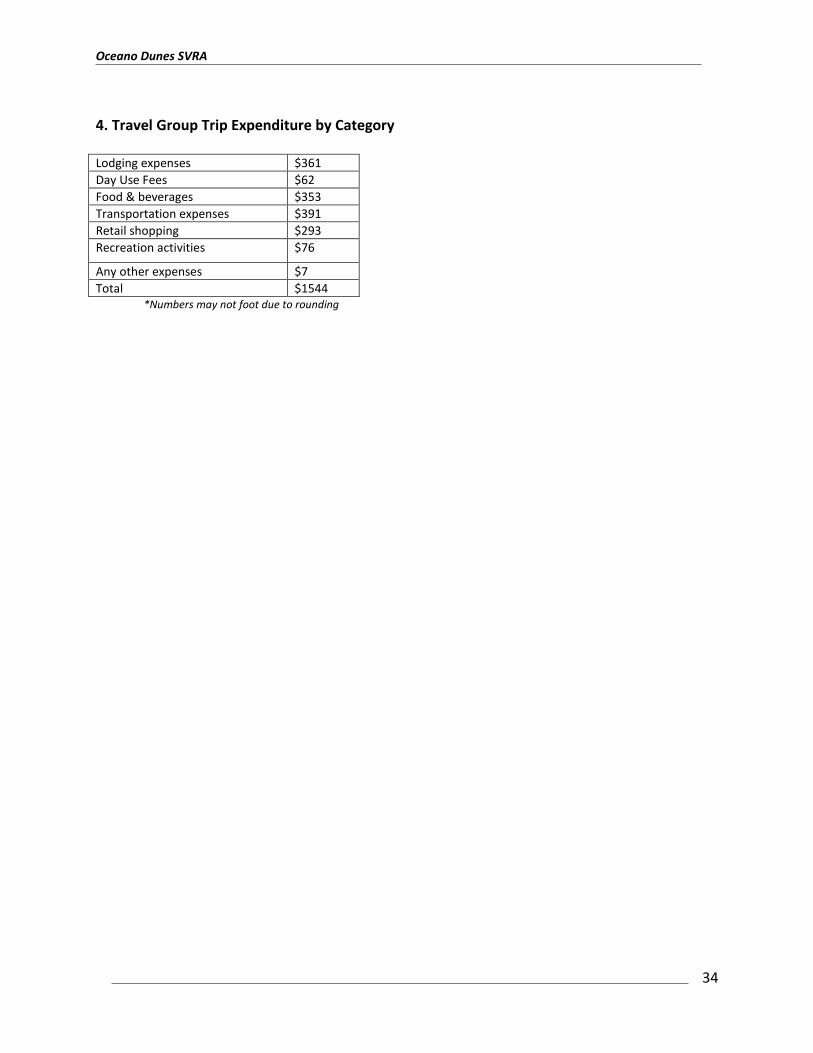
4. Travel Group Trip Expenditure by Category Lodging expenses $361
Day Use Fees $62
Food & beverages $353
Transportation expenses $391
Retail shopping $293
Recreation activities $76
Any other expenses $7
Total $1544 *Numbers may not foot due to rounding
Oceano Dunes SVRA
35
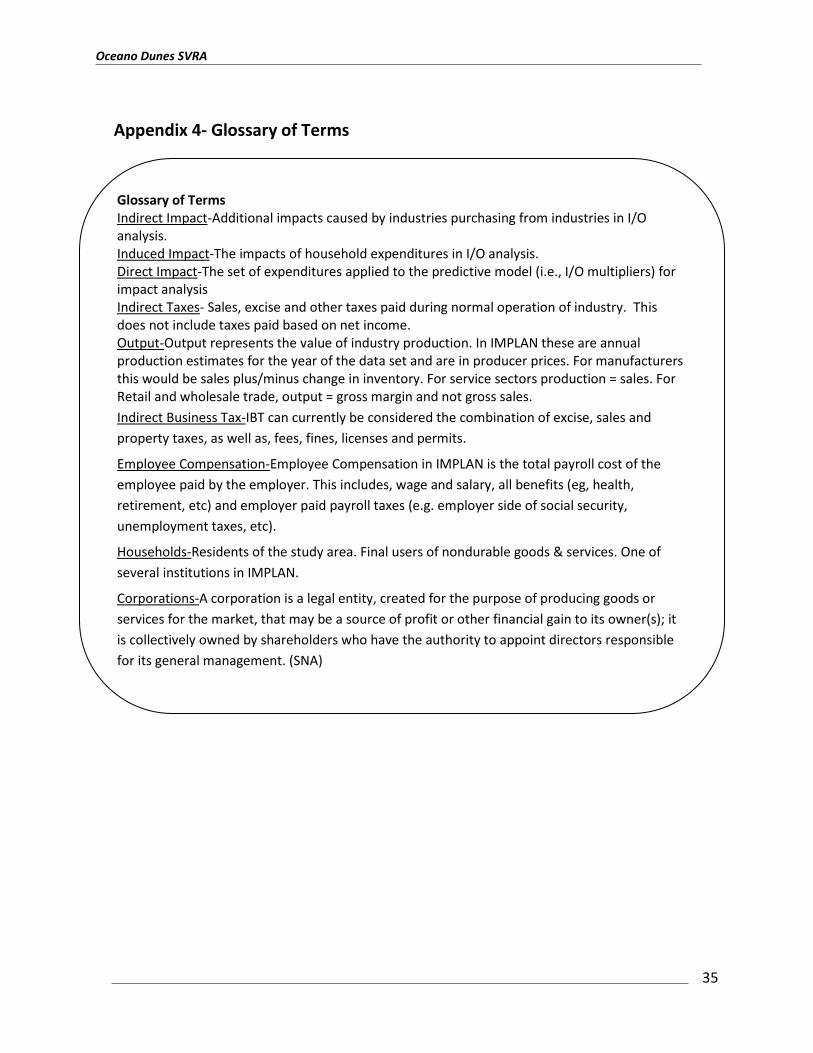
Appendix 4- Glossary of Terms
Glossary of Terms Indirect Impact-Additional impacts caused by industries purchasing from industries in I/O analysis. Induced Impact-The impacts of household expenditures in I/O analysis. Direct Impact-The set of expenditures applied to the predictive model (i.e., I/O multipliers) for impact analysis Indirect Taxes- Sales, excise and other taxes paid during normal operation of industry. This does not include taxes paid based on net income. Output-Output represents the value of industry production. In IMPLAN these are annual production estimates for the year of the data set and are in producer prices. For manufacturers this would be sales plus/minus change in inventory. For service sectors production = sales. For Retail and wholesale trade, output = gross margin and not gross sales.
Indirect Business Tax-IBT can currently be considered the combination of excise, sales and
property taxes, as well as, fees, fines, licenses and permits.
Employee Compensation-Employee Compensation in IMPLAN is the total payroll cost of the
employee paid by the employer. This includes, wage and salary, all benefits (eg, health,
retirement, etc) and employer paid payroll taxes (e.g. employer side of social security,
unemployment taxes, etc).
Households-Residents of the study area. Final users of nondurable goods & services. One of
several institutions in IMPLAN.
Corporations-A corporation is a legal entity, created for the purpose of producing goods or
services for the market, that may be a source of profit or other financial gain to its owner(s); it
is collectively owned by shareholders who have the authority to appoint directors responsible
for its general management. (SNA)