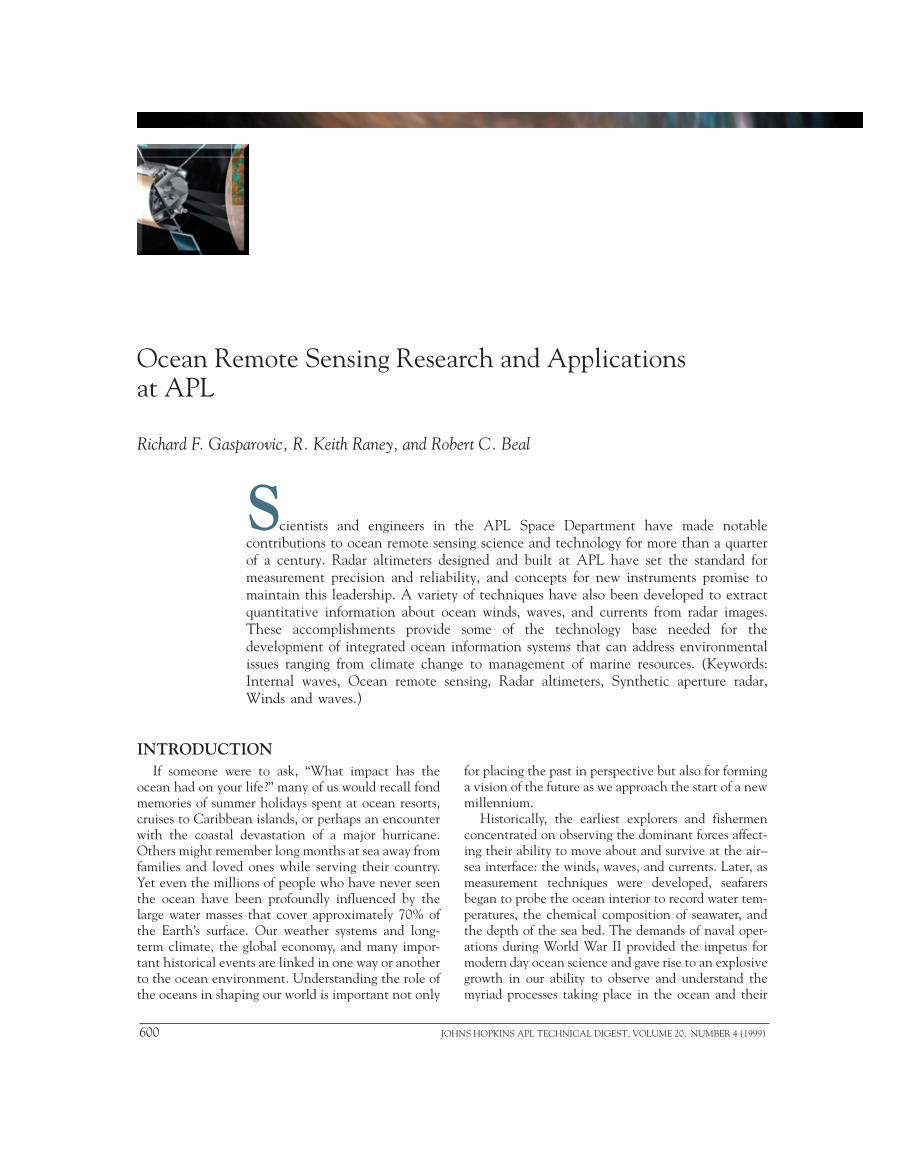
ocean remote sensing research and applications at apl · · 1999-12-15ocean remote sensing...
TRANSCRIPT
R. F. GASPAROVIC, R. K. RANEY, AND R. C. BEAL
S
Ocean Remote Sensing Research and Applicationsat APL
Richard F. Gasparovic, R. Keith Raney, and Robert C. Beal
cientists and engineers in the APL Space Department have made notablecontributions to ocean remote sensing science and technology for more than a quarterof a century. Radar altimeters designed and built at APL have set the standard formeasurement precision and reliability, and concepts for new instruments promise tomaintain this leadership. A variety of techniques have also been developed to extractquantitative information about ocean winds, waves, and currents from radar images.These accomplishments provide some of the technology base needed for thedevelopment of integrated ocean information systems that can address environmentalissues ranging from climate change to management of marine resources. (Keywords:Internal waves, Ocean remote sensing, Radar altimeters, Synthetic aperture radar,Winds and waves.)
INTRODUCTIONIf someone were to ask, “What impact has the
ocean had on your life?” many of us would recall fondmemories of summer holidays spent at ocean resorts,cruises to Caribbean islands, or perhaps an encounterwith the coastal devastation of a major hurricane.Others might remember long months at sea away fromfamilies and loved ones while serving their country.Yet even the millions of people who have never seenthe ocean have been profoundly influenced by thelarge water masses that cover approximately 70% ofthe Earth’s surface. Our weather systems and long-term climate, the global economy, and many impor-tant historical events are linked in one way or anotherto the ocean environment. Understanding the role ofthe oceans in shaping our world is important not only
600 JOH
for placing the past in perspective but also for forminga vision of the future as we approach the start of a newmillennium.
Historically, the earliest explorers and fishermenconcentrated on observing the dominant forces affect-ing their ability to move about and survive at the air–sea interface: the winds, waves, and currents. Later, asmeasurement techniques were developed, seafarersbegan to probe the ocean interior to record water tem-peratures, the chemical composition of seawater, andthe depth of the sea bed. The demands of naval oper-ations during World War II provided the impetus formodern day ocean science and gave rise to an explosivegrowth in our ability to observe and understand themyriad processes taking place in the ocean and their
NS HOPKINS APL TECHNICAL DIGEST, VOLUME 20, NUMBER 4 (1999)

OCEAN REMOTE SENSING RESEARCH AND APPLICATIONS AT APL
influence on our terrestrial environment. The earlydays of the space age in the late 1960s brought asignificant improvement in this observational capabil-ity with the launch of the first satellites to monitorglobal weather systems. For the first time, we couldbegin to assemble a truly synoptic view of some of theimportant consequences of energy exchange betweenthe world’s oceans and its atmosphere. At the sametime, the remote sensing community began to developoptical, infrared, and microwave sensors for aircraftobservations of ocean parameters. Many of these be-came prototypes for spaceborne instruments, and somedared to ask what we could learn about the ocean itselffrom space. Scientists and engineers in the APL SpaceDepartment have participated in the search for ananswer to this question for the past quarter century.
APL RESEARCH THEMESOur remote sensing research has been focused on a
few broad areas despite having been sponsored by sev-eral agencies with diverse interests. The largest effortshave been concerned with the science and technologyof radar altimetry and the extraction of oceanographicinformation from synthetic aperture radar (SAR) im-agery. Underlying both of these efforts has been a sub-stantial research program addressing the physics ofmicrowave scattering from the sea surface. Numerousprojects associated with applications of optical andinfrared remote sensing techniques have also been partof our repertoire. Sponsoring agencies have includedNASA, the National Oceanic and Atmospheric Ad-ministration (NOAA), the Office of Naval Research(ONR), the Defense Advanced Research ProjectsAgency (DARPA), and various other Navy offices.
RADAR ALTIMETRY
GEOS 3 and Seasat—The BeginningAPL’s contributions to the science and technology
of satellite radar altimetry began in 1971 with theGeodynamics Experimental Ocean Satellite (GEOS 3)Project managed by the NASA Wallops Flight Center.APL was selected as the spacecraft and experimenthardware contractor; the General Electric Companyprovided the radar altimeter. The GEOS 3 satellite,launched on 9 April 1975, was designed to improve ourknowledge of the Earth’s gravitational field, the size andshape of the terrestrial geoid, deep ocean tides, seastate, current structure, and solid earth dynamics.1
GEOS 3 provided over 3.5 years of data and demon-strated the feasibility of directly measuring geodetic,oceanographic, and geophysical parameters throughthe reduction and analysis of the altimeter height mea-surements and the shape and structure of the return
JOHNS HOPKINS APL TECHNICAL DIGEST, VOLUME 20, NUMBER 4 (1
waveform. In addition, the altimeter was shown to becapable of providing valid measurements over land andsea ice.
In 1972, even before the launch of GEOS 3, NASAbegan planning for the Seasat satellite, the first mul-tisensor spacecraft dedicated specifically to ocean ob-servations. APL designed and built the radar altimeterfor Seasat, which was launched in June 1978. The APLdesign introduced a novel signal processing methodol-ogy known as the full deramp technique that allowedheight to be measured to a precision of a few centime-ters, an order of magnitude improvement over theGEOS 3 altimeter.2 Despite the premature demise ofthe Seasat spacecraft after only 100 days in orbit, thealtimeter performance clearly demonstrated the signif-icance of the APL processing innovation, and it wasadopted as the standard approach for future satelliteradar altimeters.3
Geosat—The Way to the FutureAfter the loss of Seasat, the Navy funded the Geosat
altimeter mission to obtain a densely sampled, precisemapping of the Earth’s geoid over the ocean during an18-month period. APL was selected to be the primecontractor responsible for constructing the spacecraftbus and building the radar altimeter as well as forperforming the spacecraft command and control oper-ations, collecting mission data, and processing the datainto sensor data records for distribution to the usercommunity. During mission planning, it was recognizedthat valuable environmental data also could be ob-tained from the Geosat altimeter. The Oceanographerof the Navy responded with the Global Ocean Appli-cations Program to exploit the altimeter observationsfor operational physical oceanography during an ex-tended mission following completion of the classifiedgeodetic mission.
The Geosat primary mission began with its launchon 12 March 1985 into an 800-km-altitude orbit thatgenerated 3-day near-repeat ground tracks. The averagespacing of the ground-track grid was 4 km. On 1October 1986, at the completion of the 18-monthprimary geodetic mission, APL maneuvered the space-craft into a 17.05-day exact repeat orbit to make thespacecraft subtrack coincide with the Seasat orbit andallow unclassified distribution of the data to users. TheExact Repeat Mission (ERM) began on 8 November1986 and continued until January 1990, when themission was terminated owing to degradation of thealtimeter’s output power.
The Geosat geoid data were declassified in 1995 andreleased to the scientific community. One of the first usesof those data was to generate a global seafloor topogra-phy map offering more than twice the resolution of thebest previous global map.4 The oceanographic data from
999) 601

R. F. GASPAROVIC, R. K. RANEY, AND R. C. BEAL
the ERM became a critical component of the Navy’soperational mesoscale analyses. They were used also bythe scientific community to determine sea-level vari-ability and absolute dynamic height to scales of thou-sands of kilometers for studies of long-term sea-levelvariability in diverse regions of the globe, including thefirst-ever basin-wide synoptic view of sea-level changeduring El Niño.5 APL scientists made important con-tributions to the validation of the wind and wavemeasurements from Geosat,6,7 as well as to operationalapplications associated with forecasting the GulfStream.8,9
Topex/Poseidon—The State of the ArtTopex/Poseidon, launched on 10 August 1992, is the
first space mission specifically designed for observingthe circulation of the world’s oceans. The primaryinstrument for this joint U.S./France mission is Topex,the first spaceborne dual-frequency (5.3 and 13.6 GHz)altimeter, developed and built by APL. The design isbased on the previous Seasat and Geosat altimeterswith significant improvements, including the 5.3-GHzchannel for ionospheric delay measurements, moreprecise height measurements, and longer lifetime.10
The Topex altimeter data are being used by an in-ternational team of more than 200 investigators toaddress many of the aspects of the ocean’s role in cli-mate change, such as the transport of heat and carbondioxide; improving our understanding of winds, waves,and ocean tides; and development of techniques for theassimilation of altimeter data with in situ observationsinto ocean circulation models to produce an optimaldescription of the state of the ocean circulation.
Although the Topex altimeter was designed for amission to last for at least 3 years with a possible ex-tension to 6 years, it continues to operate satisfactorilyafter nearly 7 years on orbit. This extended lifetime isthe result of an APL design that incorporates a fullyredundant set of radio-frequency and signal processingelectronics for the altimeter. The second side was ac-tivated in April 1999, which should extend the missionfor an additional 2 to 3 years.
ADVANCED RADAR ALTIMETERTECHNIQUES—VISIONS OF THEFUTURE
Delay/Doppler ProcessingDespite the excellent performance of contemporary
satellite radar altimeters, there are definite limitationsfor observations near coastlines and over other surfacessuch as continental ice sheets. In response to thesedeficiencies, in 1994 APL began developing a new typeof radar altimeter that incorporates features derived
602 JO
from SAR technology. The result is the delay/Dopplerradar altimeter.11 The central innovation in this state-of-the-art altimeter is that the returns from a group oftransmissions along track are coherently processed to-gether, rather than incoherently as is customary. Thecoherent along-track processing allows much more ofthe instrument’s radiated power to be converted intoheight measurement data, among other advantages.The delay/Doppler technique leads to a smaller instru-ment that requires less power, yet simulations indicatethat its measurement precision is finer than thatof a conventional radar altimeter, and its waveform ismuch better suited to ice sheet, coastal, and terrestrialapplications.
The along-track processing transforms the data intothe Doppler frequency domain where delay correctionsare applied, analogous to range curvature correction ina SAR.12 Doppler processing determines the size andlocation of the along-track footprint (Fig. 1), which is(1) smaller than the pulse-limited diameter, (2) a con-stant of the system, and (3) relatively immune to sur-face topographic variations and coastal proximity.When the waveforms from parallel Doppler bins are co-registered and summed, the resulting height measure-ments benefit from more incoherent averaging. Thedelay/Doppler flat-surface response is an impulse ratherthan the more familiar step function produced by con-ventional satellite radar altimeters.
The velocity of a conventional satellite altimetercauses the effective footprint for a multipulse waveformto be elongated along track. Detected returns frommany pulses are averaged together to build each mul-tilook waveform. Such signal summations typicallyextend over 1.0 s, during which time the antenna il-lumination pattern progresses in the along-track direc-tion by an appreciable distance, approximately 6 km.As a result, the effective postaveraging footprint for aconventional altimeter is a set of elliptical annuli, elon-gated along track, rather than the circular single-pulsefootprints normally cited in the literature. In contrast,the relative location of each delay/Doppler-derivedheight estimate is synchronized to coincide with theforward motion of the instrument, thus eliminatingalong-track elongation of the footprint. Typical delay/Doppler footprints measure only 250 m along track.The cross-track footprint is determined by the pulse-limited condition, as is the case for conventional sat-ellite radar altimeters.3
Phase-Monopulse TechniqueThe phase between two otherwise identical coher-
ent signals is a direct measure of the time shift betweenthem. If the geometry of the observation space isknown, then the observed phase shift can be invertedto an angular offset. The phase-monopulse technique
HNS HOPKINS APL TECHNICAL DIGEST, VOLUME 20, NUMBER 4 (1999)

OCEAN REMOTE SENSING RESEARCH AND APPLICATIONS AT APL
Figure 1. Comparison of a conventional pulse-limited radar altimeter’s (a) illumination geometry (side view) and footprint (plan view) and(b) impulse response, with a delay/Doppler altimeter’s (c) illumination geometry and footprint and (d) impulse response.
Round-trippulse
propagation
Antenna height, h
Sea surface
Compressedpulse length, �
Bandwidth, �
2rP Pulse-limited footprint(radius, rP)Annuli of equal
areas, AP
0
1
2
3
Relative time delay, t /�
Compressedpulse length, �
Along-orbit velocity, V
Doppler frequency
Range delaycompensation,
∆h ~ fD2
XD
Zero Doppler bin(surface width, XD)Pulse-Doppler–
limited footprint
Relative time delay, t /�(ambiguous across track) Along-track position
(after compensation)
Pow
er
Delay time, t
Conventional
Pow
er
Delay time, t
Delay/Doppler
(a)
(b)
(c)
(d)
0
1
2
3
1
2
•
••
••
Height error,
∆h
Compressed pulseduration, �
uses this principle to estimate the angle of arrivalbetween two signals collected through separated anten-nas. Two such antennas may be arranged orthogonallyto the flight direction of a radar altimeter (Fig. 2). Ina radar altimeter that uses the phase-monopulse tech-nique,13 a scatterer at cross-track distance �y away from
JOHNS HOPKINS APL TECHNICAL DIGEST, VOLUME 20, NUMBER 4 (199
nadir produces a path-length difference �R, observablethrough the cross-channel differential phase. Thecross-track phase-monopulse technique can measurethe presence of small (mean) cross-track surfaceslopes, or satellite-roll errors, when over a nominallylevel surface such as the sea. Once measured, either
9) 603

R. F. GASPAROVIC, R. K. RANEY, AND R. C. BEAL
slope- or attitude-induced wave-form errors can be corrected tocompensate for the differentialheight �h, thus leading to moreaccurate estimates of the height h.The cross-track phase-monopulsetechnique complements the delay/Doppler technique, which is analong-track enhancement.
NASA’s Instrument IncubatorProject
APL’s proposal, “The New Gen-eration of Radar Altimeters: Proofof Concept,” was selected by NASAin the fall of 1998 as one of the firstgroup of Instrument IncubatorProjects. Its objective is to demon-strate through airborne flight teststhe fundamental viability and desir-ability of an innovative altimeterconcept that combines the delay/Doppler and the phase-monopulsetechniques into one instrument, the
Figure 2. The across-track (mean) sur-face slope can be estimated by a measure-ment of the phase difference between thesame return observed through two sepa-rated antennas. The range difference �Ris proportional to this phase difference,from which the slope-induced height cor-rection �h can be calculated.
∆R
∆y
h
D
R
�h
604
first of its kind. This advanced instrument is known as the D2P altimeter.In future satellite versions, a flight-proven D2P radar altimeter will offerunprecedented measurement accuracy over continental ice sheets andbetter precision from a smaller instrument over the open ocean. For thefirst time, near-shore (1-km) satellite-based radar altimetry will be possible.Variations on the D2P approach should support remote depth sounding ofice or terrestrial elevation altimetry. The D2P concept is the first of a newgeneration of radar altimeters that simultaneously satisfies high signal-to-noise ratio, high signal-to-speckle ratio, and high signal-to-clutter ratio.These characteristics represent a substantial and innovative breakthrough.
The APL Instrument Incubator Project will (1) complete the detaileddesign of the altimeter, (2) build and test the altimeter in the laboratory,(3) perform demonstration aircraft flight tests of the altimeter over theocean and the ice sheets of southern Greenland, (4) evaluate the results,and (5) design, build, and demonstrate in the laboratory a real-rate signalprocessing unit sufficient to support the demands of an orbital D2P altim-eter. The size, cost, and performance of a future satellite version of thisaltimeter will also be estimated.
WINDS AND WAVES
Seasat—Another BeginningIn 1975, NASA decided to include a high-resolution SAR as an exper-
imental instrument on Seasat on the premise that it might allow thedirectional spectrum of ocean waves to be measured on global scales, quasi-continuously, and under extreme and variable sea conditions. Althoughaircraft SAR systems had acquired images of the sea surface in the early1970s that showed evidence of wave-like features, it was not at all certainthat quantitative wave information could be extracted from satellite SARobservations. The fundamental problem here is that the ocean waves moveduring the interval (1 s or so) that the radar acquires sufficient data to forman image. The decision to fly a SAR on Seasat with little more than a hopethat it would yield useful ocean information (an unlikely decision in today’sfunding climate) became the impetus for a nearly 20-year effort by APLscientists and other researchers to understand the nuances of radar imagingof ocean waves. A sampling of the rich variety of oceanographic imageryrecorded by the Seasat SAR can be found in Ref. 14, which documentsthe principal results of a symposium held at APL in March 1980.
The effort to interpret SAR images of large storms encountered duringthe Seasat mission15 and subsequent data from the second Shuttle ImagingRadar experiment (SIR-B) in 1984 (1) paved the way for the developmentof wave imaging theories and new techniques to extract wave information,and (2) demonstrated the effects of spacecraft altitude and velocity on theability of a SAR to measure the directional wave spectrum (see the boxedinsert). A symposium entitled “Measuring Ocean Waves from Space” washeld at APL in April 1986 to reexamine the scientific and operationalmotivation for observing ocean waves from space, to review the SIR-Bresults and their implications, and to explore and debate the benefits ofa global wave-monitoring capability.16 An opportunity to blend SARimages with in situ wave observations and wave model predictions camein March 1987 with the Labrador Sea Extreme Waves Experiment(LEWEX), the subject of yet another APL-hosted symposium in April1989.17,18
One of the more remarkable, and unexpected, results from the Seasat SARimages was the observation that the images often showed an identifiable
JOHNS HOPKINS APL TECHNICAL DIGEST, VOLUME 20, NUMBER 4 (1999)

JOHNS
OCEAN REMOTE SENSING RESEARCH AND APPLICATIONS AT APL
ATMOSPHERIC SIGNATURES IN SAR IMAGERY
Periodic spatial structures caused by wind andwaves are often evident in SAR ocean imagery.The top figure shows a 300-km-wide Radarsat im-age (50-m pixels) acquired on 6 March 1997 overthe New Jersey coast. A steady wind of 12–15m/s from the northwest was blowing nearly normalto the coast at overpass time. Gusts to 25 m/s werereported; widespread power outages occurred ineastern Pennsylvania. It takes little imagination toinfer the mean wind direction from the SARimage. A downwind segment of the SAR image(box at lower right) contains a number of interest-ing oceanic and atmospheric signatures, even moremanifest in the two-dimensional (or directional)spatial spectrum. These signatures give insight intothe physical processes operating on and above theair–sea boundary and also illustrate some of theintrinsic limitations imposed by the SAR imageformation process.
The center figure is the wavenumber spectrumof the transform area of the top figure. It shows allscales in the directional spectrum longer than100 m. Here the spectrum indicates a dominantwavelength of about 150 m (10-s period), travellingnearly normal to the SAR velocity vector (whichis toward the top). But the wave spectral energydistribution exhibits two suspicious characteristics:(1) it is apparently split into two modes, with apropagation angle difference of about 20˚, and (2)it is confined to a narrow wavenumber band normalto the SAR velocity vector (not in the downwinddirection). Neither of these “instrument contami-nations” is new with Radarsat; each was first ob-served 20 years ago in Seasat data and more recentlyin ERS-1 and ERS-2 images. They are intrinsic lim-itations of a high-altitude SAR and can be over-come only by lowering the altitude to about 300 kmor so. Such a low-altitude SAR is not likely to berealized soon, since higher atmospheric drag wouldrequire substantial onboard propellant.
The bottom figure is an expanded spectrum ofthe middle portion of the center figure. It shows thevery longest wavelength scales in the SAR wave-number spectrum, from 800 m to approximately 50km, that are often associated with atmospheric sig-natures such as boundary-layer rolls. This particularspectral signature is typical of an unstable boundarylayer, often seen in the aftermath of a cold air out-break along the U.S. East Coast. The long axis ofthe energy bundle is nearly normal to the local winddirection, and the spectral peak (seen in the figureat about 4.6 km) reveals the periodic structure of thesurface signature of the boundary-layer rolls. Thishorizontal dimension is directly related to the ver-tical depth of the boundary layer. Thus, SAR oceanimages often contain information on the three-dimensional structure of the marine boundary layer.This is one of the most promising emerging appli-cations of SAR, and one that is sure to be increas-ingly exploited in the coming decade.
New YorkCity
Mean winddirection
Transformarea
800 m
100 m100 mOcean waves
(150-m wavelength)
Atmospheric signature
800 m
Atmospheric waves(4.6-km wavelength)
y
x
y
x
y
x
6.4 km
HOPKINS APL TECHNICAL DIGEST, VOLUME 20, NUMBER 4 (1999) 605

R. F. GASPAROVIC, R. K. RANEY, AND R. C. BEAL
signature of the local wind direction.19 These signaturesarise from local modulations of the surface wind byvarious atmospheric processes, which in turn alter thelocal surface roughness and hence the radar backscatterused to form the SAR image. While noted almost inpassing during the time when interest was focused onextracting wave information from SAR images, theseobservations of wind signatures were to become thegenesis of substantial research now under way to extracthigh-resolution wind information from SAR images.More on this topic later (also see the boxed insert).
ERS-1, SIR-C, and Radarsat—The Way to theFuture
Progress during the 1980s was hampered by thedearth of spaceborne SAR imagery. Despite the ac-knowledged success of the Seasat SAR, no nationalcommitment for a follow-on satellite capability wasforthcoming in the United States. Space agencies inother nations were not so timid, and SAR satelliteswere launched by Russia (1987, 1991), Europe (1991,1995), Japan (1992), and Canada (1995). After a longdelay because of the shuttle Challenger disaster, NASAlaunched the third SIR experiment (SIR-C) in April1994, with a follow-up flight in October 1994. SIR-Cprovided APL investigators with an opportunity todemonstrate real-time, onboard processing of SAR datato produce ocean wave spectra using a specialized pro-cessor built at the Laboratory.20 These processed spectrawere downlinked to APL scientists at the ground sta-tion in Houston and compared with real-time waveforecasts from the Navy’s Fleet Numerical Oceano-graphic Center in Monterey to demonstrate the oper-ational utility of such data.21 The European SpaceAgency implemented a similar approach using groundprocessing of SAR imagery after the launch of theirEuropean Remote Sensing satellite (ERS-1) in 1991and plans to continue the use of SAR imagery foroperational wave forecasting with the launch of theEnvisat satellite in 2000.
When SAR imagery from ERS-1, ERS-2 (1995), andthe Canadian Radarsat satellites became available, APLinvestigators turned their attention to larger-scale fea-tures associated with atmospheric phenomena.22 Thereis now compelling evidence that wide-swath (300- to500-km) SAR images, when properly calibrated andinterpreted in the context of supplementary sensor fieldsand model estimates, can yield unique information onthe marine atmospheric boundary layer. The first-orderscientific product is a very high resolution (order of300 m) surface wind field23; second-order productsinclude both the height of the atmospheric boundarylayer and the horizontal and vertical structure of theatmospheric momentum fluxes. The importance ofthese uniquely SAR-associated geophysical quantities
606 JOH
is difficult to overestimate. Conventional 10- to 25-km-resolution scatterometer or radiometer estimates willalways be seriously limited in coastal regions and willalways underestimate the local variability.
Figure 3 shows an example of this application ofwide-swath SAR, generated from a Radarsat acquisi-tion over the Gulf of Maine on 22 November 1997.Here the radar backscatter values have been convertedto wind speed using well-known scatterometer relation-ships, with wind direction taken from both a numericalmodel (white-bordered arrows) and a coastal buoynetwork (black-bordered arrows). The resulting windfield shows variability resulting both from coastal shel-tering and from the atmospheric instability present atthe overpass time.
A collaborative effort with NOAA scientists is nowunder way to develop techniques for extracting high-resolution surface wind vector information from SARimages off the East Coast of the United States. Nextyear a larger effort will begin in the Gulf of Alaska asa prototype operational demonstration of the utility ofSAR imagery for coastal wind forecasts.
INTERNAL WAVES AND CURRENTSOcean currents manifest themselves in SAR images
because of wave–current interactions, which modifythe small-scale wave structure responsible for radarbackscatter. The signatures are most prominent wherethere are large current gradients. One of the major
Figure 3. Radarsat wide-swath SAR image processed toshow the surface wind variations over the Gulf of Maine on 22November 1997.
100 km
Wind speed (m/s)
BostonHarbor
PPenobscotenobscotBaBayy
NS HOPKINS APL TECHNICAL DIGEST, VOLUME 20, NUMBER 4 (1999)

themes of ocean remote sensing research at APL hasbeen to understand the details of how surface expres-sions of oceanic currents arise in radar images. Thisrequires investigation of a lengthy chain of processes,beginning with the hydrodynamics of wave–currentinteractions, to the physics of radar backscattering fromthe sea surface, the impact of ambient winds and waveson the visibility of current features, and ending with thesignature dependence on radar parameters and imaginggeometry.
Packets of coastal internal waves are convenientsources of surface currents for these types of studies.Solar heating warms the upper ocean during the latespring, producing a 10- to 15-m-deep layer of warmwater above colder water extending to the seafloor overcontinental shelf regions. Semidiurnal tidal flows overthe shelf break excite groups of large-amplitude, non-linear internal waves (known as solitons) at the inter-face of the warm and cold waters, analogous to thegeneration of ocean waves by wind forcing at the air–sea interface. These groups of internal wave solitonspropagate toward the shore at speeds of about 0.5m/s, generating regions of converging and divergingflows at the surface that appear as bright and darkfeatures in radar images. Figure 4 shows a SAR imageof coastal internal waves in the New York Bight record-ed by the ERS-1 satellite during a joint U.S./Russiaexperiment in 1992.24
Tidal forcing is not the only way to generate inter-nal waves. In many coastal inlets where there is sub-stantial runoff from rivers or melting snow, a freshwa-ter layer of a few meters in depth forms over moresaline, denser water. The disturbance from a movingship can generate a V-shaped pattern of internal wavesat the interface of the two fluids, similar to the wayin which ship hulls generate the well-known Kelvinwave pattern on the surface. An example of a ship-generated pattern of internal waves observed with anairborne SAR in Loch Linnhe, Scotland, can be seenin Fig. 5.25
Laboratory scientists have studied both types ofinternal waves in an extensive series of radar imagingexperiments conducted since 1983with oceanographers and remotesensing experts from several coun-tries. Table 1 lists these experi-ments. Theories and models forradar imaging of internal waveshave been developed to interpretthe results from these experi-ments,26,27 and some recent workhas shown that information can beextracted from radar images ofcoastal internal waves to estimatethe depth of the pycnocline andthe density of the surface layer.28
Figure 5. Radar imaScotland, in 1989. Nhorizontal to exhibit tis caused by the refl
JOHNS HOPKINS APL TECHNICAL DIGEST, VOLUME 20, NUMBER 4 (1
OCEAN REMOTE SENSING RESEARCH AND APPLICATIONS AT APL
Larger-scale ocean currents can also be measured byimaging radars using a technique known as along-trackinterferometry. Here the SAR system uses two closelyspaced antennas to receive the radiation backscatteredfrom the sea surface, and the phase difference of the twosignals is used to derive the component of the surfacecurrent along the radar line of sight. A theory for thistechnique was first developed by APL investigators toexplain internal wave observations during one of theLoch Linnhe experiments29 and was subsequently val-idated against in situ current measurements (Fig. 6)during the ONR High Res Experiment in 1993 off thecoast of Cape Hatteras.30 Thus, high-resolution surfacecurrent information, along with high-resolution surfacewind data mentioned previously, can now be obtainedremotely using novel SAR image analysis techniquespioneered by APL remote sensing scientists.
Figure 4. ERS-1 SAR image showing internal wave signaturesin a 100 � 100 km region of the New York Bight. (© EuropeanSpace Agency, 1992.)
ge of a ship-generated internal wave pattern recorded in Loch Linnhe,ote that the vertical scale has been expanded to twice that of the
he details in the wave pattern. The bright return at the left of the imageection from the ship.
999) 607

R. F. GASPAROVIC, R. K. RANEY, AND R. C. BEAL
608
Table 1. Internal wave imaging experiments.
Date Location Participants Internal wave source
1983 Georgia Strait, Canada U.S./Canada Tidal flows1984 New York Bight U.S./Canada Coastal solitons1987, 1989 Loch Linnhe, Scotland U.S./U.K. Ship-generated waves1988, 1995 Sognefjord, Norway U.S./Norway Ship-generated waves1992 New York Bight U.S./Russia Coastal solitons
Figure 6. Interferometric SAR image (top) from which surface current vectors (yellowarrows, bottom) were derived.
75.22 75.20 75.18 75.16
West longitude (deg)
35.48
35.46
35.44
35.48
35.46
35.44
1.0 m/s 1.0 km
Nor
th la
titud
e (d
eg)
JOHNS HOPKINS APL TECHN
FUTURE DIRECTIONSThe science and technology of
ocean remote sensing have nowmatured to the stage where seriousefforts are being undertaken to as-semble integrated ocean informa-tion systems to address a range ofenvironmental issues from climatechange to management of marineresources. These systems will com-bine in situ and remote observa-tions with sophisticated numericalmodels to monitor and forecastocean conditions, providing prod-ucts to a diverse user community ofscientists, resource managers, disas-ter management teams, and otherdecision makers in the same fash-ion that meteorologists now usedata and computer models forweather and climate predictions.
Information systems focused oncoastal regions are of particular in-terest to the Laboratory’s programin remote sensing. These fragileocean boundary areas are very sus-ceptible to long-term degradationfrom human activities and ship-ping accidents, and they sustainperiodic damage from winds andflooding during major storms andhurricanes. They also encompassthe biologically productive watersthat are home to much of theworld’s fishing industry, mandatinga critical need for information topromote sound management ofmarine resources to maintainstocks and avoid irreversible de-pletion of fisheries.
ICAL DIGEST, VOLUME 20, NUMBER 4 (1999)

OCEAN REMOTE SENSING RESEARCH AND APPLICATIONS AT APL
Providing creative solutions to these types of impor-tant system-level problems is a difficult challenge, onethat merits our best efforts in APL’s long tradition ofsuch endeavors. A key ingredient in this process willbe the scientific approach taken by APL remote sensingspecialists, one that blends theory and modeling within situ ocean observations to understand the physicalbasis for phenomena observed in remote sensor data,followed by real-world testing and validation, leadingin some cases to the development of new observation-al methods to advance the state of the art.
REFERENCES1Stanley, H. R., “The Geos 3 Project,” J. Geophys. Res. 84, 3779–3783 (1979).2Chelton, D. B., Walsh, E. J., and MacArthur, J. L., “Pulse Compression andSea Level Tracking in Satellite Altimetry,” J. Atmos. Oceanic Technol. 6,407–438 (1989).
3Raney, R. K., “Radar Altimetry,” in Wiley Encyclopedia of Electrical andElectronics Engineering, J. G. Webster (ed.), Vol. 17, John Wiley and Sons,New York, pp. 547–560 (1999).
4Smith, W. H. F., and Sandwell, D. T., “Global Sea Floor Topography fromSatellite Altimetry and Ship Depth Soundings,” Science 277, 1956–1961(1997).
5Miller, L., Cheney, R. E., and Douglas, B. C., “Geosat Altimeter Observationsof Kelvin Waves and the 1986-87 El Niño,” Science 239, 52–54 (1988).
6Dobson, E., Monaldo, F. M., Goldhirsh, J., and Wilkerson, J., “Validation ofGeosat Altimeter-Derived Wind Speeds and Significant Wave Heights UsingBuoy Data,” J. Geophys. Res. 92, 10,719–10,731 (1987).
7Monaldo, F. M., “Expected Differences Between Buoy and Radar Estimates ofWind Speed and Significant Wave Height and Their Implications on Buoy-Altimeter Comparisons,” J. Geophys. Res. 93, 2285–2301 (1988).
8Glenn, S. M., Porter, D. L., and Robinson, A. R., “A Synthetic GeoidValidation of Geosat Mesoscale Dynamic Topography in the Gulf StreamRegion,” J. Geophys. Res. 96, 7145–7166 (1991).
9Porter, D. L., Glenn, S. M., Dobson, E. B., and Crowley, M. F., “Extensionand Validation of a Gulf Stream Geosat Synthetic Geoid,” J. Atmos. OceanicTechnol. 13, 514–531 (1996).
10Fu, L.-L., Christensen, E. J., and Yamarone, C. A., Jr., “TOPEX/PoseidonMission Overview,” J. Geophys. Res. 99, 24,369–24,381 (1994).
11Raney, R. K., “The Delay/Doppler Radar Altimeter,” Trans. IEEE Geosci.Remote Sens. 36, 1578–1588 (1998).
12Raney, R. K., “Radar Fundamentals: Technical Perspective,” Chap. 2, inPrinciples and Applications of Imaging Radar, Manual of Remote Sensing, 3rd Ed.,
JOHNS HOPKINS APL TECHNICAL DIGEST, VOLUME 20, NUMBER 4 (
F. Henderson and A. Lewis (eds.), John Wiley and Sons, New York, pp. 9–130 (1998).
13Jensen, J. R., “Angle Measurement with a Phase Monopulse Radar Altim-eter,” IEEE Trans. Antennas Propag. 47, 715–724 (1999).
14Beal, R. C., DeLeonibus, P. S., and Katz, I. (eds.), Spaceborne SyntheticAperture Radar for Oceanography, The Johns Hopkins University Press,Baltimore, MD (1981).
15Beal, R. C., Gerling, T. W., Irvine, D. E., Monaldo, F. M., and Tilley, D. G.,“Spatial Variations of Ocean Wave Directional Spectra from the SeasatSynthetic Aperture Radar,” J. Geophys. Res. 91, 2433–2449 (1986).
16Beal, R. C. (guest editor), “Proceedings of the Symposium Measuring OceanWaves from Space,” Johns Hopkins APL Tech. Dig. 8(1) (1987).
17Beal, R. C., “Guest Editor’s Introduction,” Johns Hopkins APL Tech. Dig. 11,363–364 (1990).
18Beal, R. C. (ed.), Directional Ocean Wave Spectra, The Johns HopkinsUniversity Press, Baltimore, MD (1991).
19Gerling, T. W., “Structure of the Surface Wind Field from the Seasat SAR,”J. Geophys. Res. 91, 2308–2320 (1986).
20Beal, R. C., Oden, S. F., and MacArthur, J. L., “A Real-Time On-Board SARProcessor for Global Ocean Wave Spectra from Low Altitude Platforms,” inProc. Int. Geoscience and Remote Sensing Symp., pp. 443–446 (1991).
21Monaldo, F. M., and Beal, R. C., “Comparison of SIR-C SAR WavenumberSpectra with WAM Model Predictions,” J. Geophys. Res. 103, 18,815–18,825(1998).
22Sikora, T. D., Young, G. S., Beal, R. C., and Edson, J. B., “Use of SpaceborneSynthetic Aperture Radar Imagery of the Sea Surface in Detecting thePresence and Structure of the Convective Marine Atmospheric BoundaryLayer,” Mon. Wea. Rev. 123, 3623–3632 (1995).
23Thompson, D. R., and Beal, R. C., “Mapping Mesoscale and SubmesoscaleWind Fields Using Synthetic Aperture Radar,” in Proc. Int. Geoscience andRemote Sensing Symp., pp. 1382–1384 (1998).
24Gasparovic, R. F., and Etkin, V. S., “An Overview of the Joint US/RussiaInternal Wave Remote Sensing Experiment,” in Proc. Int. Geoscience andRemote Sensing Symp., pp. 741–743 (1994).
25Hogan, G. G., Chapman, R. D., Watson, G., and Thompson, D. R.,“Observations of Ship-Generated Internal Waves in SAR Images from LochLinnhe, Scotland, and Comparisons with Theory and In Situ Internal WaveMeasurements,” IEEE Trans. Geosci. Remote Sens. 34, 532–542 (1996).
26Thompson, D. R., Gotwols, B. L., and Sterner, R. E. II, “A Comparison ofMeasured Surface-Wave Spectral Modulations with Predictions from a Wave-Current Interaction Model,” J. Geophys. Res. 93, 12,339–12,343 (1988).
27Thompson, D. R., “Calculation of Radar Backscatter Modulations fromInternal Waves,” J. Geophys. Res. 93, 12,371–12,380 (1988).
28Porter, D. L., and Thompson, D. R., “Continental Shelf Parameters Inferredfrom SAR Internal Wave Observations,” J. Atmos. Oceanic Technol. 16, 475–487 (1999).
29Thompson, D. R., and Jensen, J. R., “Synthetic Aperture Radar Interferom-etry Applied to Ship-Generated Internal Waves in the 1989 Loch LinnheExperiment,” J. Geophys. Res. 98, 10,259–10,269 (1993).
30Graber, H. C., Thompson, D. R., and Carande, R. E., “Ocean Surface Featuresand Currents Measured with Synthetic Aperture Radar Interferometry and HFRadar,” J. Geophys. Res. 101, 25,813–25,832 (1996).
THE AUTHORS
RICHARD F. GASPAROVIC is Supervisor of the Ocean Remote SensingGroup in the APL Space Department. He received his Ph.D. in physics fromRutgers University in 1969 and joined APL in 1971. He has served as projectmanager for a large number of remote sensing efforts involving radar imaging ofinternal wave effects, radar signatures of ship wakes, infrared sea surfacetemperature measurements, and applications of remote sensing technology tovarious Navy problems. Dr. Gasparovic has been a member of several govern-ment review panels and working groups and lectures on satellite oceanography inthe JHU Part-Time Programs in Engineering and Applied Science. His e-mailaddress is [email protected].
1999) 609

R. F. GASPAROVIC, R. K. RANEY, AND R. C. BEAL
R. KEITH RANEY (A.B., 1960, Harvard University; M.S.E.E., 1962, PurdueUniversity; Ph.D., 1968, University of Michigan) was the Chief Scientist at theCanada Centre for Remote Sensing before joining APL in 1994. He is a memberof the Principal Professional Staff, Assistant Supervisor of the Ocean RemoteSensing Group, and an internationally recognized specialist in synthetic apertureradar systems. His recent interests include advanced radar altimeters and theradar sounder for the Europa Orbiter. He is a Fellow of the ElectromagneticsAcademy and of the IEEE, a former president of the IEEE Geoscience andRemote Sensing Society, the author of over 300 professional articles, and therecipient of several awards, including the 1999 Gold Medal of the CanadianRemote Sensing Society. His e-mail address is [email protected].
ROBERT C. BEAL is a research physicist in the Space Department’s OceanRemote Sensing Group. He holds a B.S.E.E. from MIT (1961) and an M.S. inphysics and astronomy from the University of Maryland (1968). In 1980 he wasa Parsons Fellow at The Johns Hopkins University. Over the past 20 years, Mr.Beal has been a principal investigator for many SAR research programs, includingthe U.S. Seasat, the European ERS-1, and most recently, the Canadian Radarsat.In the 1980s, he led the APL effort to develop a real-time SAR spectral processorthat flew with the NASA Shuttle Imaging Radar. His present interest con-tinues to be the application of spaceborne SAR to oceanography, especiallyoperational coastal wind monitoring and forecasting. His e-mail address [email protected].
610 JOHNS HOPKINS APL TECHNICAL DIGEST, VOLUME 20, NUMBER 4 (1999)