ocean drilling program scientific results volume 117
TRANSCRIPT
Prell, W. L., Niitsuma, N., et al., 1991Proceedings of the Ocean Drilling Program, Scientific Results, Vol. 117
9. MINERALOGIC VARIATIONS IN A PLEISTOCENE HIGH-RESOLUTION EOLIAN RECORDFROM THE OWEN RIDGE, WESTERN ARABIAN SEA (SITE 722): IMPLICATIONS FOR
SEDIMENT SOURCE CONDITIONS AND MONSOON HISTORY1
L. A. Krissek2 and S. C. Clemens3
ABSTRACT
Bulk mineralogy of the terrigenous fraction of 99 samples from ODP Site 722 on the Owen Ridge, western ArabianSea, has been determined by x-ray diffraction, using an internal standard method. The sampling interval, approxi-mately 4.3 k.y., provides a detailed mineralogic record for the past 500 k.y. Previous studies have identified importantmodern continental sediment sources and the mineral assemblages presently derived from each. These studies have alsodemonstrated that most of this material is supplied by southwest and northwest winds during the summer monsoon. Avariety of marine and terrestrial records and general circulation model (GCM) simulations have indicated the impor-tance of monsoonal circulation during the Pleistocene and Holocene and have demonstrated increased aridity duringglacial times and increased humidity during inter glacials. The mineralogic data generated here were used to investigatevariations in source area weathering conditions during these environmental changes.
Terrigenous minerals present include smectite, illite, palygorskite, kaolinite, chlorite, quartz, plagioclase feldspar,and dolomite. This mineralogy is consistent with the compositions of source areas presently supplying sediment to theArabian Sea. An R-mode factor analysis has identified four mineral assemblages present throughout the past 500 k.y.:quartz/chlorite/dolomite (Factor 1), kaolinite/plagioclase/illite (Factor 2), smectite (Factor 3), and palygorskite/dolo-mite (Factor 4). Chlorite, illite, and palygorskite are extremely susceptible to chemical weathering, and a spectral com-parison of these factors with the eolian mass accumulation rate (MAR) record from Hole 722B (an index of dust sourcearea aridity) indicates that Factors 1, 2, and 4 are directly related to changes in aridity. Because of these characteristics,Factors 1,2, and 4 are interpreted to originate from arid source regions. Factor 3 is interpreted to record more humidsource conditions.
Time-series of scores for the four factors are dominated by short-term (10-100 k.y.) variability, and do not correlatewell to glacial/interglacial fluctuations in the time domain. These characteristics suggest that local climatic shifts werecomplex, and that equilibrium weathering assemblages did not develop immediately after climatic change. Spectralanalysis of factor scores identifies peaks at or near the primary Milankovitch frequencies for all factors. Factor 1(quartz/chlorite/dolomite), Factor 2 (kaolinite/plagioclase/illite), and Factor 4 (illite/palygorskite) are coherent and inphase with the MAR record over the 23, 41, and 100 k.y. bands, respectively. The reasons for coherency at single Mi-lankovitch frequencies are not known, but may include differences in the susceptibilities of minerals to varying timescales of weathering and/or preferential development of suitable continental source environments by climatic changesat the various Milankovitch frequencies.
INTRODUCTION
One of the major objectives of drilling in the Arabian Seaduring ODP Leg 117 was to recover and investigate the high-res-olution pelagic sediment sections deposited on the Owen Ridgeunder the influence of the Indian Ocean monsoon. The summermonsoon in the Arabian Sea is driven by the combination oftwo effects: differential heating of southern Asia relative to theIndian Ocean, and direct latent heating of the troposphere oversouthern Asia resulting from the condensation of water vaporevaporated from the Indian Ocean (Webster, 1987). The passageof strong monsoonal winds over arid continental regions pres-ently supplies significant terrigenous material from several sourceareas to the northwest Arabian Sea (Sirocko and Sarnthein, 1989;Nair et al., 1989; Savoie et al., 1987; Chester et al., 1985). Theseeolian contributions carry mineralogically distinct signatures thatare observable in surface and subsurface sediments of the Ara-bian Sea (Sirocko and Sarnthein, 1989; Debrabant et al., thisvolume; Kolla et al., 1976, 1981).
1 Prell, W. L., Niitsuma, N., et al., 1991. Proc. ODP, Sci. Results, 117: Col-lege Station, TX (Ocean Drilling Program).
2 Department of Geology and Mineralogy, Ohio State University, Columbus,OH 43210-1398, U.S.A.
3 Department of Geological Sciences, Brown University, Providence, RI 02912-1846, U.S.A.
Clemens and Prell (this volume; 1990) have demonstrated theeolian origin of the terrigenous fraction of Owen Ridge sedi-ments, and have used the grain size and the mass accumulationrate (MAR) of the terrigenous fraction to monitor southwest(summer) monsoon strength and dust source area aridity overthe past 1 m.y. They conclude that variations in the strength ofeither or both of the two monsoon-forcing mechanisms may bepartially responsible for variations in monsoon wind strengthover this time interval. Debrabant et al. (this volume) used min-eralogic data to demonstrate that eolian material has dominatedterrigenous input to the Owen Ridge since its uplift in the mid-dle Miocene. However, the wider sampling interval of the latterstudy precluded a detailed investigation of Quaternary sourceareas and changes in their importance over the interval investi-gated by Clemens and Prell (this volume).
As a result, the objectives of this study are as follows: to de-velop a detailed mineralogic record of the eolian component ofOwen Ridge sediments for the past 500 k.y.; to identify weather-ing/climatic conditions in continental dust source areas fromtheir mineralogical signatures; and to evaluate the significanceof temporal variations in the importance of each assemblage. Toour knowledge, this is the first detailed mineralogic study of ahigh-resolution eolian record. The mineralogic data constrainpaleoclimatic interpretations of the eolian component by identi-fying conditions within the sediment source areas and clarifyingtemporal relationships between variations in source area condi-tions and global paleoclimate.
197

L. A. KRISSEK, S. C. CLEMENS
Background and Previous Work
General relationships between the lithology and the weather-ing regime of a continental source area and the composition ofthe clay mineral assemblage derived from that source area wereestablished on a global scale by Griffin et al. (1968) and Lisitzin(1972). Numerous other studies have confirmed such relation-ships on basinwide, regional, and local scales. These relation-ships were used by Kolla et al. (1976) and Kolla et al. (1981) tointerpret clay mineral abundance data from surface sedimentsof the western Indian Ocean and the Arabian Sea. On the basisof modern geographic patterns of clay mineral abundances, theyconcluded that:
1. Smectites are predominantly derived from the DeccanTraps of India at the present time, enter the Arabian Sea via flu-vial discharge, and are transported to the south by surface cur-rents;
2. Illites and chlorites are presently derived from the Hima-layan complex, from the arid regions of Iran-Makran, and fromalluvial sediments adjacent to the latter region. Sediments de-rived from the Himalayas are transported to the Arabian Sea bythe Indus River, and are generally confined to the Indus Fan;additional material rich in illite and chlorite may be carriedfrom the Thar Desert of India by northeast winds, but couldnot be distinguished from the Indus signal by Kolla et al. (1981).Sediments derived from the soils of Iran-Makran are transportedto the Arabian Sea by northerly and/or northwesterly winds;
3. Palygorskite (a fibrous clay) is presently derived from soilsof the Arabian Peninsula and Somalia, and is supplied to theArabian Sea by westerly and southwesterly winds;
4. Kaolinite is presently derived from tropical soils of Af-rica, Madagascar, and southern India, but is of minor impor-tance in the northern Arabian Sea.
More recent studies have examined the timing and dynamicsof eolian input to the Arabian Sea by analyzing aerosols (Ches-ter et al., 1985), determining seasonal variations in sedimentcomponent fluxes (Nair et al., 1989), and comparing a year-long record of dust trajectories from satellite images to spatialpatterns of sediment accumulation rates over the past 8 k.y.(Sirocko and Sarnthein, 1989). Aerosols sampled over the north-ern Arabian Sea during the northeast monsoon were composi-tionally similar to the underlying sediments (relatively rich inchlorite), and similar to material derived from the Iran-Makranregion (Chester et al., 1985).
Sediment trap data from the western Arabian Sea demon-strate that 80% of the terrigenous flux occurs during the time ofthe southwest monsoon (Nair et al., 1989), and originates fromeolian transport. Terrigenous fluxes are also enhanced in thecentral and eastern Arabian Sea during the time of the south-west monsoon, but result from increased discharge of the IndusRiver. Accumulation rates of various terrigenous componentsover the past 8 k.y. outline a major source in Oman, which sup-plies chlorite, dolomite, and detrital carbonate via summer north-westerly winds, and a major source in central Arabia, whichsupplies palygorskite and smectite via a southwestern branch ofthe summer Arabian northwesterlies (Sirocko and Sarnthein,1989). Fluxes of these eolian materials compare well with an es-timate of transcoastal dust flux derived from satellite images for1979. Sirocko and Sarnthein (1989) argue that most of this eo-lian material is not transported by the southwest monsoon, andtherefore cannot be used as a marker of monsoon intensity; Cle-mens and Prell (1990), however, recognize that the summer north-west and southwest wind strengths are coupled by their mutualdependence on the low pressure cell over India, so that eolian
sedimentation by either wind system responds to the same large-scale climatic boundary conditions.
Climatic fluctuations in these source regions over time scalesof thousands of years or more may have affected the mineralogyof sediments derived from each. Street and Grove (1979), vanCampo et al. (1982), Prell and van Campo (1986), and vanCampo (1986) have documented increased humidity during in-terglacials and increased aridity during glacials in this area dur-ing the Pleistocene. These interpretations agree with the resultsof paleoclimatic modeling (Kutzbach, 1981; Kutzbach and Otto-Bliesner, 1982; COHMAP Members, 1988).
The results of van Campo et al. (1982) and Prell and vanCampo (1986) are especially important to this study, van Campoet al. (1982) concluded that saline littoral, arid, and steppe in-land conditions expanded during the last glacial, accompaniedby stronger winter northeast trade winds. Savanna-type vegeta-tion dominated during the humid inter glacials, with transportdominated by the summer southwest monsoon. Prell and vanCampo (1986) demonstrated the association of strong southwestmonsoons and increased precipitation with interglacials, whereasglacial periods were marked by weaker monsoons, perhaps fol-lowing different trajectories, and more arid conditions.
MATERIALS AND METHODSSamples for this study were collected from Hole 722B, which
is located on the Owen Ridge at 16°37'N, 59°48'E, at a waterdepth of 2027 m (Fig. 1). Samples were taken from the upper40 m of Hole 722B; data from the upper 21 m are presentedhere. These sediments are contained within lithologic Unit I(Shipboard Scientific Party, 1989), which is composed of alter-nating light and dark beds of foraminifer-bearing nannofossilooze, nannofossil ooze/chalk, and marly nannofossil ooze/chalk. Sampling interval for this study was 20 cm, which isequivalent to a 4.3 k.y. sampling interval at an average sedimen-tation rate of 4.5 cm/k.y. (Clemens and Prell, this volume).
Samples used in this study are splits of the samples used byClemens and Prell (this volume). Samples for this study weretreated with 30% hydrogen peroxide, buffered with ammoniumhydroxide, to remove organic matter, and with glacial aceticacid to remove biogenic carbonate. The remainder of the sam-ple preparation followed the general procedures outlined by Kris-sek (1982, 1989). Residues were freeze-dried, and approximately100 mg of dried bulk residue were weighed and mixed with 10%by weight boehmite (A1OOH), which serves as an internal stan-dard. The mixtures were back-loaded as powders into randommounts for XRD analysis.
All slides were solvated with warm ethylene-glycol vapor for8-12 hr immediately preceding analysis on a Philips diffractom-eter. Slides were step-scanned at 0.02° 20/step and 3 s/step withNi-filtered CuK-alpha radiation. Data were plotted by printer.The 15-18 Å smectite (001), 10.4-10.8 Å palygorskite (110),10 Å illite (001), 6.11 Å boehmite (020), 4.26 Å quartz (100),4.02 Å plagioclase (201), 3.57 Å kaolinite (002), 3.54 Å chlorite(004), and 2.89 Å dolomite (104) peak areas were measured witha polar planimeter.
Under conditions of uniform grain size and uniform mineralchemical/structural composition, calibration curves can be con-structed to calculate mineral abundances from mineral/boeh-mite peak area ratios (Gibbs, 1967; Scheidegger and Krissek,1982; Krissek, 1982). Because bulk samples from Site 722 wereanalyzed, grain sizes within the pressed powders were not uni-form and orientation effects may have been important. Theseconditions violate criteria needed to accurately apply calibrationcurves, so the mineral/boehmite peak area ratios measured inthis study have not been converted to mineral abundances. As aresult, variations in the abundance of a single mineral (e.g.,
198

IMPLICATIONS OF MINERALOGIC VARIATION FOR MONSOON HISTORY
30°N
India
Lj Oman Margin sites
I M Indus Fan site
\Owen Ridge sites
\ A
40°E 60° 70° 80°
19CN
Arabia
720
56CE 59° 60°
Figure 1. Location map of ODP Leg 117 sites in the Arabian Sea, including Site 722 on the OwenRidge (from Prell, Niitsuma, et al., 1989).
quartz) can be described using downcore changes in the peakarea ratio of that mineral. Absolute abundances of two or moreminerals cannot be compared, however.
Analytical precision was evaluated by analyzing replicate slidesof six samples, and is estimated as follows (given as absolutemineral/boehmite peak area ratios): ± 0.07 for smectite, ±0.09 for palygorskite, ± 0.08 for illite, ± 0.22 for quartz, ±0.15 for plagioclase, ± 0.07 for kaolinite, ± 0 . 1 3 for chlorite,and ± 0.21 for dolomite. Scheidegger and Krissek (1982) andKrissek (1982) have demonstrated that absolute abundances, de-termined from mineral/boehmite peak area ratios using calibra-tion curves, are accurate at ± 5% for smectite, ± 2 % for chlo-
rite and illite, and ± 1 % for quartz and plagioclase feldspar.Absolute abundances inferred from the peak area ratios mea-sured in this study would have lower accuracies than those citedby Scheidegger and Krissek (1982) and Krissek (1982), becauseof the grain size variations described earlier.
The peak area ratio data were examined for variable-to-varia-ble relationships by R-mode factor analysis, using the FACTORANALYSIS procedure of the StatView 512+ software package(Brainpower, Inc., 1986). The final factor analysis results wereobtained by an ORTHOTRAN (oblique) refinement of a VARI-MAX solution; all factor intercorrelations following the OR-THOTRAN refinement were less than 0.45. The terminology
199

L. A. KRISSEK, S. C. CLEMENS
employed here is that of StatView 512+ (Brainpower, Inc., 1986)and Davis (1986), which labels the coefficients that indicate theimportance of each variable on a factor as "loadings," and thecoefficients of factor importance to each sample as "scores."
Ages for these samples were obtained from the age modelconstructed for 0-780 ka at Site 722 by Clemens and Prell (thisvolume), based on correlation of the oxygen isotope record fromHole 722B to the SPECMAP stacked oxygen isotope record(Imbrie et al., 1984). Temporal and frequency relationships be-tween the importance of each mineral assemblage (factor) andindicators of monsoon strength, source area aridity, and global
paleoclimate (Clemens and Prell, this volume) were evaluatedusing cross spectral analysis. Records were interpolated at 2 k.y.intervals for the cross-spectral analysis, and all analyses wereconducted using standard techniques (Imbrie et al., 1989; Jen-kins and Watts, 1968).
DATA
Mineral/boehmite peak area ratios are plotted as a functionof age in Figure 2, and are tabulated in the Appendix. Each rec-ord exhibits significant variability (greater than the analyticaluncertainty) over the interval studied, but none of the records
5 "I
o- I — '
rot _
N-i—>
L_roσ
CN
O+ i
4
3
2
50 100 150 200 250 300 350 400 450 500
50 100 150 200 250 300 350 400 450 500
50 100 150 200 250 300 350 400 450 500
50 100 150 200 250 300 350 400 450 500
Figure 2. Mineral abundance data (mineral/boehmite peak area ratios) at ODP Site 722, plotted as a function ofage. All records are dominated by short-term (10-100 k.y.) variability.
200

ro oo<- oΦ ö
o
CD
Z oT, O
+i
IMPLICATIONS OF MINERALOGIC VARIATION FOR MONSOON HISTORY
2 "I
5 0 100 150
2 -i
200 250 300kyrs B.P.
350 400 450 500
50 100
(~)
(V)<-CD
ini
o
V
o
±0
1.2 "
i.o --
0.8 --
0.6 -
0.4-
0.2 -
o.o -
150 200 250 300
kyrs B.P.350 400 450 500
3 "I
2 -
I -
200 250 300kyrs B.P.
350 400 450 500
50 100 150 200 250 300
kyrs B.P.350 400 450 500
Figure 2 (continued).
exhibits a consistent long-term increase or decrease over thistime. It is interesting to note, however, that several records doexhibit shorter-term variations of consistent length; these aremost obvious as cycles of approximately 100 k.y. duration in thepalygorskite/boehmite and dolomite/boehmite ratios.
DISCUSSION
Paleoclimatic Significance of Mineral Assemblages inOwen Ridge Eolian Sediments, Time Series AnalysisThe important terrigenous minerals at Site 722 are smectite,
illite, palygorskite, kaolinite, chlorite, quartz, plagioclase feld-spar, and dolomite, all of which have been identified as impor-
tant constituents in studies of Holocene and modern ArabianSea sediments and aerosols (Sirocko and Sarnthein, 1989; De-brabant et al , this volume; Chester et al., 1985; Kolla et al.,1976, 1981). Previous studies have used geographic patterns ofmineral abundances or fluxes to infer modern source areas foreach, as summarized in the "Introduction." Because these stud-ies generally examined surface or near-surface sediments, how-ever, temporal changes in the mineral assemblages derived fromthese sources could not be considered. The Site 722 samplesspan the past 500 k.y., providing an excellent opportunity toevaluate temporal changes in mineral associations and to iden-tify the longer-term variability in sediment supply to the Ara-bian Sea.
201
L. A. KRISSEK, S. C. CLEMENS
Mineral associations have been identified by performing anR-mode factor analysis, with an ORTHOTRAN refinement of aVARIMAX solution (Brainpower, Inc., 1986). This applicationassumes that all relevant matrix variance has been included whenthe sum of the proportionate contributions of the eigenvaluesexceeds 0.75; for the Site 722 data, four factors are required toexceed that value. The contributions of the four factors to ex-plaining the original variance, and their proportionate variancecontributions following the ORTHOTRAN/VARIMAX solutionare listed in Table 1. Loadings for each variable on each of thefour factors are listed in Table 2.
Temporal variations in the importance of these four factorscan be interpreted to emphasize either of two effects: (1) varia-tions in the importance of input from specific source areas causedby changes in transport paths (e.g., monsoon position), assum-ing that the mineralogy of materials derived from those sourcesremained constant through glacial/interglacial climatic fluctua-tions; or (2) climatically controlled changes in the mineralogy ofsediments derived from less precisely located source areas dur-ing glacial/interglacial fluctuations, assuming that summer mon-soon winds dominated eolian input over that time. The latterapproach is chosen here for three reasons: (1) continental cli-mates are known to have changed significantly during glacial/interglacial fluctuations (Street and Grove, 1979; van Campo etal., 1982; Prell and van Campo, 1986), suggesting that weather-ing conditions and the mineral assemblages produced shouldalso have changed; (2) the importance of monsoonal circulationthroughout the past 1 m.y. has been recognized in marine faunalindicators of monsoon-induced upwelling (Prell and Curry, 1981;Prell, 1984) and eolian grain-size and MAR records on the OwenRidge (Clemens and Prell, this volume, 1990); and (3) potentialsource areas for the important minerals and mineral assemblagesare relatively extensive, so that the variations in wind trajecto-ries and dust transport paths expected during glacial/intergla-cial cycles would not have changed source areas enough to ex-plain the observed variations in mineralogy.
Table 1. Proportions of data variance explained by first fourfactors after initial R-mode analysis and following tbeORTHOTRAN/VARIMAX solution refinement.
Proportion (%) Factor 1 Factor 2 Factor 3 Factor 4
Of original variance 38 14 12 10Of variance after 38 25 17 20
orthotran/varimax
Table 2. Loadings of each variable on each of thefour factors extracted by R-mode factor analysisfrom the mineral/boehmite peak area ratio data.Factor 1 is dominated by quartz, chlorite, and dolo-mite, Factor 2 is dominated by illite, plagioclase, andkaolinite, Factor 3 is dominated by smectite, andFactor 4 is dominated by palygorskite and dolomite.
Variable
SmectitePalygorskiteIlliteQuartzPlagioclaseKaoliniteChloriteDolomite
Factor 1
0.09-0 .17
0.150.750.14
-0 .240.770.38
Factor Loadings
Factor 2
0.020.040.55
-0 .050.680.750.00
-0 .08
Factor 3
0.830.040.120.11
-0 .390.24
-0 .02-0 .09
Factor 4
0.000.820.070.00
-0 .02-0 .02-0 .09
0.54
In this context, the factors can be summarized and inter-preted as follows:
1. Factor 1 is dominated by high positive loadings for quartzand chlorite, and an intermediate positive loading for dolomite.The largest negative loadings are for kaolinite and palygorskite,but these values are significantly lower than the maximum posi-tive values. As a result, Factor 1 is an indicator of the associa-tion of quartz and chlorite, and to a lesser extent, dolomite. Ofthe two most important minerals, chlorite is more sensitive tothe weathering environment. Chlorite is only stable under con-ditions of very minimal chemical weathering (Dixon and Weed,1977; Velde, 1985), whereas quartz is readily produced from avariety of source lithologies under a range of weathering condi-tions. Dolomite is also more stable than chlorite (Dixon andWeed, 1977), being recycled from older sedimentary rocks andproduced by desiccation of sabkhas. The importance of chloritein Factor 1 suggests that this mineral assemblage formed in, orwas recycled from, relatively arid source regions. Detrital chlo-rite is most readily generated either as an inherited mineral fromigneous or metamorphic source lithologies, or as a weakly al-tered product of ferromagnesian minerals (Dixon and Weed,1977). Appropriate source lithologies have been common in Iran-Makran, Oman and the Arabian Peninsula, and East Africathroughout the past 500 k.y. The importance of dolomite inFactor 1 suggests that at least some of this assemblage was de-rived from Oman and the Arabian Peninsula, since dolomiticsource lithologies are best exposed there (Sirocko and Sarnthein,1989). All of these potential source areas are suitably located tosupply material to Site 722 via southwesterly or northwesterlysummer winds.
2. Factor 2 is dominated by high positive loadings for ka-olinite, plagioclase, and illite; loadings for all other minerals arevery low. Of the three important minerals, illite and plagioclaseare the most environmentally sensitive, whereas kaolinite maybe recycled from older, more intensely weathered rocks. Illiteis formed by degradation of mica or by weathering potassiumfeldspars under conditions of limited precipitation (Dixon andWeed, 1977; Blatt et al., 1980); these conditions are also favor-able for preservation of plagioclase feldspar. Kolla et al. (1981)and Sirocko and Sarnthein (1989) have identified several sourcesthat presently supply illite to the Arabian Sea: Iran-Makran, theArabian Peninsula, and Somalia. As a result, appropriate sourcerocks have been available in several areas to generate the Factor2 mineral assemblage during appropriate weathering conditionsover the last 500 k.y.
3. Factor 3 is dominated solely by smectite, although plagio-clase has a moderate negative loading. Smectite is produced bymoderate chemical weathering of a wide variety of source lithol-ogies (Velde, 1985). Under such conditions, plagioclase feldsparis relatively unstable. The major source of smectite to the mod-ern eastern Arabian Sea is the Deccan Trap basalts, but appro-priate source lithologies have also been exposed in the ArabianPeninsula and East Africa during the past 500 k.y. (Kolla et al.,1981).
4. Factor 4 is dominated by palygorskite and, to a lesser ex-tent, dolomite. Palygorskite is formed in marine settings, alka-line lakes, and calcrete/caliche profiles (Velde, 1985), and ispresent in a variety of carbonate and evaporite deposits. Paly-gorskite is highly susceptible to decomposition during chemicalweathering (Dixon and Weed, 1977; Velde, 1985). Thus, its im-portance in Factor 4 indicates an assemblage derived from anarid source region. The major sources to the modern ArabianSea are the arid regions of the Arabian Peninsula and East Af-rica (Kolla et al., 1981; Sirocko and Sarnthein, 1989), but theimportance of dolomite in Factor 4 suggests input from the Ara-
202

IMPLICATIONS OF MINERALOGIC VARIATION FOR MONSOON HISTORY
bian Peninsula, where carbonate source lithologies are common(Sirocko and Sarnthein, 1989).
In summary, the mineral assemblages of Factors 1, 2, and 4record sediment production under arid conditions and limitedchemical weathering, whereas the assemblage of Factor 3 rec-ords enhanced chemical weathering effects. The importance ofdolomite in assemblages grouped as Factors 1 and 4 suggestsa sustained production of both assemblages in Oman and the
Arabian Peninsula, whereas the areas supplying the Factor 2and 3 assemblages are less well-defined.
Temporal variations in the relative importance of the fourmineral assemblages (factors) can be estimated by examining thetime-series of factor scores for each (Fig. 3; Appendix). None ofthe time-series exhibits either significant long-term trends or ma-jor step-like variations; instead, each time-series is dominated byshorter term (scales of 10-100 k.y.) variability. This shorter-termvariability is most readily observed in the loadings on Factor 4,
6 H
4 -
2 -
0 -
-2 -
-4Chlorite, Quartz
-2 -
-4
50 100 150 200 250 300
kyrs B.P.
350 400 450 500
K a o l i n i t e , P l a q i o c l a s e , I l l i t e
50 ICC 150 200 250 300 350 400 450 500
4
2
0 -
-2 -
-4
kyrs B.P.
Smectite
o 50 1 00 150
4 "
2 "
0
"2 1
-4
200 250
kyrs B.P.300 350 400 450 500
Palyqorskite, Dolomite
o 50 1 00 150 200 250 300 350 400 450 500
kyrs B.P.
Figure 3. Scores for the four factors at Site 722 defined by R-mode factor analysis and an ORTHOTRAN/VARI-MAX solution refinement. Loadings of each variable on each factor are listed in Table 2. Factors 1, 2, and 4 areinterpreted as indicators of arid conditions, while Factor 3 is an indicator of more humid weathering. Site 722Beolian MAR and SPECMAP oxygen isotope records provided for comparison.
203

L. A. KRISSEK, S. C. CLEMENS
;ack
CO
CM
AP
-3 "
-2 "
-1 ~
o -
1 -
5 ~
<Σ:
ian
oCD
QDCNCM
4 -
3 ~
2 -
i —
50 100 150 200 250 300
Kyrs B.P.350 400 450 500
50
Figure 3 (continued).
100 150 200 250 300
Kyrs B.P.350 400 450 500
where quasi-cyclic variations over approximately 100 k.y. inter-vals are overlain by fluctuations on even shorter time scales.
Detailed interpretations of source area paleoclimates directlyfrom the factor scores are complicated by the predominance ofshort-term variability in all four time-series; the variability arisesat least in part because weathering assemblages and erosionalproducts may not respond immediately and directly to climaticchanges. Instead, the mineral assemblage deposited at a particu-lar time may combine the weathering products of both olderand contemporaneous climates. The complications imposed bysuch "lag" effects and by the nonlinear response of weatheringproducts to climate change can be illustrated by examining thefactor scores for the last glacial maximum (isotopic stage 2, cen-tered at approximately 18 ka; Imbrie et al., 1984) and the last in-terglacial (isotopic stage 5.5, centered at approximately 125 ka;Imbrie et al., 1984). These data are summarized in Table 3. Pol-len assemblages (van Campo et al., 1982; Prell and van Campo,1986) indicate that the last glacial maximum was relatively arid,but the 18 ka sample does not have strong scores for the three"arid" factors. In contrast, pollen data indicate increased hu-midity at the last interglacial, while that sample has strong scoresfor the "arid" factors 2 and 4.
The potential complications posed by the lack of equilibriumbetween extant climate and the mineral assemblages depositedare further illustrated in Table 4, where scores for each factor
Table 3. Factor scores for samples from the last gla-cial maximum (18 ka) and the last interglacial (125ka). Scores do not clearly indicate dominance byarid and humid weathering conditions, respectively.
Sample age(ka) Factor 1
Factor Scores
Factor 2 Factor 3 Factor 4
Table 4. Factor scores averaged over glacialand interglacial stages, as defined by marineoxygen isotope records (Imbrie et al., 1984).Even-numbered stages are glacials, odd-num-bered stages are interglacials. Averaged factorscores do not indicate that glacial stages weredominated by products of arid weathering en-vironments, nor were interglacials dominatedby products of humid weathering.
Stage
123456789
10111213
Factor 1
-0.16-0.60-0.26-0.57-0.61
0.09-0.08
0.210.40
-0.07-0.32
0.630.25
Average Factor Scores
Factor 2
0.74-1.15-0.22
0.250.440.130.210.84
-0.08-0.38
0.030.02
-0.80
Factor 3
-0.03-0.36-0.13-0.66-0.21-0.10-0.46-0.39
0.64-0.05
0.660.140.88
Factor 4
-0.251.33
-0.09-0.10-0.11
0.32-0.36-0.13-1.19-0.19-0.39
1.05-0.45
18 -0.60125 -0.60
-0.761.07
-0.53 0.04-0.10 0.78
have been averaged over the duration of each isotopic stagefrom 1 through 13 (after Imbrie et al., 1984). If all mineral as-semblages quickly equilibrated with contemporaneous climate,then the relatively humid interglacial stages (1, 5, 7, 9, 11, and13) should have low scores for Factors 1, 2, and 4, and high pos-itive scores for Factor 3. This condition is somewhat met duringstages 9, 11, and 13, but not during the more recent interglacials.Under conditions of rapid equilibration during glacial stages (in-creased aridity), high positive scores should occur for Factors 1,2, and 4, and a high negative score should occur for Factor 3.Several glacial stages (2, 4, 8, 12) show appropriate scores forone or two factors, but none fulfill these conditions for all fac-
204

IMPLICATIONS OF MINERALOGIC VARIATION FOR MONSOON HISTORY
tors. In addition, stage 1 (an interglacial) has a high positivescore for Factor 2, suggesting input under "arid" conditions. Ingeneral, then, these results indicate that terrigenous mineral as-semblages deposited in the western Arabian Sea during the past500 k.y. were influenced by a range of controls, so that their rec-ord of source area paleoclimate is not obvious or direct.
Paleoclimatic Significance Of Mineral Assemblages InOwen Ridge Eolian Sediments, Frequency Domain
AnalysisAs discussed previously, the comparison of factor scores to
the isotopically derived record of paleoclimate in the time do-main does not directly support our mineralogy-based interpreta-tion that Factors 1, 2, and 4 are related to source area aridityand, therefore, to glacial/interglacial cycles. An alternative ap-proach is to compare the records in the frequency domain, usingcross-spectral analysis. This approach is particularly useful whenanalyzing complicated records, because each record is brokeninto its component frequencies of variation; in the case of thefactor scores, this method of analysis is useful for separating thepaleoclimatically forced signature of weathering from variationsproduced by other mechanisms. The constituent frequencies ofvariation can then be compared between records to identify theircoherency (linear relationships), and can also clarify lead/lagrelationships that result from a variety of processes, includingthe kinetics of weathering under changing climatic regimes. Ifour hypothesis about the significance of Factors 1, 2, and 4 iscorrect, then the scores for those factors should be coherentwith (i.e., linearly related to) the terrigenous MAR record, whichhas been shown to have a strong positive correlation to glacial/interglacial cycles (Clemens and Prell, this volume, 1990).
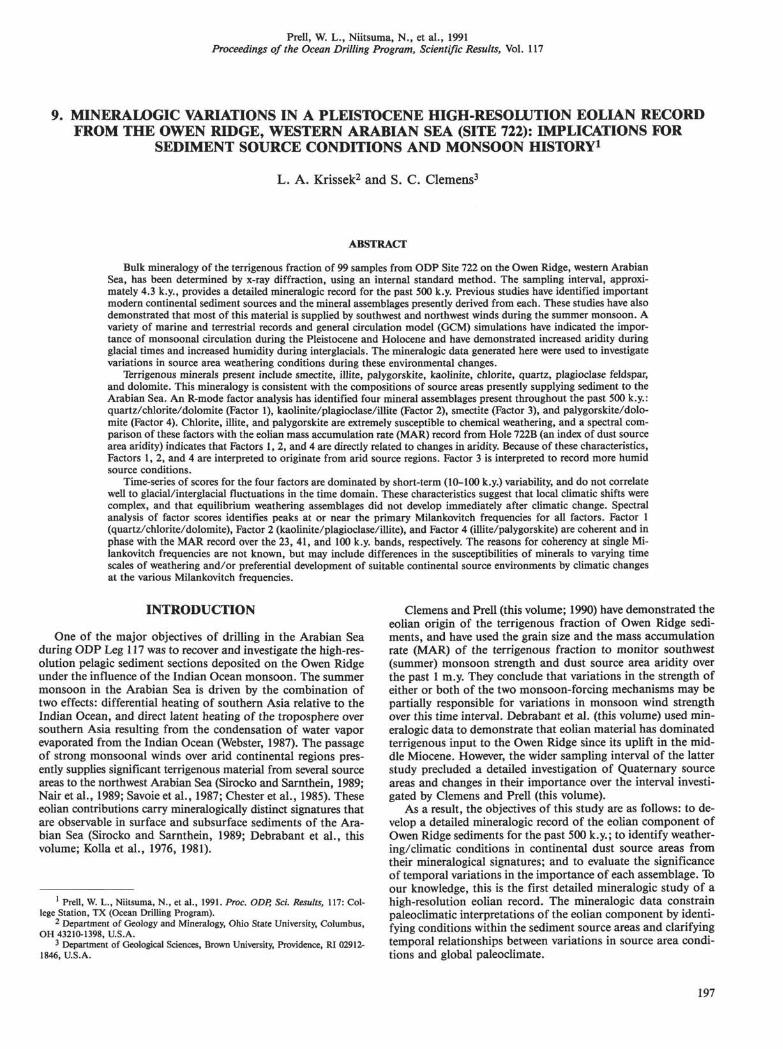
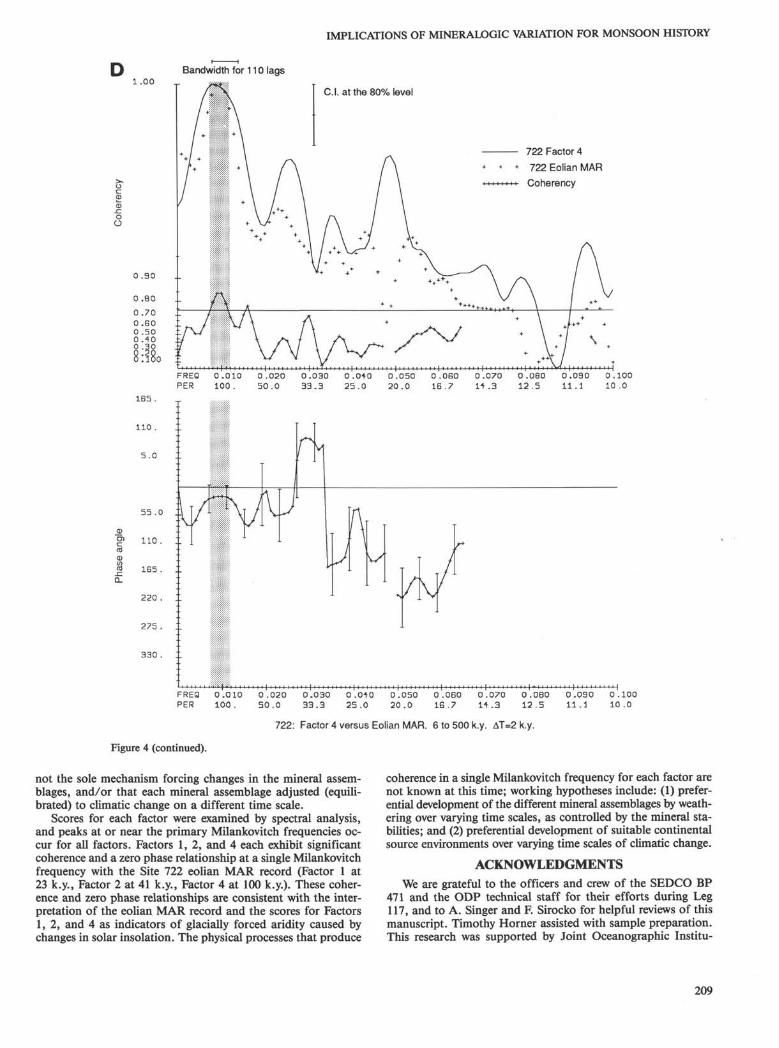
The time-series of scores for each factor was subjected tospectral analysis, and the results are illustrated in Figure 4. Thespectra of factor scores were compared with the spectra of eo-lian MAR and eolian grain size at Site 722 (Clemens and Prell,this volume), and global ice-volume (the SPECMAP stacked ox-ygen isotope record of Imbrie et al., 1984) over the interval6-500 ka. Clemens and Prell (this volume, 1990) have demon-strated that eolian MAR records from the Owen Ridge containspectral peaks at periods of 100, 40-42, 22-24, and 18-20 k.y.(the primary Milankovitch frequencies), and that these recordsare coherent with the marine oxygen isotope record and glacialloess sections from central China. Because of these relation-ships, they interpret the eolian MAR as an indicator of pastdust source-area aridity, driven by glacial/interglacial climaticfluctuations. The eolian grain size record varies independentlyof the MAR, but is well correlated with biotic indices of wind-driven up welling. For this reason, the grain size record is inter-preted as an index of summer monsoon wind strength.
Cross-spectral analyses identified significant coherence andzero phase relationships between the Site 722 factor scores andthe Site 722 eolian MAR, and between the Site 722 factor scoresand the marine oxygen isotope record. Because the Site 722 eo-lian MAR record is the more direct indicator of paleoclimaticaridity and because the linear relationship between the eolianMAR and marine oxygen isotope records is presented elsewhere(Clemens and Prell, this volume, 1990), we present only thecross-spectra that compare the scores for the mineralogic factorsto the eolian MAR record from Site 722 (Fig. 4). Poor coherenceis demonstrated by the cross-spectral analysis of the Site 722factor scores and the Site 722 eolian grain size records, support-ing the hypothesis that variations in Factors 1, 2, and 4 are re-sponses to changes in source area aridity, instead of windstrength.
The variance spectrum for Factor 1 contains peaks at periodsof approximately 117, 71, 33, 23, 21, and 17 k.y. (Fig. 4A); the23 k.y. (precession) peak shows significant coherence and zero
phase relationship with the 23 k.y. eolian MAR spectrum (Figs.4A and 5). The variance spectrum for Factor 2 contains peaks atapproximately 111, 37, 27, 21, and 18 k.y.; the Factor 2 recordshows relatively weak coherence with the eolian MAR at the41 k.y. (obliquity) band (Figs. 4B and 5). This association withthe known period of obliquity, and the zero phase relationship,support the significance of this coherence. The variance spec-trum for Factor 3 contains peaks at approximately 69, 43, 35,and 28-20 k.y., but shows no significant coherence with the eo-lian MAR record (Fig. 4C). The variance spectrum for Factor 4contains peaks at approximately 110, 38, 28, and 20 k.y., andshows significant coherence and a zero phase relationship witheolian MAR at the 100 k.y. (eccentricity) band (Figs. 4D and 5).
Previous high-resolution studies of paleoclimatic indicatorsin the Arabian Sea (Prell and Curry, 1981; Prell, 1984; Prell andvan Campo, 1986; Clemens and Prell, this volume, 1990) haveemphasized the importance of variations at the primary Milan-kovitch frequencies (eccentricity, 100 k.y.; obliquity, 41 k.y., pre-cession, 23 k.y.). These influences are also evident in the Site722 factor spectra, where frequencies at or close to the primaryMilankovitch frequencies are identified for each factor (eccen-tricity and precession in Factor 1, eccentricity, obliquity andprecession in Factor 2, obliquity and precession in Factor 3, andeccentricity, obliquity, and precession in Factor 4).
The spectra for Factors 1, 2, and 4 exhibit significant coher-ency and zero phase relationships with the Site 722 eolian MARover the primary Milankovitch frequencies (Figs. 4 and 5), indi-cating direct linear relationships between a portion of the in-creased production of each arid mineral assemblage (factor) andthe increased total eolian flux to the Owen Ridge. We have pre-viously demonstrated a possible disequilibrium between extantclimate (indicated by global ice volume) and the production/de-position of arid mineral assemblages (see Tables 3 and 4). Thespectral comparisons provide two lines of evidence to explainthat disequilibrium: (1) the spectrum for each factor containspeaks at the primary Milankovitch frequencies, but also con-tains peaks not observed in the global ice volume record (Fig. 4).The mechanisms that force the variations at non-Milankovitchfrequencies are not known at this time, but the presence of suchvariations re-emphasizes the complex nature of the weathering/erosion/deposition cycle. As a result of these variations at non-Milankovitch frequencies, each factor score record and the globalice volume record cannot vary synchronously in the time do-main; and (2) the spectral comparisons indicate a lag betweenmaximum ice volume and the maximum importance of aridmineral assemblages over the eccentricity and precession bands(Fig. 5). More specifically, maximum source area aridity, as in-dicated by maximum eolian MAR and maximum importance ofthe individual mineral assemblages, follows maximum globalice volume by 8 k.y. over the eccentricity band, by about 3 k.y.over the precession band, and is in phase over the obliquityband. These lags also reduce the correlation between the factorscores and global climate (as expressed by the oxygen isotopestages). While a general aridity control on the variability of Fac-tors 1, 2, and 4 is understandable, the detailed associationsidentified by the cross-spectral analysis are more difficult to ex-plain. On the basis of available data from the Arabian Sea, it isnot immediately obvious why the chlorite/quartz assemblage(Factor 1) responds predominantly to 23 k.y. aridity cycles, whilethe illite/plagioclase/kaolinite assemblage (Factor 2) respondsto 41 k.y. aridity cycles, and the palygorskite/dolomite assem-blage responds to 100 k.y. cycles. The association of each min-eral assemblage with a specific primary Milankovitch frequencymay reflect the combined effects of two processes: (1) the ratesof mineral weathering/formation, so that more resistant pri-mary minerals are enriched during longer climatic cycles; and(2) the role of climatic variations at each frequency in develop-
205

L. A. KRISSEK, S. C. CLEMENS
0.90
0 .800.700.600.500.400.30
Bandwidth for 110 lags C.I. at the 80% level
722 Factor 1722 Eolian MARCoherency
31+ .
269.
22+ .
179 .
B9.7
+ +.G 1
A
FREQPER
0 .010100 .
0 .50
020.0
0 .33
030.3
0 .(25
3 + 0.0
0 .20
050.0
0 .1G
060.7
0 .1+
070.3
0 .12
OBO.5
0 .11
03 0.1
0 .10
100.0
722: Factor 1 versus Eolian MAR. 6 to 500 k.y. T=2 k.y.
Figure 4. Normalized variance spectra of Site 722 factor scores (solid line) and Site 722 eolian MAR (crosses) andthe coherency spectrum between the factor scores and the eolian MAR (crosses with solid line) for the interval from6 to 500 k.y. Variancy spectra are plotted on arbitrary log scales and coherency spectrum is plotted on a hyperbolicarctangent. Frequencies are in cycles/k.y. Sampling interval is 2 k.y. Critical value for non-zero coherence at the80% confidence interval is shown (solid horizontal line). A. Site 722 Factor 1 scores and eolian MAR. B. Site 722Factor 2 scores and eolian MAR. C. Site 722 Factor 3 scores and eolian MAR. D. Site 722 Factor 4 scores and eolianMAR.
ing source area conditions favorable for formation/erosion ofthat mineral assemblage (e.g., the effects of sea level fluctua-tions or vegetation changes).
For example, chlorite is generally viewed as more susceptibleto chemical weathering than illite (Dixon and Weed, 1977; Velde,1985), so the association of chlorite with the shortest climatic
cycles may reflect preferential production/preservation of chlo-rite during shorter intervals of chemical weathering. Rates ofchemical weathering are difficult to measure directly, and suchdata from the Arabian Sea region are not known. Some usefuldata from cold arid regions in Antarctica were summarized byUgolini (1986), where both mica (illite) and chlorite were de-
206

IMPLICATIONS OF MINERALOGIC VARIATION FOR MONSOON HISTORY
B1.00 Bandwidth for 110 lags:
C.I. at the 80% level
722 Factor 2
722 Eolian MAR
Coherency
ü
0.90
0.80
0.700 .600.500.40
5o ::
381 .
318 .
251- .
191 .
ü> 127 .
cδ
B3.G ; .
- G 3 . B : .
-127. :.
-191. :.
FREQ
PER0 .010
100 .
0 .
50020.0
0.030
33.3
0 .
2501-0
.00.20
050
.0
0 .
1G060
.701
.070
+ .3
0 .12
080.5
0.11
090.1
0 .10
100.0
722: Factor 2 versus Eolian MAR. 6 to 500 k.y. T=2 k.y.
Figure 4 (continued).
graded over 17-21 k.y. of exposure. These time scales of weath-ering are in general agreement with the 23 and 41 k.y. periods ofclimatic change produced by insolation variations. In contrast,palygorskite forms relatively quickly under appropriate chemi-cal conditions (Dixon and Weed, 1977; Velde, 1985; and refer-ences therein), so its association with 100 k.y. aridity cycles doesnot appear to reflect time scales needed for palygorskite forma-tion. Instead, this association may indicate the role of 100 k.y.climatic cycles in developing and desiccating continental envi-ronments, such as coastal sabkhas and alkaline lakes, that aresuitable for palygorskite formation.
Distinguishing between the effects of mineral susceptibilityto weathering and the larger-scale effects of source area change
will require a geographically widespread suite of well-dated, high-resolution mineralogic records, combined with more detailedknowledge of local paleoclimatic fluctuations in the continentalsource regions over the past 500 k.y.
SUMMARY
Terrigenous eolian sediments deposited on the Owen Ridgeduring the past 500 k.y. are composed of smectite, illite, paly-gorskite, kaolinite, chlorite, quartz, plagioclase feldspar, anddolomite. This mineralogy is consistent with the compositionsof source areas presently supplying sediment to the ArabianSea. Significant climatic changes have occurred in these sourceregions over the past 500 k.y., however, so that the composi-
207

L. A. KRISSEK, S. C. CLEMENS
c1 .00
Bandwidth for 110 lags
C.I. at the 80% level
722 Factor 3722 Eolian MARCoherency
0 .30
0 .800.700 .600 .500.400 .30
3 2 3 .
21G
ioa.
722: Factor 3 versus Eolian MAR. 6 to 500 k.y. T=2 k.y.
Figure 4 (continued).
tions of sediments supplied from each source may have changedthrough time. An R-mode factor analysis of the mineral abun-dances has identified four mineral assemblages present through-out the record at Site 722: a quartz/chlorite/dolomite assem-blage (Factor 1), a kaolinite/plagioclase/illite assemblage (Fac-tor 2), smectite (Factor 3), and a palygorskite/dolomiteassemblage (Factor 4). Chlorite, illite, and palygorskite are allsusceptible to chemical weathering, suggesting that Factors 1, 2,and 4 each reflect arid continental source areas. This interpreta-tion is supported by spectral analysis, which indicates that pro-duction of these mineral assemblages increased during more
arid glacial intervals. In contrast, Factor 3 is interpreted to rec-ord relatively humid source conditions.
Pollen and lake-level data indicate that continental areasaround the Arabian Sea became more arid during glacial inter-vals and more humid during interglacials. Time-series of scoresfor the "arid" and "humid" factors (1, 2, and 4 vs. 3) are domi-nated by short-term (10-100 k.y.) variability, and do not corre-late well to glacial/interglacial fluctuations in the time domain.These characteristics suggest that local environmental fluctua-tions were more complex than simple transitions between aridglacials and humid interglacials, that orbital fluctuations were
208
IMPLICATIONS OF MINERALOGIC VARIATION FOR MONSOON HISTORY
C.I. at the 80% level
722 Factor 4
722 Eolian MAR
Coherency
FREQPER
0.010100 .
0 .50
020.0
0.03033.3
0 .0 + 025.0
0 .20
050. 0
0 .IB
060.7
0 .14
070.3
0 .12
0B0.5
0 .11
090.1
0 .10
100.0
722: Factor 4 versus Eolian MAR. 6 to 500 k.y. T=2 k.y.
Figure 4 (continued).
not the sole mechanism forcing changes in the mineral assem-blages, and/or that each mineral assemblage adjusted (equili-brated) to climatic change on a different time scale.
Scores for each factor were examined by spectral analysis,and peaks at or near the primary Milankovitch frequencies oc-cur for all factors. Factors 1, 2, and 4 each exhibit significantcoherence and a zero phase relationship at a single Milankovitchfrequency with the Site 722 eolian MAR record (Factor 1 at23 k.y., Factor 2 at 41 k.y., Factor 4 at 100 k.y.). These coher-ence and zero phase relationships are consistent with the inter-pretation of the eolian MAR record and the scores for Factors1, 2, and 4 as indicators of glacially forced aridity caused bychanges in solar insolation. The physical processes that produce
coherence in a single Milankovitch frequency for each factor arenot known at this time; working hypotheses include: (1) prefer-ential development of the different mineral assemblages by weath-ering over varying time scales, as controlled by the mineral sta-bilities; and (2) preferential development of suitable continentalsource environments over varying time scales of climatic change.
ACKNOWLEDGMENTSWe are grateful to the officers and crew of the SEDCO BP
471 and the ODP technical staff for their efforts during Leg117, and to A. Singer and F. Sirocko for helpful reviews of thismanuscript. Timothy Horner assisted with sample preparation.This research was supported by Joint Oceanographic Institu-
209

L. A. KRISSEK, S. C. CLEMENS
Maximum eccentricity(100 kyr)
Maximum obl iqu i ty
(41 kyr)
o×ygen isotopes(maximum ice)
-Precession(23 kyr)
90*=5.75 k.yOxygen isotopes(minimum ice)
Figure 5. Phase wheel summaries of climatic indices at Site 722. Each wheel presents phase relationships between climatic indices andinsolation variations in a specific primary Milankovitch frequency. Zero phase is located at the top of the circle. The phase differencebetween the beginning of the insolation cycle and the given climatic record is plotted as a vector whose angle is measured clockwise(+ , lagging) or counterclockwise (–, leading) from the zero point. The shaded area centered on the factor vector is the error associ-ated with the phase estimate for each factor. In each case, the maximum eolian MAR is within the error band of the factor phase esti-mate, indicating that the two climatic indices (factor scores and eolian MAR) have zero phase difference. Maximum aridity occursduring maxima in eolian MAR and factor scores, and occurs at or after maximum ice volume in each frequency band.
tions-United States Science Advisory Committee subgrants toL. Krissek and to S. Clemens and W. Prell; this work was per-formed while S. Clemens held a JOI/USSAC Ocean DrillingFellowship.
REFERENCES
Blatt, H., Middleton, G. V., and Murray, R., 1980. Origin of Sedimen-tary Rocks (2nd ed.): New Jersey (Prentice-Hall).
Brainpower, Inc., 1986. StatView 512 +: Calabasas, CA (Brainpower,Inc.).
Chester, R., Sharpies, E. J., and Sanders, G. S., 1985. The concentra-tion of particulate aluminum and clay minerals in aerosols from thenorthern Arabian Sea. J. Sediment. Petrol., 55:37-41.
Clemens, S. C , and Prell, W. L., 1990. Late Pleistocene variability ofArabian Sea summer-monsoon winds and continental aridity: eolianrecords from the lithogenic component of deep-sea sediments. Pale-oceanography, 5:109-145.
210

IMPLICATIONS OF MINERALOGIC VARIATION FOR MONSOON HISTORY
COHMAP Members, 1988. Climatic changes of the last 18,000 years:observations and model simulations. Science, 241:1043-1052.
Davis, J. C , 1986. Statistics and Data Analysis in Geology (2nd ed.):New York (Wiley).
Dixon, J. B., and Weed, S. B., 1977. Minerals in Soil Environments:Madison, WI (Soil Sci. Soc. of Am.).
Gibbs, R. J., 1967. Quantitative X-ray diffraction analysis using claymineral standards extracted from the samples to be analyzed. ClayMin., 7:79-90.
Griffin, J., Windom, H., and Goldberg, E. D., 1968. The distributionof clay minerals in the world ocean. Deep-Sea Res., 15:433-459.
Imbrie, J., Hays, J. D., Martinson, D. G., Mclntyre, A., Mix, A. C ,Morley, J. J., Pisias, N. G., Prell, W. L., and Shackleton, N. J.,1984. The orbital theory of Pleistocene climate: support from a re-vised chronology of the marine oxygen isotopic record. In Berger,A., Imbrie, J., Hays, J., Kukla, G., and Saltzman, B. (Eds.), Mi-lankovitch and Climate (Pt. 1): Dordrecht (D. Reidel), 269-305.
Imbrie, J., Mclntyre, A., and Mix, A., in press. Oceanic response to or-bital forcing in the Late Quaternary: observational and experimentalstrategies. In Duplessy, J. C , et al. (Eds.), Climate and Geosciences:Boston (D. Reidel).
Jenkins, G. M., and Watts, D. G., 1968. Spectral Analysis and Its Ap-plications: San Francisco (Holden Day).
Kolla, V., Henderson, L., Biscaye, P. E., 1976. Clay mineralogy and sedi-mentation in the western Indian ocean. Deep-Sea Res. Oceanogr.Abstr., 23:949-961.
Kolla, V., Kostecki, J. A., Robinson, F., Biscaye, P. E., and Ray, P. K.,1981. Distribution and origins of clay minerals and quartz in surfacesediments of the Arabian Sea. J. Sediment. Petrol., 51:563-569.
Krissek, L. A., 1982. Sources, dispersal, and contributions of fine-grained terrigenous sediments on the Oregon and Washington conti-nental slope [Ph.D. dissert.]. Oregon State Univ., Corvallis.
, 1989. Bulk mineralogy of nonbiogenic sediments from ODPSites 642 and 643, Norwegian Sea: implications for sediment prove-nance and recycling. In Eldholm, O., Thiede, J., Taylor, E., et al.,Proc. ODP, Sci. Results, 104: College Station, TX (Ocean DrillingProgram), 29-39.
Kutzbach, J. E., 1981. Monsoon climate of the early Holocene: climateexperiment with the earth's orbital parameters for 9000 years ago.Science, 214:59-61.
Kutzbach, J. E., and Otto-Bliesner, B. L., 1982. The sensitivity of theAfrican-Asian monsoonal climate to orbital parameter changes for9000 years B.P. in a low-resolution General Circulation Model. J.Atmos. Sci., 39:1177-1188.
Lisitzin, A. P., 1972. Sedimentation in the World Ocean, with Emphasison the Nature, Distribution and Behavior of Marine Suspensions.Soc. Econ. Paleontol. Mineral. Spec. Publ., 17.
Nair, R. R., Ittekkot, V., Manganini, S. J., Ramaswamy, V., Haake, B.,Degens, E. T, Desai, B. N., and Honjo, S., 1989. Increased particleflux to the deep ocean related to monsoons. Nature, 338:749-751.
Prell, W. L., 1984. Monsoonal climate of the Arabian Sea during thelate Quaternary: a response to changing solar radiation. In Berger,A. L., Imbrie, J., Hays, J., Kukla, G., and Saltzman, B. (Eds.). Mi-lankovitch and Climate (Pt. 1): Dordrecht (D. Reidel), 349-366.
Prell, W. L., and Curry, W. B., 1981. Faunal and isotopic indices ofmonsoonal upwelling: western Arabian Sea. Oceanol. Acta, 4:91-98.
Prell, W. L., Niitsuma, N., et al., 1989. Proc. ODP, Init. Repts., 117:College Station, TX (Ocean Drilling Program).
Prell, W. L., and van Campo, E., 1986. Coherent response of ArabianSea upwelling and pollen transport to late Quaternary monsoonalwinds. Nature, 323:526-528.
Savoie, D. L., Prospero, J. M., and Nees, R. X, 1987. Nitrate, non-sea-salt sulfate, and mineral aerosol over the northwestern Indian Ocean.J. Geophys. Res., 92:933-942.
Scheidegger, K. F., and Krissek, L. A., 1982. Dispersal and depositionof eolian and fluvial sediments off Peru and northern Chile. Geol.Soc. Am. Bull., 93:150-162.
Shipboard Scientific Party, 1989. Site 722. In Prell, W. L., Niitsuma,N., et al., Proc. ODP, Init. Repts., 117: College Station, TX (OceanDrilling Program), 255-318.
Sirocko, F., and Sarnthein, M., 1989. Wind-borne deposits in the north-west Indian Ocean: record of Holocene sediments versus modernsatellite data. In Leinen, M., and Sarnthein, M. (Eds.), Paleoclima-tology and Paleometeorology: Modern and Past Patterns of GlobalAtmospheric Transport. NATO ASI Sen, 282:401-433.
Street, F. A., and Grove, A. T., 1979. Global maps of lake-level fluctua-tions since 30,000 yr B.P. Quat. Res., 12:83-118.
Ugolini, F. C , 1986. Processes and rates of weathering in cold and po-lar environments. In Colman, S. M., and Dethier, D. P. (Eds.),Rates of Chemical Weathering of Rocks and Minerals: Orlando, FL(Academic Press), 193-235.
van Campo, E., 1986. Monsoon fluctuations in two 20,000-yr B.P. oxy-gen-isotope/pollen records off southwest India. Quat. Res., 26:376-388.
van Campo, E., Duplessy, J. C , and Rossignol-Strick, M., 1982. Cli-matic conditions deduced from a 150-k.y. oxygen isotope-pollen rec-ord from the Arabian Sea. Nature, 296:56-59.
Velde, B., 1985. Clay Minerals: A Physico-Chemical Explanation ofTheir Occurrence: Amsterdam (Elsevier).
Webster, P. J., 1987. The elementary monsoon. In Fein, J. S., and Ste-phens, P. L. (Eds.), Monsoons: New York (Wiley), 3-32.
Date of initial receipt: 2 October 1989Date of acceptance: 20 July 1990Ms 117B-183
211

L. A. KRISSEK, S. C. CLEMENS
APPENDIXData for Samples from Hole 722B
Dpth
0004002400440064008401040124014401640184020402240244026402840304032403440364038404040424044404640484050405240558057405940614063406740694071407340754QUA079408140854087408940914093409540974099410141034105410741094111411341154117411941214123412541274129413141334135413741394141414341454147415141534155415741594
Age
006.4008.7011.1013.4015.8018.4022.5026.6030.7034.8038.9043.0047.2051.3055.4059.5063.6068.9074.9081.4090.9100.4109.6118.8124.0127.2130.3135.7138.5142.0145.4148.9155.9159.3162.8166.3169.8174.1178.9184.3202.0210.9219.0222.9226.8230.7234.7238.5242.2245.9249.5252.8256.2259.5262.8266.2270.3279.3287.9293.9300.2308.2316.2324.2331.4334.3337.1340.0343.9348.5353.0357.5366.6371.1375.9381.9387.9
Sm
0.7660.7780.7661.2170.5550.3730.6130.6460.8080.3111.0671.1210.4050.4140.8210.5090.3150.3630.5000.2610.2340.4130.5150.7350.6560.9010.4440.8020.9120.8040.9060.7020.8440.4740.6970.7590.7280.6321.0750.8650.5540.7530.2980.5250.8900.4860.5390.8970.5930.7530.9260.2991.1380.7321.1080.9541.3230.5791.7540.5050.6960.4740.6400.9681.0000.9061.6270.6070.8070.7810.6110.5270.8621.0000.7811.0380.645
Plyg
0.3590.2540.5110.7170.4550.2710.5700.2020.2600.4080.2600.2520.0910.5150.6900.4360.3390.2350.4200.0000.2340.5000.3990.6330.4400.5350.5560.5100.7940.5590.5760.2380.4940.3500.3930.0340.3950.1950.2080.2530.3360.1550.5530.2580.4180.3050.3440.4950.1650.3090.6390.3680.6130.6590.3600.4250.5810.4460.5790.1380.5060.3770.2800.1940.3090.3770.1960.2620.3120.4250.3700.2730.6460.4260.2660.6350.306
11
0.2660.3171.7230.5870.2730.4240.3440.4140.3560.4850.3561.7010.3800.3640.000 (0.527 .0.3630.1860.8500.5590.4480.9420.6070.8730.4560.6340.7780.6980.8040.588 :1.271 :0.646o.896 :0.3430.787 :0.8710.4740.3910.8580.6530.5560.7220.6600.5920.3850.6860.4840.664
Qtz
3.7971.8103.7021.1523.9551.2371.9571.5351.1731.7571.6061.6451.0581.6063.5121.0181.3391.5981.5501.3691.2691.2881.0371.4661.4561.7621.6671.3331.6271.0201.2711.991£.5191.2481.4041.543.316.621.821.880.856.866.415.758.912.762.344.542
0.352 2.1320.679 2.7530.519 .9811.057 2.4370.650 2.1000.8050.7570.9540.887 I
.634
.477
.7471.952
0.471 0.3060.8770.303
.158
.7890.987 0.8990.4750.4400.8230.3640.6040.804 1
.262
.860
.500
.327
.604
.8240.525 2.0660.5070.4380.5930.473 ;0.3080.9360.703
.692
.055
.722L364.138.489.203
0.923 2.2500.726 .516
Pig
0.1720.3171.7230.0000.6180.2630.8390.6870.6150.4270.5100.5140.4880.3540.6310.4910.3870.6960.5800.3960.5790.4420.5030.6150.4400.8710.6570.4900.4610.7350.7880.6850.4810.6280.5280.3190.3510.9540.6040.5110.6150.8871.1060.5171.0550.6570.3980.4490.4070.9011.0091.1720.5500.9760.9550.6781.5650.8510.9820.6701.4430.6070.9200.6290.4360.8870.3730.6560.6800.2050.5000.3450.3690.3190.4060.7500.403
Kaol
0.2500.3970.4890.0000.0000.1690.2370.4340.2120.2040.1350.4950.1160.0000.3570.4180.2420.6670.2100.1350.1720.6060.2210.5080.2720.5840.1570.4900.2750.5290.8820.4610.8570.2550.0000.2930.0000.4250.1790.4350.2990.2370.3300.3420.3520.1240.3910.2150.0000.2220.2310.5860.4250.1590.3690.2530.5320.2480.4560.2480.2910.1640.0000.3550.0000.2450.1960.2790.2320.0960.0000.5640.0000.2980.3590.3650.323
Chi
0.3130.3971.3830.0000.9820.5511.3330.3740.9520.8061.0480.8321.0080.7470.7861.1450.5320.3820.6200.6400.8620.9810.6011.0680.7920.9500.8890.5940.6470.9901.0000.9191.2730.8391.1801.3880.8420.4251.1131.1000.6631.1241.0850.7000.7690.6290.5000.7760.6371.4441.2221.4141.3500.9511.0990.8281.2740.5791.2810.7611.1650.8521.7200.7580.9271.0380.6080.6720.6900.5890.8890.7271.0310.9570.8591.0581.032
Calc
1.7660.5870.0000.0000.5000.0000.4950.9800.2790.1840.3850.2900.5040.0000.2980.0000.0000.0000.0000.0000.1590.0670.0000.0000.0000.0000.1940.3750.0000.0001.8940.0000.0000.1681.7640.8970.8513.5060.2260.3203.1120.2061.0210.0000.9230.2480.9691.3270.5490.6302.0650.6091.2750.3660.3331.0800.3230.1744.9650.6422.1652.0980.8201.8390.6360.5851.5691.9340.0000.0000.0000.0000.0000.0000.7811.5003.226
Dol
1.2033.4447.2555.2393.7733.2715.0973.6674.3174.7963.6063.6642.6943.4954.0956.0553.7420.3534.3602.7662.5242.1630.1723.2503.3605.3765.8984.6885.3336.2454.9655.8916.2083.3947.3034.1903.8256.3566.4723.7003.0133.4332.6283.7424.5602.7902.3442.5704.2756.1483.3065.4837.4503.8293.3783.4946.0003.9673.0182.6244.3421.5082.7402.3871.8732.8303.9414.7873.9442.9183.3522.8732.6313.3623.0472.3852.581
Fl
-1.991-0.739
2.266-2.478-0.145-0.600
0.816-0.896
0.1180.0770.705
-0.4000.594
-0.196-2.057
0.580-0.768-1.520-0.569
0.7360.070
-1.204-1.355-1.041-0.565-0.602-0.065-1.507-1.457-0.194-0.786
0.5270.300
-0.3551.8581.568
-0.003-0.437
1.2610.547
-0.2491.180
-0.409-0.098-0.140-0.040-1.243-0.674
0.9772.4300.2841.3170.618
-0.4110.019
-0.2271.063
-1.842-0.731
0.455-0.440-0.448
2.354-0.260
0.1990.1740.0390.318
-0.110-1.028
0.477-0.007-0.528-0.345-0.454-0.160
0.075
F2
-0.571-0.342
3.125-2.218-1.094-0.762-0.541
0.767-0.392-0.795-0.935
2.108-0.407-1.571-0.502-0.412-0.517
1.6920.177
-0.153-0.014
1.4730.5220.861
-0.4041.066
-0.3770.491
-0.5050.3512.5710.4881.078
-0.088-1.541-0.042-1.401
0.792-0.384
0.3350.2590.7351.4210.2100.6210.1170.292
-0.258-1.482-0.230
0.2122.201
-0.6890.4651.1950.5531.9960.6731.4440.0702.239
-0.041-0.459
1.012-1.111
0.575-0.443-0.056-0.030-1.199-0.940
0.310-1.654-0.017
0.3450.7670.193
F3
1.0110.794
-1.9141.585
-1.159-0.527-1.326-0.154-0.124-1.237
0.8211.725
-0.780-0.965-0.331-0.790-0.936-0.263-0.814-0.811-1.350-0.163-0.088
1.703-0.072-0.104-1.532
0.3210.190
-0.3390.615
-0.3190.698
-0.912-0.868
0.594-0.084-1.067
0.4650.678
-0.411-0.376-2.099-0.342-0.518-0.785
0.0730.658
-0.375-0.903-0.473-2.085
0.522-1.045
0.4780.455
-0.178-1.187
2.181-0.590-1.835
0.362-1.157
0.9680.832
-0.0442.862
-0.565-0.058
0.541-0.510
0.3550.1741.2100.6140.7240.255
F4
-0.108-0.484-0.149
3.2960.9040.0431.077
-0.685-0.404
0.903-0.955-1.583-1.537
1.2952.2570.7940.531
-1.6060.728
-1.749-0.719-0.060-0.600
0.3770.3940.7801.8401.0892.8281.2790.242
-0.4420.2020.0460.944
-2.2930.4960.090
-0.601-1.286-0.366-1.859
0.433-0.536
0.161-0.432-0.226
0.216-0.592-0.571
0.588-0.542
1.5651.326
-0.976-0.202
0.0411.112
-0.506-1.529
0.408-0.713-1.557-1.777-0.925-0.748-1.430-0.249-0.272
0.5870.018
-1.0521.330
-0.217-0.894
0.062-0.958
212

IMPLICATIONS OF MINERALOGIC VARIATION FOR MONSOON HISTORY
Appendix (continued).
Dpth
1614163416541674169417141734175417741794181418341854187418941914193419541974199420142034
Age
393.9399.9407.7423.5427.2430.9434.7439.2443.7448.2452.7457.2461.7466.7472.0478.7485.3492.6503.7513.7518.1522.5
Sm
1.0340.8501.0710.8970.8240.9600.6880.8791.0370.5640.9710.3331.0591.7220.5601.4810.5250.4000.7142.0400.3891.556
Piyg
0.2410.2370.3570.6210.7650.4400.5630.4140.6300.1450.6290.6670.4120.8330.4000.2590.1500.1000.2860.2000.3330.778
11
0.345 10.3950.357 10.621 ;0.8820.4801.000 i0.466 10.7960.345 1
Qtz
.759
.191
.548>.OOO.765.540
..281.552.963.200
0.686 3.0290.600 4.0000.529 4.5000.944 :0.520 :0.2960.200
.000..500.963.175
0.200 0.9330.286 0.7430.480 20.333 11.000 :
.320
.111
.000
Pig
0.7070.4670.6430.4480.5591.0201.1880.3620.4810.4550.7430.0000.5290.5000.3200.5190.4000.1830.5710.4400.4440.444
Kaol
0.3450.3750.4760.3790.9120.3600.7810.1720.0000.0000.0000.0000.0001.0000.4400.0000.2250.2000.0000.4400.3890.444
Chi
1.0690.7680.4760.7241.0290.8000.6250.5170.5930.6551.0291.6332.0001.4442.0800.9260.5750.4170.7431.0000.6111.778
Calc
0.6382.0754.5248.6551.7940.0000.0002.1211.8701.4910.0000.8331.0000.0002.2000.4810.6500.1170.5710.0000.0006.444
Dol
3.2932.4214.6435.6216.0294.4405.8134.6725.2595.2918.2865.1335.8245.3893.0404.2593.1252.9332.8863.0002.389
10.556
Fl
0.565-0.610-1.117-0.694-1.574-0.512-1.091-0.678-0.408
0.3311.6343.2485.025
-0.2172.4971.038
-0.398-0.760-0.455
1.566-1.173
1.917
F2
0.0950.2110.314
-0.5101.4850.7892.370
-1.020-1.260-1.279-1.780-3.237-2.611
1.081-0.643-1.6663-0.548-0.842-0.803-0.531
0.230-1.438
F3
0.6980.7720.8560.3410.375
-0.274-0.898
0.4430.356
-0.779-0.718-0.783
0.3533.1720.0351.740
-0.240-0.179-0.370
4.306-0.500
1.390
F4
-1.438-1.170
0.1381.7752.0410.2580.9650.8601.952
-0.0602.306
1.3316-0.987
0.766-1.404-0.899-0.805-0.763-0.181-2.930-0.148
2.549
Notes: "Dpth" is ODP depth for each sample in cm below seafloor; "Age" is in ka; "Sm," "Plyg," "II," "Qtz," "Pig," "Kaol," "Chi," "Calc,"and "Dol" are mineral/boehmite peak area ratios for smectite, palygorskite, illite, quartz, plagioclase feldspar, kaolinite, chlorite, calcite, anddolomite, respectively. "Fl," "F2," "F3," and "F4" are scores for each sample for Factor 1, Factor 2, Factor 3, and Factor 4, respectively.
213