ocean city md real estate market report - may 2014
TRANSCRIPT

1604
16
04
1565
15
45
1521
15
08
1493
14
51
1420
13
93
1426
14
47
1407
13
61
1287
12
31
1196
11
98
1183
11
26
1104
10
89
1114
11
67
1190
11
26
1034
952 97
9 99
7 10
04
1006
97
1 98
5 1062
11
04
1143
0200400600800
10001200140016001800
A11
M J J A S O N D J F M A12
M J J A S O N D J F M A13
M J J A S O N D J F M A14
Ocean City Active Listing Volume Ocean City There are currently 1143 properties for sale in Ocean City, which is down by 4% from this point in 2013. Search All Ocean City Listings
Ocean Pines There are currently 229 properties for sale in Ocean Pines, representing a 57% increase over April of 2013. Search All Ocean Pines Listings
254
258 26
9 26
8 25
6 24
6 23
2 21
4 18
9 17
2 188
192
192
188
179
186
185
191
184
168
148
141
143 15
5 14
6 18
5 205
175
207
190
195
177
171
167
169
210 22
9
0
50
100
150
200
250
300
A11
M J J A S O N D J F M A12
M J J A S O N D J F M A13
M J J A S O N D J F M A14
Ocean Pines Active Listing Volume
Ocean City The average active listing price for the year in Ocean City is $342,000, which is down by 3% from the 2013 value at this point. This is more a function of what is currently on the market than anything else. 38
6
378
377
377
382
380
381
373
374
366
364
368
369 377
368 376
373
365
362
362
362
354
351
351
350
353
343
341 349
351
353
346
339
340
347
348
332
250
300
350
400
450
500
550
A11
M J J A S O N D J F M A12
M J J A S O N D J F M A13
M J J A S O N D J F M A14
Ocean City Active Listing Prices Avg. PriceMed. Price3 per. Mov. Avg. (Avg. Price)
Ocean Pines The average listing price in Ocean Pines for 2014 thus far is $335,000, which is a 4% increase over the 2013 value at this point of $322,000.
324
328
322 33
2
334
330
335
336
327
321
310
308
310 317 32
5
320 32
9
320
322
316
320
316
315 321 33
6
330
320
325
325
327
320
309 315
320 33
2 338 34
8
200
250
300
350
400
450
A11
M J J A S O N D J F M A12
M J J A S O N D J F M A13
M J J A S O N D J F M A14
Ocean Pines Active Listing Prices Avg. PriceMed. Price3 per. Mov. Avg. (Avg. Price)3 per. Mov. Avg. (Med. Price)
Active Listing Prices
Active Listing Volume
Ocean City and Ocean Pines Market Report
Direct: 443-614-9179 Email: [email protected]
Web: DwellinOC.com
New Listing Updates Sign up for email updates with new listings and price adjustments
for the type of properties you are looking for
Search All Area Listings We provide the most advanced consumer search available that is
linked directly to the Multiple Listing Service that we use.
A Division of The Mark Fritschle Group | Condominium Realty LTD

106
103 10
9
81
76
65
49 60
70
36
60
99
72
99
92
92
86 91
72
89
67
43 55
82
84
120
91
96
77
94
88
67
57
41 54
68
87
0
20
40
60
80
100
120
140
A11
M J J A S O N D J F M A12
M J J A S O N D J F M A13
M J J A S O N D J F M A14
Ocean City Sold Listing Volume Ocean City A total of 250 properties have gone to settlement in Ocean City thus far in 2014, which is down slightly from the 264 properties that went to settlement through this point in 2013. View Ocean City’s April Sold Listings
Ocean Pines 76 properties have gone to settlement so far this year in Ocean Pines, representing a 7% increase in activity over the 2013 value through April. View Ocean Pines’ April Sold Listings
23
22 26
25 28
24
22 26
16
16
12 14
23
28
28
20
25
15
22
18
17
10
10
26
25
42
38
22
33
25
22
27
17
14
12
25
25
05
1015202530354045
A11
M J J A S O N D J F M A12
M J J A S O N D J F M A13
M J J A S O N D J F M A14
Ocean Pines Sold Listing Volume
Ocean City The average sold listing price for the year in Ocean City is $273,000, which is off by 3% from the 2013 value of $282,000. This is the result of the property types that are selling more than anything else.
292
347
337
309
280
265 28
3
360
304
260
318
310
277 29
9
270
259 28
2 311
282
284 30
0
281 293
275
279 31
6
294 306 33
8
306
307
307
266
275
260
263 29
5
100
150
200
250
300
350
400
450
500
A11
M J J A S O N D J F M A12
M J J A S O N D J F M A13
M J J A S O N D J F M A14
Ocean City Sold Listing Prices Avg. PriceMed. Price
Ocean Pines The average sold price for the year so far in Ocean Pines if $239,000, which is up by 4% over the 2013 value through this point of $231,000.
254
253
213
243
208
277
229 234
197
294
214
270
259
222
221 225
199
262
242
290
257
251
237
220
217
236
275
247 26
0
246
270
218
198
293
187
217
260
150
170
190
210
230
250
270
290
310
A11
M J J A S O N D J F M A12
M J J A S O N D J F M A13
M J J A S O N D J F M A14
Ocean Pines Sold Listing Prices Avg. PriceMed. Price3 per. Mov. Avg. (Avg. Price)
Sold Listing Prices
Sold Listing Volume
Ocean City and Ocean Pines Market Report
Direct: 443-614-9179 Email: [email protected]
Web: DwellinOC.com
Recently Sold Listings Sold Listing Updates View Multiple Listing Service reports of the properties that have sold over the most recent 90 day period, broken down by area.
Sign up to get email updates when properties sell in areas that are of interest to you, based on your specifications.
A Division of The Mark Fritschle Group | Condominium Realty LTD
233 241 25
8
263
248
225 24
1 263
236
224 231 24
5
232
236
238
228
233 24
6
235
239 247 255
239 247
251
256
260 27
2
267
261 27
3
265
232 240
231
234 24
8
100
150
200
250
300
350
A11
M J J A S O N D J F M A12
M J J A S O N D J F M A13
M J J A S O N D J F M A14
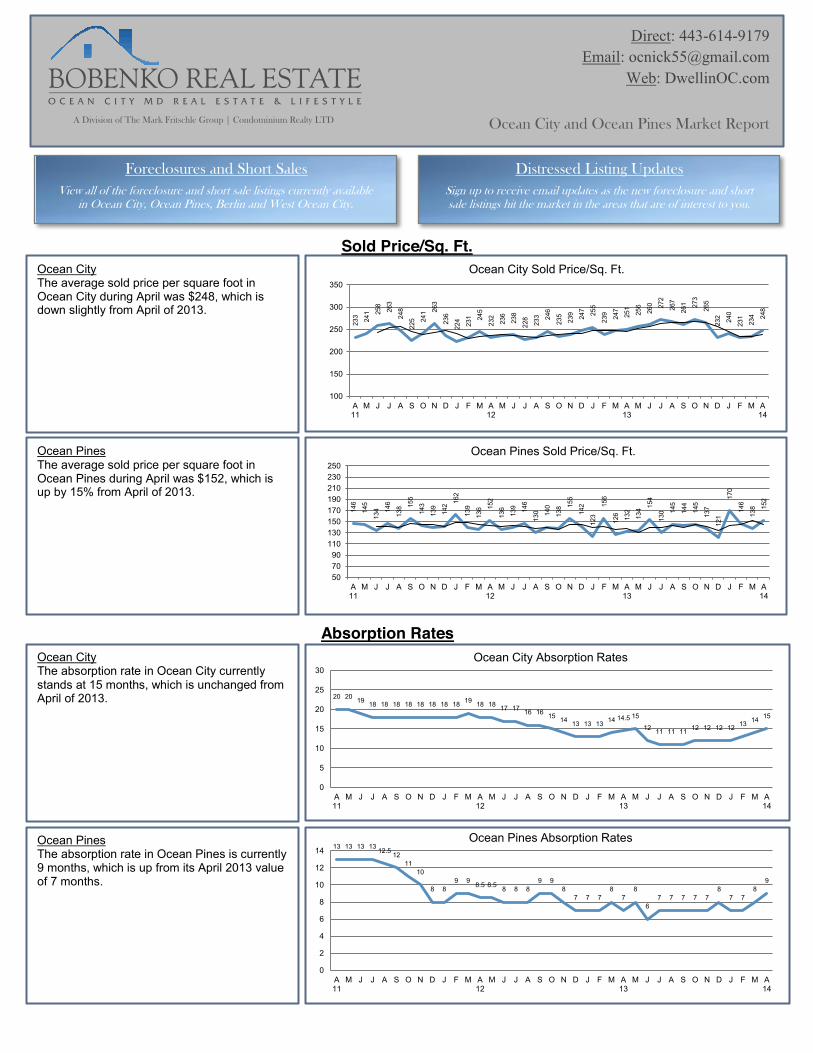
Ocean City Sold Price/Sq. Ft. Ocean City The average sold price per square foot in Ocean City during April was $248, which is down slightly from April of 2013.
Ocean Pines The average sold price per square foot in Ocean Pines during April was $152, which is up by 15% from April of 2013.
146
145
134 14
6
138 15
5
143
139
142 16
2
139
136 15
2
136
139 14
6
130 14
0
138 15
5
142
123
156
126 132
134 15
4
130 14
5
144
145
137
121
170
146
138 15
2
507090
110130150170190210230250
A11
M J J A S O N D J F M A12
M J J A S O N D J F M A13
M J J A S O N D J F M A14
Ocean Pines Sold Price/Sq. Ft.
Ocean City The absorption rate in Ocean City currently stands at 15 months, which is unchanged from April of 2013. 20 20 19 18 18 18 18 18 18 18 18 19 18 18 17 17 16 16 15 14 13 13 13 14 14.5 15
12 11 11 11 12 12 12 12 13 14 15
0
5
10
15
20
25
30
A11
M J J A S O N D J F M A12
M J J A S O N D J F M A13
M J J A S O N D J F M A14
Ocean City Absorption Rates
Ocean Pines The absorption rate in Ocean Pines is currently 9 months, which is up from its April 2013 value of 7 months.
13 13 13 13 12.5 12 11
10
8 8 9 9 8.5 8.5 8 8 8
9 9 8
7 7 7 8
7 8
6 7 7 7 7 7
8 7 7
8 9
0
2
4
6
8
10
12
14
A11
M J J A S O N D J F M A12
M J J A S O N D J F M A13
M J J A S O N D J F M A14
Ocean Pines Absorption Rates
Absorption Rates
Sold Price/Sq. Ft.
Ocean City and Ocean Pines Market Report
Direct: 443-614-9179 Email: [email protected]
Web: DwellinOC.com
Foreclosures and Short Sales Distressed Listing Updates View all of the foreclosure and short sale listings currently available
in Ocean City, Ocean Pines, Berlin and West Ocean City. Sign up to receive email updates as the new foreclosure and short sale listings hit the market in the areas that are of interest to you.
A Division of The Mark Fritschle Group | Condominium Realty LTD
92%
94%
92%
93%
93%
92%
92%
93%
92%
93%
93%
93%
93%
93%
93%
94%
92%
94%
93%
95%
94%
93%
94%
93%
94%
94%
94%
95%
95%
95%
95%
94%
95%
94%
94%
94%
95%
80%82%84%86%88%90%92%94%96%98%
100%
A11
M J J A S O N D J F M A12
M J J A S O N D J F M A13
M J J A S O N D J F M A14
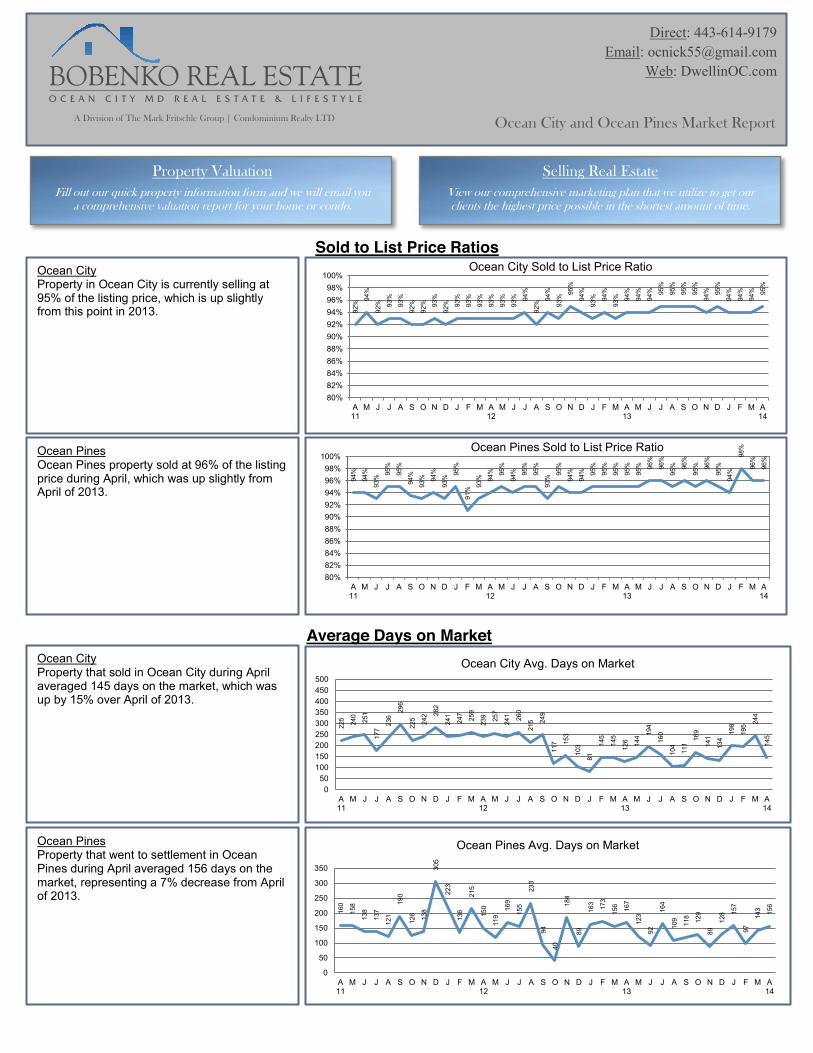
Ocean City Sold to List Price Ratio Ocean City Property in Ocean City is currently selling at 95% of the listing price, which is up slightly from this point in 2013.
Ocean Pines Ocean Pines property sold at 96% of the listing price during April, which was up slightly from April of 2013.
94%
94%
93%
95%
95%
94%
93%
94%
93%
95%
91%
93%
94%
95%
94%
95%
95%
93%
95%
94%
94%
95%
95%
95%
95%
95%
96%
96%
95%
96%
95%
96%
95%
94%
98%
96%
96%
80%82%84%86%88%90%92%94%96%98%
100%
A11
M J J A S O N D J F M A12
M J J A S O N D J F M A13
M J J A S O N D J F M A14
Ocean Pines Sold to List Price Ratio
Ocean City Property that sold in Ocean City during April averaged 145 days on the market, which was up by 15% over April of 2013.
225 240
251
177
236
296
225 24
2 282
241
247
259
239 25
7
241 26
0
215 24
9
117 15
3
103
81
145
145
126 14
4 194
160
104
111
169
141
134
198
195 24
4
145
050
100150200250300350400450500
A11
M J J A S O N D J F M A12
M J J A S O N D J F M A13
M J J A S O N D J F M A14
Ocean City Avg. Days on Market
Ocean Pines Property that went to settlement in Ocean Pines during April averaged 156 days on the market, representing a 7% decrease from April of 2013.
160
158
138
137
121
190
126 138
305
223
136
215
150
119
169
155
233
94
40
184
89
163 173
156 167
123
92
164
109
118 129
89 12
8 157
97
143 15
6
0
50
100
150
200
250
300
350
A11
M J J A S O N D J F M A12
M J J A S O N D J F M A13
M J J A S O N D J F M A14
Ocean Pines Avg. Days on Market
Average Days on Market
Sold to List Price Ratios
Ocean City and Ocean Pines Market Report
Direct: 443-614-9179 Email: [email protected]
Web: DwellinOC.com
Selling Real Estate Property Valuation View our comprehensive marketing plan that we utilize to get our clients the highest price possible in the shortest amount of time.
Fill out our quick property information form and we will email you a comprehensive valuation report for your home or condo.
A Division of The Mark Fritschle Group | Condominium Realty LTD

104
94
92 10
1
71
71 77
57
47
69
103 10
9 121
101
90
117
106
85 91
69
52
80 84
101
133
119
93
96
85
74
74
55
27
77
57
97
86
0
20
40
60
80
100
120
140
A11
M J J A S O N D J F M A12
M J J A S O N D J F M A13
M J J A S O N D J F M A14
Ocean City Under Contract Listing Volume Ocean City 86 properties went under contract in Ocean City during April, which was down considerably from April of last year. It is worth noting that April of 2013 was a record setting month in terms of contracts written. View Ocean City’s Under Contract Listings
Ocean Pines 38 properties went under contract in Ocean Pines during April, which was a 9% increase in activity over April of last year. View Ocean Pines’ Under Contract Listings
31
23
30 34
27
22
30
20
19
14 18
32 35
31
21
34
17
24
25
20
6
20
28
25
35 38
25
35
23
33
26
19
9
21
20
30
38
05
101520253035404550
A11
M J J A S O N D J F M A12
M J J A S O N D J F M A13
M J J A S O N D J F M A14
Ocean Pines Under Contract Listing Volume
Ocean City The average price of properties that have gone under contract in Ocean City during 2014 is $287,000, which is down slightly from the 2013 value of $292,000.
330 37
9
339
351
281 31
2
380
326
310 33
4
324
326
285 30
9
290
295 32
4
322
292 33
4
301
272 28
9
284 32
4
290 34
0
344
312 33
4
302
294
288
253
320
293
281
100150200250300350400450500550600
A11
M J J A S O N D J F M A12
M J J A S O N D J F M A13
M J J A S O N D J F M A14
Ocean City Under Contract Listing Prices
Ocean Pines The average price of properties that have gone under contract in Ocean Pines during 2014 is $248,000, which is down slightly from the 2013 value of $254,000.
242
232 24
2 264
207
266
243
249 26
2
237 26
4
239 26
7
221 23
2 243 25
4
287
265
264
183
272
241 25
2
250
245
290
262
243 26
4
235
236
191
238
233
285
236
100
150
200
250
300
350
400
A11
M J J A S O N D J F M A12
M J J A S O N D J F M A13
M J J A S O N D J F M A14
Ocean Pines Under Contract Listing Prices
Under Contract Listing Prices
Under Contract Listing Volume
Direct: 443-614-9179 Email: [email protected]
Web: DwellinOC.com
Ocean City and Ocean Pines Market Report
Useful Buying Information Buyer Action Plan View a series of articles and videos that we have put together which
explain and outline the various phases of buying real estate. View the plan and steps that we take to ensure our Buyer clients get the best deal possible through a relaxed and stress free transaction.
A Division of The Mark Fritschle Group | Condominium Realty LTD

193
160
156
136
126 14
2 151
94
67
151
158 18
3
138
133
112 12
3
130
131 14
1
114
75
152
134
200
189
119
93 11
4 14
9
136 15
2
123
71
133 15
0
150 16
4
0
50
100
150
200
250
300
A11
M J J A S O N D J F M A12
M J J A S O N D J F M A13
M J J A S O N D J F M A14
Ocean City New Listing Volume Ocean City A total of 597 properties have been listed in Ocean City thus far in 2014, which is a 12% decrease from the 675 properties that were listed through this point in 2013. View Ocean City’s New Listings
Ocean Pines 170 new properties have been listed in Ocean Pines thus far in 2014, representing a 26% increase over the 135 properties that were listed through this point in 2013. View Ocean Pines New Listings
57
46
37 40
33
35
22
18
13
26 34
48
30
43
37
35 39
22
23
12
10
28 32
40
35
55
34
54
56
32
34
25
11
27
21
66
56
0
10
20
30
40
50
60
70
80
A11
M J J A S O N D J F M A12
M J J A S O N D J F M A13
M J J A S O N D J F M A14
Ocean Pines New Listing Volume
Ocean City The average new listing price for the year so far in Ocean City is $341,000, which is up by 7% over the new listing price of $320,000 through April of last year. 37
2
381
388
387
388
354 37
7
341
305 32
5 354
345
336 36
2
309
297
352
297
365
284 32
3
311
323
305 34
2
408
341 37
2 394
325
329
289
301
370
363
334
296
100150200250300350400450500550600
A11
M J J A S O N D J F M A12
M J J A S O N D J F M A13
M J J A S O N D J F M A14
Ocean City New Listing Prices
Ocean Pines The average new listing price in Ocean Pines thus far in 2014 is $334,000, which is up by 10% over the 2013 value of $304,000.
314
355
264
358 370
291
283
218
288
335
273
257
305
255
308 32
4 337
266 29
4
258
359
306
272
323
314
302
283
335
285
360
280
336
204
315
361
324 334
100
200
300
400
500
A11
M J J A S O N D J F M A12
M J J A S O N D J F M A13
M J J A S O N D J F M A14
Ocean Pines New Listing Prices
New Listing Prices
New Listing Volume
Ocean City and Ocean Pines Market Report
Direct: 443-614-9179 Email: [email protected]
Web: DwellinOC.com
Just Listed Properties Search ALL Listings Search all of the available area listings based on your specifications
through the MLS, which is the same database we utilize. View new listings and price adjustments that have become available
over the most recent 7 day period, broken down by area.
A Division of The Mark Fritschle Group | Condominium Realty LTD