occupancy, deliveries show strength heading into … · marketview occupancy, rents level off; new...
TRANSCRIPT
MARKETVIEW
Occupancy, Deliveries Show
Strength Heading into Midyear
Dallas / Fort Worth Retail, Q2 2018
Q2 2018 CBRE Research © 2018 CBRE, Inc. | 1
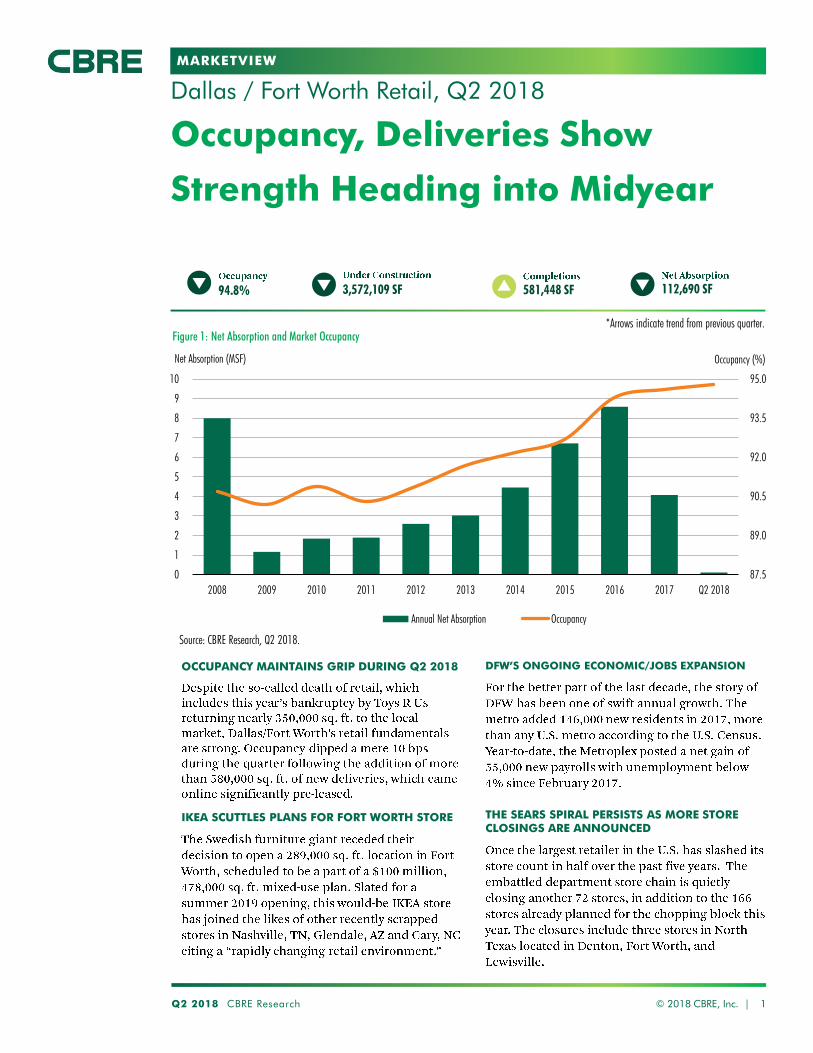
581,448 SF 112,690 SF94.8% 3,572,109 SF
Figure 1: Net Absorption and Market Occupancy
Source: CBRE Research, Q2 2018.
*Arrows indicate trend from previous quarter.
87.5
89.0
90.5
92.0
93.5
95.0
0
1
2
3
4
5
6
7
8
9
10
2008 2009 2010 2011 2012 2013 2014 2015 2016 2017 Q2 2018
Occupancy (%)Net Absorption (MSF)
Annual Net Absorption Occupancy
OCCUPANCY MAINTAINS GRIP DURING Q2 2018
IKEA SCUTTLES PLANS FOR FORT WORTH STORE
DFW’S ONGOING ECONOMIC/JOBS EXPANSION
THE SEARS SPIRAL PERSISTS AS MORE STORE CLOSINGS ARE ANNOUNCED
MARKETVIEW
Q2 2018 CBRE Research © 2018 CBRE, Inc. | 2
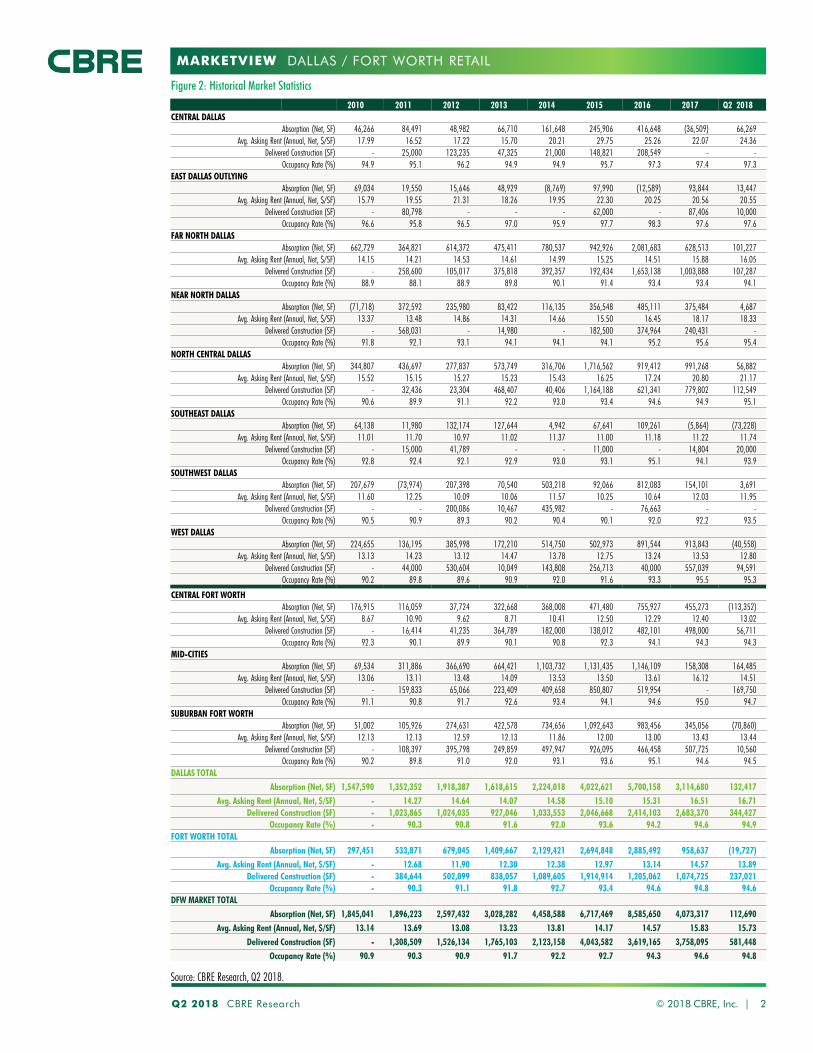
Source: CBRE Research, Q2 2018.
Figure 2: Historical Market Statistics
DALLAS / FORT WORTH RETAIL
2010 2011 2012 2013 2014 2015 2016 2017 Q2 2018
CENTRAL DALLAS
Absorption (Net, SF) 46,266 84,491 48,982 66,710 161,648 245,906 416,648 (36,509) 66,269
Avg. Asking Rent (Annual, Net, $/SF) 17.99 16.52 17.22 15.70 20.21 29.75 25.26 22.07 24.36
Delivered Construction (SF) - 25,000 123,235 47,325 21,000 148,821 208,549 - -
Occupancy Rate (%) 94.9 95.1 96.2 94.9 94.9 95.7 97.3 97.4 97.3
EAST DALLAS OUTLYING
Absorption (Net, SF) 69,034 19,550 15,646 48,929 (8,769) 97,990 (12,589) 93,844 13,447
Avg. Asking Rent (Annual, Net, $/SF) 15.79 19.55 21.31 18.26 19.95 22.30 20.25 20.56 20.55
Delivered Construction (SF) - 80,798 - - - 62,000 - 87,406 10,000
Occupancy Rate (%) 96.6 95.8 96.5 97.0 95.9 97.7 98.3 97.6 97.6
FAR NORTH DALLAS
Absorption (Net, SF) 662,729 364,821 614,372 475,411 780,537 942,926 2,081,683 628,513 101,227
Avg. Asking Rent (Annual, Net, $/SF) 14.15 14.21 14.53 14.61 14.99 15.25 14.51 15.88 16.05
Delivered Construction (SF) - 258,600 105,017 375,818 392,357 192,434 1,653,138 1,003,888 107,287
Occupancy Rate (%) 88.9 88.1 88.9 89.8 90.1 91.4 93.4 93.4 94.1
NEAR NORTH DALLAS
Absorption (Net, SF) (71,718) 372,592 235,980 83,422 116,135 356,548 485,111 375,484 4,687
Avg. Asking Rent (Annual, Net, $/SF) 13.37 13.48 14.86 14.31 14.66 15.50 16.45 18.17 18.33
Delivered Construction (SF) - 568,031 - 14,980 - 182,500 374,964 240,431 -
Occupancy Rate (%) 91.8 92.1 93.1 94.1 94.1 94.1 95.2 95.6 95.4
NORTH CENTRAL DALLAS
Absorption (Net, SF) 344,807 436,697 277,837 573,749 316,706 1,716,562 919,412 991,268 56,882
Avg. Asking Rent (Annual, Net, $/SF) 15.52 15.15 15.27 15.23 15.43 16.25 17.24 20.80 21.17
Delivered Construction (SF) - 32,436 23,304 468,407 40,406 1,164,188 621,341 779,802 112,549
Occupancy Rate (%) 90.6 89.9 91.1 92.2 93.0 93.4 94.6 94.9 95.1
SOUTHEAST DALLAS
Absorption (Net, SF) 64,138 11,980 132,174 127,644 4,942 67,641 109,261 (5,864) (73,228)
Avg. Asking Rent (Annual, Net, $/SF) 11.01 11.70 10.97 11.02 11.37 11.00 11.18 11.22 11.74
Delivered Construction (SF) - 15,000 41,789 - - 11,000 - 14,804 20,000
Occupancy Rate (%) 92.8 92.4 92.1 92.9 93.0 93.1 95.1 94.1 93.9
SOUTHWEST DALLAS
Absorption (Net, SF) 207,679 (73,974) 207,398 70,540 503,218 92,066 812,083 154,101 3,691
Avg. Asking Rent (Annual, Net, $/SF) 11.60 12.25 10.09 10.06 11.57 10.25 10.64 12.03 11.95
Delivered Construction (SF) - - 200,086 10,467 435,982 - 76,663 - -
Occupancy Rate (%) 90.5 90.9 89.3 90.2 90.4 90.1 92.0 92.2 93.5
WEST DALLAS
Absorption (Net, SF) 224,655 136,195 385,998 172,210 514,750 502,973 891,544 913,843 (40,558)
Avg. Asking Rent (Annual, Net, $/SF) 13.13 14.23 13.12 14.47 13.78 12.75 13.24 13.53 12.80
Delivered Construction (SF) - 44,000 530,604 10,049 143,808 256,713 40,000 557,039 94,591
Occupancy Rate (%) 90.2 89.8 89.6 90.9 92.0 91.6 93.3 95.5 95.3
CENTRAL FORT WORTH
Absorption (Net, SF) 176,915 116,059 37,724 322,668 368,008 471,480 755,927 455,273 (113,352)
Avg. Asking Rent (Annual, Net, $/SF) 8.67 10.90 9.62 8.71 10.41 12.50 12.29 12.40 13.02
Delivered Construction (SF) - 16,414 41,235 364,789 182,000 138,012 482,101 498,000 56,711
Occupancy Rate (%) 92.3 90.1 89.9 90.1 90.8 92.3 94.1 94.3 94.3
MID-CITIES
Absorption (Net, SF) 69,534 311,886 366,690 664,421 1,103,732 1,131,435 1,146,109 158,308 164,485
Avg. Asking Rent (Annual, Net, $/SF) 13.06 13.11 13.48 14.09 13.53 13.50 13.61 16.12 14.51
Delivered Construction (SF) - 159,833 65,066 223,409 409,658 850,807 519,954 - 169,750
Occupancy Rate (%) 91.1 90.8 91.7 92.6 93.4 94.1 94.6 95.0 94.7
SUBURBAN FORT WORTH
Absorption (Net, SF) 51,002 105,926 274,631 422,578 734,656 1,092,643 983,456 345,056 (70,860)
Avg. Asking Rent (Annual, Net, $/SF) 12.13 12.13 12.59 12.13 11.86 12.00 13.00 13.43 13.44
Delivered Construction (SF) - 108,397 395,798 249,859 497,947 926,095 466,458 507,725 10,560
Occupancy Rate (%) 90.2 89.8 91.0 92.0 93.1 93.6 95.1 94.6 94.5
DALLAS TOTAL
Absorption (Net, SF) 1,547,590 1,352,352 1,918,387 1,618,615 2,224,018 4,022,621 5,700,158 3,114,680 132,417
Avg. Asking Rent (Annual, Net, $/SF) - 14.27 14.64 14.07 14.58 15.10 15.31 16.51 16.71
Delivered Construction (SF) - 1,023,865 1,024,035 927,046 1,033,553 2,046,668 2,414,103 2,683,370 344,427
Occupancy Rate (%) - 90.3 90.8 91.6 92.0 93.6 94.2 94.6 94.9
FORT WORTH TOTAL
Absorption (Net, SF) 297,451 533,871 679,045 1,409,667 2,129,421 2,694,848 2,885,492 958,637 (19,727)
Avg. Asking Rent (Annual, Net, $/SF) - 12.68 11.90 12.30 12.38 12.97 13.14 14.57 13.89
Delivered Construction (SF) - 384,644 502,099 838,057 1,089,605 1,914,914 1,205,062 1,074,725 237,021
Occupancy Rate (%) - 90.3 91.1 91.8 92.7 93.4 94.6 94.8 94.6
DFW MARKET TOTAL
Absorption (Net, SF) 1,845,041 1,896,223 2,597,432 3,028,282 4,458,588 6,717,469 8,585,650 4,073,317 112,690
Avg. Asking Rent (Annual, Net, $/SF) 13.14 13.69 13.08 13.23 13.81 14.17 14.57 15.83 15.73
Delivered Construction (SF) - 1,308,509 1,526,134 1,765,103 2,123,158 4,043,582 3,619,165 3,758,095 581,448
Occupancy Rate (%) 90.9 90.3 90.9 91.7 92.2 92.7 94.3 94.6 94.8
MARKETVIEW
Q2 2018 CBRE Research 3
DALLAS / FORT WORTH RETAIL
© 2018 CBRE, Inc. |
4,000
4,250
4,500
4,750
5,000
55,000
57,500
60,000
62,500
65,000
67,500
70,000
2011
2012
2013
2014
2015
2016
2017
2018
Median HH Income Population (000s)
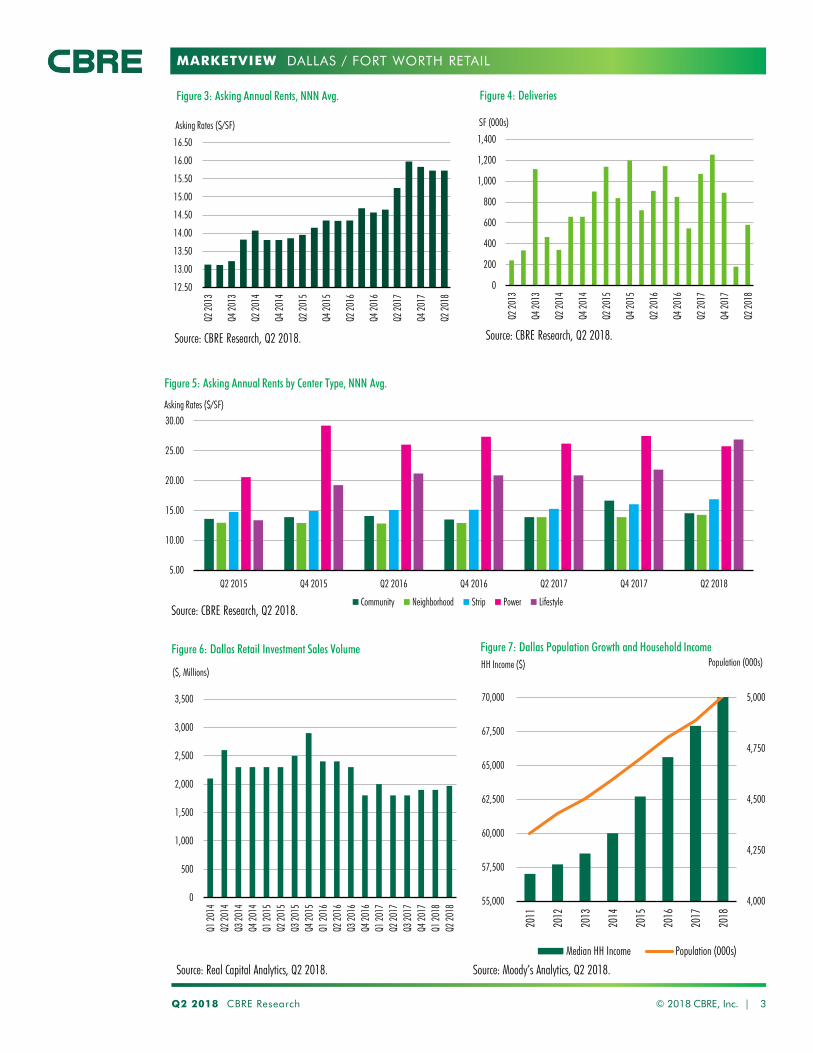
Figure 7: Dallas Population Growth and Household IncomePopulation (000s)
Source: Moody’s Analytics, Q2 2018.
HH Income ($)
Source: Real Capital Analytics, Q2 2018.
0
500
1,000
1,500
2,000
2,500
3,000
3,500
Q1 2
014
Q2 2
014
Q3 2
014
Q4 2
014
Q1 2
015
Q2 2
015
Q3 2
015
Q4 2
015
Q1 2
016
Q2 2
016
Q3 2
016
Q4 2
016
Q1 2
017
Q2 2
017
Q3 2
017
Q4 2
017
Q1 2
018
Q2 2
018
($, Millions)
Figure 6: Dallas Retail Investment Sales Volume
5.00
10.00
15.00
20.00
25.00
30.00
Q2 2015 Q4 2015 Q2 2016 Q4 2016 Q2 2017 Q4 2017 Q2 2018
Asking Rates ($/SF)
Community Neighborhood Strip Power Lifestyle
12.50
13.00
13.50
14.00
14.50
15.00
15.50
16.00
16.50
Q2 2
013
Q4 2
013
Q2 2
014
Q4 2
014
Q2 2
015
Q4 2
015
Q2 2
016
Q4 2
016
Q2 2
017
Q4 2
017
Q2 2
018
Asking Rates ($/SF)
0
200
400
600
800
1,000
1,200
1,400
Q2 2
013
Q4 2
013
Q2 2
014
Q4 2
014
Q2 2
015
Q4 2
015
Q2 2
016
Q4 2
016
Q2 2
017
Q4 2
017
Q2 2
018
SF (000s)
Source: CBRE Research, Q2 2018.
Figure 5: Asking Annual Rents by Center Type, NNN Avg.
Figure 3: Asking Annual Rents, NNN Avg. Figure 4: Deliveries
Source: CBRE Research, Q2 2018.
Source: CBRE Research, Q2 2018.

MARKETVIEW
Disclaimer: Information contained herein, including projections, has been obtained from sources believed to be reliable. While we do not doubt its accuracy, we have not verified it and make no guarantee, warranty or representation about it. It is your responsibility to confirm independently its accuracy and completeness. This information is presented exclusively for use by CBRE clients and professionals and all rights to the material are reserved and cannot be reproduced without prior written permission of CBRE.
CONTACTS CBRE OFFICES
DALLAS / FORT WORTH RETAIL

MARKETVIEW
Occupancy, rents level off; new
construction deliveries will lead
new leasing activity in 2018
Dallas / Fort Worth Retail, Q1 2018
Q1 2018 CBRE Research © 2018 CBRE, Inc. | 1
Completions180,000 SF
Net Absorption596,051 SF
Occupancy94.9%
Under Construction4,871,914 SF
Figure 1: Net Absorption and Market Occupancy
Source: CBRE Research, Q1 2018.
*Arrows indicate trend from previous quarter.
87.5
89.0
90.5
92.0
93.5
95.0
0
1
2
3
4
5
6
7
8
9
10
2008 2009 2010 2011 2012 2013 2014 2015 2016 2017 2018
Occupancy (%)Net Absorption (MSF)
Annual Net Absorption Occupancy
OCCUPANCY REMAINS AT ALL-TIME HIGHS; CLOSING IN ON 95%
Dallas/Fort Worth’s tightening retail market, strong net absorption and heavily pre-leased deliveries caused occupancy to measure in at an all-time high. However, as construction starts slow and completions take longer to come online, occupancy and rental rates are expected to level off in the short-term before picking back up later in the year.
RETAIL GROWTH LIMITED BY LAG IN DEVELOPMENT
Multiple construction projects across North Texas
have been sidelined as labor and borrowing costs
remain elevated, specifically for those in the early
stages. Delayed construction starts and slowing
completions are a present concern for mid- and
smaller-sized North Texas retailers.
CLASS A BIG BOX SUPPLY REMAINS ELEVATED AS MARKET STABILIZES
As forecasted, the pace of absorption in big box
space slowed throughout 2017 and continues into
this year. Similar to other major U.S. retail
markets, Class A elevated supply, at 935,145-sq.-
ft., is due to a smaller pool of big box retailers
willing to take additional space.
TOYS R US ANNOUNCES SURPRISE LIQUIDATION OF ITS NATIONWIDE PORTFOLIO
In March, Toys R Us filed a motion seeking
bankruptcy court approval to begin liquidation of
its 735 U.S and Puerto Rico stores. The closures
are expected to occur within the first nine months
of 2018. In North Texas alone, the retailer is
responsible for 15 locations, accounting for over
600,000-sq.-ft. of space.

MARKETVIEW
Q1 2018 CBRE Research © 2018 CBRE, Inc. | 2
Source: CBRE Research, Q1 2018.
Figure 2: Historical Market Statistics
DALLAS / FORT WORTH RETAIL
2010 2011 2012 2013 2014 2015 2016 2017 YTD 2018CENTRAL DALLAS
Absorption (Net, SF) 46,266 84,491 48,982 66,710 161,648 245,906 416,648 (36,509) (37,156)Avg. Asking Rent (Annual, Net, $/SF) 17.99 16.52 17.22 15.70 20.21 29.75 25.26 22.07 24.36
Delivered Construction (SF) - 25,000 123,235 47,325 21,000 148,821 208,549 - -Occupancy Rate (%) 94.9 95.1 96.2 94.9 94.9 95.7 97.3 97.4 97.1
EAST DALLAS OUTLYINGAbsorption (Net, SF) 69,034 19,550 15,646 48,929 (8,769) 97,990 (12,589) 93,844 (5,252)
Avg. Asking Rent (Annual, Net, $/SF) 15.79 19.55 21.31 18.26 19.95 22.30 20.25 20.56 20.55Delivered Construction (SF) - 80,798 - - - 62,000 - 87,406 -
Occupancy Rate (%) 96.6 95.8 96.5 97.0 95.9 97.7 98.3 97.6 97.5FAR NORTH DALLAS
Absorption (Net, SF) 662,729 364,821 614,372 475,411 780,537 942,926 2,081,683 628,513 208,588Avg. Asking Rent (Annual, Net, $/SF) 14.15 14.21 14.53 14.61 14.99 15.25 14.51 15.88 16.05
Delivered Construction (SF) - 258,600 105,017 375,818 392,357 192,434 1,653,138 1,003,888 122,000Occupancy Rate (%) 88.9 88.1 88.9 89.8 90.1 91.4 93.4 93.4 94.4
NEAR NORTH DALLASAbsorption (Net, SF) (71,718) 372,592 235,980 83,422 116,135 356,548 485,111 375,484 (5,057)
Avg. Asking Rent (Annual, Net, $/SF) 13.37 13.48 14.86 14.31 14.66 15.50 16.45 18.17 18.33Delivered Construction (SF) - 568,031 - 14,980 - 182,500 374,964 240,431 -
Occupancy Rate (%) 91.8 92.1 93.1 94.1 94.1 94.1 95.2 95.6 95.5NORTH CENTRAL DALLAS
Absorption (Net, SF) 344,807 436,697 277,837 573,749 316,706 1,716,562 919,412 991,268 123,606Avg. Asking Rent (Annual, Net, $/SF) 15.52 15.15 15.27 15.23 15.43 16.25 17.24 20.80 21.17
Delivered Construction (SF) - 32,436 23,304 468,407 40,406 1,164,188 621,341 779,802 -Occupancy Rate (%) 90.6 89.9 91.1 92.2 93.0 93.4 94.6 94.9 95.2
SOUTHEAST DALLASAbsorption (Net, SF) 64,138 11,980 132,174 127,644 4,942 67,641 109,261 (5,864) 26,613
Avg. Asking Rent (Annual, Net, $/SF) 11.01 11.70 10.97 11.02 11.37 11.00 11.18 11.22 11.74Delivered Construction (SF) - 15,000 41,789 - - 11,000 - 14,804 -
Occupancy Rate (%) 92.8 92.4 92.1 92.9 93.0 93.1 95.1 94.1 94.5SOUTHWEST DALLAS
Absorption (Net, SF) 207,679 (73,974) 207,398 70,540 503,218 92,066 812,083 154,101 142,320Avg. Asking Rent (Annual, Net, $/SF) 11.60 12.25 10.09 10.06 11.57 10.25 10.64 12.03 11.95
Delivered Construction (SF) - - 200,086 10,467 435,982 - 76,663 - -Occupancy Rate (%) 90.5 90.9 89.3 90.2 90.4 90.1 92.0 92.2 93.0
WEST DALLASAbsorption (Net, SF) 224,655 136,195 385,998 172,210 514,750 502,973 891,544 913,843 184,377
Avg. Asking Rent (Annual, Net, $/SF) 13.13 14.23 13.12 14.47 13.78 12.75 13.24 13.53 12.80Delivered Construction (SF) - 44,000 530,604 10,049 143,808 256,713 40,000 557,039 58,000
Occupancy Rate (%) 90.2 89.8 89.6 90.9 92.0 91.6 93.3 95.5 96.0
CENTRAL FORT WORTHAbsorption (Net, SF) 176,915 116,059 37,724 322,668 368,008 471,480 755,927 455,273 36,907
Avg. Asking Rent (Annual, Net, $/SF) 8.67 10.90 9.62 8.71 10.41 12.50 12.29 12.40 13.02Delivered Construction (SF) - 16,414 41,235 364,789 182,000 138,012 482,101 498,000 -
Occupancy Rate (%) 92.3 90.1 89.9 90.1 90.8 92.3 94.1 94.3 94.5MID-CITIES
Absorption (Net, SF) 69,534 311,886 366,690 664,421 1,103,732 1,131,435 1,146,109 158,308 (131,035)Avg. Asking Rent (Annual, Net, $/SF) 13.06 13.11 13.48 14.09 13.53 13.50 13.61 16.12 14.51
Delivered Construction (SF) - 159,833 65,066 223,409 409,658 850,807 519,954 - -Occupancy Rate (%) 91.1 90.8 91.7 92.6 93.4 94.1 94.6 95.0 94.7
SUBURBAN FORT WORTHAbsorption (Net, SF) 51,002 105,926 274,631 422,578 734,656 1,092,643 983,456 345,056 52,140
Avg. Asking Rent (Annual, Net, $/SF) 12.13 12.13 12.59 12.13 11.86 12.00 13.00 13.43 13.44Delivered Construction (SF) - 108,397 395,798 249,859 497,947 926,095 466,458 507,725 -
Occupancy Rate (%) 90.2 89.8 91.0 92.0 93.1 93.6 95.1 94.6 95.0DALLAS TOTAL
Absorption (Net, SF) 1,547,590 1,352,352 1,918,387 1,618,615 2,224,018 4,022,621 5,700,158 3,114,680 638,039Avg. Asking Rent (Annual, Net, $/SF) - 14.27 14.64 14.07 14.58 15.10 15.31 16.51 16.71
Delivered Construction (SF) - 1,023,865 1,024,035 927,046 1,033,553 2,046,668 2,414,103 2,683,370 180,000Occupancy Rate (%) - 90.3 90.8 91.6 92.0 93.6 94.2 94.6 95.1
FORT WORTH TOTALAbsorption (Net, SF) 297,451 533,871 679,045 1,409,667 2,129,421 2,694,848 2,885,492 958,637 (41,988)
Avg. Asking Rent (Annual, Net, $/SF) - 12.68 11.90 12.30 12.38 12.97 13.14 14.57 13.89Delivered Construction (SF) - 384,644 502,099 838,057 1,089,605 1,914,914 1,205,062 1,074,725 -
Occupancy Rate (%) - 90.3 91.1 91.8 92.7 93.4 94.6 94.8 94.7DFW MARKET TOTAL
Absorption (Net, SF) 1,845,041 1,896,223 2,597,432 3,028,282 4,458,588 6,717,469 8,585,650 4,073,317 596,051Avg. Asking Rent (Annual, Net, $/SF) 13.14 13.69 13.08 13.23 13.81 14.17 14.57 15.83 15.73
Delivered Construction (SF) - 1,308,509 1,526,134 1,765,103 2,123,158 4,043,582 3,619,165 3,758,095 180,000Occupancy Rate (%) 90.9 90.3 90.9 91.7 92.2 92.7 94.3 94.6 94.9

MARKETVIEW
Q1 2018 CBRE Research 3
DALLAS / FORT WORTH RETAIL
© 2018 CBRE, Inc. |
4,000
4,250
4,500
4,750
5,000
55,000
57,500
60,000
62,500
65,000
67,500
70,000
2011
2012
2013
2014
2015
2016
2017
Median HH Income Population (000s)
Figure 7: Dallas Population Growth and Purchasing PowerPopulation (000s)
Source Moody’s Analytics, Q1 2018.
HH Income ($)
Source: Real Capital Analytics, Q1 2018.
1,000
1,200
1,400
1,600
1,800
2,000
2,200
2,400
2,600
2,800
3,000
Q1 20
14Q2
2014
Q3 20
14Q4
2014
Q1 20
15Q2
2015
Q3 20
15Q4
2015
Q1 20
16Q2
2016
Q3 20
16Q4
2016
Q1 20
17Q2
2017
Q3 20
17Q4
2017
Q1 20
18
($, Millions)
Figure 6: Dallas Retail Investment Sales Volume
5.00
10.00
15.00
20.00
25.00
30.00
Q2 2015 Q4 2015 Q2 2016 Q4 2016 Q2 2017 Q4 2017
Asking Rates ($/SF)
Community Neighborhood Strip Power Lifestyle
12.50
13.00
13.50
14.00
14.50
15.00
15.50
16.00
16.50
Q1 20
13
Q3 20
13
Q1 20
14
Q3 20
14
Q1 20
15
Q3 20
15
Q1 20
16
Q3 20
16
Q1 20
17
Q3 20
17
Q1 20
18
Asking Rates ($/SF)
0
200
400
600
800
1,000
1,200
1,400
Q1 20
13
Q3 20
13
Q1 20
14
Q3 20
14
Q1 20
15
Q3 20
15
Q1 20
16
Q3 20
16
Q1 20
17
Q3 20
17
Q1 20
18
SF (000s)
Source: CBRE Research, Q1 2018.
Figure 5: Asking Annual Rents by Center Type, NNN Avg.
Figure 3: Asking Annual Rents, NNN Avg. Figure 4: Deliveries
Source: CBRE Research, Q1 2018.
Source: CBRE Research, Q1 2018.

MARKETVIEW
Disclaimer: Information contained herein, including projections, has been obtained from sources believed to be reliable. While we do not doubt its accuracy, we have not verified it and make no guarantee, warranty or representation about it. It is your responsibility to confirm independently its accuracy and completeness. This information is presented exclusively for use by CBRE clients and professionals and all rights to the material are reserved and cannot be reproduced without prior written permission of CBRE.
CONTACTS
Robert C. KrampDirector, Research & [email protected]
E. Michelle MillerResearch Operations [email protected]
Robert BasiliereSenior Research [email protected]
CBRE OFFICES
CBRE Dallas2100 McKinney Ave, Suite 700
Dallas, TX 75201
To learn more about CBRE Research,
or to access additional research reports,
please visit the Global Research Gateway
at www.cbre.com/researchgateway.
DALLAS / FORT WORTH RETAIL

MARKETVIEW
Metroplex retail sector marks
record year of occupancy growth
Dallas / Fort Worth Retail, Q4 2017
Q4 2017 CBRE Research © 2018 CBRE, Inc. | 1
Completions888,874 SF
Net Absorption1,023,290 SF
Under Construction5,829,433 SF
Source: CBRE Research, Q4 2016.
*Arrows indicate trend from previous quarter.Figure 1: Net Absorption and Market Occupancy
89
90
91
92
93
94
95
(1)
0
1
2
3
4
5
6
7
8
9
10
2007 2008 2009 2010 2011 2012 2013 2014 2015 2016 2017
Occupancy Rate (%)Net Absorption (MSF)
Q1 Q2 Q3 Q4 Total Annual Net Absorption Occupancy Rate
Source: CBRE Research, Q4 2017.
OCCUPANCY AT ALL-TIME HIGHS; MAINTAINING 94.6%; POSITIVE OUTLOOK FOR 2018
Within Dallas/Fort Worth’s tightening retail
market, strong net absorption and heavily pre-
leased deliveries caused occupancy to measure an
all-time high. The year has proven to be a strong
one for retail landlords and tenants alike, with an
expectation of positive sales growth continuing
into 2018.
CONSTRUCTION PIPELINE TIGHTENSMultiple construction projects across North Texas
have been sidelined as labor and borrowing costs
remain elevated, specifically for those in the early
stages. An increase in equity requirements and
cost of capital may result in a delay to bring these
projects to market, as well as increased tenant
sales volume expectations to appease lenders.
CLASS A BIG BOX SUPPLY REMAINS ELEVATED AS MARKET STABILIZES
As forecasted, the pace of absorption in big box
space slowed throughout 2017 when compared to
years past – even within Class A product. As seen
in other major U.S. retail markets, elevated
supply, at 813,572 million sq. ft., is due to a
smaller pool of big box retailers.
TANGER FACTORY OUTLETS, LEGACY FOOD HALL IN PLANO, AND IKEA IN GRAND PRAIRIE ALL CELEBRATE GRAND OPENINGS IN Q4 2017
Three major local developments celebrated their
grand openings recently, accounting for 702,000
sq. ft. of delivery and absorption in the Metroplex.
Tanger Factory Outlets on October 27, Legacy
Food Hall on December 6, and IKEA in Grand
Prairie on December 13.
Occupancy94.6%
MARKETVIEW
Q4 2017 CBRE Research © 2018 CBRE, Inc. | 2
Q4 2015 Q1 2016 Q2 2016 Q3 2016 Q4 2016 Q1 2017 Q2 2017 Q3 2017 Q4 2017CENTRAL DALLAS
Absorption (Net, SF) 22,115 22,856 3,356 107,800 282,632 8,458 (53,300) (30,525) 38,858Avg. Asking Rent (Annual, Net, $/SF) 29.75 29.50 31.58 25.54 25.26 24.63 24.70 23.40 22.07
Delivered Construction (SF) - 37,749 - 107,800 63,000 - - - -Occupancy Rate (%) 95.7 95.2 95.4 96.8 97.3 97.8 97.2 97.0 97.4
EAST DALLAS OUTLYINGAbsorption (Net, SF) 10,726 4,655 16,221 (4,185) (29,280) 42,356 54,036 1,378 (3,926)
Avg. Asking Rent (Annual, Net, $/SF) 22.30 23.00 21.93 19.11 20.25 19.78 20.29 20.93 20.56Delivered Construction (SF) - - - - - 87,406 - - -
Occupancy Rate (%) 97.7 98.4 98.8 98.8 98.3 96.0 95.7 96.2 97.6FAR NORTH DALLAS
Absorption (Net, SF) 237,488 566,231 748,324 567,284 199,844 19,570 280,463 302,390 26,090Avg. Asking Rent (Annual, Net, $/SF) 15.25 15.50 14.52 15.83 14.51 14.73 15.11 16.51 15.88
Delivered Construction (SF) 17,586 322,667 738,187 567,284 25,000 106,888 542,000 300,000 55,000Occupancy Rate (%) 91.4 92.0 93.6 93.0 93.4 93.2 93.5 93.4 93.4
NEAR NORTH DALLASAbsorption (Net, SF) 125,656 80,349 (54,260) 316,964 142,058 64,122 210,362 19,920 81,080
Avg. Asking Rent (Annual, Net, $/SF) 15.50 14.75 14.36 16.07 16.45 16.35 17.31 18.10 18.17Delivered Construction (SF) 107,500 - - 316,964 58,000 20,431 220,000 - -
Occupancy Rate (%) 94.1 94.3 94.8 94.7 95.2 95.0 95.2 95.4 95.6NORTH CENTRAL DALLAS
Absorption (Net, SF) 201,739 180,664 215,284 266,504 256,960 62,914 326,587 331,134 270,633Avg. Asking Rent (Annual, Net, $/SF) 16.25 16.00 17.04 17.83 17.24 17.50 19.99 22.58 20.80
Delivered Construction (SF) 70,908 101,238 - 266,504 253,599 183,563 86,365 323,000 186,874Occupancy Rate (%) 93.4 93.6 94.2 94.2 94.6 95.1 94.6 94.8 94.9
SOUTHEAST DALLASAbsorption (Net, SF) 2,052 39,748 58,787 (24,033) 34,759 (61,249) 164,121 (51,395) (57,341)
Avg. Asking Rent (Annual, Net, $/SF) 11.00 11.00 10.74 11.18 11.18 11.42 15.34 11.67 11.22Delivered Construction (SF) 11,000 - - - - 14,804 - - -
Occupancy Rate (%) 93.1 92.9 94.1 94.0 95.1 95.0 95.5 94.9 94.1SOUTHWEST DALLAS
Absorption (Net, SF) 91,008 74,056 51,427 299,631 386,969 21,919 54,983 82,763 (5,564)Avg. Asking Rent (Annual, Net, $/SF) 10.25 10.25 10.99 9.59 10.64 10.66 11.38 12.62 12.03
Delivered Construction (SF) - 76,663 - - - - - - -Occupancy Rate (%) 90.1 90.3 91.0 91.0 92.0 92.4 91.9 92.4 92.2
WEST DALLASAbsorption (Net, SF) 71,428 53,014 330,003 160,443 345,084 (79,960) 250,684 297,426 445,693
Avg. Asking Rent (Annual, Net, $/SF) 12.75 13.00 13.23 13.42 13.24 13.17 12.67 13.46 13.53Delivered Construction (SF) 41,179 - - - 40,000 10,039 - 250,000 297,000
Occupancy Rate (%) 91.6 92.3 93.7 93.0 93.3 93.4 94.8 95.0 95.5
CENTRAL FORT WORTHAbsorption (Net, SF) 141,329 72,424 197,341 303,425 182,737 (47,615) 161,418 394,718 (53,248)
Avg. Asking Rent (Annual, Net, $/SF) 12.50 12.00 11.84 11.83 12.29 12.92 12.40 12.85 12.40Delivered Construction (SF) 52,676 64,776 - 303,425 113,900 - 118,000 380,000 -
Occupancy Rate (%) 92.3 92.5 93.9 93.5 94.1 94.1 94.4 94.5 94.3MID-CITIES
Absorption (Net, SF) 385,561 249,004 201,925 196,458 498,722 143,754 99,018 15.763 (100,227)Avg. Asking Rent (Annual, Net, $/SF) 13.50 13.75 13.87 14.06 13.61 13.72 13.82 14.38 16.12
Delivered Construction (SF) 308,465 29,496 84,000 196,458 210,000 69,000 - - -Occupancy Rate (%) 94.1 94.3 94.8 94.8 94.6 94.7 95.1 95.1 95.0
SUBURBAN FORT WORTHAbsorption (Net, SF) 489,191 129,731 280,752 208,558 364,415 91,081 12,064 (139,331) 381,242
Avg. Asking Rent (Annual, Net, $/SF) 12.00 12.50 11.84 11.01 13.00 12.64 12.79 13.17 13.43Delivered Construction (SF) 487,508 87,900 85,000 208,558 85,000 55,725 102,000 - 350,000
Occupancy Rate (%) 93.6 94.0 94.6 94.7 95.1 95.2 95.0 94.6 94.6DALLAS TOTAL
Absorption (Net, SF) 762,212 1,021,582 1,369,142 1,690,408 1,619,026 78,130 1,287,936 953,091 795,523
Avg. Asking Rent (Annual, Net, $/SF) 15.10 15.7 15.13 15.68 15.31 15.37 16.30 17.18 16.51Delivered Construction (SF) 248,185 538,317 738,187 698,000 439,599 423,131 850,365 873,000 538,874
Occupancy Rate (%) 92.5 92.8 93.8 93.7 94.2 94.2 94.4 94.5 94.6FORT WORTH TOTAL
Absorption (Net, SF) 1,016,081 451,159 680,018 708,441 1,045,874 187,220 272,500 271,150 227,767Avg. Asking Rent (Annual, Net, $/SF) 12.97 12.97 12.89 12.80 13.14 13.27 13.23 13.71 14.57
Delivered Construction (SF) 848,649 182,162 169,000 445,000 408,900 124,725 220,000 380,000 350,000Occupancy Rate (%) 93.4 93.8 94.6 94.4 94.6 94.7 94.9 94.9 94.8
DFW MARKET TOTAL
Absorption (Net, SF) 1,778,293 1,472,741 2,049,160 2,398,849 2,664,900 265,350 1,560,436 1,224,241 1,023,290Avg. Asking Rent (Annual, Net, $/SF) 14.33 14.34 14.35 14.69 14.57 14.65 15.25 15.98 15.83
Delivered Construction (SF) 1,196,834 720,479 907,187 1,143,000 848,499 547,856 1,068,365 1,253,000 888,874Occupancy Rate (%) 92.7 93.2 94.1 93.9 94.3 94.4 94.6 94.6 94.6
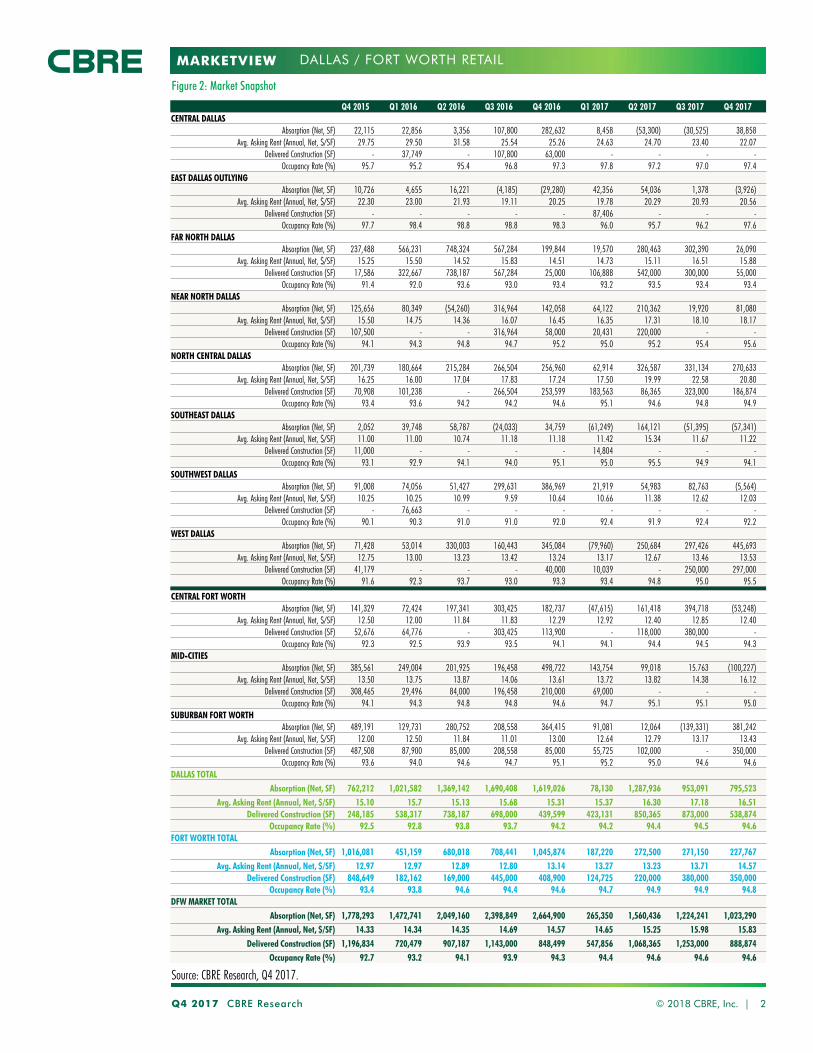
Figure 2: Market Snapshot
Source: CBRE Research, Q4 2017.
DALLAS / FORT WORTH RETAIL
MARKETVIEW
Q4 2017 CBRE Research 3
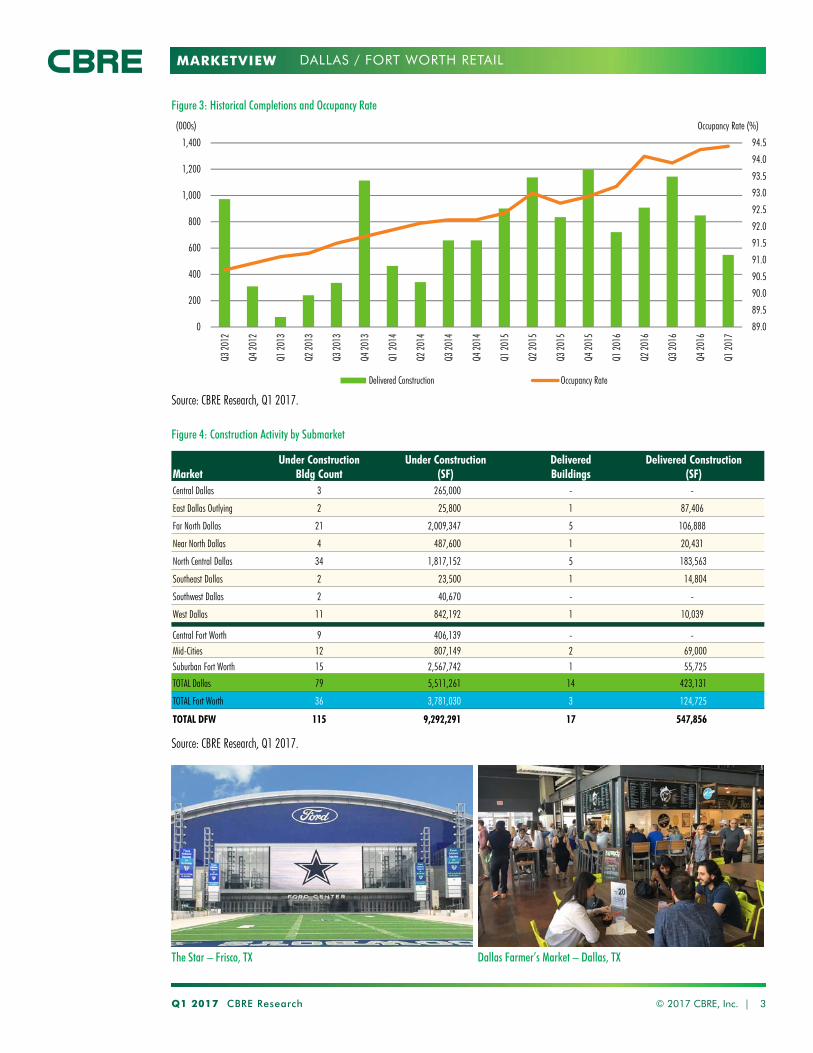
Figure 4: Construction Activity by Submarket
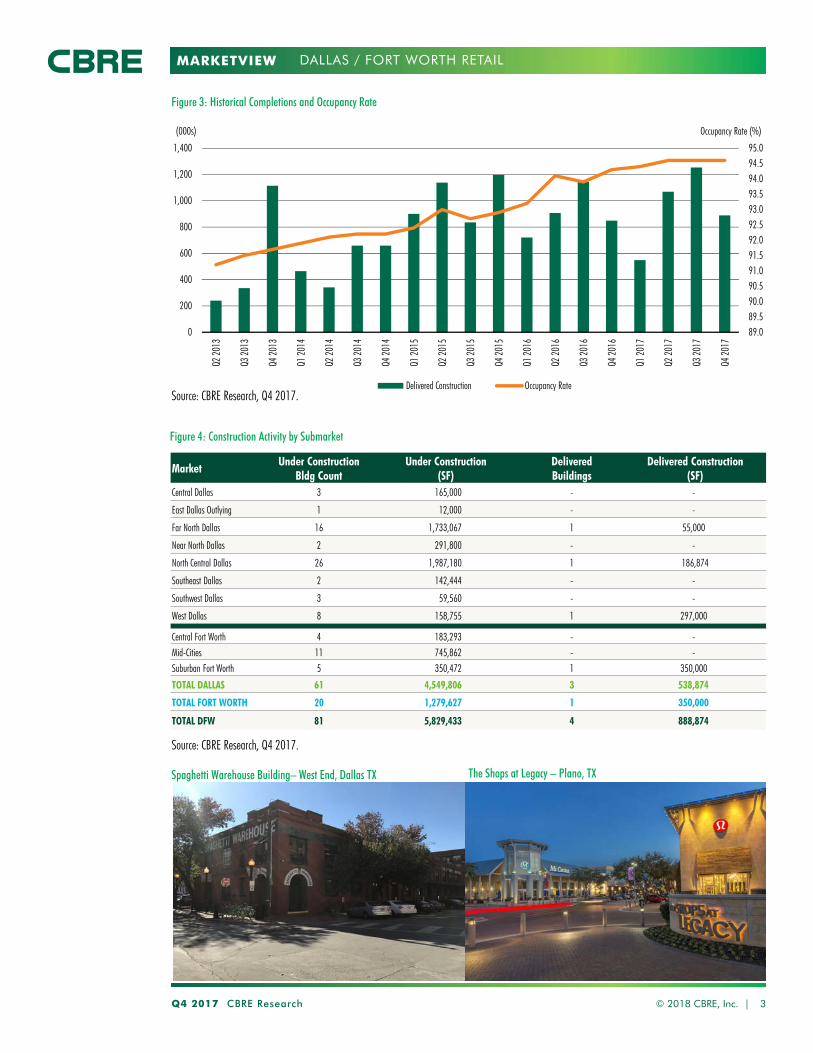
Figure 3: Historical Completions and Occupancy Rate
Source: CBRE Research, Q4 2017.
MarketUnder Construction
Bldg CountUnder Construction
(SF)DeliveredBuildings
Delivered Construction(SF)
Central Dallas 3 165,000 - -
East Dallas Outlying 1 12,000 - -
Far North Dallas 16 1,733,067 1 55,000
Near North Dallas 2 291,800 - -
North Central Dallas 26 1,987,180 1 186,874
Southeast Dallas 2 142,444 - -
Southwest Dallas 3 59,560 - -
West Dallas 8 158,755 1 297,000
Central Fort Worth 4 183,293 - -Mid-Cities 11 745,862 - -Suburban Fort Worth 5 350,472 1 350,000
TOTAL DALLAS 61 4,549,806 3 538,874
TOTAL FORT WORTH 20 1,279,627 1 350,000
TOTAL DFW 81 5,829,433 4 888,874
© 2018 CBRE, Inc. |
89.089.590.090.591.091.592.092.593.093.594.094.595.0
0
200
400
600
800
1,000
1,200
1,400
Q2 20
13
Q3 20
13
Q4 20
13
Q1 20
14
Q2 20
14
Q3 20
14
Q4 20
14
Q1 20
15
Q2 20
15
Q3 20
15
Q4 20
15
Q1 20
16
Q2 20
16
Q3 20
16
Q4 20
16
Q1 20
17
Q2 20
17
Q3 20
17
Q4 20
17
Occupancy Rate (%)(000s)
Delivered Construction Occupancy RateSource: CBRE Research, Q4 2017.
DALLAS / FORT WORTH RETAIL
Spaghetti Warehouse Building– West End, Dallas TX The Shops at Legacy – Plano, TX
MARKETVIEW
Q4 2017 CBRE Research © 2018 CBRE, Inc. | 4
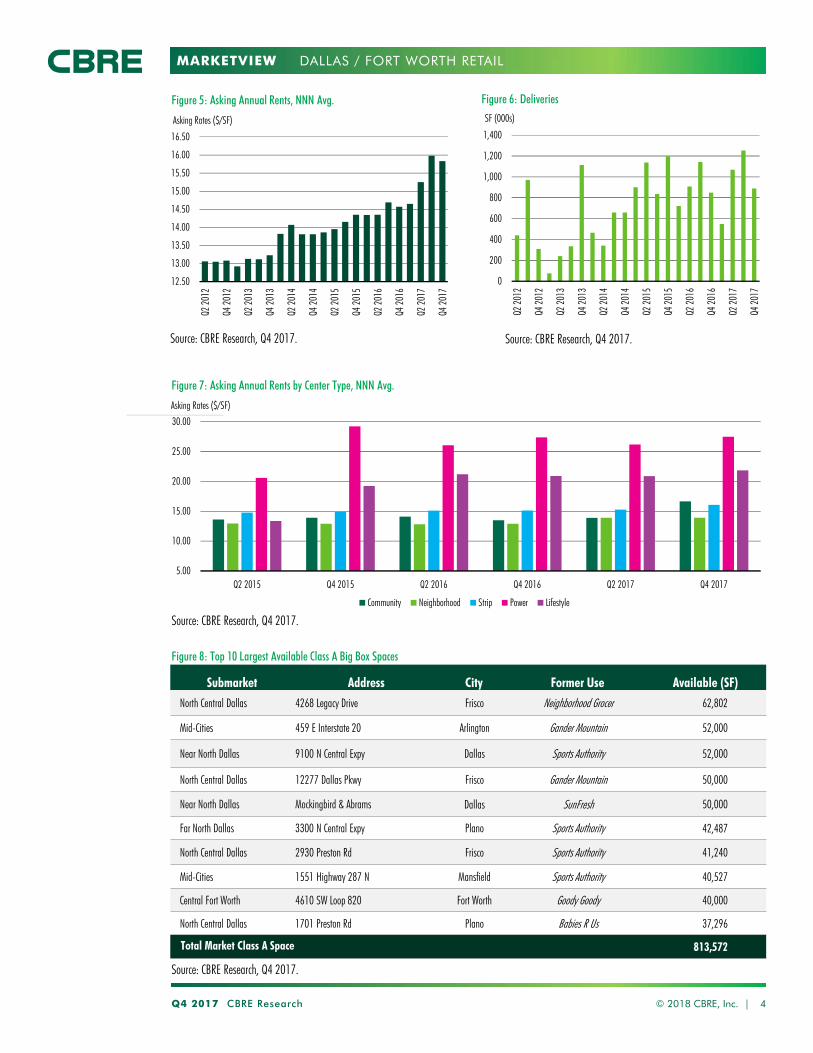
Figure 8: Top 10 Largest Available Class A Big Box Spaces
Source: CBRE Research, Q4 2017.
Submarket Address City Former Use Available (SF)
North Central Dallas 4268 Legacy Drive Frisco Neighborhood Grocer 62,802
Mid-Cities 459 E Interstate 20 Arlington Gander Mountain 52,000
Near North Dallas 9100 N Central Expy Dallas Sports Authority 52,000
North Central Dallas 12277 Dallas Pkwy Frisco Gander Mountain 50,000
Near North Dallas Mockingbird & Abrams Dallas SunFresh 50,000
Far North Dallas 3300 N Central Expy Plano Sports Authority 42,487
North Central Dallas 2930 Preston Rd Frisco Sports Authority 41,240
Mid-Cities 1551 Highway 287 N Mansfield Sports Authority 40,527
Central Fort Worth 4610 SW Loop 820 Fort Worth Goody Goody 40,000
North Central Dallas 1701 Preston Rd Plano Babies R Us 37,296
Total Market Class A Space 813,572
DALLAS / FORT WORTH RETAIL
12.50
13.00
13.50
14.00
14.50
15.00
15.50
16.00
16.50
Q2 20
12
Q4 20
12
Q2 20
13
Q4 20
13
Q2 20
14
Q4 20
14
Q2 20
15
Q4 20
15
Q2 20
16
Q4 20
16
Q2 20
17
Q4 20
17
Asking Rates ($/SF)
Figure 5: Asking Annual Rents, NNN Avg.
Source: CBRE Research, Q4 2017.
0
200
400
600
800
1,000
1,200
1,400
Q2 20
12
Q4 20
12
Q2 20
13
Q4 20
13
Q2 20
14
Q4 20
14
Q2 20
15
Q4 20
15
Q2 20
16
Q4 20
16
Q2 20
17
Q4 20
17
SF (000s)
Source: CBRE Research, Q4 2017.
Figure 6: Deliveries
Figure 7: Asking Annual Rents by Center Type, NNN Avg.
5.00
10.00
15.00
20.00
25.00
30.00
Q2 2015 Q4 2015 Q2 2016 Q4 2016 Q2 2017 Q4 2017
Asking Rates ($/SF)
Community Neighborhood Strip Power Lifestyle
Source: CBRE Research, Q4 2017.
MARKETVIEW
Disclaimer: Information contained herein, including projections, has been obtained from sources believed to be reliable. While we do not doubt its accuracy, we have not verified it and make no guarantee, warranty or representation about it. It is your responsibility to confirm independently its accuracy and completeness. This information is presented exclusively for use by CBRE clients and professionals and all rights to the material are reserved and cannot be reproduced without prior written permission of CBRE.
CONTACTS
Robert C. KrampDirector, Research & [email protected]
E. Michelle MillerResearch Operations [email protected]
Robert BasiliereSenior Research [email protected]
CBRE OFFICES
CBRE Dallas2100 McKinney Ave, Suite 700
Dallas, TX 75201
To learn more about CBRE Research,
or to access additional research reports,
please visit the Global Research Gateway
at www.cbre.com/researchgateway.
DALLAS / FORT WORTH RETAIL
MARKETVIEW
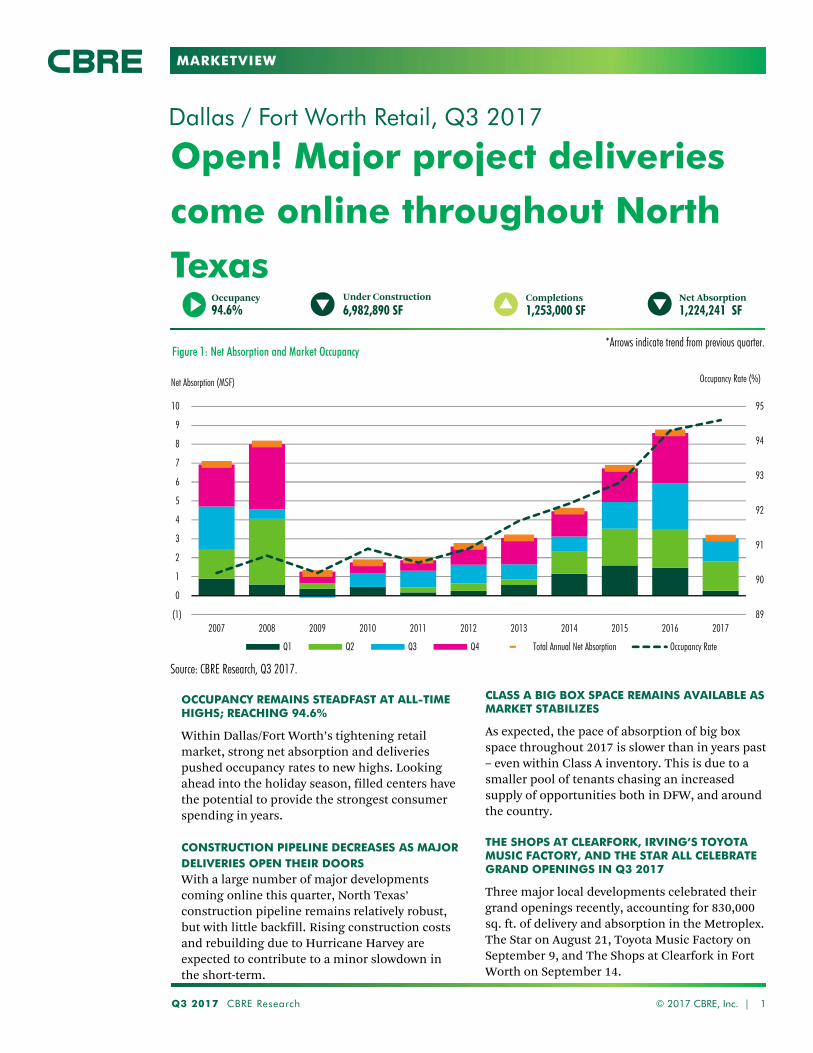
Open! Major project deliveries
come online throughout North
Texas
Dallas / Fort Worth Retail, Q3 2017
Q3 2017 CBRE Research © 2017 CBRE, Inc. | 1
Completions1,253,000 SF
Net Absorption1,224,241 SF
Under Construction6,982,890 SF
Source: CBRE Research, Q4 2016.
*Arrows indicate trend from previous quarter.Figure 1: Net Absorption and Market Occupancy
89
90
91
92
93
94
95
(1)
0
1
2
3
4
5
6
7
8
9
10
2007 2008 2009 2010 2011 2012 2013 2014 2015 2016 2017
Occupancy Rate (%)Net Absorption (MSF)
Q1 Q2 Q3 Q4 Total Annual Net Absorption Occupancy Rate
Source: CBRE Research, Q3 2017.
OCCUPANCY REMAINS STEADFAST AT ALL-TIME HIGHS; REACHING 94.6%
Within Dallas/Fort Worth’s tightening retail
market, strong net absorption and deliveries
pushed occupancy rates to new highs. Looking
ahead into the holiday season, filled centers have
the potential to provide the strongest consumer
spending in years.
CONSTRUCTION PIPELINE DECREASES AS MAJOR DELIVERIES OPEN THEIR DOORSWith a large number of major developments
coming online this quarter, North Texas’
construction pipeline remains relatively robust,
but with little backfill. Rising construction costs
and rebuilding due to Hurricane Harvey are
expected to contribute to a minor slowdown in
the short-term.
CLASS A BIG BOX SPACE REMAINS AVAILABLE AS MARKET STABILIZES
As expected, the pace of absorption of big box
space throughout 2017 is slower than in years past
– even within Class A inventory. This is due to a
smaller pool of tenants chasing an increased
supply of opportunities both in DFW, and around
the country.
THE SHOPS AT CLEARFORK, IRVING’S TOYOTA MUSIC FACTORY, AND THE STAR ALL CELEBRATE GRAND OPENINGS IN Q3 2017
Three major local developments celebrated their
grand openings recently, accounting for 830,000
sq. ft. of delivery and absorption in the Metroplex.
The Star on August 21, Toyota Music Factory on
September 9, and The Shops at Clearfork in Fort
Worth on September 14.
Occupancy94.6%
MARKETVIEW
Q3 2017 CBRE Research © 2017 CBRE, Inc. | 2
Q3 2015 Q4 2015 Q1 2016 Q2 2016 Q3 2016 Q4 2016 Q1 2017 Q2 2017 Q3 2017CENTRAL DALLAS
Absorption (Net, SF) 49,209 22,115 22,856 3,356 107,800 282,632 8,458 (53,300) (30,525)Avg. Asking Rent (Annual, Net, $/SF) 28.00 29.75 29.50 31.58 25.54 25.26 24.63 24.70 23.40
Delivered Construction (SF) 53,000 - 37,749 - 107,800 63,000 - - -Occupancy Rate (%) 95.9 95.7 95.2 95.4 96.8 97.3 97.8 97.2 97.0
EAST DALLAS OUTLYINGAbsorption (Net, SF) 5,492 10,726 4,655 16,221 (4,185) (29,280) 42,356 54,036 1,378
Avg. Asking Rent (Annual, Net, $/SF) 20.00 22.30 23.00 21.93 19.11 20.25 19.78 20.29 20.93Delivered Construction (SF) - - - - - - 87,406 - -
Occupancy Rate (%) 97.3 97.7 98.4 98.8 98.8 98.3 96.0 95.7 96.2FAR NORTH DALLAS
Absorption (Net, SF) 349,075 237,488 566,231 748,324 567,284 199,844 19,570 280,463 302,390Avg. Asking Rent (Annual, Net, $/SF) 15.25 15.25 15.50 14.52 15.83 14.51 14.73 15.11 16.51
Delivered Construction (SF) 110,715 17,586 322,667 738,187 567,284 25,000 106,888 542,000 300,000Occupancy Rate (%) 91.1 91.4 92.0 93.6 93.0 93.4 93.2 93.5 93.4
NEAR NORTH DALLASAbsorption (Net, SF) 6,192 125,656 80,349 (54,260) 316,964 142,058 64,122 210,362 19,920
Avg. Asking Rent (Annual, Net, $/SF) 15.00 15.50 14.75 14.36 16.07 16.45 16.35 17.31 18.10Delivered Construction (SF) 16,000 107,500 - - 316,964 58,000 20,431 220,000 -
Occupancy Rate (%) 94.1 94.1 94.3 94.8 94.7 95.2 95.0 95.2 95.4NORTH CENTRAL DALLAS
Absorption (Net, SF) 159,778 201,739 180,664 215,284 266,504 256,960 62,914 326,587 331,134Avg. Asking Rent (Annual, Net, $/SF) 16.00 16.25 16.00 17.04 17.83 17.24 17.50 19.99 22.58
Delivered Construction (SF) 113,780 70,908 101,238 - 266,504 253,599 183,563 86,365 323,000Occupancy Rate (%) 93.4 93.4 93.6 94.2 94.2 94.6 95.1 94.6 94.8
SOUTHEAST DALLASAbsorption (Net, SF) 28,563 2,052 39,748 58,787 (24,033) 34,759 (61,249) 164,121 (51,395)
Avg. Asking Rent (Annual, Net, $/SF) 11.00 11.00 11.00 10.74 11.18 11.18 11.42 15.34 11.67Delivered Construction (SF) - 11,000 - - - - 14,804 - -
Occupancy Rate (%) 93.3 93.1 92.9 94.1 94.0 95.1 95.0 95.5 94.9SOUTHWEST DALLAS
Absorption (Net, SF) (14,523) 91,008 74,056 51,427 299,631 386,969 21,919 54,983 82,763Avg. Asking Rent (Annual, Net, $/SF) 10.25 10.25 10.25 10.99 9.59 10.64 10.66 11.38 12.62
Delivered Construction (SF) - - 76,663 - - - - - -Occupancy Rate (%) 89.4 90.1 90.3 91.0 91.0 92.0 92.4 91.9 92.4
WEST DALLASAbsorption (Net, SF) 88,160 71,428 53,014 330,003 160,443 345,084 (79,960) 250,684 297,426
Avg. Asking Rent (Annual, Net, $/SF) 13.00 12.75 13.00 13.23 13.42 13.24 13.17 12.67 13.46Delivered Construction (SF) 31,000 41,179 - - - 40,000 10,039 - 250,000
Occupancy Rate (%) 91.6 91.6 92.3 93.7 93.0 93.3 93.4 94.8 95.0
CENTRAL FORT WORTHAbsorption (Net, SF) 72,899 141,329 72,424 197,341 303,425 182,737 (47,615) 161,418 394,718
Avg. Asking Rent (Annual, Net, $/SF) 12.50 12.50 12.00 11.84 11.83 12.29 12.92 12.40 12.85Delivered Construction (SF) 35,336 52,676 64,776 - 303,425 113,900 - 118,000 380,000
Occupancy Rate (%) 92.8 92.3 92.5 93.9 93.5 94.1 94.1 94.4 94.5MID-CITIES
Absorption (Net, SF) 491,285 385,561 249,004 201,925 196,458 498,722 143,754 99,018 15.763Avg. Asking Rent (Annual, Net, $/SF) 13.25 13.50 13.75 13.87 14.06 13.61 13.72 13.82 14.38
Delivered Construction (SF) 475,782 308,465 29,496 84,000 196,458 210,000 69,000 - -Occupancy Rate (%) 94.0 94.1 94.3 94.8 94.8 94.6 94.7 95.1 95.1
SUBURBAN FORT WORTHAbsorption (Net, SF) 172,276 489,191 129,731 280,752 208,558 364,415 91,081 12,064 (139,331)
Avg. Asking Rent (Annual, Net, $/SF) 12.00 12.00 12.50 11.84 11.01 13.00 12.64 12.79 13.17Delivered Construction (SF) - 487,508 87,900 85,000 208,558 85,000 55,725 102,000 -
Occupancy Rate (%) 93.4 93.6 94.0 94.6 94.7 95.1 95.2 95.0 94.6DALLAS TOTAL
Absorption (Net, SF) 671,946 762,212 1,021,582 1,369,142 1,690,408 1,619,026 78,130 1,287,936 953,091
Avg. Asking Rent (Annual, Net, $/SF) 14.92 15.10 15.7 15.13 15.68 15.31 15.37 16.30 17.18Delivered Construction (SF) 342,495 248,185 538,317 738,187 698,000 439,599 423,131 850,365 873,000
Occupancy Rate (%) 92.3 92.5 92.8 93.8 93.7 94.2 94.2 94.4 94.5FORT WORTH TOTAL
Absorption (Net, SF) 736,460 1,016,081 451,159 680,018 708,441 1,045,874 187,220 272,500 271,150
Avg. Asking Rent (Annual, Net, $/SF) 12.77 12.97 12.97 12.89 12.80 13.14 13.27 13.23 13.71Delivered Construction (SF) 511,118 848,649 182,162 169,000 445,000 408,900 124,725 220,000 380,000
Occupancy Rate (%) 93.4 93.4 93.8 94.6 94.4 94.6 94.7 94.9 94.9DFW MARKET TOTAL
Absorption (Net, SF) 1,408,406 1,778,293 1,472,741 2,049,160 2,398,849 2,664,900 265,350 1,560,436 1,224,241
Avg. Asking Rent (Annual, Net, $/SF) 14.17 14.33 14.34 14.35 14.69 14.57 14.65 15.25 15.98
Delivered Construction (SF) 835,613 1,196,834 720,479 907,187 1,143,000 848,499 547,856 1,068,365 1,253,000Occupancy Rate (%) 92.7 92.7 93.2 94.1 93.9 94.3 94.4 94.6 94.6
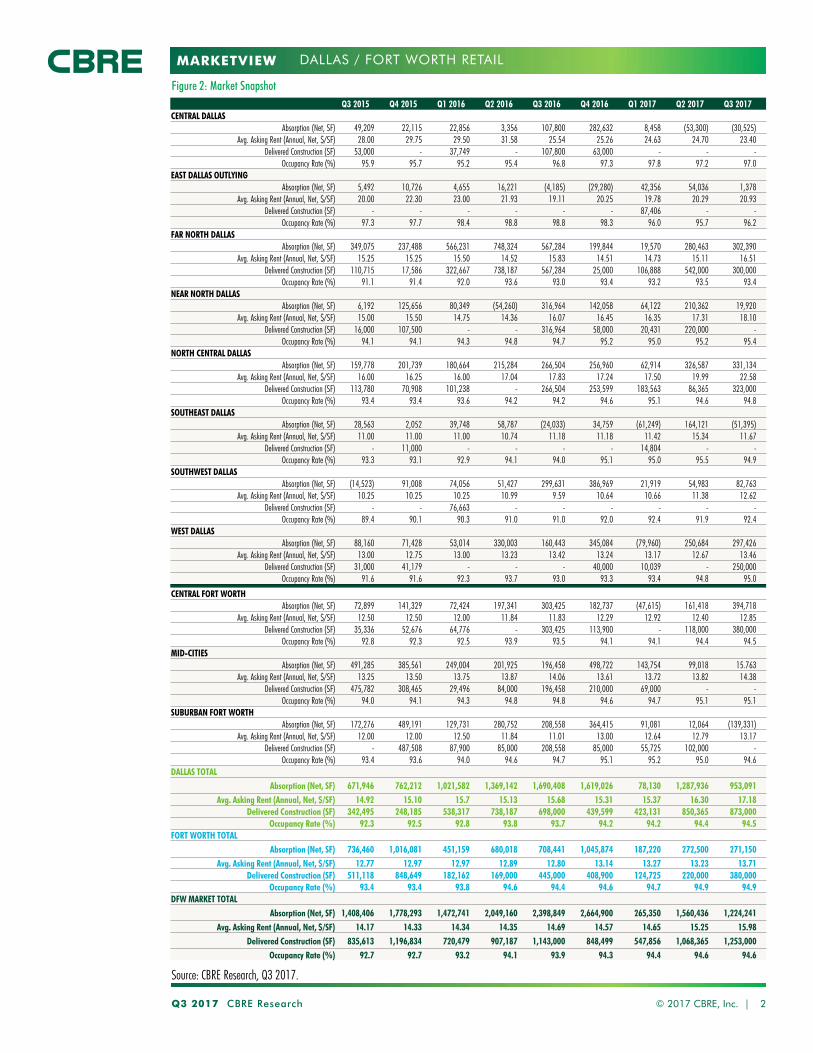
Figure 2: Market Snapshot
Source: CBRE Research, Q3 2017.
DALLAS / FORT WORTH RETAIL
MARKETVIEW
Q3 2017 CBRE Research 3
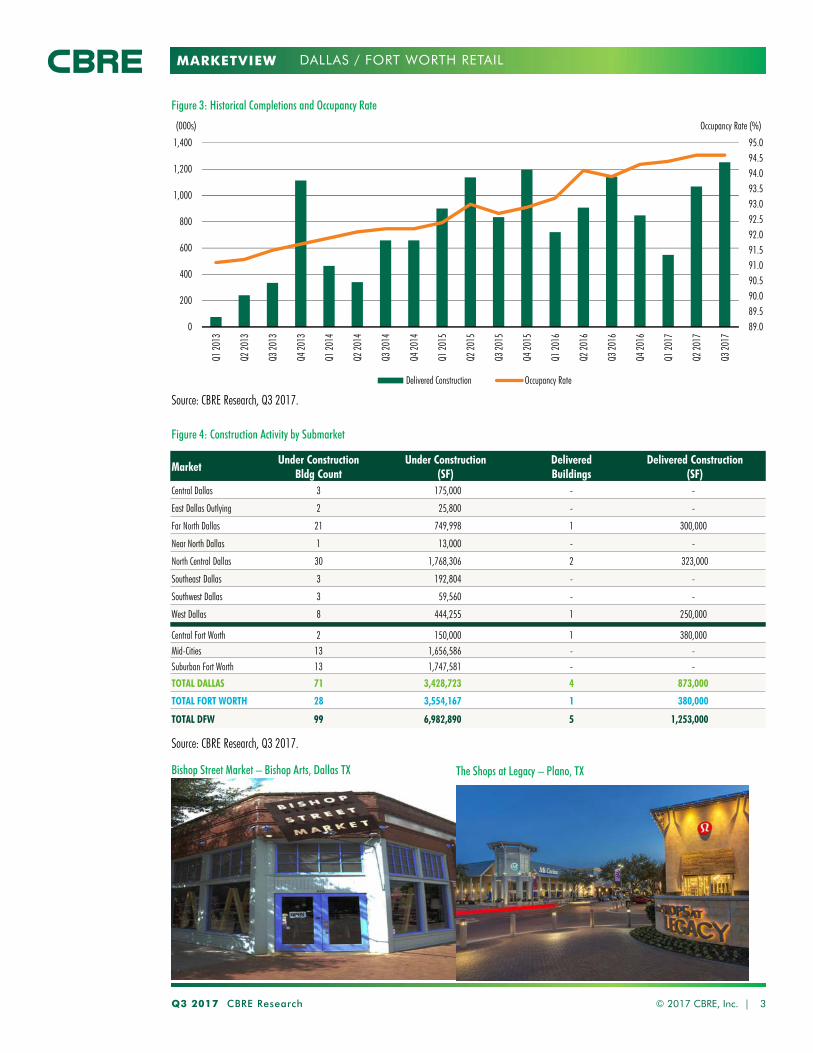
Figure 4: Construction Activity by Submarket
Figure 3: Historical Completions and Occupancy Rate
Source: CBRE Research, Q3 2017.
MarketUnder Construction
Bldg CountUnder Construction
(SF)DeliveredBuildings
Delivered Construction(SF)
Central Dallas 3 175,000 - -
East Dallas Outlying 2 25,800 - -
Far North Dallas 21 749,998 1 300,000
Near North Dallas 1 13,000 - -
North Central Dallas 30 1,768,306 2 323,000
Southeast Dallas 3 192,804 - -
Southwest Dallas 3 59,560 - -
West Dallas 8 444,255 1 250,000
Central Fort Worth 2 150,000 1 380,000Mid-Cities 13 1,656,586 - -Suburban Fort Worth 13 1,747,581 - -
TOTAL DALLAS 71 3,428,723 4 873,000
TOTAL FORT WORTH 28 3,554,167 1 380,000
TOTAL DFW 99 6,982,890 5 1,253,000
© 2017 CBRE, Inc. |
89.089.590.090.591.091.592.092.593.093.594.094.595.0
0
200
400
600
800
1,000
1,200
1,400
Q1 20
13
Q2 20
13
Q3 20
13
Q4 20
13
Q1 20
14
Q2 20
14
Q3 20
14
Q4 20
14
Q1 20
15
Q2 20
15
Q3 20
15
Q4 20
15
Q1 20
16
Q2 20
16
Q3 20
16
Q4 20
16
Q1 20
17
Q2 20
17
Q3 20
17
Occupancy Rate (%)(000s)
Delivered Construction Occupancy Rate
Source: CBRE Research, Q3 2017.
DALLAS / FORT WORTH RETAIL
The Shops at Legacy – Plano, TXBishop Street Market – Bishop Arts, Dallas TX
MARKETVIEW
Q3 2017 CBRE Research © 2017 CBRE, Inc. | 4
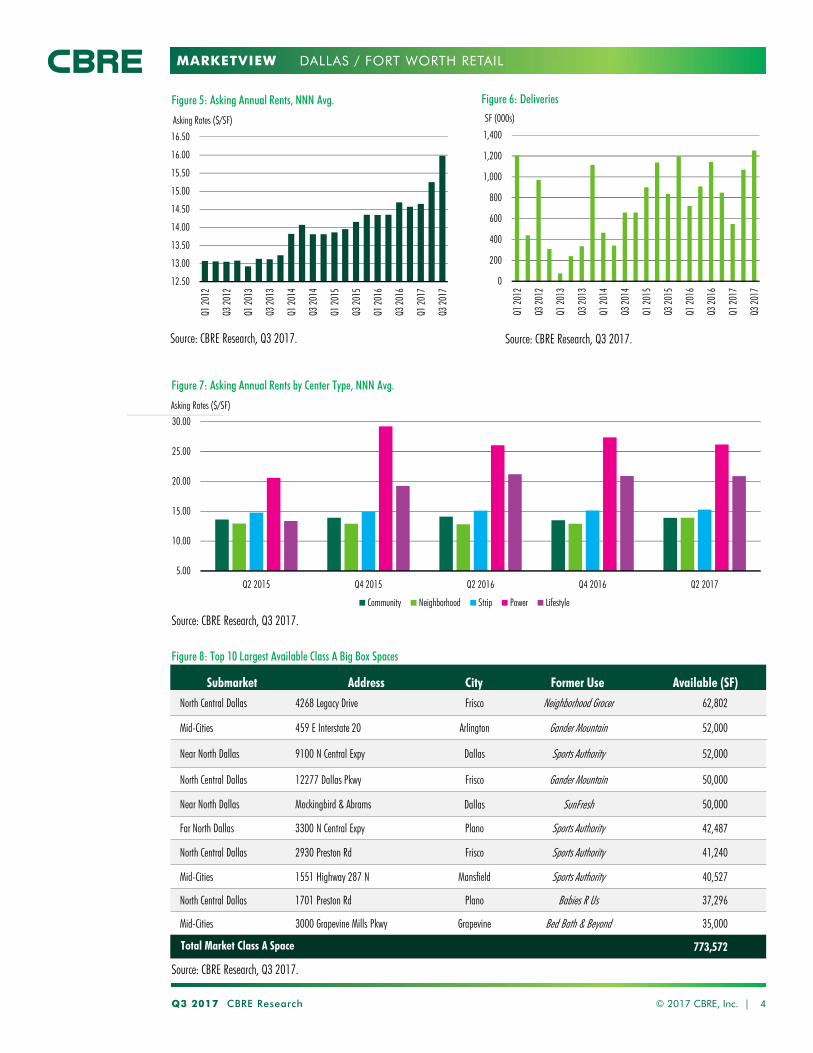
Figure 8: Top 10 Largest Available Class A Big Box Spaces
Source: CBRE Research, Q3 2017.
Submarket Address City Former Use Available (SF)
North Central Dallas 4268 Legacy Drive Frisco Neighborhood Grocer 62,802
Mid-Cities 459 E Interstate 20 Arlington Gander Mountain 52,000
Near North Dallas 9100 N Central Expy Dallas Sports Authority 52,000
North Central Dallas 12277 Dallas Pkwy Frisco Gander Mountain 50,000
Near North Dallas Mockingbird & Abrams Dallas SunFresh 50,000
Far North Dallas 3300 N Central Expy Plano Sports Authority 42,487
North Central Dallas 2930 Preston Rd Frisco Sports Authority 41,240
Mid-Cities 1551 Highway 287 N Mansfield Sports Authority 40,527
North Central Dallas 1701 Preston Rd Plano Babies R Us 37,296
Mid-Cities 3000 Grapevine Mills Pkwy Grapevine Bed Bath & Beyond 35,000
Total Market Class A Space 773,572
DALLAS / FORT WORTH RETAIL
12.50
13.00
13.50
14.00
14.50
15.00
15.50
16.00
16.50
Q1 20
12
Q3 20
12
Q1 20
13
Q3 20
13
Q1 20
14
Q3 20
14
Q1 20
15
Q3 20
15
Q1 20
16
Q3 20
16
Q1 20
17
Q3 20
17
Asking Rates ($/SF)
Figure 5: Asking Annual Rents, NNN Avg.
Source: CBRE Research, Q3 2017.
0
200
400
600
800
1,000
1,200
1,400
Q1 20
12
Q3 20
12
Q1 20
13
Q3 20
13
Q1 20
14
Q3 20
14
Q1 20
15
Q3 20
15
Q1 20
16
Q3 20
16
Q1 20
17
Q3 20
17
SF (000s)
Source: CBRE Research, Q3 2017.
Figure 6: Deliveries
Figure 7: Asking Annual Rents by Center Type, NNN Avg.
5.00
10.00
15.00
20.00
25.00
30.00
Q2 2015 Q4 2015 Q2 2016 Q4 2016 Q2 2017
Asking Rates ($/SF)
Community Neighborhood Strip Power Lifestyle
Source: CBRE Research, Q3 2017.

MARKETVIEW
Disclaimer: Information contained herein, including projections, has been obtained from sources believed to be reliable. While we do not doubt its accuracy, we have not verified it and make no guarantee, warranty or representation about it. It is your responsibility to confirm independently its accuracy and completeness. This information is presented exclusively for use by CBRE clients and professionals and all rights to the material are reserved and cannot be reproduced without prior written permission of CBRE.
CONTACTS
Robert C. KrampDirector, Research & [email protected]
E. Michelle MillerResearch Operations [email protected]
Robert BasiliereSenior Research [email protected]
CBRE OFFICES
CBRE Dallas2100 McKinney Ave, Suite 700
Dallas, TX 75201
To learn more about CBRE Research,
or to access additional research reports,
please visit the Global Research Gateway
at www.cbre.com/researchgateway.
DALLAS / FORT WORTH RETAIL
MARKETVIEW
Absorption ascends: strong
market results in demand,
project deliveries
Dallas / Fort Worth Retail, Q2 2017
Q2 2017 CBRE Research © 2017 CBRE, Inc. | 1
Completions1,068,365 SF
Net Absorption1,560,436 SF
Occupancy94.6%
Under Construction8,280,598 SF
Source: CBRE Research, Q4 2016.
*Arrows indicate trend from previous quarter.Figure 1: Net Absorption and Market Occupancy
89
90
91
92
93
94
95
(1)
0
1
2
3
4
5
6
7
8
9
10
2007 2008 2009 2010 2011 2012 2013 2014 2015 2016 2017
Occupancy Rate (%)Net Absorption (MSF)
Q1 Q2 Q3 Q4 Total Annual Net Absorption Occupancy Rate
Source: CBRE Research, Q2 2017.
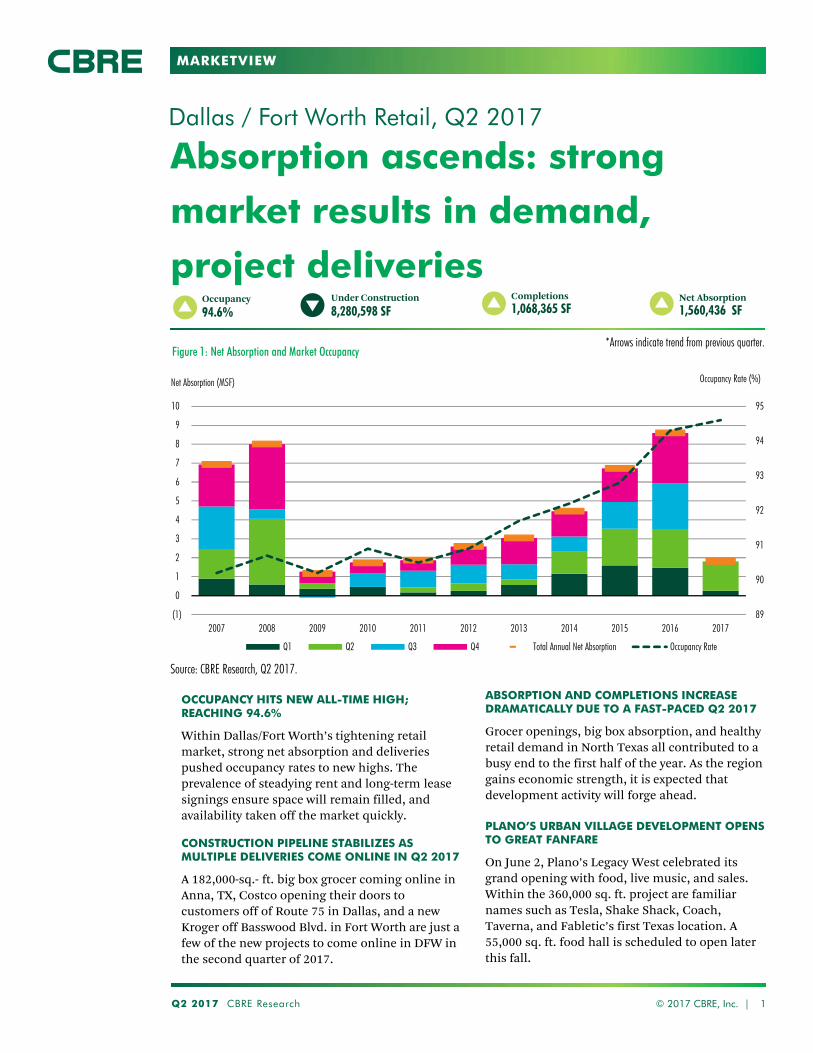
OCCUPANCY HITS NEW ALL-TIME HIGH; REACHING 94.6%
Within Dallas/Fort Worth’s tightening retail
market, strong net absorption and deliveries
pushed occupancy rates to new highs. The
prevalence of steadying rent and long-term lease
signings ensure space will remain filled, and
availability taken off the market quickly.
CONSTRUCTION PIPELINE STABILIZES AS MULTIPLE DELIVERIES COME ONLINE IN Q2 2017
A 182,000-sq.- ft. big box grocer coming online in
Anna, TX, Costco opening their doors to
customers off of Route 75 in Dallas, and a new
Kroger off Basswood Blvd. in Fort Worth are just a
few of the new projects to come online in DFW in
the second quarter of 2017.
ABSORPTION AND COMPLETIONS INCREASE DRAMATICALLY DUE TO A FAST-PACED Q2 2017
Grocer openings, big box absorption, and healthy
retail demand in North Texas all contributed to a
busy end to the first half of the year. As the region
gains economic strength, it is expected that
development activity will forge ahead.
PLANO’S URBAN VILLAGE DEVELOPMENT OPENS TO GREAT FANFARE
On June 2, Plano’s Legacy West celebrated its
grand opening with food, live music, and sales.
Within the 360,000 sq. ft. project are familiar
names such as Tesla, Shake Shack, Coach,
Taverna, and Fabletic’s first Texas location. A
55,000 sq. ft. food hall is scheduled to open later
this fall.

MARKETVIEW
Q2 2017 CBRE Research © 2017 CBRE, Inc. | 2
Q2 2015 Q3 2015 Q4 2015 Q1 2016 Q2 2016 Q3 2016 Q4 2016 Q1 2017 Q2 2017CENTRAL DALLAS
Absorption (Net, SF) 16,469 49,209 22,115 22,856 3,356 107,800 282,632 8,458 (53,300)Avg. Asking Rent (Annual, Net, $/SF) 27.41 28.00 29.75 29.50 31.58 25.54 25.26 24.63 24.70
Delivered Construction (SF) 14,063 53,000 - 37,749 - 107,800 63,000 - -Occupancy Rate (%) 96.2 95.9 95.7 95.2 95.4 96.8 97.3 97.8 97.2
EAST DALLAS OUTLYINGAbsorption (Net, SF) 79,480 5,492 10,726 4,655 16,221 (4,185) (29,280) 42,356 54,036
Avg. Asking Rent (Annual, Net, $/SF) 19.83 20.00 22.30 23.00 21.93 19.11 20.25 19.78 20.29Delivered Construction (SF) 62,000 - - - - - - 87,406 -
Occupancy Rate (%) 97.7 97.3 97.7 98.4 98.8 98.8 98.3 96.0 95.7FAR NORTH DALLAS
Absorption (Net, SF) 256,770 349,075 237,488 566,231 748,324 567,284 199,844 19,570 280,463Avg. Asking Rent (Annual, Net, $/SF) 15.34 15.25 15.25 15.50 14.52 15.83 14.51 14.73 15.11
Delivered Construction (SF) 64,133 110,715 17,586 322,667 738,187 567,284 25,000 106,888 542,000Occupancy Rate (%) 90.8 91.1 91.4 92.0 93.6 93.0 93.4 93.2 93.5
NEAR NORTH DALLASAbsorption (Net, SF) 78,111 6,192 125,656 80,349 (54,260) 316,964 142,058 64,122 210,362
Avg. Asking Rent (Annual, Net, $/SF) 14.23 15.00 15.50 14.75 14.36 16.07 16.45 16.35 17.31Delivered Construction (SF) 45,000 16,000 107,500 - - 316,964 58,000 20,431 220,000
Occupancy Rate (%) 93.0 94.1 94.1 94.3 94.8 94.7 95.2 95.0 95.2NORTH CENTRAL DALLAS
Absorption (Net, SF) 869,685 159,778 201,739 180,664 215,284 266,504 256,960 62,914 326,587Avg. Asking Rent (Annual, Net, $/SF) 15.82 16.00 16.25 16.00 17.04 17.83 17.24 17.50 19.99
Delivered Construction (SF) 580,000 113,780 70,908 101,238 - 266,504 253,599 183,563 86,365Occupancy Rate (%) 93.3 93.4 93.4 93.6 94.2 94.2 94.6 95.1 94.6
SOUTHEAST DALLASAbsorption (Net, SF) 32,795 28,563 2,052 39,748 58,787 (24,033) 34,759 (61,249) 164,121
Avg. Asking Rent (Annual, Net, $/SF) 10.91 11.00 11.00 11.00 10.74 11.18 11.18 11.42 15.34Delivered Construction (SF) - - 11,000 - - - - 14,804 -
Occupancy Rate (%) 89.9 93.3 93.1 92.9 94.1 94.0 95.1 95.0 95.5SOUTHWEST DALLAS
Absorption (Net, SF) 60,844 (14,523) 91,008 74,056 51,427 299,631 386,969 21,919 54,983Avg. Asking Rent (Annual, Net, $/SF) 10.40 10.25 10.25 10.25 10.99 9.59 10.64 10.66 11.38
Delivered Construction (SF) - - - 76,663 - - - - -Occupancy Rate (%) 89.9 89.4 90.1 90.3 91.0 91.0 92.0 92.4 91.9
WEST DALLASAbsorption (Net, SF) 205,561 88,160 71,428 53,014 330,003 160,443 345,084 (79,960) 250,684
Avg. Asking Rent (Annual, Net, $/SF) 12.81 13.00 12.75 13.00 13.23 13.42 13.24 13.17 12.67Delivered Construction (SF) 184,534 31,000 41,179 - - - 40,000 10,039 -
Occupancy Rate (%) 99.3 91.6 91.6 92.3 93.7 93.0 93.3 93.4 94.8
CENTRAL FORT WORTHAbsorption (Net, SF) 75,063 72,899 141,329 72,424 197,341 303,425 182,737 (47,615) 161,418
Avg. Asking Rent (Annual, Net, $/SF) 10.87 12.50 12.50 12.00 11.84 11.83 12.29 12.92 12.40Delivered Construction (SF) - 35,336 52,676 64,776 - 303,425 113,900 - 118,000
Occupancy Rate (%) 91.6 92.8 92.3 92.5 93.9 93.5 94.1 94.1 94.4MID-CITIES
Absorption (Net, SF) 80,712 491,285 385,561 249,004 201,925 196,458 498,722 143,754 99,018Avg. Asking Rent (Annual, Net, $/SF) 13.42 13.25 13.50 13.75 13.87 14.06 13.61 13.72 13.82
Delivered Construction (SF) 27,500 475,782 308,465 29,496 84,000 196,458 210,000 69,000 -Occupancy Rate (%) 93.8 94.0 94.1 94.3 94.8 94.8 94.6 94.7 95.1
SUBURBAN FORT WORTHAbsorption (Net, SF) 173,428 172,276 489,191 129,731 280,752 208,558 364,415 91,081 12,064
Avg. Asking Rent (Annual, Net, $/SF) 11.83 12.00 12.00 12.50 11.84 11.01 13.00 12.64 12.79Delivered Construction (SF) 133,587 - 487,508 87,900 85,000 208,558 85,000 55,725 102,000
Occupancy Rate (%) 99.2 93.4 93.6 94.0 94.6 94.7 95.1 95.2 95.0DALLAS TOTAL
Absorption (Net, SF) 1,599,715 671,946 762,212 1,021,582 1,369,142 1,690,408 1,619,026 78,130 1,287,936
Avg. Asking Rent (Annual, Net, $/SF) 14.78 14.92 15.10 15.7 15.13 15.68 15.31 15.37 16.30Delivered Construction (SF) 949,730 342,495 248,185 538,317 738,187 698,000 439,599 423,131 850,365
Occupancy Rate (%) 94.3 92.3 92.5 92.8 93.8 93.7 94.2 94.2 94.4FORT WORTH TOTAL
Absorption (Net, SF) 329,203 736,460 1,016,081 451,159 680,018 708,441 1,045,874 187,220 272,500
Avg. Asking Rent (Annual, Net, $/SF) 14.78 12.77 12.97 12.97 12.89 12.80 13.14 13.27 13.23Delivered Construction (SF) 161,087 511,118 848,649 182,162 169,000 445,000 408,900 124,725 220,000
Occupancy Rate (%) 94.5 93.4 93.4 93.8 94.6 94.4 94.6 94.7 94.9DFW MARKET TOTAL
Absorption (Net, SF) 1,928,918 1,408,406 1,778,293 1,472,741 2,049,160 2,398,849 2,664,900 265,350 1,560,436
Avg. Asking Rent (Annual, Net, $/SF) 13.95 14.17 14.33 14.34 14.35 14.69 14.57 14.65 15.25
Delivered Construction (SF) 1,110,817 835,613 1,196,834 720,479 907,187 1,143,000 848,499 547,856 1,068,365Occupancy Rate (%) 93.0 92.7 92.7 93.2 94.1 93.9 94.3 94.4 94.6
Figure 2: Market Snapshot
Source: CBRE Research, Q2 2017.
DALLAS / FORT WORTH RETAIL
MARKETVIEW
Q2 2017 CBRE Research 3
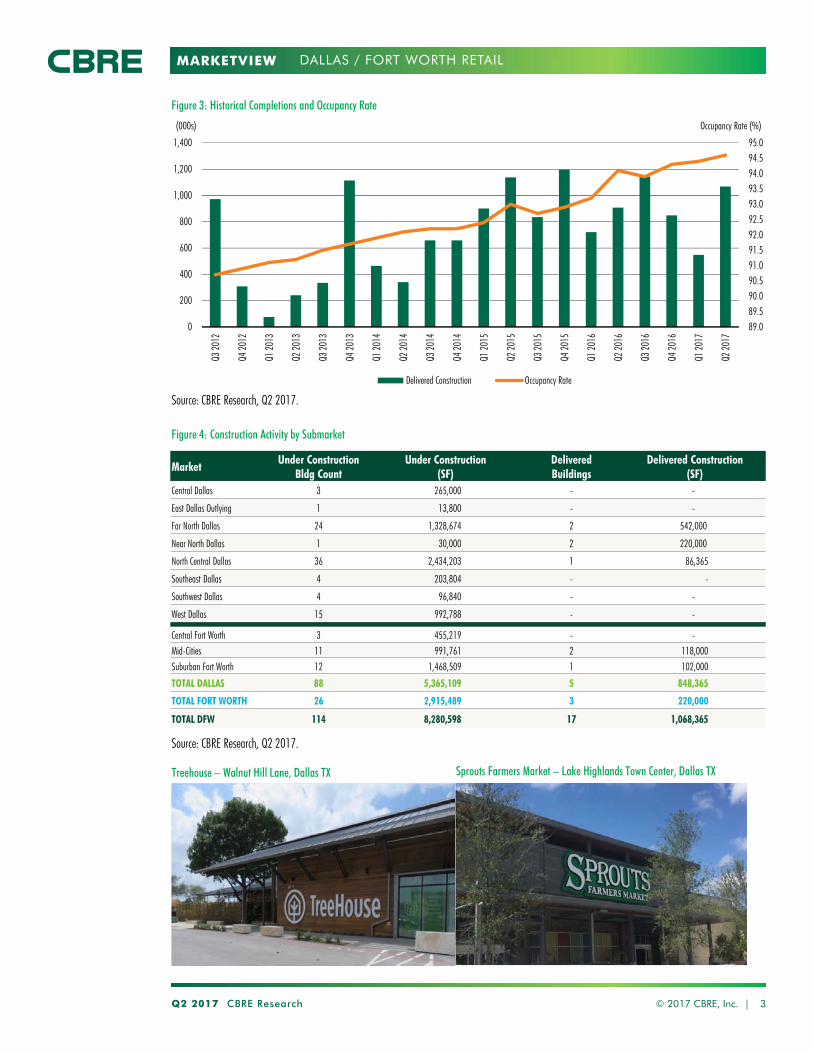
Figure 4: Construction Activity by Submarket
Figure 3: Historical Completions and Occupancy Rate
Source: CBRE Research, Q2 2017.
MarketUnder Construction
Bldg CountUnder Construction
(SF)DeliveredBuildings
Delivered Construction(SF)
Central Dallas 3 265,000 - -
East Dallas Outlying 1 13,800 - -
Far North Dallas 24 1,328,674 2 542,000
Near North Dallas 1 30,000 2 220,000
North Central Dallas 36 2,434,203 1 86,365
Southeast Dallas 4 203,804 - -
Southwest Dallas 4 96,840 - -
West Dallas 15 992,788 - -
Central Fort Worth 3 455,219 - -Mid-Cities 11 991,761 2 118,000Suburban Fort Worth 12 1,468,509 1 102,000
TOTAL DALLAS 88 5,365,109 5 848,365
TOTAL FORT WORTH 26 2,915,489 3 220,000
TOTAL DFW 114 8,280,598 17 1,068,365
© 2017 CBRE, Inc. |
89.089.590.090.591.091.592.092.593.093.594.094.595.0
0
200
400
600
800
1,000
1,200
1,400
Q3 20
12
Q4 20
12
Q1 20
13
Q2 20
13
Q3 20
13
Q4 20
13
Q1 20
14
Q2 20
14
Q3 20
14
Q4 20
14
Q1 20
15
Q2 20
15
Q3 20
15
Q4 20
15
Q1 20
16
Q2 20
16
Q3 20
16
Q4 20
16
Q1 20
17
Q2 20
17
Occupancy Rate (%)(000s)
Delivered Construction Occupancy Rate
Source: CBRE Research, Q2 2017.
DALLAS / FORT WORTH RETAIL
Sprouts Farmers Market – Lake Highlands Town Center, Dallas TXTreehouse – Walnut Hill Lane, Dallas TX
MARKETVIEW
Q2 2017 CBRE Research © 2017 CBRE, Inc. | 4
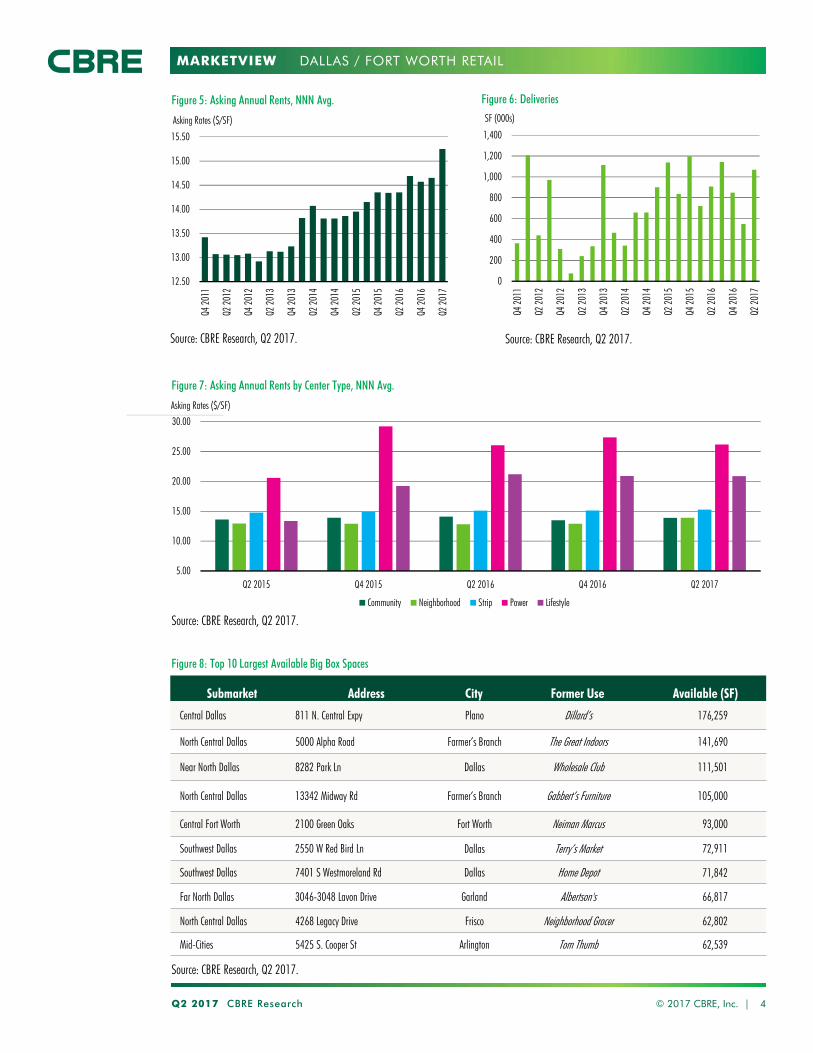
Figure 8: Top 10 Largest Available Big Box Spaces
Source: CBRE Research, Q2 2017.
Submarket Address City Former Use Available (SF)
Central Dallas 811 N. Central Expy Plano Dillard’s 176,259
North Central Dallas 5000 Alpha Road Farmer’s Branch The Great Indoors 141,690
Near North Dallas 8282 Park Ln Dallas Wholesale Club 111,501
North Central Dallas 13342 Midway Rd Farmer’s Branch Gabbert’s Furniture 105,000
Central Fort Worth 2100 Green Oaks Fort Worth Neiman Marcus 93,000
Southwest Dallas 2550 W Red Bird Ln Dallas Terry’s Market 72,911
Southwest Dallas 7401 S Westmoreland Rd Dallas Home Depot 71,842
Far North Dallas 3046-3048 Lavon Drive Garland Albertson's 66,817
North Central Dallas 4268 Legacy Drive Frisco Neighborhood Grocer 62,802
Mid-Cities 5425 S. Cooper St Arlington Tom Thumb 62,539
DALLAS / FORT WORTH RETAIL
12.50
13.00
13.50
14.00
14.50
15.00
15.50
Q4 20
11
Q2 20
12
Q4 20
12
Q2 20
13
Q4 20
13
Q2 20
14
Q4 20
14
Q2 20
15
Q4 20
15
Q2 20
16
Q4 20
16
Q2 20
17
Asking Rates ($/SF)
Figure 5: Asking Annual Rents, NNN Avg.
Source: CBRE Research, Q2 2017.
0
200
400
600
800
1,000
1,200
1,400
Q4 20
11
Q2 20
12
Q4 20
12
Q2 20
13
Q4 20
13
Q2 20
14
Q4 20
14
Q2 20
15
Q4 20
15
Q2 20
16
Q4 20
16
Q2 20
17
SF (000s)
Source: CBRE Research, Q2 2017.
Figure 6: Deliveries
Figure 7: Asking Annual Rents by Center Type, NNN Avg.
5.00
10.00
15.00
20.00
25.00
30.00
Q2 2015 Q4 2015 Q2 2016 Q4 2016 Q2 2017
Asking Rates ($/SF)
Community Neighborhood Strip Power Lifestyle
Source: CBRE Research, Q2 2017.

MARKETVIEW
Disclaimer: Information contained herein, including projections, has been obtained from sources believed to be reliable. While we do not doubt its accuracy, we have not verified it and make no guarantee, warranty or representation about it. It is your responsibility to confirm independently its accuracy and completeness. This information is presented exclusively for use by CBRE clients and professionals and all rights to the material are reserved and cannot be reproduced without prior written permission of CBRE.
CONTACTS
Robert C. KrampDirector, Research & [email protected]
E. Michelle MillerResearch Operations [email protected]
Robert BasiliereSenior Research [email protected]
CBRE OFFICES
CBRE Dallas2100 McKinney Ave, Suite 700
Dallas, TX 75201
To learn more about CBRE Research,
or to access additional research reports,
please visit the Global Research Gateway
at www.cbre.com/researchgateway.
DALLAS / FORT WORTH RETAIL
MARKETVIEW
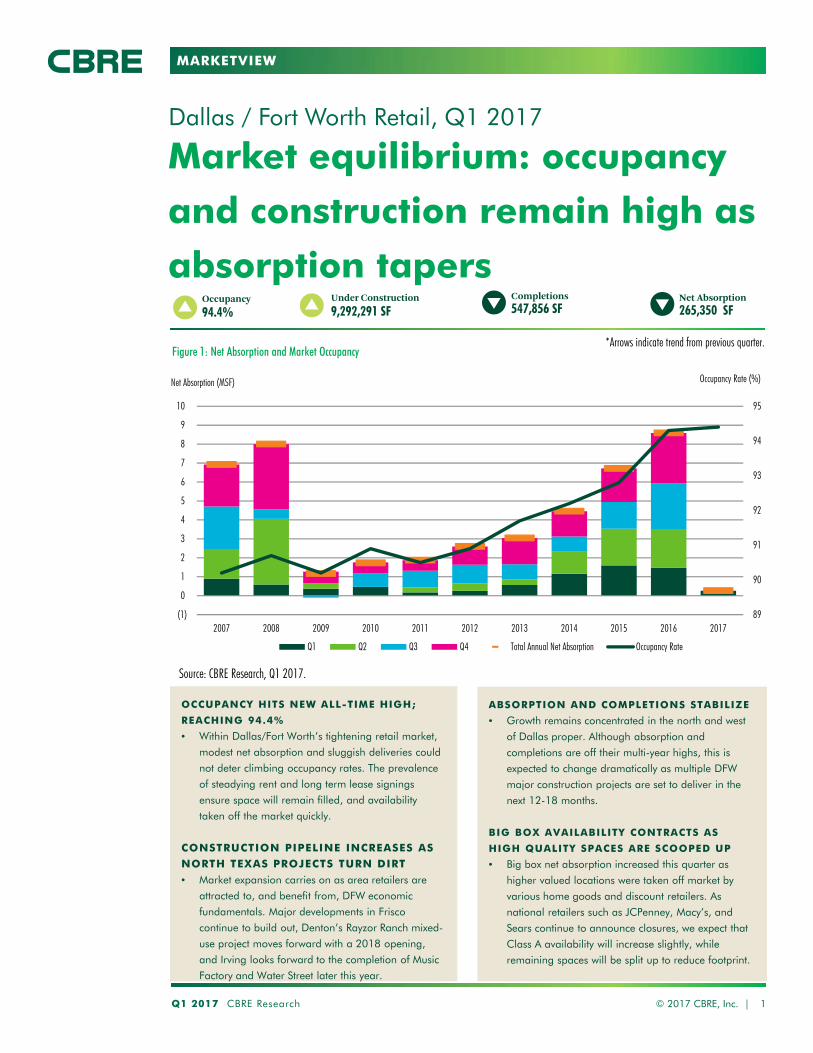
Market equilibrium: occupancy
and construction remain high as
absorption tapers
Dallas / Fort Worth Retail, Q1 2017
Q1 2017 CBRE Research © 2017 CBRE, Inc. | 1
Completions547,856 SF
Net Absorption265,350 SF
Occupancy94.4%
Under Construction9,292,291 SF
Source: CBRE Research, Q4 2016.
*Arrows indicate trend from previous quarter.Figure 1: Net Absorption and Market Occupancy
89
90
91
92
93
94
95
(1)
0
1
2
3
4
5
6
7
8
9
10
2007 2008 2009 2010 2011 2012 2013 2014 2015 2016 2017
Occupancy Rate (%)Net Absorption (MSF)
Q1 Q2 Q3 Q4 Total Annual Net Absorption Occupancy Rate
Source: CBRE Research, Q1 2017.
OCCUPANCY HITS NEW ALL-TIME HIGH;
REACHING 94.4%
• Within Dallas/Fort Worth’s tightening retail market,
modest net absorption and sluggish deliveries could
not deter climbing occupancy rates. The prevalence
of steadying rent and long term lease signings
ensure space will remain filled, and availability
taken off the market quickly.
CONSTRUCTION PIPELINE INCREASES AS
NORTH TEXAS PROJECTS TURN DIRT
• Market expansion carries on as area retailers are
attracted to, and benefit from, DFW economic
fundamentals. Major developments in Frisco
continue to build out, Denton’s Rayzor Ranch mixed-
use project moves forward with a 2018 opening,
and Irving looks forward to the completion of Music
Factory and Water Street later this year.
ABSORPTION AND COMPLETIONS STABILIZE
• Growth remains concentrated in the north and west
of Dallas proper. Although absorption and
completions are off their multi-year highs, this is
expected to change dramatically as multiple DFW
major construction projects are set to deliver in the
next 12-18 months.
BIG BOX AVAILABILITY CONTRACTS AS
HIGH QUALITY SPACES ARE SCOOPED UP
• Big box net absorption increased this quarter as
higher valued locations were taken off market by
various home goods and discount retailers. As
national retailers such as JCPenney, Macy’s, and
Sears continue to announce closures, we expect that
Class A availability will increase slightly, while
remaining spaces will be split up to reduce footprint.
MARKETVIEW
Q1 2017 CBRE Research © 2017 CBRE, Inc. | 2
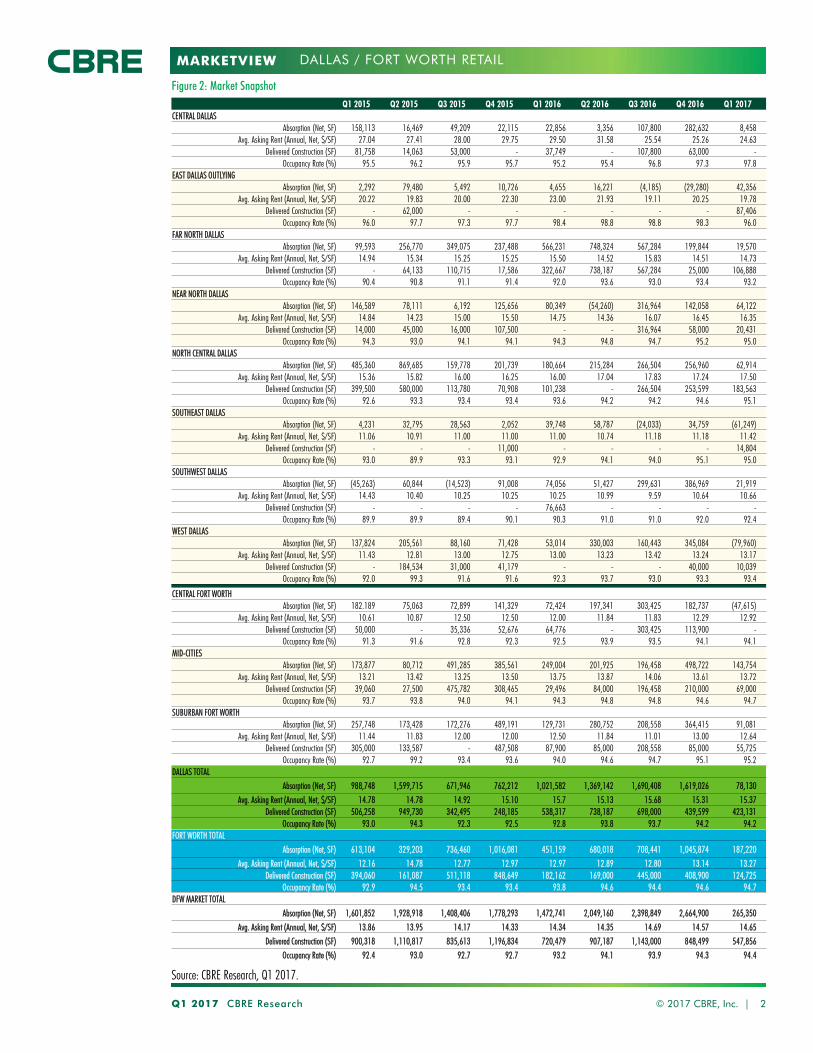
Q1 2015 Q2 2015 Q3 2015 Q4 2015 Q1 2016 Q2 2016 Q3 2016 Q4 2016 Q1 2017CENTRAL DALLAS
Absorption (Net, SF) 158,113 16,469 49,209 22,115 22,856 3,356 107,800 282,632 8,458Avg. Asking Rent (Annual, Net, $/SF) 27.04 27.41 28.00 29.75 29.50 31.58 25.54 25.26 24.63
Delivered Construction (SF) 81,758 14,063 53,000 - 37,749 - 107,800 63,000 -Occupancy Rate (%) 95.5 96.2 95.9 95.7 95.2 95.4 96.8 97.3 97.8
EAST DALLAS OUTLYINGAbsorption (Net, SF) 2,292 79,480 5,492 10,726 4,655 16,221 (4,185) (29,280) 42,356
Avg. Asking Rent (Annual, Net, $/SF) 20.22 19.83 20.00 22.30 23.00 21.93 19.11 20.25 19.78Delivered Construction (SF) - 62,000 - - - - - - 87,406
Occupancy Rate (%) 96.0 97.7 97.3 97.7 98.4 98.8 98.8 98.3 96.0FAR NORTH DALLAS
Absorption (Net, SF) 99,593 256,770 349,075 237,488 566,231 748,324 567,284 199,844 19,570Avg. Asking Rent (Annual, Net, $/SF) 14.94 15.34 15.25 15.25 15.50 14.52 15.83 14.51 14.73
Delivered Construction (SF) - 64,133 110,715 17,586 322,667 738,187 567,284 25,000 106,888Occupancy Rate (%) 90.4 90.8 91.1 91.4 92.0 93.6 93.0 93.4 93.2
NEAR NORTH DALLASAbsorption (Net, SF) 146,589 78,111 6,192 125,656 80,349 (54,260) 316,964 142,058 64,122
Avg. Asking Rent (Annual, Net, $/SF) 14.84 14.23 15.00 15.50 14.75 14.36 16.07 16.45 16.35Delivered Construction (SF) 14,000 45,000 16,000 107,500 - - 316,964 58,000 20,431
Occupancy Rate (%) 94.3 93.0 94.1 94.1 94.3 94.8 94.7 95.2 95.0NORTH CENTRAL DALLAS
Absorption (Net, SF) 485,360 869,685 159,778 201,739 180,664 215,284 266,504 256,960 62,914Avg. Asking Rent (Annual, Net, $/SF) 15.36 15.82 16.00 16.25 16.00 17.04 17.83 17.24 17.50
Delivered Construction (SF) 399,500 580,000 113,780 70,908 101,238 - 266,504 253,599 183,563Occupancy Rate (%) 92.6 93.3 93.4 93.4 93.6 94.2 94.2 94.6 95.1
SOUTHEAST DALLASAbsorption (Net, SF) 4,231 32,795 28,563 2,052 39,748 58,787 (24,033) 34,759 (61,249)
Avg. Asking Rent (Annual, Net, $/SF) 11.06 10.91 11.00 11.00 11.00 10.74 11.18 11.18 11.42Delivered Construction (SF) - - - 11,000 - - - - 14,804
Occupancy Rate (%) 93.0 89.9 93.3 93.1 92.9 94.1 94.0 95.1 95.0SOUTHWEST DALLAS
Absorption (Net, SF) (45,263) 60,844 (14,523) 91,008 74,056 51,427 299,631 386,969 21,919Avg. Asking Rent (Annual, Net, $/SF) 14.43 10.40 10.25 10.25 10.25 10.99 9.59 10.64 10.66
Delivered Construction (SF) - - - - 76,663 - - - -Occupancy Rate (%) 89.9 89.9 89.4 90.1 90.3 91.0 91.0 92.0 92.4
WEST DALLASAbsorption (Net, SF) 137,824 205,561 88,160 71,428 53,014 330,003 160,443 345,084 (79,960)
Avg. Asking Rent (Annual, Net, $/SF) 11.43 12.81 13.00 12.75 13.00 13.23 13.42 13.24 13.17Delivered Construction (SF) - 184,534 31,000 41,179 - - - 40,000 10,039
Occupancy Rate (%) 92.0 99.3 91.6 91.6 92.3 93.7 93.0 93.3 93.4
CENTRAL FORT WORTHAbsorption (Net, SF) 182.189 75,063 72,899 141,329 72,424 197,341 303,425 182,737 (47,615)
Avg. Asking Rent (Annual, Net, $/SF) 10.61 10.87 12.50 12.50 12.00 11.84 11.83 12.29 12.92Delivered Construction (SF) 50,000 - 35,336 52,676 64,776 - 303,425 113,900 -
Occupancy Rate (%) 91.3 91.6 92.8 92.3 92.5 93.9 93.5 94.1 94.1MID-CITIES
Absorption (Net, SF) 173,877 80,712 491,285 385,561 249,004 201,925 196,458 498,722 143,754Avg. Asking Rent (Annual, Net, $/SF) 13.21 13.42 13.25 13.50 13.75 13.87 14.06 13.61 13.72
Delivered Construction (SF) 39,060 27,500 475,782 308,465 29,496 84,000 196,458 210,000 69,000Occupancy Rate (%) 93.7 93.8 94.0 94.1 94.3 94.8 94.8 94.6 94.7
SUBURBAN FORT WORTHAbsorption (Net, SF) 257,748 173,428 172,276 489,191 129,731 280,752 208,558 364,415 91,081
Avg. Asking Rent (Annual, Net, $/SF) 11.44 11.83 12.00 12.00 12.50 11.84 11.01 13.00 12.64Delivered Construction (SF) 305,000 133,587 - 487,508 87,900 85,000 208,558 85,000 55,725
Occupancy Rate (%) 92.7 99.2 93.4 93.6 94.0 94.6 94.7 95.1 95.2DALLAS TOTAL
Absorption (Net, SF) 988,748 1,599,715 671,946 762,212 1,021,582 1,369,142 1,690,408 1,619,026 78,130
Avg. Asking Rent (Annual, Net, $/SF) 14.78 14.78 14.92 15.10 15.7 15.13 15.68 15.31 15.37Delivered Construction (SF) 506,258 949,730 342,495 248,185 538,317 738,187 698,000 439,599 423,131
Occupancy Rate (%) 93.0 94.3 92.3 92.5 92.8 93.8 93.7 94.2 94.2FORT WORTH TOTAL
Absorption (Net, SF) 613,104 329,203 736,460 1,016,081 451,159 680,018 708,441 1,045,874 187,220
Avg. Asking Rent (Annual, Net, $/SF) 12.16 14.78 12.77 12.97 12.97 12.89 12.80 13.14 13.27Delivered Construction (SF) 394,060 161,087 511,118 848,649 182,162 169,000 445,000 408,900 124,725
Occupancy Rate (%) 92.9 94.5 93.4 93.4 93.8 94.6 94.4 94.6 94.7DFW MARKET TOTAL
Absorption (Net, SF) 1,601,852 1,928,918 1,408,406 1,778,293 1,472,741 2,049,160 2,398,849 2,664,900 265,350
Avg. Asking Rent (Annual, Net, $/SF) 13.86 13.95 14.17 14.33 14.34 14.35 14.69 14.57 14.65
Delivered Construction (SF) 900,318 1,110,817 835,613 1,196,834 720,479 907,187 1,143,000 848,499 547,856Occupancy Rate (%) 92.4 93.0 92.7 92.7 93.2 94.1 93.9 94.3 94.4
Figure 2: Market Snapshot
Source: CBRE Research, Q1 2017.
DALLAS / FORT WORTH RETAIL
MARKETVIEW
Q1 2017 CBRE Research 3
Figure 4: Construction Activity by Submarket
Figure 3: Historical Completions and Occupancy Rate
Source: CBRE Research, Q1 2017.
MarketUnder Construction
Bldg CountUnder Construction
(SF)DeliveredBuildings
Delivered Construction(SF)
Central Dallas 3 265,000 - -
East Dallas Outlying 2 25,800 1 87,406
Far North Dallas 21 2,009,347 5 106,888
Near North Dallas 4 487,600 1 20,431
North Central Dallas 34 1,817,152 5 183,563
Southeast Dallas 2 23,500 1 14,804
Southwest Dallas 2 40,670 - -
West Dallas 11 842,192 1 10,039
Central Fort Worth 9 406,139 - -Mid-Cities 12 807,149 2 69,000Suburban Fort Worth 15 2,567,742 1 55,725
TOTAL Dallas 79 5,511,261 14 423,131
TOTAL Fort Worth 36 3,781,030 3 124,725
TOTAL DFW 115 9,292,291 17 547,856
© 2017 CBRE, Inc. |
89.0
89.5
90.0
90.5
91.0
91.5
92.0
92.5
93.0
93.5
94.0
94.5
0
200
400
600
800
1,000
1,200
1,400
Q3 20
12
Q4 20
12
Q1 20
13
Q2 20
13
Q3 20
13
Q4 20
13
Q1 20
14
Q2 20
14
Q3 20
14
Q4 20
14
Q1 20
15
Q2 20
15
Q3 20
15
Q4 20
15
Q1 20
16
Q2 20
16
Q3 20
16
Q4 20
16
Q1 20
17
Occupancy Rate (%)(000s)
Delivered Construction Occupancy Rate
Source: CBRE Research, Q1 2017.
DALLAS / FORT WORTH RETAIL
The Star – Frisco, TX Dallas Farmer’s Market – Dallas, TX
MARKETVIEW
Q1 2017 CBRE Research © 2017 CBRE, Inc. | 4
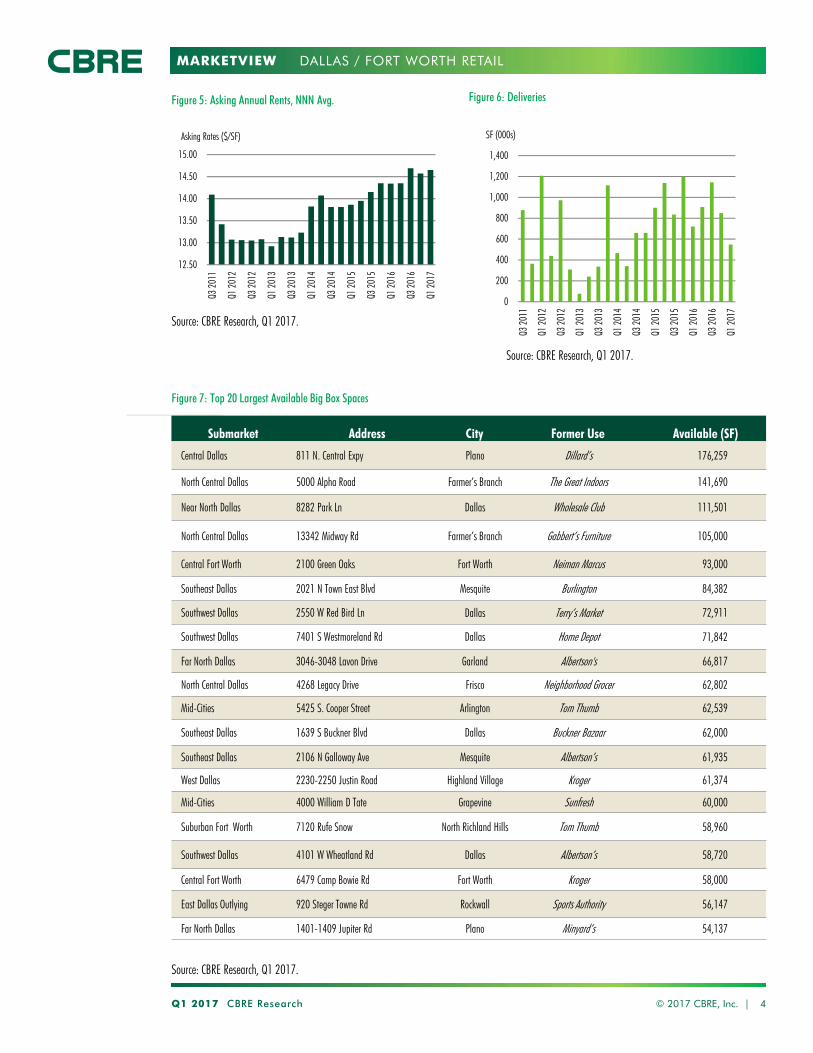
Figure 7: Top 20 Largest Available Big Box Spaces
Source: CBRE Research, Q1 2017.
Submarket Address City Former Use Available (SF)
Central Dallas 811 N. Central Expy Plano Dillard’s 176,259
North Central Dallas 5000 Alpha Road Farmer’s Branch The Great Indoors 141,690
Near North Dallas 8282 Park Ln Dallas Wholesale Club 111,501
North Central Dallas 13342 Midway Rd Farmer’s Branch Gabbert’s Furniture 105,000
Central Fort Worth 2100 Green Oaks Fort Worth Neiman Marcus 93,000
Southeast Dallas 2021 N Town East Blvd Mesquite Burlington 84,382
Southwest Dallas 2550 W Red Bird Ln Dallas Terry’s Market 72,911
Southwest Dallas 7401 S Westmoreland Rd Dallas Home Depot 71,842
Far North Dallas 3046-3048 Lavon Drive Garland Albertson's 66,817
North Central Dallas 4268 Legacy Drive Frisco Neighborhood Grocer 62,802
Mid-Cities 5425 S. Cooper Street Arlington Tom Thumb 62,539
Southeast Dallas 1639 S Buckner Blvd Dallas Buckner Bazaar 62,000
Southeast Dallas 2106 N Galloway Ave Mesquite Albertson’s 61,935
West Dallas 2230-2250 Justin Road Highland Village Kroger 61,374
Mid-Cities 4000 William D Tate Grapevine Sunfresh 60,000
Suburban Fort Worth 7120 Rufe Snow North Richland Hills Tom Thumb 58,960
Southwest Dallas 4101 W Wheatland Rd Dallas Albertson’s 58,720
Central Fort Worth 6479 Camp Bowie Rd Fort Worth Kroger 58,000
East Dallas Outlying 920 Steger Towne Rd Rockwall Sports Authority 56,147
Far North Dallas 1401-1409 Jupiter Rd Plano Minyard’s 54,137
DALLAS / FORT WORTH RETAIL
12.50
13.00
13.50
14.00
14.50
15.00
Q3 20
11
Q1 20
12
Q3 20
12
Q1 20
13
Q3 20
13
Q1 20
14
Q3 20
14
Q1 20
15
Q3 20
15
Q1 20
16
Q3 20
16
Q1 20
17
Asking Rates ($/SF)
Figure 5: Asking Annual Rents, NNN Avg.
Source: CBRE Research, Q1 2017.
0
200
400
600
800
1,000
1,200
1,400
Q3 20
11
Q1 20
12
Q3 20
12
Q1 20
13
Q3 20
13
Q1 20
14
Q3 20
14
Q1 20
15
Q3 20
15
Q1 20
16
Q3 20
16
Q1 20
17
SF (000s)
Source: CBRE Research, Q1 2017.
Figure 6: Deliveries

MARKETVIEW
Disclaimer: Information contained herein, including projections, has been obtained from sources believed to be reliable. While we do not doubt its accuracy, we have not verified it and make no guarantee, warranty or representation about it. It is your responsibility to confirm independently its accuracy and completeness. This information is presented exclusively for use by CBRE clients and professionals and all rights to the material are reserved and cannot be reproduced without prior written permission of CBRE.
CONTACTS
Robert C. KrampDirector, Research & [email protected]
E. Michelle MillerResearch Operations [email protected]
Robert BasiliereSenior Research [email protected]
CBRE OFFICES
CBRE Dallas2100 McKinney Ave, Suite 700
Dallas, TX 75201
To learn more about CBRE Research,
or to access additional research reports,
please visit the Global Research Gateway
at www.cbre.com/researchgateway.
DALLAS / FORT WORTH RETAIL
MARKETVIEW
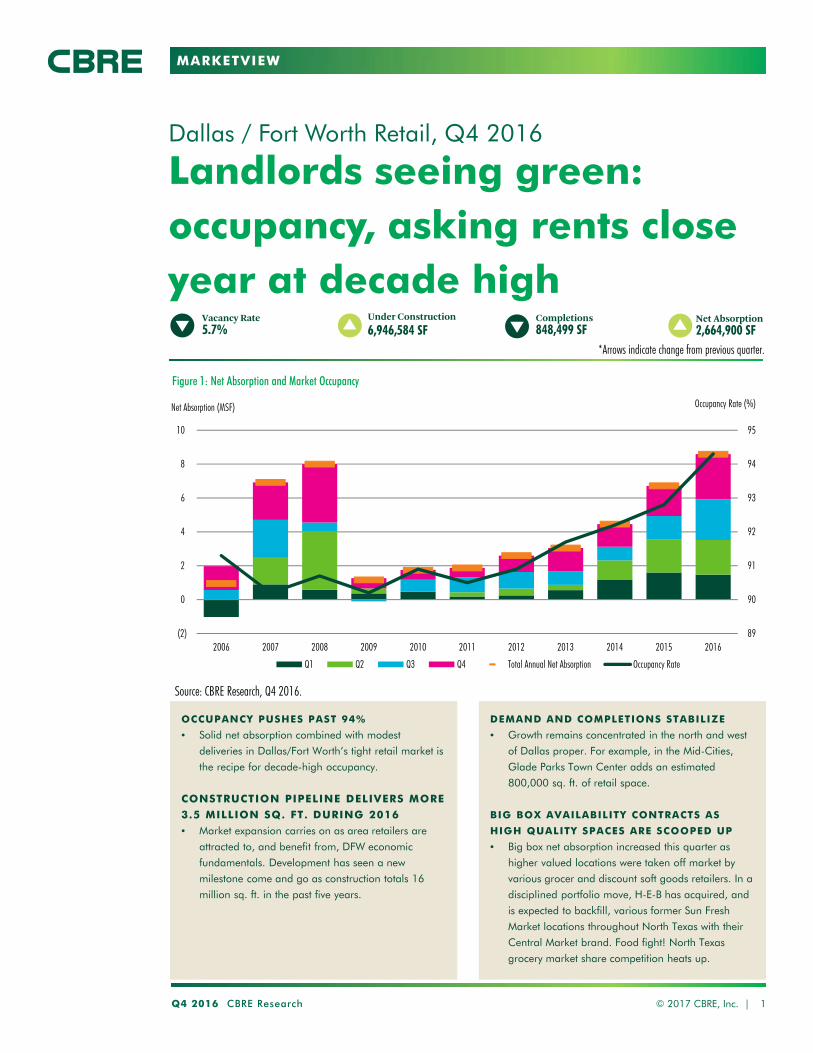
Landlords seeing green: occupancy, asking rents close year at decade high
Dallas / Fort Worth Retail, Q4 2016
Q4 2016 CBRE Research © 2017 CBRE, Inc. | 1
Vacancy Rate5.7%
*Arrows indicate change from previous quarter.
Under Construction6,946,584 SF
Completions848,499 SF
Net Absorption2,664,900 SF
OCCUPANCY PUSHES PAST 94%
• Solid net absorption combined with modest
deliveries in Dallas/Fort Worth’s tight retail market is
the recipe for decade-high occupancy.
CONSTRUCTION PIPELINE DELIVERS MORE
3.5 MILLION SQ. FT. DURING 2016
• Market expansion carries on as area retailers are
attracted to, and benefit from, DFW economic
fundamentals. Development has seen a new
milestone come and go as construction totals 16
million sq. ft. in the past five years.
Figure 1: Net Absorption and Market Occupancy
Source: CBRE Research, Q4 2016.
DEMAND AND COMPLETIONS STABILIZE
• Growth remains concentrated in the north and west
of Dallas proper. For example, in the Mid-Cities,
Glade Parks Town Center adds an estimated
800,000 sq. ft. of retail space.
BIG BOX AVAILABILITY CONTRACTS AS
HIGH QUALITY SPACES ARE SCOOPED UP
• Big box net absorption increased this quarter as
higher valued locations were taken off market by
various grocer and discount soft goods retailers. In a
disciplined portfolio move, H-E-B has acquired, and
is expected to backfill, various former Sun Fresh
Market locations throughout North Texas with their
Central Market brand. Food fight! North Texas
grocery market share competition heats up.
89
90
91
92
93
94
95
(2)
0
2
4
6
8
10
2006 2007 2008 2009 2010 2011 2012 2013 2014 2015 2016
Occupancy Rate (%)Net Absorption (MSF)
Q1 Q2 Q3 Q4 Total Annual Net Absorption Occupancy Rate
MARKETVIEW
Q4 2016 CBRE Research © 2017 CBRE, Inc. | 2
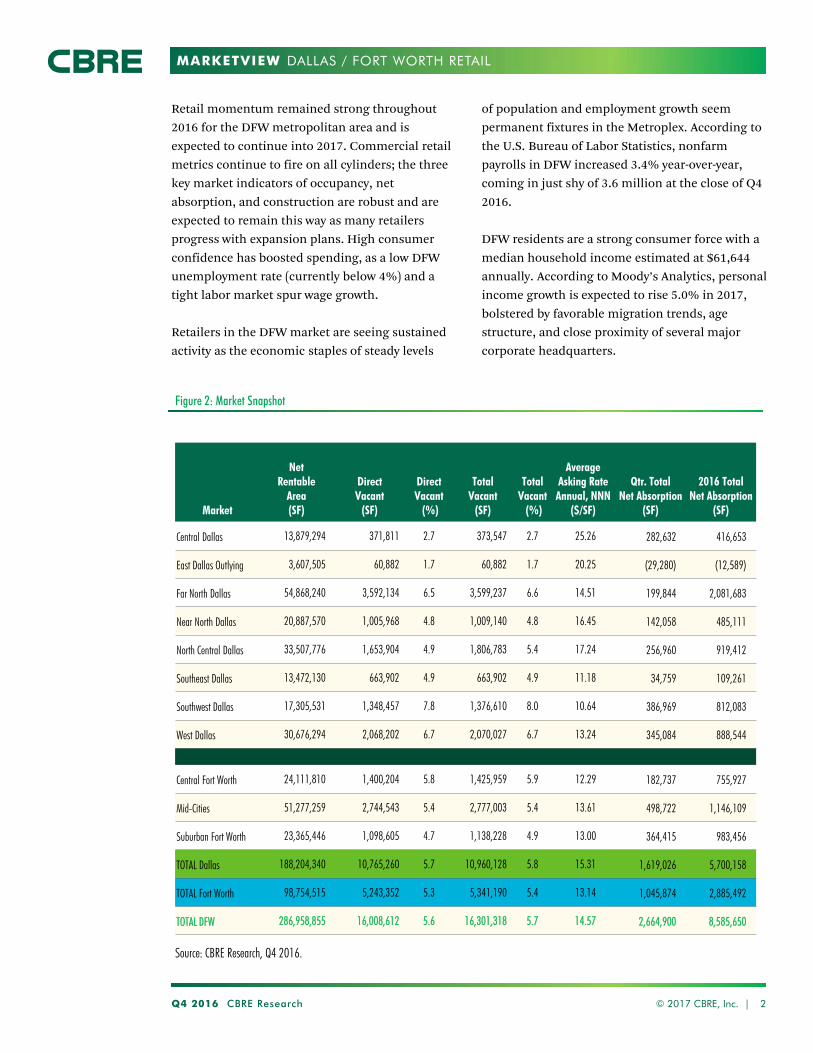
Figure 2: Market Snapshot
Market
Net Rentable
Area(SF)
DirectVacant
(SF)
Direct Vacant
(%)
TotalVacant
(SF)
Total Vacant
(%)
Average Asking RateAnnual, NNN
($/SF)
Qtr. TotalNet Absorption
(SF)
2016 Total Net Absorption
(SF)
Central Dallas 13,879,294 371,811 2.7 373,547 2.7 25.26 282,632 416,653
East Dallas Outlying 3,607,505 60,882 1.7 60,882 1.7 20.25 (29,280) (12,589)
Far North Dallas 54,868,240 3,592,134 6.5 3,599,237 6.6 14.51 199,844 2,081,683
Near North Dallas 20,887,570 1,005,968 4.8 1,009,140 4.8 16.45 142,058 485,111
North Central Dallas 33,507,776 1,653,904 4.9 1,806,783 5.4 17.24 256,960 919,412
Southeast Dallas 13,472,130 663,902 4.9 663,902 4.9 11.18 34,759 109,261
Southwest Dallas 17,305,531 1,348,457 7.8 1,376,610 8.0 10.64 386,969 812,083
West Dallas 30,676,294 2,068,202 6.7 2,070,027 6.7 13.24 345,084 888,544
Central Fort Worth 24,111,810 1,400,204 5.8 1,425,959 5.9 12.29 182,737 755,927
Mid-Cities 51,277,259 2,744,543 5.4 2,777,003 5.4 13.61 498,722 1,146,109
Suburban Fort Worth 23,365,446 1,098,605 4.7 1,138,228 4.9 13.00 364,415 983,456
TOTAL Dallas 188,204,340 10,765,260 5.7 10,960,128 5.8 15.31 1,619,026 5,700,158
TOTAL Fort Worth 98,754,515 5,243,352 5.3 5,341,190 5.4 13.14 1,045,874 2,885,492
TOTAL DFW 286,958,855 16,008,612 5.6 16,301,318 5.7 14.57 2,664,900 8,585,650
Retail momentum remained strong throughout
2016 for the DFW metropolitan area and is
expected to continue into 2017. Commercial retail
metrics continue to fire on all cylinders; the three
key market indicators of occupancy, net
absorption, and construction are robust and are
expected to remain this way as many retailers
progress with expansion plans. High consumer
confidence has boosted spending, as a low DFW
unemployment rate (currently below 4%) and a
tight labor market spur wage growth.
Retailers in the DFW market are seeing sustained
activity as the economic staples of steady levels
of population and employment growth seem
permanent fixtures in the Metroplex. According to
the U.S. Bureau of Labor Statistics, nonfarm
payrolls in DFW increased 3.4% year-over-year,
coming in just shy of 3.6 million at the close of Q4
2016.
DFW residents are a strong consumer force with a
median household income estimated at $61,644
annually. According to Moody’s Analytics, personal
income growth is expected to rise 5.0% in 2017,
bolstered by favorable migration trends, age
structure, and close proximity of several major
corporate headquarters.
Source: CBRE Research, Q4 2016.
DALLAS / FORT WORTH RETAIL
MARKETVIEW
0
200
400
600
800
1,000
1,200
1,400
Q2 20
11
Q4 20
11
Q2 20
12
Q4 20
12
Q2 20
13
Q4 20
13
Q2 20
14
Q4 20
14
Q2 20
15
Q4 20
15
Q2 20
16
Q4 20
16
SF (000s)
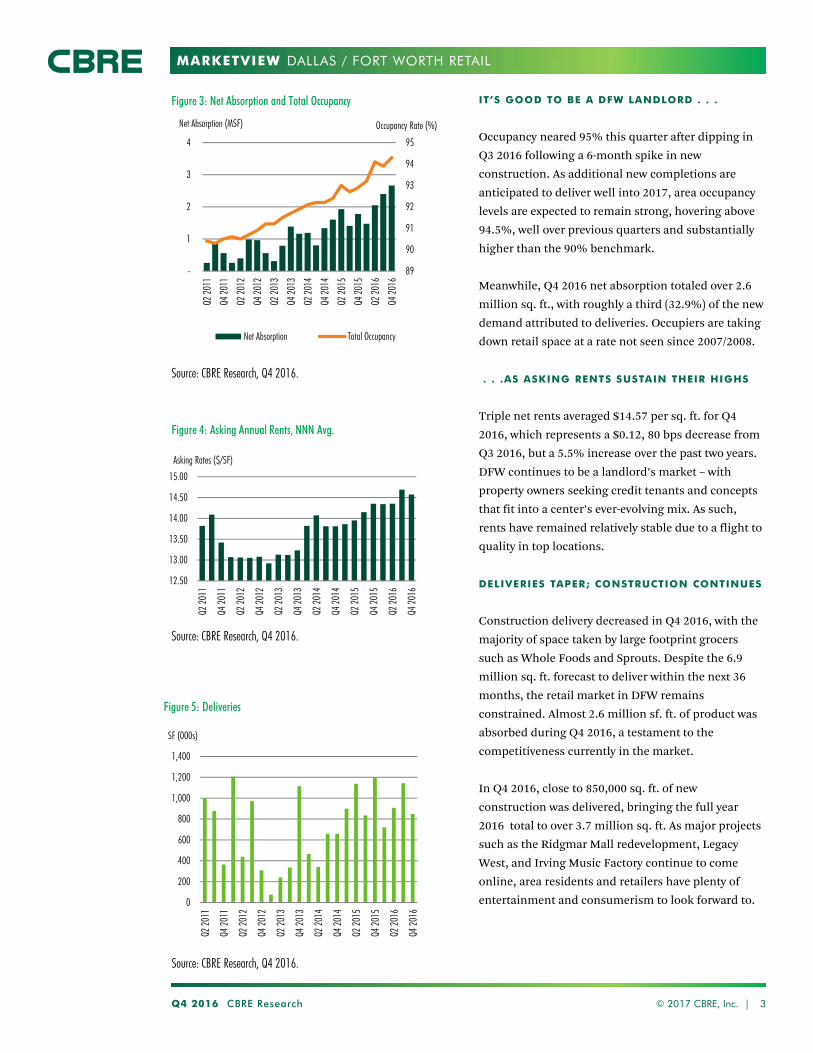
IT’S GOOD TO BE A DFW LANDLORD . . .
Occupancy neared 95% this quarter after dipping in
Q3 2016 following a 6-month spike in new
construction. As additional new completions are
anticipated to deliver well into 2017, area occupancy
levels are expected to remain strong, hovering above
94.5%, well over previous quarters and substantially
higher than the 90% benchmark.
Meanwhile, Q4 2016 net absorption totaled over 2.6
million sq. ft., with roughly a third (32.9%) of the new
demand attributed to deliveries. Occupiers are taking
down retail space at a rate not seen since 2007/2008.
. . .AS ASKING RENTS SUSTAIN THEIR HIGHS
Triple net rents averaged $14.57 per sq. ft. for Q4
2016, which represents a $0.12, 80 bps decrease from
Q3 2016, but a 5.5% increase over the past two years.
DFW continues to be a landlord’s market – with
property owners seeking credit tenants and concepts
that fit into a center’s ever-evolving mix. As such,
rents have remained relatively stable due to a flight to
quality in top locations.
DELIVERIES TAPER; CONSTRUCTION CONTINUES
Construction delivery decreased in Q4 2016, with the
majority of space taken by large footprint grocers
such as Whole Foods and Sprouts. Despite the 6.9
million sq. ft. forecast to deliver within the next 36
months, the retail market in DFW remains
constrained. Almost 2.6 million sf. ft. of product was
absorbed during Q4 2016, a testament to the
competitiveness currently in the market.
In Q4 2016, close to 850,000 sq. ft. of new
construction was delivered, bringing the full year
2016 total to over 3.7 million sq. ft. As major projects
such as the Ridgmar Mall redevelopment, Legacy
West, and Irving Music Factory continue to come
online, area residents and retailers have plenty of
entertainment and consumerism to look forward to.
Q4 2016 CBRE Research © 2017 CBRE, Inc. | 3
Figure 3: Net Absorption and Total Occupancy
Source: CBRE Research, Q4 2016.
Figure 5: Deliveries
Source: CBRE Research, Q4 2016.
89
90
91
92
93
94
95
-
1
2
3
4
Q2 20
11
Q4 20
11
Q2 20
12
Q4 20
12
Q2 20
13
Q4 20
13
Q2 20
14
Q4 20
14
Q2 20
15
Q4 20
15
Q2 20
16
Q4 20
16
Net Absorption (MSF)
Net Absorption Total Occupancy
Occupancy Rate (%)
12.50
13.00
13.50
14.00
14.50
15.00
Q2 20
11
Q4 20
11
Q2 20
12
Q4 20
12
Q2 20
13
Q4 20
13
Q2 20
14
Q4 20
14
Q2 20
15
Q4 20
15
Q2 20
16
Q4 20
16
Asking Rates ($/SF)
Figure 4: Asking Annual Rents, NNN Avg.
Source: CBRE Research, Q4 2016.
DALLAS / FORT WORTH RETAIL
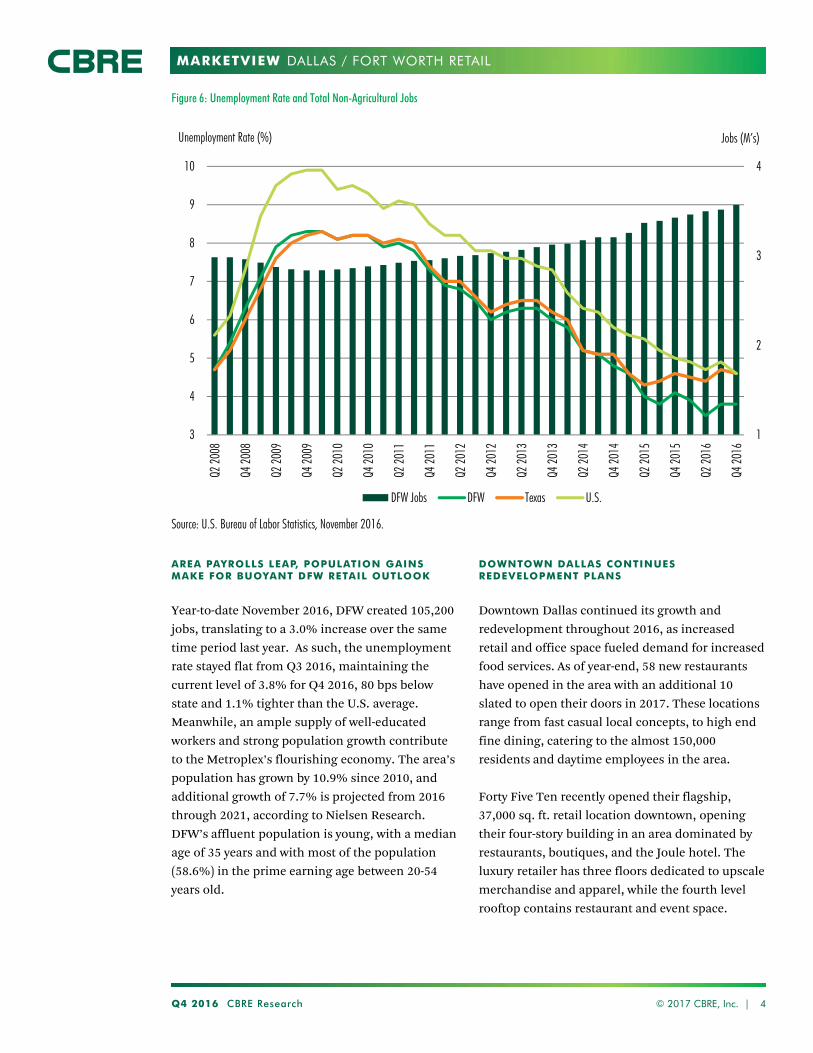
MARKETVIEW
Q4 2016 CBRE Research © 2017 CBRE, Inc. | 4
Figure 6: Unemployment Rate and Total Non-Agricultural Jobs
AREA PAYROLLS LEAP, POPULATION GAINS MAKE FOR BUOYANT DFW RETAIL OUTLOOK
Year-to-date November 2016, DFW created 105,200
jobs, translating to a 3.0% increase over the same
time period last year. As such, the unemployment
rate stayed flat from Q3 2016, maintaining the
current level of 3.8% for Q4 2016, 80 bps below
state and 1.1% tighter than the U.S. average.
Meanwhile, an ample supply of well-educated
workers and strong population growth contribute
to the Metroplex’s flourishing economy. The area’s
population has grown by 10.9% since 2010, and
additional growth of 7.7% is projected from 2016
through 2021, according to Nielsen Research.
DFW’s affluent population is young, with a median
age of 35 years and with most of the population
(58.6%) in the prime earning age between 20-54
years old.
DOWNTOWN DALLAS CONTINUES REDEVELOPMENT PLANS
Downtown Dallas continued its growth and
redevelopment throughout 2016, as increased
retail and office space fueled demand for increased
food services. As of year-end, 58 new restaurants
have opened in the area with an additional 10
slated to open their doors in 2017. These locations
range from fast casual local concepts, to high end
fine dining, catering to the almost 150,000
residents and daytime employees in the area.
Forty Five Ten recently opened their flagship,
37,000 sq. ft. retail location downtown, opening
their four-story building in an area dominated by
restaurants, boutiques, and the Joule hotel. The
luxury retailer has three floors dedicated to upscale
merchandise and apparel, while the fourth level
rooftop contains restaurant and event space.
1
2
3
4
3
4
5
6
7
8
9
10
Q2 20
08
Q4 20
08
Q2 20
09
Q4 20
09
Q2 20
10
Q4 20
10
Q2 20
11
Q4 20
11
Q2 20
12
Q4 20
12
Q2 20
13
Q4 20
13
Q2 20
14
Q4 20
14
Q2 20
15
Q4 20
15
Q2 20
16
Q4 20
16
Jobs (M’s)Unemployment Rate (%)
DFW Jobs DFW Texas U.S.
Source: U.S. Bureau of Labor Statistics, November 2016.
DALLAS / FORT WORTH RETAIL
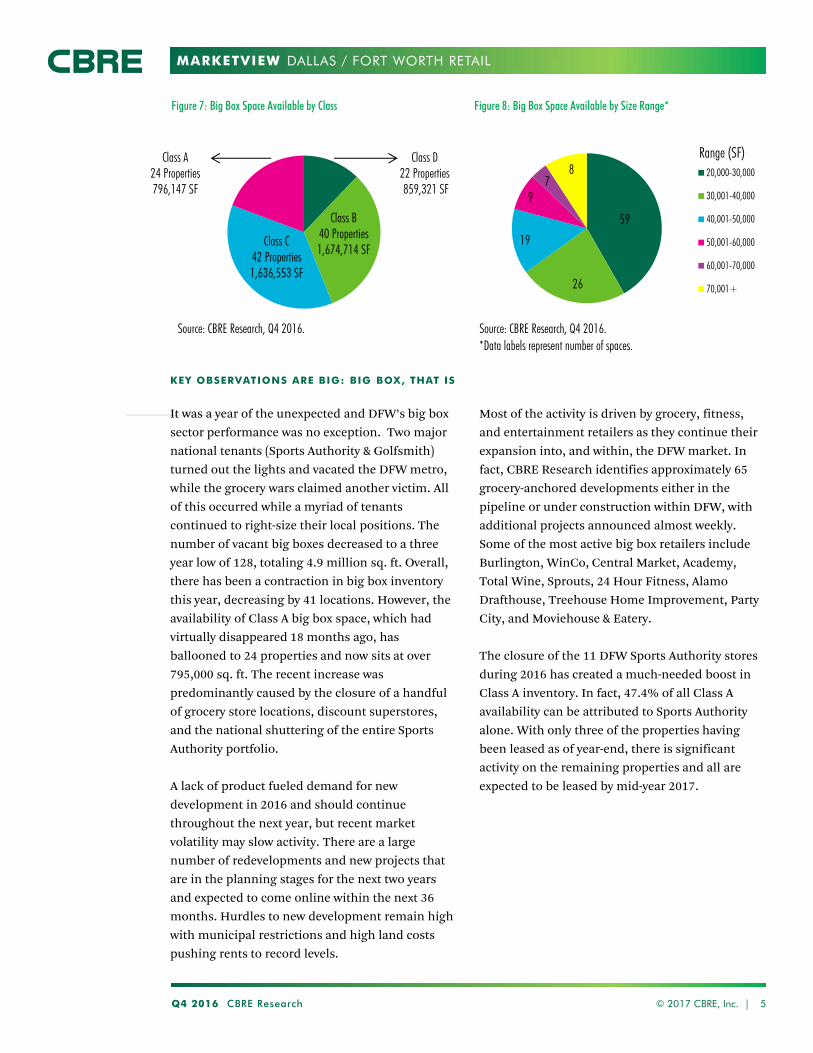
MARKETVIEW
Q4 2016 CBRE Research © 2017 CBRE, Inc. | 5
Figure 7: Big Box Space Available by Class
Source: CBRE Research, Q4 2016.
Figure 8: Big Box Space Available by Size Range*
Source: CBRE Research, Q4 2016.
KEY OBSERVATIONS ARE BIG: BIG BOX, THAT IS
It was a year of the unexpected and DFW’s big box
sector performance was no exception. Two major
national tenants (Sports Authority & Golfsmith)
turned out the lights and vacated the DFW metro,
while the grocery wars claimed another victim. All
of this occurred while a myriad of tenants
continued to right-size their local positions. The
number of vacant big boxes decreased to a three
year low of 128, totaling 4.9 million sq. ft. Overall,
there has been a contraction in big box inventory
this year, decreasing by 41 locations. However, the
availability of Class A big box space, which had
virtually disappeared 18 months ago, has
ballooned to 24 properties and now sits at over
795,000 sq. ft. The recent increase was
predominantly caused by the closure of a handful
of grocery store locations, discount superstores,
and the national shuttering of the entire Sports
Authority portfolio.
A lack of product fueled demand for new
development in 2016 and should continue
throughout the next year, but recent market
volatility may slow activity. There are a large
number of redevelopments and new projects that
are in the planning stages for the next two years
and expected to come online within the next 36
months. Hurdles to new development remain high
with municipal restrictions and high land costs
pushing rents to record levels.
Most of the activity is driven by grocery, fitness,
and entertainment retailers as they continue their
expansion into, and within, the DFW market. In
fact, CBRE Research identifies approximately 65
grocery-anchored developments either in the
pipeline or under construction within DFW, with
additional projects announced almost weekly.
Some of the most active big box retailers include
Burlington, WinCo, Central Market, Academy,
Total Wine, Sprouts, 24 Hour Fitness, Alamo
Drafthouse, Treehouse Home Improvement, Party
City, and Moviehouse & Eatery.
The closure of the 11 DFW Sports Authority stores
during 2016 has created a much-needed boost in
Class A inventory. In fact, 47.4% of all Class A
availability can be attributed to Sports Authority
alone. With only three of the properties having
been leased as of year-end, there is significant
activity on the remaining properties and all are
expected to be leased by mid-year 2017.
*Data labels represent number of spaces.
Class A24 Properties796,147 SF
Class B40 Properties1,674,714 SF
Class C42 Properties1,636,553 SF
Class D22 Properties859,321 SF
59
26
19
97
8 20,000-30,000
30,001-40,000
40,001-50,000
50,001-60,000
60,001-70,000
70,001+
Range (SF)
DALLAS / FORT WORTH RETAIL
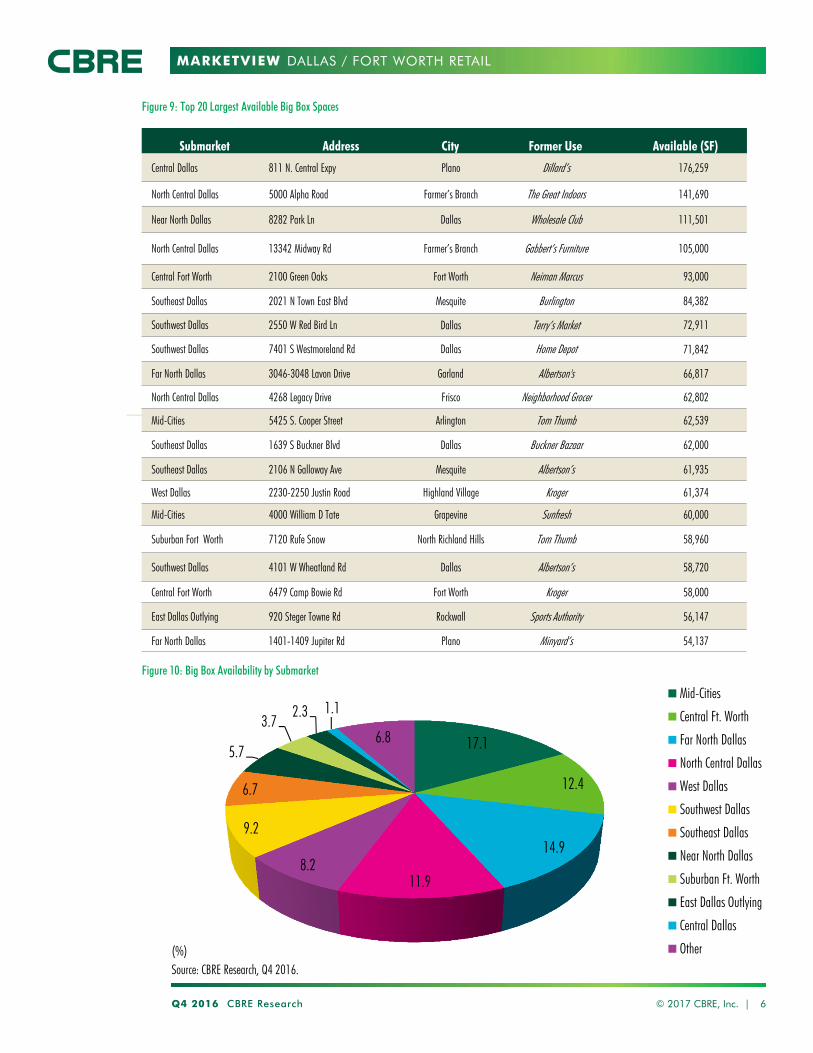
MARKETVIEW
Q4 2016 CBRE Research © 2017 CBRE, Inc. | 6
Figure 9: Top 20 Largest Available Big Box Spaces
Source: CBRE Research, Q4 2016.
Figure 10: Big Box Availability by Submarket
17.1
12.4
14.9
11.98.2
9.2
6.7
5.7
3.72.3 1.1
6.8
(%)
Mid-Cities
Central Ft. Worth
Far North Dallas
North Central Dallas
West Dallas
Southwest Dallas
Southeast Dallas
Near North Dallas
Suburban Ft. Worth
East Dallas Outlying
Central Dallas
Other
Submarket Address City Former Use Available (SF)
Central Dallas 811 N. Central Expy Plano Dillard’s 176,259
North Central Dallas 5000 Alpha Road Farmer’s Branch The Great Indoors 141,690
Near North Dallas 8282 Park Ln Dallas Wholesale Club 111,501
North Central Dallas 13342 Midway Rd Farmer’s Branch Gabbert’s Furniture 105,000
Central Fort Worth 2100 Green Oaks Fort Worth Neiman Marcus 93,000
Southeast Dallas 2021 N Town East Blvd Mesquite Burlington 84,382
Southwest Dallas 2550 W Red Bird Ln Dallas Terry’s Market 72,911
Southwest Dallas 7401 S Westmoreland Rd Dallas Home Depot 71,842
Far North Dallas 3046-3048 Lavon Drive Garland Albertson's 66,817
North Central Dallas 4268 Legacy Drive Frisco Neighborhood Grocer 62,802
Mid-Cities 5425 S. Cooper Street Arlington Tom Thumb 62,539
Southeast Dallas 1639 S Buckner Blvd Dallas Buckner Bazaar 62,000
Southeast Dallas 2106 N Galloway Ave Mesquite Albertson’s 61,935
West Dallas 2230-2250 Justin Road Highland Village Kroger 61,374
Mid-Cities 4000 William D Tate Grapevine Sunfresh 60,000
Suburban Fort Worth 7120 Rufe Snow North Richland Hills Tom Thumb 58,960
Southwest Dallas 4101 W Wheatland Rd Dallas Albertson’s 58,720
Central Fort Worth 6479 Camp Bowie Rd Fort Worth Kroger 58,000
East Dallas Outlying 920 Steger Towne Rd Rockwall Sports Authority 56,147
Far North Dallas 1401-1409 Jupiter Rd Plano Minyard’s 54,137
DALLAS / FORT WORTH RETAIL

MARKETVIEW
Disclaimer: Information contained herein, including projections, has been obtained from sources believed to be reliable. While we do not doubt its accuracy, we have not verified it and make no guarantee, warranty or representation about it. It is your responsibility to confirm independently its accuracy and completeness. This information is presented exclusively for use by CBRE clients and professionals and all rights to the material are reserved and cannot be reproduced without prior written permission of CBRE.
CONTACTS
Robert C. KrampDirector, Research & [email protected]
E. Michelle MillerResearch Operations [email protected]
Robert BasiliereSenior Research [email protected]
CBRE OFFICES
CBRE Dallas2100 McKinney Ave, Suite 700
Dallas, TX 75201
To learn more about CBRE Research,
or to access additional research reports,
please visit the Global Research Gateway
at www.cbre.com/researchgateway.
DALLAS / FORT WORTH RETAIL
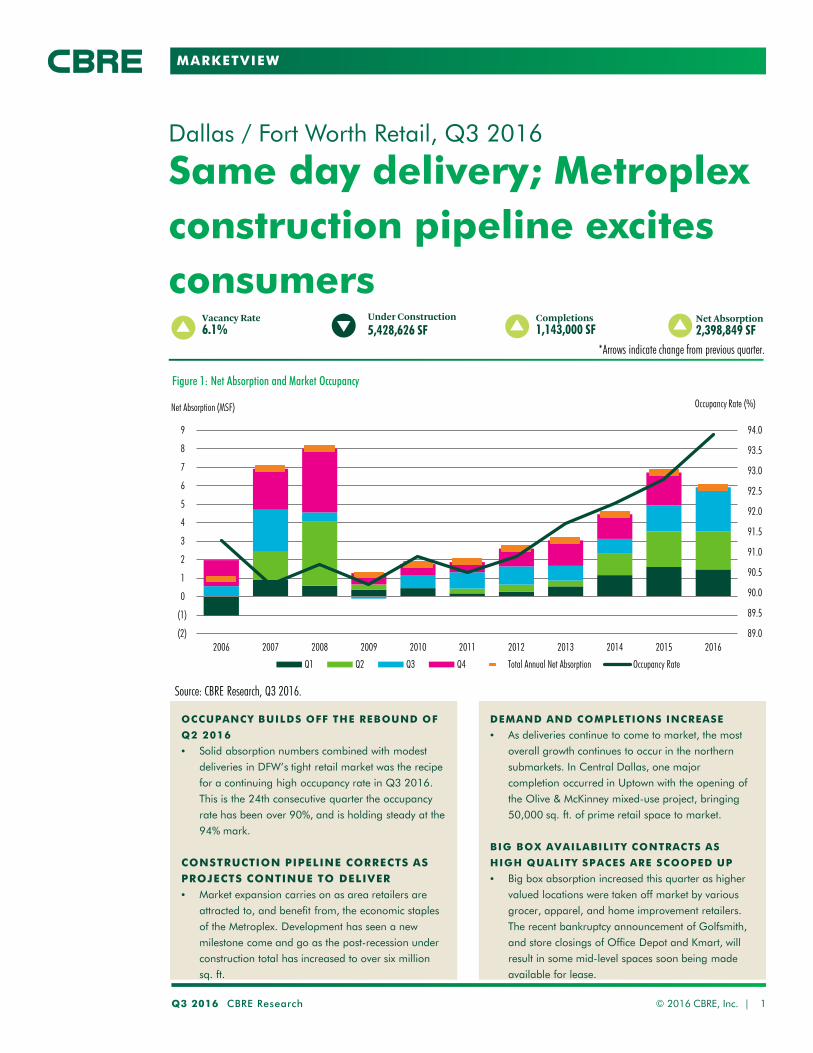
MARKETVIEW
Same day delivery; Metroplex construction pipeline excites consumers
Dallas / Fort Worth Retail, Q3 2016
Q3 2016 CBRE Research © 2016 CBRE, Inc. | 1
Vacancy Rate 6.1%
*Arrows indicate change from previous quarter.
Under Construction 5,428,626 SF
Completions 1,143,000 SF
Net Absorption 2,398,849 SF
OCCUPANCY BUILDS OFF THE REBOUND OF
Q2 2016
• Solid absorption numbers combined with modest deliveries in DFW’s tight retail market was the recipe for a continuing high occupancy rate in Q3 2016. This is the 24th consecutive quarter the occupancy rate has been over 90%, and is holding steady at the 94% mark.
CONSTRUCTION PIPELINE CORRECTS AS PROJECTS CONTINUE TO DELIVER • Market expansion carries on as area retailers are
attracted to, and benefit from, the economic staples of the Metroplex. Development has seen a new milestone come and go as the post-recession under construction total has increased to over six million sq. ft.
Figure 1: Net Absorption and Market Occupancy
Source: CBRE Research, Q3 2016.
DEMAND AND COMPLETIONS INCREASE
• As deliveries continue to come to market, the most overall growth continues to occur in the northern submarkets. In Central Dallas, one major completion occurred in Uptown with the opening of the Olive & McKinney mixed-use project, bringing 50,000 sq. ft. of prime retail space to market.
BIG BOX AVAILABILITY CONTRACTS AS
HIGH QUALITY SPACES ARE SCOOPED UP
• Big box absorption increased this quarter as higher valued locations were taken off market by various grocer, apparel, and home improvement retailers. The recent bankruptcy announcement of Golfsmith, and store closings of Office Depot and Kmart, will result in some mid-level spaces soon being made available for lease.
89.0
89.5
90.0
90.5
91.0
91.5
92.0
92.5
93.0
93.5
94.0
(2)
(1)
0
1
2
3
4
5
6
7
8
9
2006 2007 2008 2009 2010 2011 2012 2013 2014 2015 2016
Occupancy Rate (%) Net Absorption (MSF)
Q1 Q2 Q3 Q4 Total Annual Net Absorption Occupancy Rate
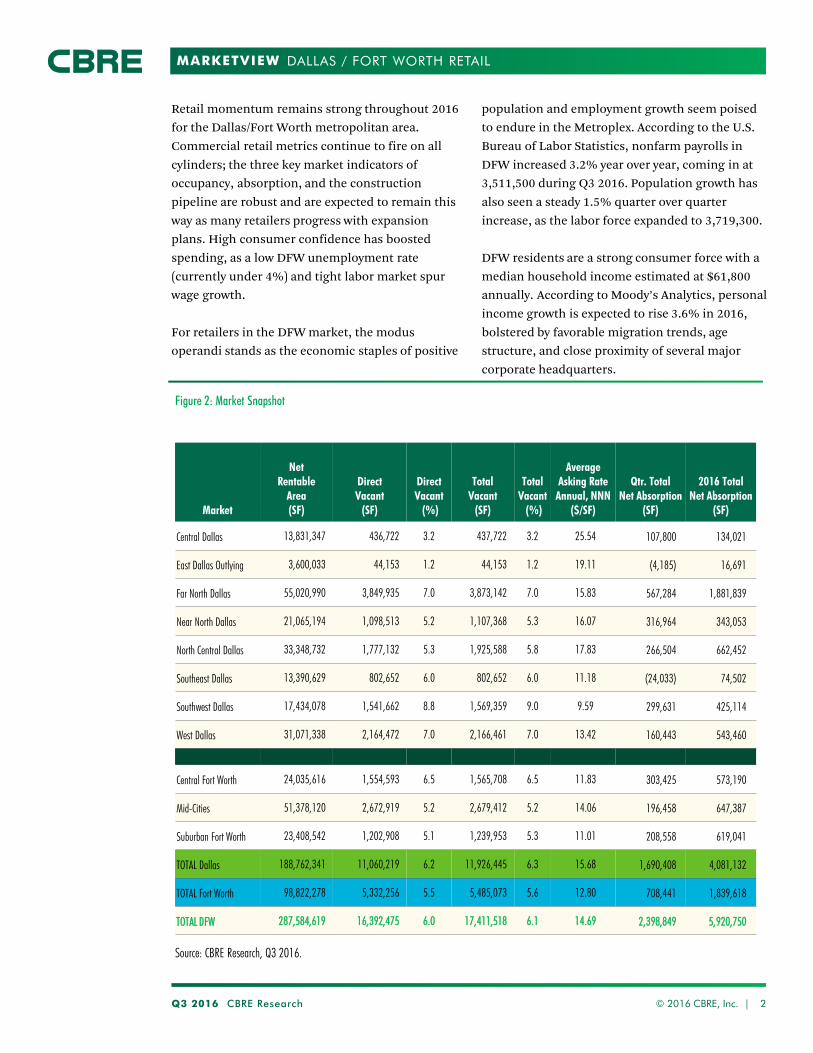
MARKETVIEW
Q3 2016 CBRE Research © 2016 CBRE, Inc. | 2
Figure 2: Market Snapshot
Market
Net Rentable
Area (SF)
Direct Vacant
(SF)
Direct Vacant (%)
Total Vacant
(SF)
Total Vacant (%)
Average Asking Rate
Annual, NNN ($/SF)
Qtr. Total Net Absorption
(SF)
2016 Total Net Absorption
(SF)
Central Dallas 13,831,347 436,722 3.2 437,722 3.2 25.54 107,800 134,021
East Dallas Outlying 3,600,033 44,153 1.2 44,153 1.2 19.11 (4,185) 16,691
Far North Dallas 55,020,990 3,849,935 7.0 3,873,142 7.0 15.83 567,284 1,881,839
Near North Dallas 21,065,194 1,098,513 5.2 1,107,368 5.3 16.07 316,964 343,053
North Central Dallas 33,348,732 1,777,132 5.3 1,925,588 5.8 17.83 266,504 662,452
Southeast Dallas 13,390,629 802,652 6.0 802,652 6.0 11.18 (24,033) 74,502
Southwest Dallas 17,434,078 1,541,662 8.8 1,569,359 9.0 9.59 299,631 425,114
West Dallas 31,071,338 2,164,472 7.0 2,166,461 7.0 13.42 160,443 543,460
Central Fort Worth 24,035,616 1,554,593 6.5 1,565,708 6.5 11.83 303,425 573,190
Mid-Cities 51,378,120 2,672,919 5.2 2,679,412 5.2 14.06 196,458 647,387
Suburban Fort Worth 23,408,542 1,202,908 5.1 1,239,953 5.3 11.01 208,558 619,041
TOTAL Dallas 188,762,341 11,060,219 6.2 11,926,445 6.3 15.68 1,690,408 4,081,132
TOTAL Fort Worth 98,822,278 5,332,256 5.5 5,485,073 5.6 12.80 708,441 1,839,618
TOTAL DFW 287,584,619 16,392,475 6.0 17,411,518 6.1 14.69 2,398,849 5,920,750
Retail momentum remains strong throughout 2016 for the Dallas/Fort Worth metropolitan area. Commercial retail metrics continue to fire on all cylinders; the three key market indicators of occupancy, absorption, and the construction pipeline are robust and are expected to remain this way as many retailers progress with expansion plans. High consumer confidence has boosted spending, as a low DFW unemployment rate (currently under 4%) and tight labor market spur wage growth. For retailers in the DFW market, the modus operandi stands as the economic staples of positive
population and employment growth seem poised to endure in the Metroplex. According to the U.S. Bureau of Labor Statistics, nonfarm payrolls in DFW increased 3.2% year over year, coming in at 3,511,500 during Q3 2016. Population growth has also seen a steady 1.5% quarter over quarter increase, as the labor force expanded to 3,719,300. DFW residents are a strong consumer force with a median household income estimated at $61,800 annually. According to Moody’s Analytics, personal income growth is expected to rise 3.6% in 2016, bolstered by favorable migration trends, age structure, and close proximity of several major corporate headquarters.
Source: CBRE Research, Q3 2016.
DALLAS / FORT WORTH RETAIL

MARKETVIEW
0
200
400
600
800
1,000
1,200
1,400
Q2 20
11
Q4 20
11
Q2 20
12
Q4 20
12
Q2 20
13
Q4 20
13
Q2 20
14
Q4 20
14
Q2 20
15
Q4 20
15
Q2 20
16
SF (000s)
ASCENDING ABSORPTION; STEADY OCCUPANY
Occupancy has continued its upward climb after its slip last year, closing out at 93.9% during Q3 2016, a slight 20 basis point (bps) decrease from Q2 2016 and an 120 bps increase over the same time period last year. As additional new completions are expected to deliver throughout 2016, area occupancy levels may waiver, but are expected to remain above the 90% benchmark.
Meanwhile, Q3 2016 absorption totaled over 2.4 million sq. ft., with almost half (47.6%) of the new demand attributed to deliveries. Additionally, this is the second consecutive quarter that absorption has eclipsed the two million sq. ft. mark, a level not seen since 2007/2008.
RECORD RENTS SUSTAIN THEIR HIGHS
Triple net rents averaged $14.69 per sq. ft. for Q3 2016, which represents a $0.34, 2.4% increase from Q2 2016 rents. Despite the 3.9 million sq. ft. forecast to deliver within the next 24 months, the retail market in DFW remains constrained. 1.1 million sf. ft. of product was absorbed during Q3 2016, a testament to the competitiveness currently in the market. DFW continues to be a landlord’s market – with property owners seeking credit tenants and concepts that fit into a center’s tenant mix, however rents have remained relatively stable due to a flight to quality in top locations.
DELIVERIES TAKE LION’S SHARE OF DEMAND
Construction delivery has increased in Q3 2016, with the majority of space taken by large footprint grocers such as Whole Foods and Sprouts, as well as the recent opening of entertainment destinations such as Moviehouse & Eatery in McKinney, and Buc-ee’s in North Fort Worth. Delivered construction has, and continues to make up, most of the quarterly absorption, hovering at around 45%-50% for the past two years. In Q3 2016, over 1.1 million sq. ft. of new construction was delivered, bringing the year-to-date 2016 total to over 2.7 million sq. ft.
Q3 2016 CBRE Research © 2016 CBRE, Inc. | 3
Figure 3: Net Absorption and Total Occupancy
Source: CBRE Research, Q3 2016.
Figure 5: Deliveries
Source: CBRE Research, Q3 2016.
89.089.590.090.591.091.592.092.593.093.594.094.5
-
1
2
3
4
Q4 20
10
Q2 20
11
Q4 20
11
Q2 20
12
Q4 20
12
Q2 20
13
Q4 20
13
Q2 20
14
Q4 20
14
Q2 20
15
Q4 20
15
Q2 20
16
Net Absorption (MSF)
Net Absorption Total Occupancy
Occupancy Rate (%)
12.50
13.00
13.50
14.00
14.50
15.00
Q4 20
10
Q2 20
11
Q4 20
11
Q2 20
12
Q4 20
12
Q2 20
13
Q4 20
13
Q2 20
14
Q4 20
14
Q2 20
15
Q4 20
15
Q2 20
16
Asking Rates ($/SF)
Figure 4: Asking Annual Rents, NNN Avg.
Source: CBRE Research, Q3 2016.
DALLAS / FORT WORTH RETAIL

MARKETVIEW
Q3 2016 CBRE Research © 2016 CBRE, Inc. | 4
Figure 6: Unemployment Rate and Total Non-Agricultural Jobs
AREA PAYROLLS LEAP, POPULATION GAINS MAKE FOR BUOYANT DFW RETAIL OUTLOOK
Year-to-date August 2016, DFW has created 73,500 jobs, translating to a 15.6% increase over the same time period last year. The unemployment rate slightly increased from 3.6% at the end of Q2 2016 to the current level of 3.8% this quarter. Dallas/Fort Worth’s unemployment rate for the quarter was 90 bps lower than Texas (4.7%) and 110 bps lower than the U.S. (4.9%) in Q3 2016. An ample supply of well-educated workers and strong population growth contribute to the area's fit economy.
With an estimated population of 7.1 million, the DFW metropolitan area is the fourth-largest MSA in the United States. The area’s population has grown by 10.9% since 2010, and additional growth of 7.7% is projected from 2016 through 2021, according to Nielsen Research.
DFW’s affluent population is young, with a median age of 35 years and with most of the population (58.6%) in the prime earning years of 20-54. DFW residents tend to earn more than the national average, supporting an estimated median household income of $61,100 annually versus $54,901 per year in the U.S.
1
2
3
4
3
4
5
6
7
8
9
10
Q2 20
08
Q4 20
08
Q2 20
09
Q4 20
09
Q2 20
10
Q4 20
10
Q2 20
11
Q4 20
11
Q2 20
12
Q4 20
12
Q2 20
13
Q4 20
13
Q2 20
14
Q4 20
14
Q2 20
15
Q4 20
15
Q2 20
16
Jobs (M’s) Unemployment Rate (%)
DFW Jobs DFW Texas U.S.
Source: U.S. Bureau of Labor Statistics, August 2016.
DALLAS / FORT WORTH RETAIL

MARKETVIEW
Q3 2016 CBRE Research © 2016 CBRE, Inc. | 5
Figure 7: Big Box Space Available by Class
Source: CBRE Research, Q3 2016.
Figure 8: Big Box Space Available by Size Range*
Source: CBRE Research, Q3 2016.
KEY OBSERVATIONS ARE BIG: BIG BOX, THAT IS
The first three quarters of 2016 have been interesting for the big box sector, as two major national tenants turned out the lights and vacated the DFW metro, while the grocery wars claimed another victim. All of this occurring while other tenants continue to “right-size” their positions in the market. The number of vacant big boxes decreased to 137, totaling over 6 million sq. ft. in the market. In total, there has been a contraction in big box space this year, decreasing by 35. The availability of Class A box space, which had virtually disappeared a year and a half ago, is now up to 26 properties totaling over 854,000 sq. ft.; the recent increase has been largely caused by the closure of a few grocery stores, discount superstores, and the national closure of the entire Sports Authority portfolio. There are approximately 83 Class B and Class C boxes that remain available market-wide. A lack of product is fueling demand for new development in 2016 and should continue through 2017, but recent market volatility might slow activity a bit. There are a large number of redevelopments and new projects that are in the planning stages for the next two years. Hurdles to new development remain high with municipal restrictions and high land costs pushing rents to record levels.
Most of the activity is driven by grocery, fitness, and entertainment retailers as they continue their expansion into, and within, the DFW market. In fact, CBRE has identified approximately 65 grocery-anchored developments either in the pipeline or under construction within DFW, with more announced almost weekly. Some of the most active retailers include Gander Mountain, WinCo, H-E-B, Youfit, Total Wine, Sprouts, Trader Joe’s, Whole Foods, Fitness Connection, Alamo Drafthouse, and Moviehouse & Eatery. Many retailers, such as Barnes & Noble, Staples, Best Buy, Babies ‘R’ Us, Office Depot, and KMart continue to close stores and “right size” in order to compete with shrinking demand or increased competition from internet commerce. However, the emphasis is clearly switching to Class B and C boxes. Landlords and tenants must continue to work creatively to reconfigure and modernize these older properties. We can expect to see developments take the shape of even larger big box anchor tenants with smaller in-line space. Secondary tenants do not require the same size store fronts as the internet shift has affected how consumers shop. Restaurants remain the only sector with unchanged requirements for both in-line and pad space.
*Data labels represent number of spaces.
Class A 26 Properties 854,154 SF
Class B 43 Properties 1,949,319 SF Class C
40 Properties 1,627,816 SF
Class D 28 Properties
1,632,178 SF 59
30
18
10 8
12 20,000-30,000
30,001-40,000
40,001-50,000
50,001-60,000
60,001-70,000
70,001+
Range (SF)
DALLAS / FORT WORTH RETAIL

MARKETVIEW
Q3 2016 CBRE Research © 2016 CBRE, Inc. | 6
Figure 9: Largest Available Big Box Space
Source: CBRE Research, Q3 2016.
Source: CBRE Research, Q3 2016.
Figure 10: Dallas/Ft. Worth Retail Market Size by Classification
29.1
20.6 16.6
10
10.2
9 3.1
1.4
(%)
Neighborhood Center
Freestanding Single Tenant
Community Center
Regional & Super Regional Mall
Power Center
Strip Center
Lifestyle Center
Other (Theme/Festival & Outlet)
Submarket Address Former Use Available (SF) Far North Dallas 13138 Montfort Drive Macy's 300,300 Far North Dallas 1625 N. Story Rd Discount Big Box 227,200 Far North Dallas 3159 S Garland Road Discount Big Box 226,000 Central Dallas 811 N. Central Expy Dillard’s 176,259 North Central Dallas 5000 Alpha Road The Great Indoors 141,690 Central Fort Worth 2100 Green Oaks Neiman Marcus 120,000 Far North Dallas 13320 Montfort Drive J.C. Penney 111,657 Near North Dallas 8282 Park Ln Wholesale Club 111,501 North Central Dallas 13342 Midway Rd Gabbert’s Furniture 105,000 Southeast Dallas 2021 N Town East Blvd Burlington 84,382 Southwest Dallas 2550 W Red Bird Ln Terry’s Market 72,911
Southwest Dallas 7401 S Westmoreland Rd Home Depot 71,842
Far North Dallas 3046-3048 Lavon Drive Albertson's 66,817 North Central Dallas 4268 Legacy Drive Neighborhood Grocer 62,802 Mid-Cities 5425 S. Cooper Street Tom Thumb 62,539 Southeast Dallas 1639 S Buckner Blvd Buckner Bazaar 62,000 Southeast Dallas 2106 N Galloway Ave Albertson’s 61,935 West Dallas 2230-2250 Justin Road Kroger 61,374 Northcentral Dallas 2515 E Rosemead Pkwy Terry’s Food Store 61,224 Mid-Cities 2201 W Southlake Blvd Discount Superstore 59,012 Suburban Fort Worth 7120 Rufe Snow Tom Thumb 58,960
DALLAS / FORT WORTH RETAIL

MARKETVIEW INSERT
Occupancy continues its steady climb upwards as projects continue to deliver
Dallas / Fort Worth Retail, Q3 2016
Q3 2016 CBRE Research © 2016 CBRE, Inc. | 1
*Arrows indicate change from previous quarter.
Figure 1: Net Absorption and Occupancy Rate
Source: CBRE Research, Q3 2016.
Vacancy Rate 6.1%
Under Construction 5,428,626 SF
Completions 1,143,000 SF
Net Absorption 2,398,849 SF
89.0
89.5
90.0
90.5
91.0
91.5
92.0
92.5
93.0
93.5
94.0
(2)
(1)
0
1
2
3
4
5
6
7
8
9
2006 2007 2008 2009 2010 2011 2012 2013 2014 2015 2016
Net Absorption (MSF) Occupancy Rate (%)
Q1 Q2 Q3 Q4 Total Annual Net Absorption Occupancy Rate

MARKETVIEW INSERT
Q3 2016 CBRE Research 2
“EVEN MONEY” WITH NEW COMPLETIONS
Consistently, quarter-over-quarter completions have made up most of the recent absorption in the DFW market. However, while completions have compressed, so has absorption. As more retail projects are anticipated to deliver in the next two years, we can expect to see absorption fluctuate.
REBOUND CONTINUES FOR OCCUPANCY
With continued, expected completions through the end of the year, build-to-suit and lease up properties were the primary drivers of absorption. Occupancy will most likely correct itself as a number of projects are to deliver by the fall and end of this year.
ENERGY-CENTRIC CITIES CONTINUE TO WEIGH
IN ON RETAIL SALES TAX REVENUE
The Texas Comptroller of Public Accounts recently announced that for Fiscal 2016, state sales tax revenue came in at $28.2 billion, 3.5% shy of estimates. “The decline in state sales tax revenue was led by reduced collections from the oil and natural gas-related sectors, but collections from the retail trade and information sectors were also down compared to a year ago,” Comptroller Glenn Hegar said. “Increases continued to be seen from construction and restaurants.”
DALLAS / FORT WORTH RETAIL
CONSTRUCTION PROGRESSES AT IRVING MUSIC
FACTORY
Attention remains focused on the construction of Irving’s long awaited entertainment complex, the Music Factory, within the affluent Las Colinas area. The mixed-use project includes an amphitheatre, concert hall, office building, and over 200,000 sq. ft. of retail space. Anchored by Alamo Drafthouse and adjacent to the Irving Convention Center, the project is currently 97% preleased and scheduled to open in September 2017.
RETAILERS’ MIXED PERCEPTIONS ON ECONOMY
NOT SEEN IN REVENUE INDEX
According to the Dallas Federal Reserve’s Retail Outlook Survey, August 2016, retail sales fell this month and inventories remained unchanged. Although retailer’s perceptions of current broad economic conditions have worsened, future outlook remains positive.
RETAIL SALES VOLUME DECREASED OVER THE
QUARTER.
According to Real Capital Analytics’ “Trends and Trades” report, DFW recorded a decrease of 39% in year-over-year retail property sales through Q3 2016, with an average price per sq. ft. of $215 and average cap rate of 6.1%.
© 2016 CBRE, Inc. |
Figure 2: Asking Rates, NNN Avg. Annual and Occupancy Rate
878889909192939495
12.00
12.50
13.00
13.50
14.00
14.50
15.00
Q3 20
09
Q4 20
09
Q1 20
10
Q2 20
10
Q3 20
10
Q4 20
10
Q1 20
11
Q2 20
11
Q3 20
11
Q4 20
11
Q1 20
12
Q2 20
12
Q3 20
12
Q4 20
12
Q1 20
13
Q2 20
13
Q3 20
13
Q4 20
13
Q1 20
14
Q2 20
14
Q3 20
14
Q4 20
14
Q1 20
15
Q2 20
15
Q3 20
15
Q4 20
15
Q1 20
16
Q2 20
16
Q3 20
16
NNN Avg. Annual Asking Rates Total Occupancy
Occupancy Rate (%) Asking Rates ($/SF)
Source: CBRE Research, Q3 2016.
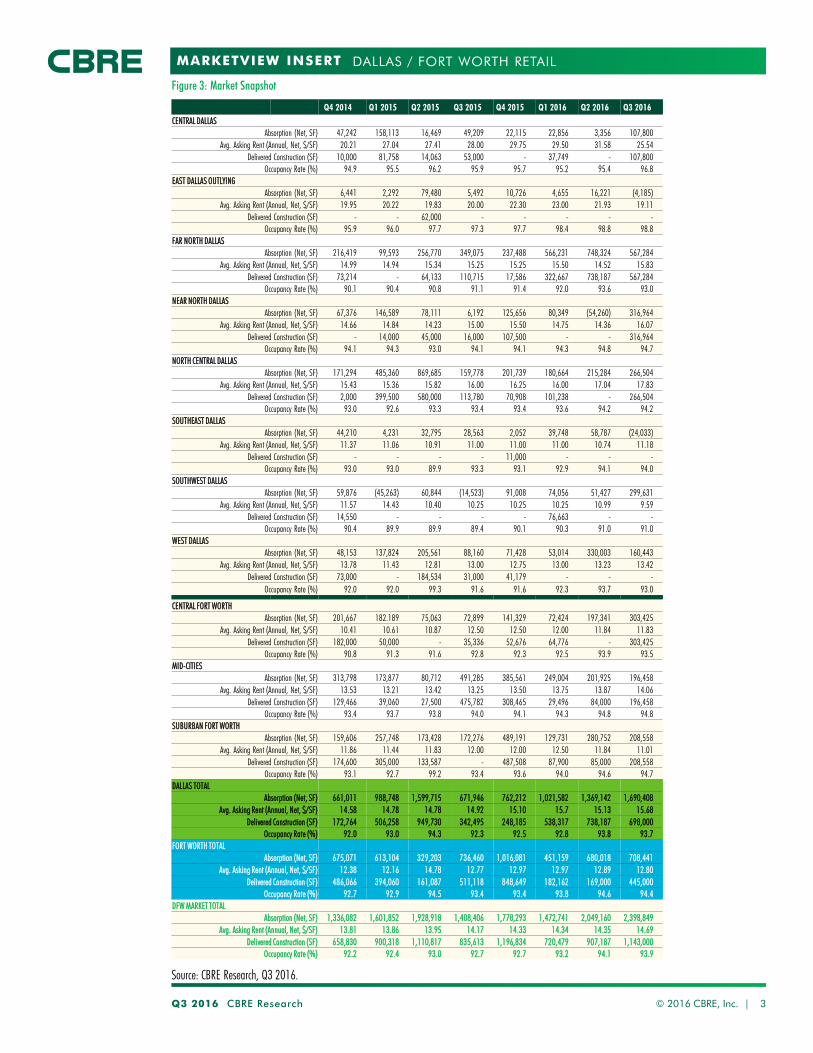
MARKETVIEW INSERT
Q3 2016 CBRE Research © 2016 CBRE, Inc. | 3
Q4 2014 Q1 2015 Q2 2015 Q3 2015 Q4 2015 Q1 2016 Q2 2016 Q3 2016 CENTRAL DALLAS
Absorption (Net, SF) 47,242 158,113 16,469 49,209 22,115 22,856 3,356 107,800 Avg. Asking Rent (Annual, Net, $/SF) 20.21 27.04 27.41 28.00 29.75 29.50 31.58 25.54
Delivered Construction (SF) 10,000 81,758 14,063 53,000 - 37,749 - 107,800 Occupancy Rate (%) 94.9 95.5 96.2 95.9 95.7 95.2 95.4 96.8
EAST DALLAS OUTLYING Absorption (Net, SF) 6,441 2,292 79,480 5,492 10,726 4,655 16,221 (4,185)
Avg. Asking Rent (Annual, Net, $/SF) 19.95 20.22 19.83 20.00 22.30 23.00 21.93 19.11 Delivered Construction (SF) - - 62,000 - - - - -
Occupancy Rate (%) 95.9 96.0 97.7 97.3 97.7 98.4 98.8 98.8 FAR NORTH DALLAS
Absorption (Net, SF) 216,419 99,593 256,770 349,075 237,488 566,231 748,324 567,284 Avg. Asking Rent (Annual, Net, $/SF) 14.99 14.94 15.34 15.25 15.25 15.50 14.52 15.83
Delivered Construction (SF) 73,214 - 64,133 110,715 17,586 322,667 738,187 567,284 Occupancy Rate (%) 90.1 90.4 90.8 91.1 91.4 92.0 93.6 93.0
NEAR NORTH DALLAS Absorption (Net, SF) 67,376 146,589 78,111 6,192 125,656 80,349 (54,260) 316,964
Avg. Asking Rent (Annual, Net, $/SF) 14.66 14.84 14.23 15.00 15.50 14.75 14.36 16.07 Delivered Construction (SF) - 14,000 45,000 16,000 107,500 - - 316,964
Occupancy Rate (%) 94.1 94.3 93.0 94.1 94.1 94.3 94.8 94.7 NORTH CENTRAL DALLAS
Absorption (Net, SF) 171,294 485,360 869,685 159,778 201,739 180,664 215,284 266,504 Avg. Asking Rent (Annual, Net, $/SF) 15.43 15.36 15.82 16.00 16.25 16.00 17.04 17.83
Delivered Construction (SF) 2,000 399,500 580,000 113,780 70,908 101,238 - 266,504 Occupancy Rate (%) 93.0 92.6 93.3 93.4 93.4 93.6 94.2 94.2
SOUTHEAST DALLAS Absorption (Net, SF) 44,210 4,231 32,795 28,563 2,052 39,748 58,787 (24,033)
Avg. Asking Rent (Annual, Net, $/SF) 11.37 11.06 10.91 11.00 11.00 11.00 10.74 11.18 Delivered Construction (SF) - - - - 11,000 - - -
Occupancy Rate (%) 93.0 93.0 89.9 93.3 93.1 92.9 94.1 94.0 SOUTHWEST DALLAS
Absorption (Net, SF) 59,876 (45,263) 60,844 (14,523) 91,008 74,056 51,427 299,631 Avg. Asking Rent (Annual, Net, $/SF) 11.57 14.43 10.40 10.25 10.25 10.25 10.99 9.59
Delivered Construction (SF) 14,550 - - - - 76,663 - - Occupancy Rate (%) 90.4 89.9 89.9 89.4 90.1 90.3 91.0 91.0
WEST DALLAS Absorption (Net, SF) 48,153 137,824 205,561 88,160 71,428 53,014 330,003 160,443
Avg. Asking Rent (Annual, Net, $/SF) 13.78 11.43 12.81 13.00 12.75 13.00 13.23 13.42 Delivered Construction (SF) 73,000 - 184,534 31,000 41,179 - - -
Occupancy Rate (%) 92.0 92.0 99.3 91.6 91.6 92.3 93.7 93.0
CENTRAL FORT WORTH Absorption (Net, SF) 201,667 182.189 75,063 72,899 141,329 72,424 197,341 303,425
Avg. Asking Rent (Annual, Net, $/SF) 10.41 10.61 10.87 12.50 12.50 12.00 11.84 11.83 Delivered Construction (SF) 182,000 50,000 - 35,336 52,676 64,776 - 303,425
Occupancy Rate (%) 90.8 91.3 91.6 92.8 92.3 92.5 93.9 93.5 MID-CITIES
Absorption (Net, SF) 313,798 173,877 80,712 491,285 385,561 249,004 201,925 196,458 Avg. Asking Rent (Annual, Net, $/SF) 13.53 13.21 13.42 13.25 13.50 13.75 13.87 14.06
Delivered Construction (SF) 129,466 39,060 27,500 475,782 308,465 29,496 84,000 196,458 Occupancy Rate (%) 93.4 93.7 93.8 94.0 94.1 94.3 94.8 94.8
SUBURBAN FORT WORTH Absorption (Net, SF) 159,606 257,748 173,428 172,276 489,191 129,731 280,752 208,558
Avg. Asking Rent (Annual, Net, $/SF) 11.86 11.44 11.83 12.00 12.00 12.50 11.84 11.01 Delivered Construction (SF) 174,600 305,000 133,587 - 487,508 87,900 85,000 208,558
Occupancy Rate (%) 93.1 92.7 99.2 93.4 93.6 94.0 94.6 94.7 DALLAS TOTAL
Absorption (Net, SF) 661,011 988,748 1,599,715 671,946 762,212 1,021,582 1,369,142 1,690,408 Avg. Asking Rent (Annual, Net, $/SF) 14.58 14.78 14.78 14.92 15.10 15.7 15.13 15.68
Delivered Construction (SF) 172,764 506,258 949,730 342,495 248,185 538,317 738,187 698,000 Occupancy Rate (%) 92.0 93.0 94.3 92.3 92.5 92.8 93.8 93.7
FORT WORTH TOTAL Absorption (Net, SF) 675,071 613,104 329,203 736,460 1,016,081 451,159 680,018 708,441
Avg. Asking Rent (Annual, Net, $/SF) 12.38 12.16 14.78 12.77 12.97 12.97 12.89 12.80 Delivered Construction (SF) 486,066 394,060 161,087 511,118 848,649 182,162 169,000 445,000
Occupancy Rate (%) 92.7 92.9 94.5 93.4 93.4 93.8 94.6 94.4 DFW MARKET TOTAL
Absorption (Net, SF) 1,336,082 1,601,852 1,928,918 1,408,406 1,778,293 1,472,741 2,049,160 2,398,849 Avg. Asking Rent (Annual, Net, $/SF) 13.81 13.86 13.95 14.17 14.33 14.34 14.35 14.69
Delivered Construction (SF) 658,830 900,318 1,110,817 835,613 1,196,834 720,479 907,187 1,143,000 Occupancy Rate (%) 92.2 92.4 93.0 92.7 92.7 93.2 94.1 93.9
Figure 3: Market Snapshot
Source: CBRE Research, Q3 2016.
DALLAS / FORT WORTH RETAIL

MARKETVIEW INSERT
CONSTRUCTION
Momentum remains strong for retail developers in 2016. Many had been cautious in building new product in the Dallas/Fort Worth market without establishing a preleasing strategy. Overall, major projects that are underway are marketing their grocery, soft goods, or apparel components as positive attraction generators to these various centers. This type of strategy is not a new practice, but is a catalyst in attracting users for inline service space, pad site users, and restaurants. One of the key
Q3 2016 CBRE Research 4
Figure 5: Construction Activity by Submarket
Figure 4: Historical Completions and Occupancy Rate
Source: CBRE Research, Q3 2016.
Market Under Construction
Bldg Count Under Construction
(SF) Delivered Buildings
Delivered Construction (SF)
Central Dallas 6 482,813 2 110,000
East Dallas Outlying 2 102,000 - -
Far North Dallas 9 615,750 4 473,000
Near North Dallas 1 58,000 1 60,000
North Central Dallas 12 1,479,599 2 55,000
Southeast Dallas 1 11,000 - -
Southwest Dallas 3 82,670 - -
West Dallas 6 503,421 - -
Central Fort Worth 3 587,669 1 200,000 Mid-Cities 8 491,248 1 100,000 Suburban Fort Worth 5 1,014,456 2 145,000
TOTAL Dallas 40 3,335,253 9 698,000
TOTAL Fort Worth 16 2,093,373 4 445,000
TOTAL DFW 56 5,428,626 13 1,143,000
components in having a good vs. great development is the tenant mix, specifically a balance in the service and goods provided. Construction decreased during the third quarter of 2016 from 5,994,491 sq. ft. to 5,428,626 sq. ft. with 1,143,000 sq. ft. of construction delivering over the same time period. Preleasing for these projects has been strong, a positive effect of regional employment expansion and economic trends.
© 2016 CBRE, Inc. |
89.0
89.5
90.0
90.5
91.0
91.5
92.0
92.5
93.0
93.5
94.0
94.5
0
200
400
600
800
1,000
1,200
1,400
Q1 20
12
Q2 20
12
Q3 20
12
Q4 20
12
Q1 20
13
Q2 20
13
Q3 20
13
Q4 20
13
Q1 20
14
Q2 20
14
Q3 20
14
Q4 20
14
Q1 20
15
Q2 20
15
Q3 20
15
Q4 20
15
Q1 20
16
Q2 20
16
Q3 20
16
Occupancy Rate (%) (000s)
Delivered Construction Occupancy Rate
Source: CBRE Research, Q3 2016.
DALLAS / FORT WORTH RETAIL
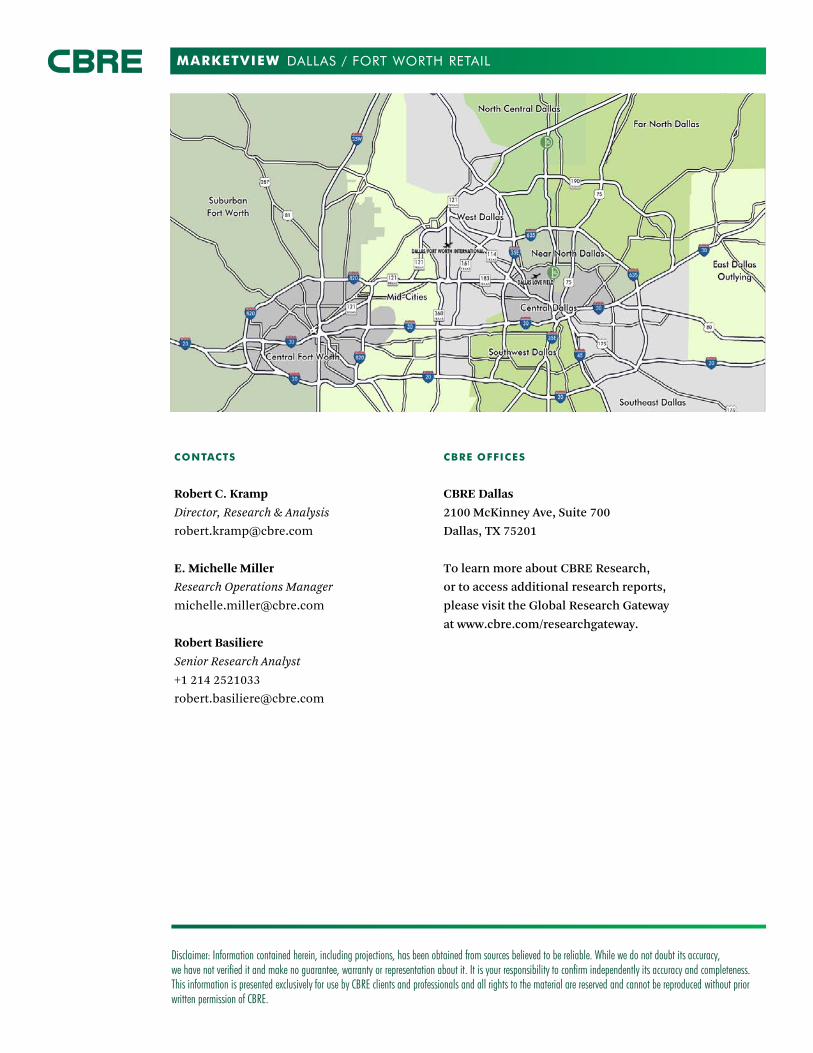
MARKETVIEW
Disclaimer: Information contained herein, including projections, has been obtained from sources believed to be reliable. While we do not doubt its accuracy, we have not verified it and make no guarantee, warranty or representation about it. It is your responsibility to confirm independently its accuracy and completeness. This information is presented exclusively for use by CBRE clients and professionals and all rights to the material are reserved and cannot be reproduced without prior written permission of CBRE.
CONTACTS
Robert C. Kramp Director, Research & Analysis [email protected] E. Michelle Miller Research Operations Manager [email protected]
Robert Basiliere Senior Research Analyst +1 214 2521033 [email protected]
CBRE OFFICES
CBRE Dallas 2100 McKinney Ave, Suite 700 Dallas, TX 75201
To learn more about CBRE Research, or to access additional research reports, please visit the Global Research Gateway at www.cbre.com/researchgateway.
DALLAS / FORT WORTH RETAIL
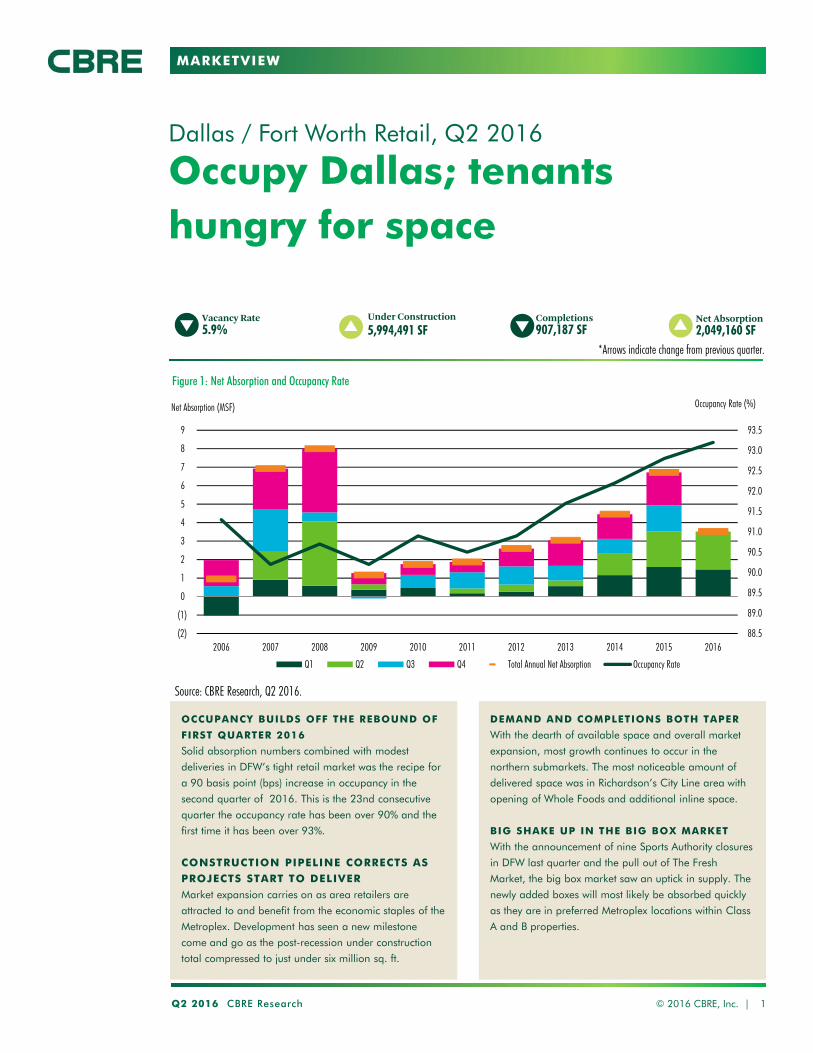
MARKETVIEW
Occupy Dallas; tenants hungry for space
Dallas / Fort Worth Retail, Q2 2016
Q2 2016 CBRE Research © 2016 CBRE, Inc. | 1
Vacancy Rate
5.9%*Arrows indicate change from previous quarter.
Under Construction
5,994,491 SFCompletions
907,187 SFNet Absorption
2,049,160 SF
OCCUPANCY BUILDS OFF THE REBOUND OF
FIRST QUARTER 2016
Solid absorption numbers combined with modest
deliveries in DFW’s tight retail market was the recipe for
a 90 basis point (bps) increase in occupancy in the
second quarter of 2016. This is the 23nd consecutive
quarter the occupancy rate has been over 90% and the
first time it has been over 93%.
CONSTRUCTION PIPELINE CORRECTS AS
PROJECTS START TO DELIVER
Market expansion carries on as area retailers are
attracted to and benefit from the economic staples of the
Metroplex. Development has seen a new milestone
come and go as the post-recession under construction
total compressed to just under six million sq. ft.
Figure 1: Net Absorption and Occupancy Rate
Source: CBRE Research, Q2 2016.
DEMAND AND COMPLETIONS BOTH TAPER
With the dearth of available space and overall market
expansion, most growth continues to occur in the
northern submarkets. The most noticeable amount of
delivered space was in Richardson’s City Line area with
opening of Whole Foods and additional inline space.
BIG SHAKE UP IN THE BIG BOX MARKET
With the announcement of nine Sports Authority closures
in DFW last quarter and the pull out of The Fresh
Market, the big box market saw an uptick in supply. The
newly added boxes will most likely be absorbed quickly
as they are in preferred Metroplex locations within Class
A and B properties.
88.5
89.0
89.5
90.0
90.5
91.0
91.5
92.0
92.5
93.0
93.5
(2)
(1)
0
1
2
3
4
5
6
7
8
9
2006 2007 2008 2009 2010 2011 2012 2013 2014 2015 2016
Occupancy Rate (%)Net Absorption (MSF)
Q1 Q2 Q3 Q4 Total Annual Net Absorption Occupancy Rate
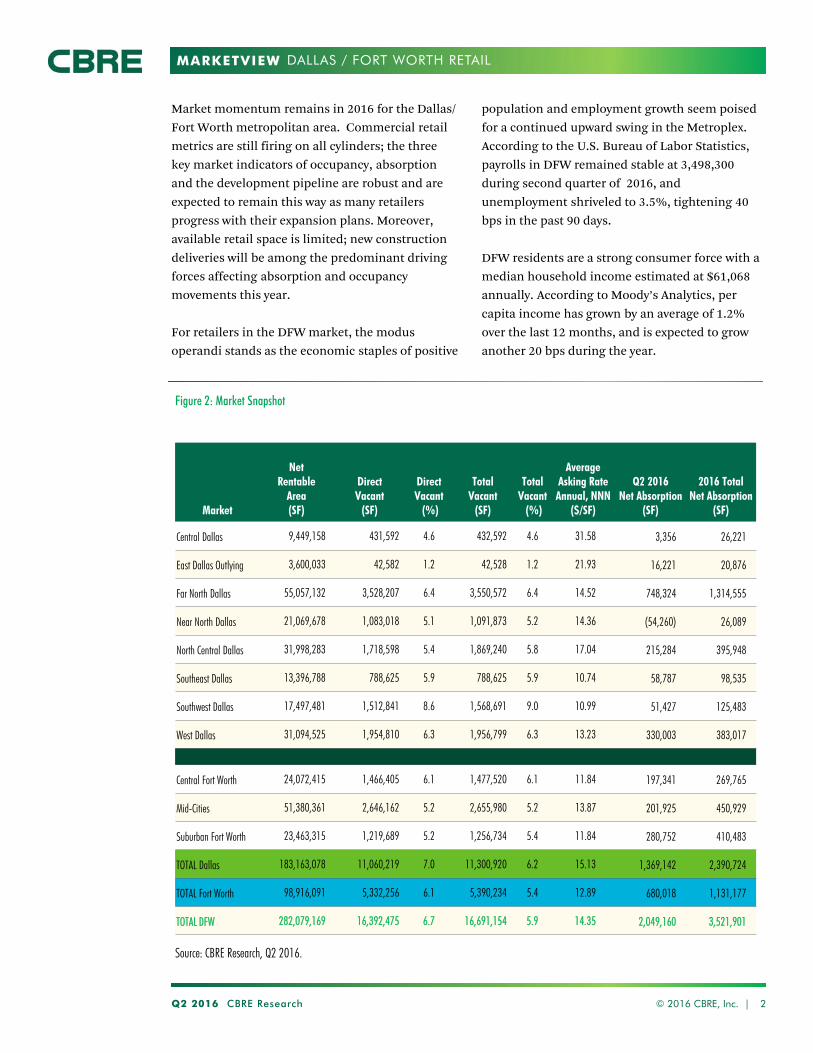
MARKETVIEW
Q2 2016 CBRE Research © 2016 CBRE, Inc. | 2
Figure 2: Market Snapshot
Market
Net Rentable
Area(SF)
DirectVacant
(SF)
Direct Vacant
(%)
TotalVacant
(SF)
Total Vacant
(%)
Average Asking RateAnnual, NNN
($/SF)
Q2 2016Net Absorption
(SF)
2016 Total Net Absorption
(SF)
Central Dallas 9,449,158 431,592 4.6 432,592 4.6 31.58 3,356 26,221
East Dallas Outlying 3,600,033 42,582 1.2 42,528 1.2 21.93 16,221 20,876
Far North Dallas 55,057,132 3,528,207 6.4 3,550,572 6.4 14.52 748,324 1,314,555
Near North Dallas 21,069,678 1,083,018 5.1 1,091,873 5.2 14.36 (54,260) 26,089
North Central Dallas 31,998,283 1,718,598 5.4 1,869,240 5.8 17.04 215,284 395,948
Southeast Dallas 13,396,788 788,625 5.9 788,625 5.9 10.74 58,787 98,535
Southwest Dallas 17,497,481 1,512,841 8.6 1,568,691 9.0 10.99 51,427 125,483
West Dallas 31,094,525 1,954,810 6.3 1,956,799 6.3 13.23 330,003 383,017
Central Fort Worth 24,072,415 1,466,405 6.1 1,477,520 6.1 11.84 197,341 269,765
Mid-Cities 51,380,361 2,646,162 5.2 2,655,980 5.2 13.87 201,925 450,929
Suburban Fort Worth 23,463,315 1,219,689 5.2 1,256,734 5.4 11.84 280,752 410,483
TOTAL Dallas 183,163,078 11,060,219 7.0 11,300,920 6.2 15.13 1,369,142 2,390,724
TOTAL Fort Worth 98,916,091 5,332,256 6.1 5,390,234 5.4 12.89 680,018 1,131,177
TOTAL DFW 282,079,169 16,392,475 6.7 16,691,154 5.9 14.35 2,049,160 3,521,901
Market momentum remains in 2016 for the Dallas/
Fort Worth metropolitan area. Commercial retail
metrics are still firing on all cylinders; the three
key market indicators of occupancy, absorption
and the development pipeline are robust and are
expected to remain this way as many retailers
progress with their expansion plans. Moreover,
available retail space is limited; new construction
deliveries will be among the predominant driving
forces affecting absorption and occupancy
movements this year.
For retailers in the DFW market, the modus
operandi stands as the economic staples of positive
population and employment growth seem poised
for a continued upward swing in the Metroplex.
According to the U.S. Bureau of Labor Statistics,
payrolls in DFW remained stable at 3,498,300
during second quarter of 2016, and
unemployment shriveled to 3.5%, tightening 40
bps in the past 90 days.
DFW residents are a strong consumer force with a
median household income estimated at $61,068
annually. According to Moody’s Analytics, per
capita income has grown by an average of 1.2%
over the last 12 months, and is expected to grow
another 20 bps during the year.
Source: CBRE Research, Q2 2016.
DALLAS / FORT WORTH RETAIL

MARKETVIEW
0
200
400
600
800
1,000
1,200
1,400
Q2 20
11
Q4 20
11
Q2 20
12
Q4 20
12
Q2 20
13
Q4 20
13
Q2 20
14
Q4 20
14
Q2 20
15
Q4 20
15
Q2 20
16
SF (000s)
ASCENDING OCCUPANCY; STEADY ABSORPTION
Occupancy is off to the races after its slip last year
closing out at 94.1% during second quarter of 2016, a
90 bps increase from the first quarter 2016 and a 101
bps increase over the same time period last year. As
additional new completions are expected to deliver
during 2016, area occupancy levels may waiver, but
still keep above the 90% benchmark.
Meanwhile, second quarter 2016 absorption totaled
over two million sq. ft., with almost half (44.3%) of
the new demand attributed to deliveries. Additionally,
the second quarter 2016 marks the first quarter since
2007/2008 that absorption has eclipsed the two
million sq. ft. mark.
RECORD RENTS SUSTAIN THEIR HIGHS
Triple net rents averaged $14.35 per square foot for
the second quarter 2016, which represents a one cent
increase from first quarter 2016 rents. Despite the 3.3
million sq. ft. forecast to deliver within the next 24
months, the retail market in DFW remains
constrained. 907,187 sf. ft. of product was absorbed
during the second quarter, a testament to the
competitiveness currently in the market. DFW
continues to be a landlord’s market – with property
owners seeking credit tenants and concepts that fit
into a particular center’s tenant mix, however rents
have remained relatively stable due to a flight to
quality in top locations.
DELIVERIES TAKE LION’S SHARE OF DEMAND
After post-recession construction officially peaked,
the pipeline decreased in the second quarter of 2016.
Delivered construction has, and continues to make
up, most of the quarterly absorption, hovering at
around 45%-50% for the past two years. Notably, the
City of Richardson, located in the Far North Dallas
submarket, had a wave of new deliveries.
Approximately 49% of the total quarterly absorption
in DFW can be credited to the City of Richardson with
the grand opening of the Whole Foods City Line store,
near the State Farm complex.
In the second quarter of 2016, over 907,187 sq. ft. of
new construction was delivered, bringing the first half
2016 total to over 1.6 million sq. ft.
Q2 2016 CBRE Research © 2016 CBRE, Inc. | 3
Figure 3: Net Absorption and Total Occupancy
Figure 5: Deliveries
Source: CBRE Research, Q2 2016.
89.089.590.090.591.091.592.092.593.093.594.094.5
-
1
2
3
4
Q4 20
10
Q2 20
11
Q4 20
11
Q2 20
12
Q4 20
12
Q2 20
13
Q4 20
13
Q2 20
14
Q4 20
14
Q2 20
15
Q4 20
15
Q2 20
16
Net Absorption (MSF)
Net Absorption Total Occupancy
Occupancy Rate (%)
12.5012.7012.9013.1013.3013.5013.7013.9014.1014.3014.50
Q4 20
10
Q2 20
11
Q4 20
11
Q2 20
12
Q4 20
12
Q2 20
13
Q4 20
13
Q2 20
14
Q4 20
14
Q2 20
15
Q4 20
15
Q2 20
16
Asking Rates ($)
Figure 4: Asking Annual Rents, NNN Avg.
Source: CBRE Research, Q2 2016.
DALLAS / FORT WORTH RETAIL
Source: CBRE Research, Q2 2016.

MARKETVIEW
Q2 2016 CBRE Research © 2016 CBRE, Inc. | 4
Figure 6: Unemployment Rate and Total Non-Agricultural Jobs
AREA PAYROLLS LEAP, POPULATION GAINS MAKE FOR BUOYANT DFW RETAIL OUTLOOK
In the second quarter of 2016, DFW created
129,100 jobs year-over-year, translating to a 3.7%
annual growth rate. The unemployment rate fell
from 3.9% at the end of the first quarter of 2016 to
the current level of 3.5% this quarter. Dallas/Fort
Worth’s unemployment rate for the quarter was 90
bps lower than Texas (4.4%) and 120 bps lower
than the U.S. (4.7%) in Q2 2016.
An ample supply of well-educated workers and
strong population growth contribute to the area's
fit economy.
With an estimated population of 7.1 million, the
DFW metropolitan area is the fourth-largest MSA
in the United States. The area’s population has
grown by 10.9% since 2010, and growth of 7.7% is
projected from 2016 through 2021, according to
Nielsen Research.
DFW’s affluent population is young, with a median
age of 35 years and with most of the population
(58.6%) in the prime earning years of 20-54. DFW
residents tend to earn more than the national
average, supporting an estimated median
household income of $61,068 annually versus
$54,901 per year in the U.S.
1
2
3
4
3
4
5
6
7
8
9
10
Q2 20
08Q3
2008
Q4 20
08Q1
2009
Q2 20
09Q3
2009
Q4 20
09Q1
2010
Q2 20
10Q3
2010
Q4 20
10Q1
2011
Q2 20
11Q3
2011
Q4 20
11Q1
2012
Q2 20
12Q3
2012
Q4 20
12Q1
2013
Q2 20
13Q3
2013
Q4 20
13Q1
2014
Q2 20
14Q3
2014
Q4 20
14Q1
2015
Q2 20
15Q3
2015
Q4 20
15Q1
2016
Q2 20
16
Jobs (millions)Unemployment Rate (%)
DFW Jobs DFW Texas USA
Source: U.S. Bureau of Labor Statistics, June 2016.
DALLAS / FORT WORTH RETAIL
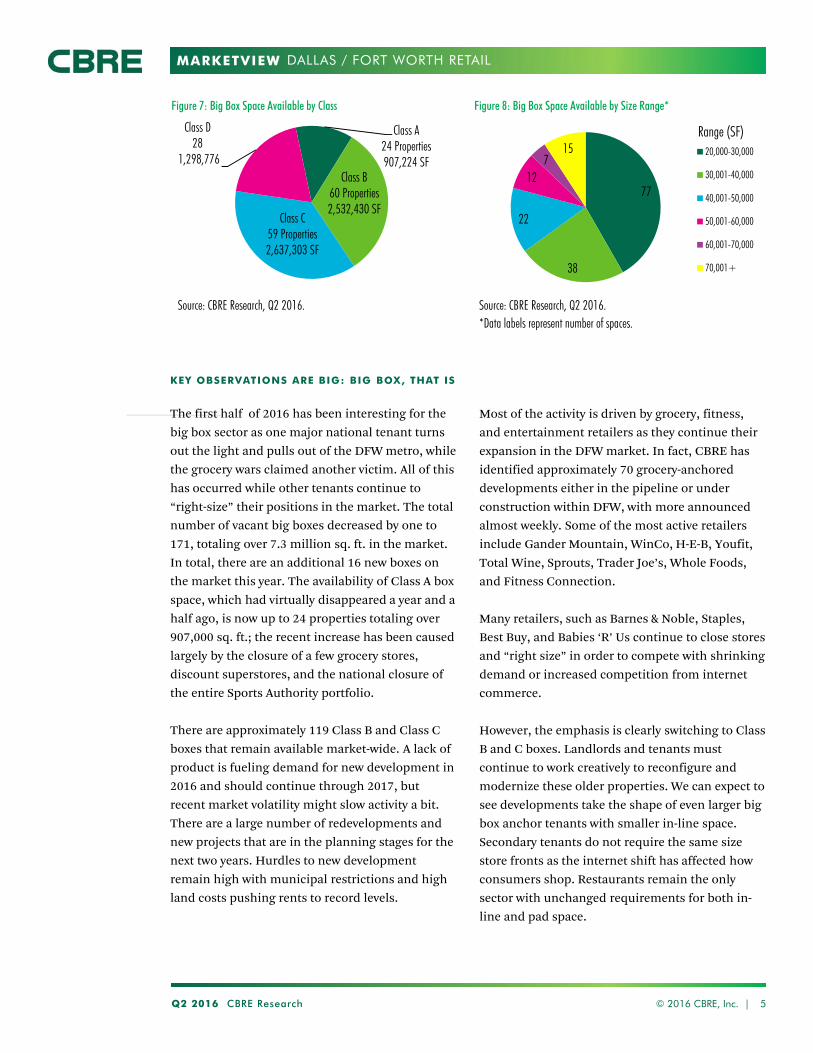
MARKETVIEW
Q2 2016 CBRE Research © 2016 CBRE, Inc. | 5
Figure 7: Big Box Space Available by Class
Source: CBRE Research, Q2 2016.
Figure 8: Big Box Space Available by Size Range*
Source: CBRE Research, Q2 2016.
KEY OBSERVATIONS ARE BIG: BIG BOX, THAT IS
The first half of 2016 has been interesting for the
big box sector as one major national tenant turns
out the light and pulls out of the DFW metro, while
the grocery wars claimed another victim. All of this
has occurred while other tenants continue to
“right-size” their positions in the market. The total
number of vacant big boxes decreased by one to
171, totaling over 7.3 million sq. ft. in the market.
In total, there are an additional 16 new boxes on
the market this year. The availability of Class A box
space, which had virtually disappeared a year and a
half ago, is now up to 24 properties totaling over
907,000 sq. ft.; the recent increase has been caused
largely by the closure of a few grocery stores,
discount superstores, and the national closure of
the entire Sports Authority portfolio.
There are approximately 119 Class B and Class C
boxes that remain available market-wide. A lack of
product is fueling demand for new development in
2016 and should continue through 2017, but
recent market volatility might slow activity a bit.
There are a large number of redevelopments and
new projects that are in the planning stages for the
next two years. Hurdles to new development
remain high with municipal restrictions and high
land costs pushing rents to record levels.
Most of the activity is driven by grocery, fitness,
and entertainment retailers as they continue their
expansion in the DFW market. In fact, CBRE has
identified approximately 70 grocery-anchored
developments either in the pipeline or under
construction within DFW, with more announced
almost weekly. Some of the most active retailers
include Gander Mountain, WinCo, H-E-B, Youfit,
Total Wine, Sprouts, Trader Joe’s, Whole Foods,
and Fitness Connection.
Many retailers, such as Barnes & Noble, Staples,
Best Buy, and Babies ‘R’ Us continue to close stores
and “right size” in order to compete with shrinking
demand or increased competition from internet
commerce.
However, the emphasis is clearly switching to Class
B and C boxes. Landlords and tenants must
continue to work creatively to reconfigure and
modernize these older properties. We can expect to
see developments take the shape of even larger big
box anchor tenants with smaller in-line space.
Secondary tenants do not require the same size
store fronts as the internet shift has affected how
consumers shop. Restaurants remain the only
sector with unchanged requirements for both in-
line and pad space.
*Data labels represent number of spaces.
Class A24 Properties907,224 SF
Class B60 Properties2,532,430 SF
Class C59 Properties2,637,303 SF
Class D28
1,298,776
77
38
22
127
15 20,000-30,000
30,001-40,000
40,001-50,000
50,001-60,000
60,001-70,000
70,001+
Range (SF)
DALLAS / FORT WORTH RETAIL

MARKETVIEW
Q2 2016 CBRE Research © 2016 CBRE, Inc. | 6
Figure 9: Largest Available Big Box Space
Source: CBRE Research, Q2 2016.
Source: CBRE Research, Q2 2016.
Figure 10: Dallas/Ft. Worth Retail Market Size by Classification
29.1
20.616.6
10
10.2
9 3.1
1.4
(%)
Neighborhood Center
Freestanding Single Tenant
Community Center
Regional & Super Regional Mall
Power Center
Strip Center
Lifestyle Center
Other (Theme/Festival & Outlet)
Submarket Address Former Use Available (SF)Far North Dallas 13138 Montfort Drive Macy's 300,300
Far North Dallas 1625 N. Story Rd Discount Big Box 227,200Far North Dallas 3159 S Garland Road Discount Big Box 226,000Central Dallas 811 N. Central Expy Dillard’s 176,259Southwest Dallas 3560 Camp Wisdom Rd Dillard's 150,000North Central Dallas 5000 Alpha Road The Great Indoors 141,690North Central Dallas 13307 Midway Rd Discount Superstore 136,000Central Fort Worth 2100 Green Oaks Neiman Marcus 120,000Far North Dallas 13320 Montfort Drive J.C. Penney 111,657Near North Dallas 8282 Park Ln Wholesale Club 111,501
North Central Dallas 13342 Midway Rd Gabbert’s Furniture 105,000Southeast Dallas 2021 N Town East Blvd Burlington 84,382Southwest Dallas 2550 W Red Bird Ln Terry’s Market 72,911
Southwest Dallas 7401 S Westmoreland Rd Home Depot 71,842
Far North Dallas 3046-3048 Lavon Drive Albertson's 66,817North Central Dallas 4268 Legacy Drive Neighborhood Grocer 62,802Mid-Cities 5425 S. Cooper Street Tom Thumb 62,539Southeast Dallas 1639 S Buckner Blvd Buckner Bazaar 62,000Southeast Dallas 2106 N Galloway Ave Albertson’s 61,935Northcentral Dallas 2515 E Rosemead Pkwy Terry’s Food Store 61,224Mid-Cities 2201 W Southlake Blvd Discount Superstore 59,012Suburban Fort Worth 7120 Rufe Snow Tom Thumb 58,960
DALLAS / FORT WORTH RETAIL
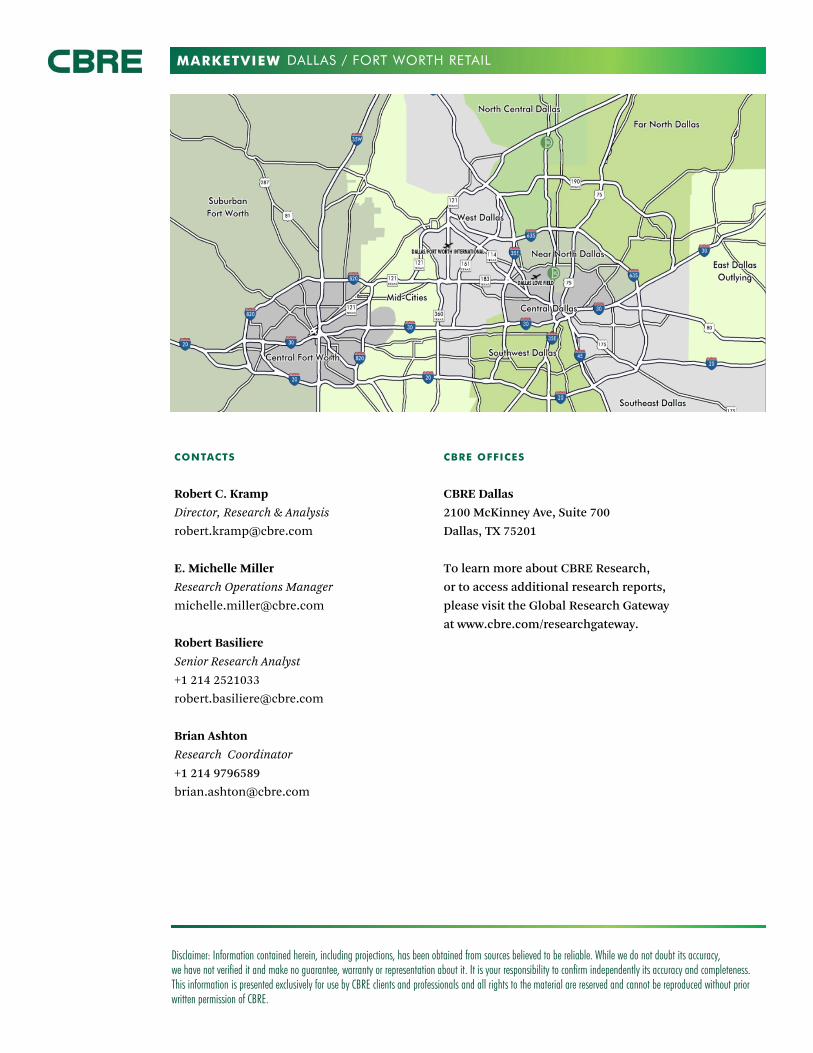
MARKETVIEW
Disclaimer: Information contained herein, including projections, has been obtained from sources believed to be reliable. While we do not doubt its accuracy, we have not verified it and make no guarantee, warranty or representation about it. It is your responsibility to confirm independently its accuracy and completeness. This information is presented exclusively for use by CBRE clients and professionals and all rights to the material are reserved and cannot be reproduced without prior written permission of CBRE.
CONTACTS
Robert C. Kramp
Director, Research & Analysis
E. Michelle Miller
Research Operations Manager
Robert Basiliere
Senior Research Analyst
+1 214 2521033
Brian Ashton
Research Coordinator
+1 214 9796589
CBRE OFFICES
CBRE Dallas
2100 McKinney Ave, Suite 700
Dallas, TX 75201
To learn more about CBRE Research,
or to access additional research reports,
please visit the Global Research Gateway
at www.cbre.com/researchgateway.
DALLAS / FORT WORTH RETAIL

MARKETVIEW
Construction: completions vs. starts, 2016’s metrics to watch
Dallas / Fort Worth Retail, Q1 2016
Q1 2016 CBRE Research © 2016 CBRE, Inc. | 1
Vacancy Rate 6.8%
*Arrows indicate change from previous quarter.
Under Construction 7,119,632 SF
Completions 720,479 SF
Net Absorption 1,472,741 SF
OCCUPANCY IS BACK: REBOUNDS FROM THE
Q3 2015 PULLBACK
Solid absorption numbers combined with modest deliveries in DFW’s tight retail market was a recipe for the 30 basis point (bps) increase in occupancy in Q1 2016. This is the 22nd consecutive quarter the occupancy rate has been over 90% and the second time it has been over 93%.
CONSTRUCTION PIPELINE EXPANDS AS PROJECTS COME OFF DRAWING BOARDS Market expansion carries on as area retailers are attracted to and benefit from the economic staples of the Metroplex. Development has reached a new milestone in here as a total of over seven million sq. ft. is now underway.
Figure 1: Net Absorption and Market Occupancy
Source: CBRE Research, Q1 2016.
DEMAND/COMPLETIONS BOTH TAPER
With the dearth of available space and overall market expansion, most growth continues to occur in the northern submarkets. Recently, Northern Fort Worth has been playing catchup as projects started delivering last quarter (i.e. Target and Main Event).
BIG BOXES NEW TO MARKET WON’T STAY
THERE LONG
With the announcement of nine Sports Authority’s closures in DFW, the big box market saw an uptick of supply on the market. The newly added boxes will most likely be absorbed quickly as they are in preferred Metroplex locations within Class A and B properties.
88.5
89.0
89.5
90.0
90.5
91.0
91.5
92.0
92.5
93.0
93.5
(2)
(1)
0
1
2
3
4
5
6
7
8
9
2006 2007 2008 2009 2010 2011 2012 2013 2014 2015 2016
Occupancy Rate (%) Net Absorption (MSF)
Q1 Q2 Q3 Q4 Total Annual Net Absorption Occupancy Rate
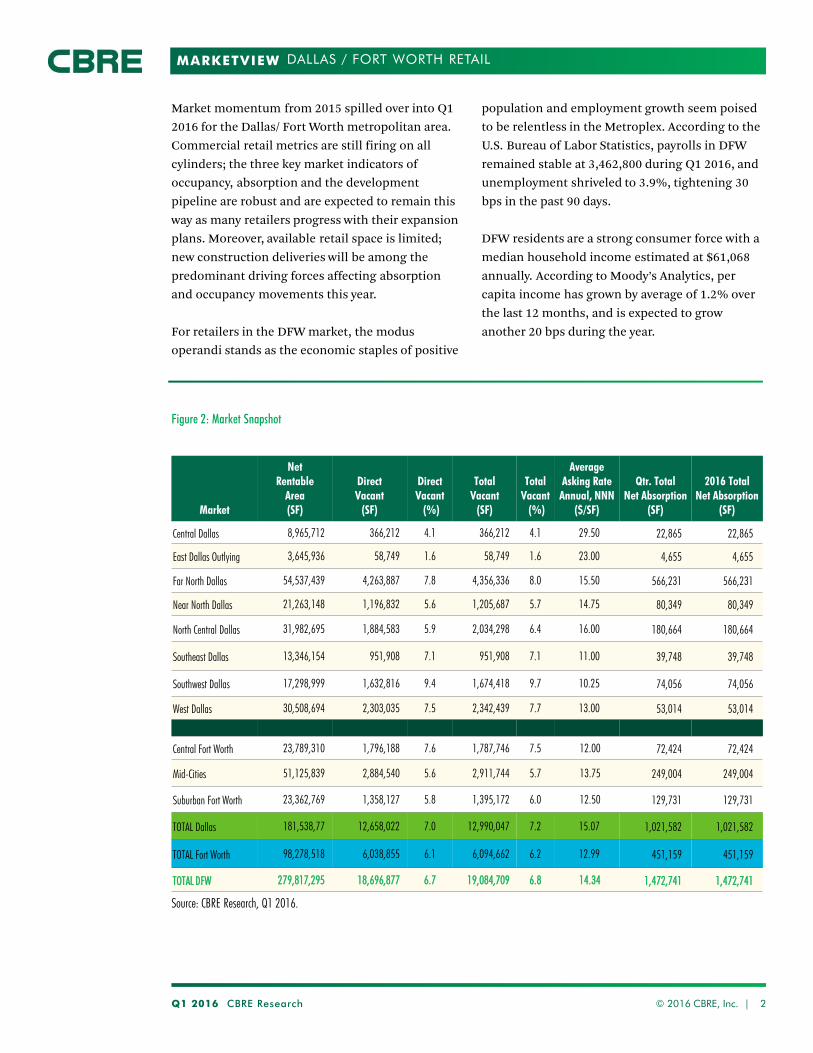
MARKETVIEW
Q1 2016 CBRE Research © 2016 CBRE, Inc. | 2
DALLAS / FORT WORTH RETAIL
Figure 2: Market Snapshot
Market
Net Rentable
Area (SF)
Direct Vacant
(SF)
Direct Vacant (%)
Total Vacant
(SF)
Total Vacant (%)
Average Asking Rate
Annual, NNN ($/SF)
Qtr. Total Net Absorption
(SF)
2016 Total Net Absorption
(SF)
Central Dallas 8,965,712 366,212 4.1 366,212 4.1 29.50 22,865 22,865
East Dallas Outlying 3,645,936 58,749 1.6 58,749 1.6 23.00 4,655 4,655
Far North Dallas 54,537,439 4,263,887 7.8 4,356,336 8.0 15.50 566,231 566,231
Near North Dallas 21,263,148 1,196,832 5.6 1,205,687 5.7 14.75 80,349 80,349
North Central Dallas 31,982,695 1,884,583 5.9 2,034,298 6.4 16.00 180,664 180,664
Southeast Dallas 13,346,154 951,908 7.1 951,908 7.1 11.00 39,748 39,748
Southwest Dallas 17,298,999 1,632,816 9.4 1,674,418 9.7 10.25 74,056 74,056
West Dallas 30,508,694 2,303,035 7.5 2,342,439 7.7 13.00 53,014 53,014
Central Fort Worth 23,789,310 1,796,188 7.6 1,787,746 7.5 12.00 72,424 72,424
Mid-Cities 51,125,839 2,884,540 5.6 2,911,744 5.7 13.75 249,004 249,004
Suburban Fort Worth 23,362,769 1,358,127 5.8 1,395,172 6.0 12.50 129,731 129,731
TOTAL Dallas 181,538,77 12,658,022 7.0 12,990,047 7.2 15.07 1,021,582 1,021,582
TOTAL Fort Worth 98,278,518 6,038,855 6.1 6,094,662 6.2 12.99 451,159 451,159
TOTAL DFW 279,817,295 18,696,877 6.7 19,084,709 6.8 14.34 1,472,741 1,472,741
Market momentum from 2015 spilled over into Q1 2016 for the Dallas/ Fort Worth metropolitan area. Commercial retail metrics are still firing on all cylinders; the three key market indicators of occupancy, absorption and the development pipeline are robust and are expected to remain this way as many retailers progress with their expansion plans. Moreover, available retail space is limited; new construction deliveries will be among the predominant driving forces affecting absorption and occupancy movements this year. For retailers in the DFW market, the modus operandi stands as the economic staples of positive
population and employment growth seem poised to be relentless in the Metroplex. According to the U.S. Bureau of Labor Statistics, payrolls in DFW remained stable at 3,462,800 during Q1 2016, and unemployment shriveled to 3.9%, tightening 30 bps in the past 90 days. DFW residents are a strong consumer force with a median household income estimated at $61,068 annually. According to Moody’s Analytics, per capita income has grown by average of 1.2% over the last 12 months, and is expected to grow another 20 bps during the year.
Source: CBRE Research, Q1 2016.
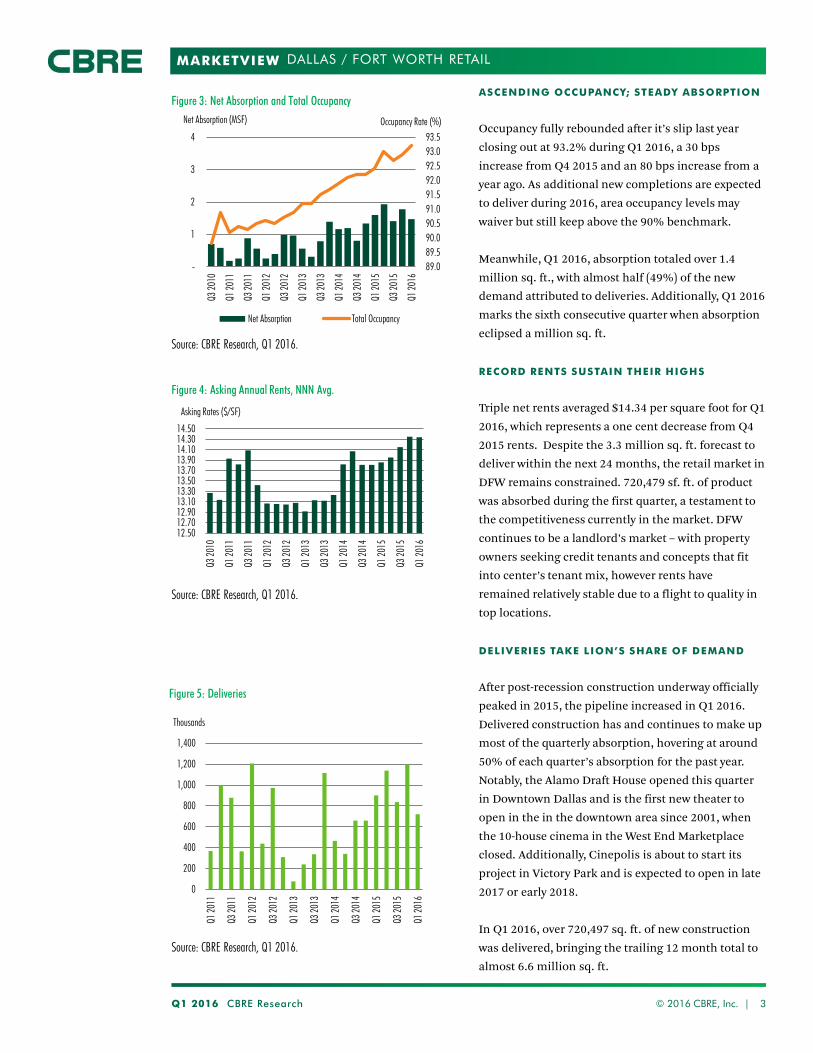
MARKETVIEW
0
200
400
600
800
1,000
1,200
1,400
Q1 20
11
Q3 20
11
Q1 20
12
Q3 20
12
Q1 20
13
Q3 20
13
Q1 20
14
Q3 20
14
Q1 20
15
Q3 20
15
Q1 20
16
Thousands
ASCENDING OCCUPANCY; STEADY ABSORPTION
Occupancy fully rebounded after it’s slip last year closing out at 93.2% during Q1 2016, a 30 bps increase from Q4 2015 and an 80 bps increase from a year ago. As additional new completions are expected to deliver during 2016, area occupancy levels may waiver but still keep above the 90% benchmark.
Meanwhile, Q1 2016, absorption totaled over 1.4 million sq. ft., with almost half (49%) of the new demand attributed to deliveries. Additionally, Q1 2016 marks the sixth consecutive quarter when absorption eclipsed a million sq. ft.
RECORD RENTS SUSTAIN THEIR HIGHS
Triple net rents averaged $14.34 per square foot for Q1 2016, which represents a one cent decrease from Q4 2015 rents. Despite the 3.3 million sq. ft. forecast to deliver within the next 24 months, the retail market in DFW remains constrained. 720,479 sf. ft. of product was absorbed during the first quarter, a testament to the competitiveness currently in the market. DFW continues to be a landlord’s market – with property owners seeking credit tenants and concepts that fit into center’s tenant mix, however rents have remained relatively stable due to a flight to quality in top locations.
DELIVERIES TAKE LION’S SHARE OF DEMAND
After post-recession construction underway officially peaked in 2015, the pipeline increased in Q1 2016. Delivered construction has and continues to make up most of the quarterly absorption, hovering at around 50% of each quarter’s absorption for the past year. Notably, the Alamo Draft House opened this quarter in Downtown Dallas and is the first new theater to open in the in the downtown area since 2001, when the 10-house cinema in the West End Marketplace closed. Additionally, Cinepolis is about to start its project in Victory Park and is expected to open in late 2017 or early 2018. In Q1 2016, over 720,497 sq. ft. of new construction was delivered, bringing the trailing 12 month total to almost 6.6 million sq. ft.
Q1 2016 CBRE Research © 2016 CBRE, Inc. | 3
Figure 3: Net Absorption and Total Occupancy
Source: CBRE Research, Q1 2016.
Figure 5: Deliveries
Source: CBRE Research, Q1 2016.
89.089.590.090.591.091.592.092.593.093.5
-
1
2
3
4
Q3 20
10
Q1 20
11
Q3 20
11
Q1 20
12
Q3 20
12
Q1 20
13
Q3 20
13
Q1 20
14
Q3 20
14
Q1 20
15
Q3 20
15
Q1 20
16
Net Absorption (MSF)
Net Absorption Total Occupancy
Occupancy Rate (%)
12.5012.7012.9013.1013.3013.5013.7013.9014.1014.3014.50
Q3 20
10
Q1 20
11
Q3 20
11
Q1 20
12
Q3 20
12
Q1 20
13
Q3 20
13
Q1 20
14
Q3 20
14
Q1 20
15
Q3 20
15
Q1 20
16Asking Rates ($/SF)
DALLAS / FORT WORTH RETAIL
Figure 4: Asking Annual Rents, NNN Avg.
Source: CBRE Research, Q1 2016.
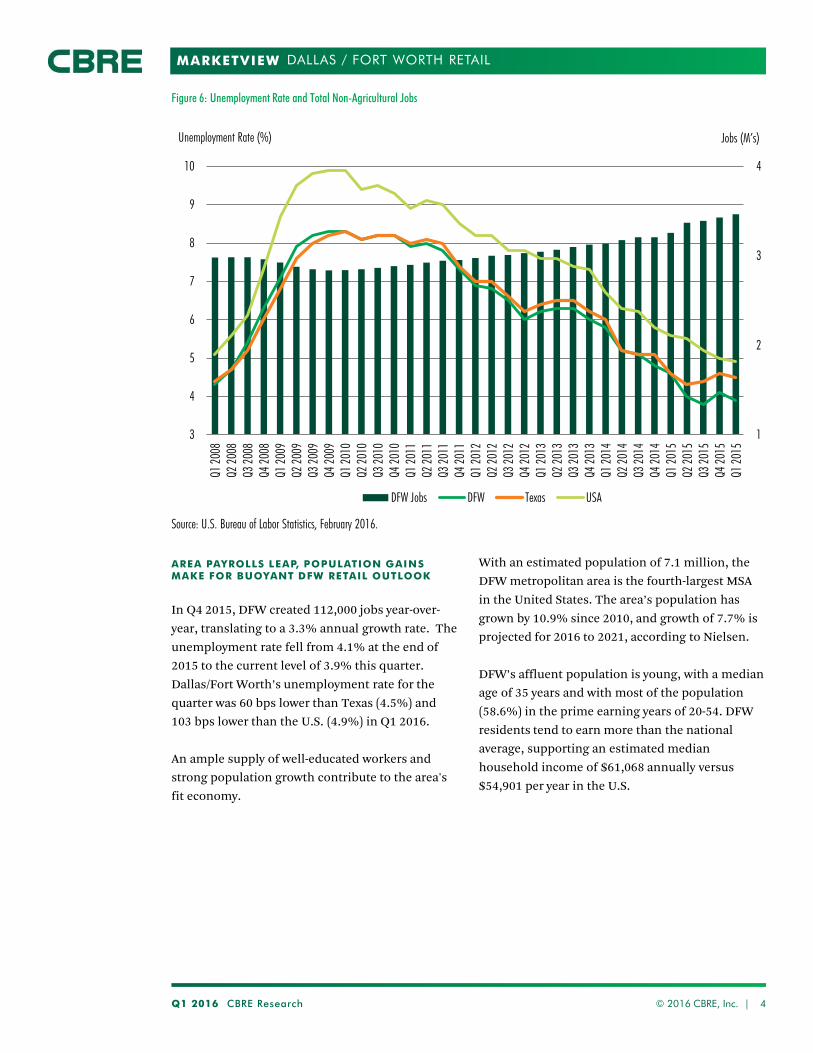
MARKETVIEW
Q1 2016 CBRE Research © 2016 CBRE, Inc. | 4
DALLAS / FORT WORTH RETAIL
Figure 6: Unemployment Rate and Total Non-Agricultural Jobs
AREA PAYROLLS LEAP, POPULATION GAINS MAKE FOR BUOYANT DFW RETAIL OUTLOOK
In Q4 2015, DFW created 112,000 jobs year-over-year, translating to a 3.3% annual growth rate. The unemployment rate fell from 4.1% at the end of 2015 to the current level of 3.9% this quarter. Dallas/Fort Worth’s unemployment rate for the quarter was 60 bps lower than Texas (4.5%) and 103 bps lower than the U.S. (4.9%) in Q1 2016. An ample supply of well-educated workers and strong population growth contribute to the area's fit economy.
With an estimated population of 7.1 million, the DFW metropolitan area is the fourth-largest MSA in the United States. The area’s population has grown by 10.9% since 2010, and growth of 7.7% is projected for 2016 to 2021, according to Nielsen.
DFW’s affluent population is young, with a median age of 35 years and with most of the population (58.6%) in the prime earning years of 20-54. DFW residents tend to earn more than the national average, supporting an estimated median household income of $61,068 annually versus $54,901 per year in the U.S.
1
2
3
4
3
4
5
6
7
8
9
10
Q1 20
08Q2
2008
Q3 20
08Q4
2008
Q1 20
09Q2
2009
Q3 20
09Q4
2009
Q1 20
10Q2
2010
Q3 20
10Q4
2010
Q1 20
11Q2
2011
Q3 20
11Q4
2011
Q1 20
12Q2
2012
Q3 20
12Q4
2012
Q1 20
13Q2
2013
Q3 20
13Q4
2013
Q1 20
14Q2
2014
Q3 20
14Q4
2014
Q1 20
15Q2
2015
Q3 20
15Q4
2015
Q1 20
15
Jobs (M’s) Unemployment Rate (%)
DFW Jobs DFW Texas USA
Source: U.S. Bureau of Labor Statistics, February 2016.
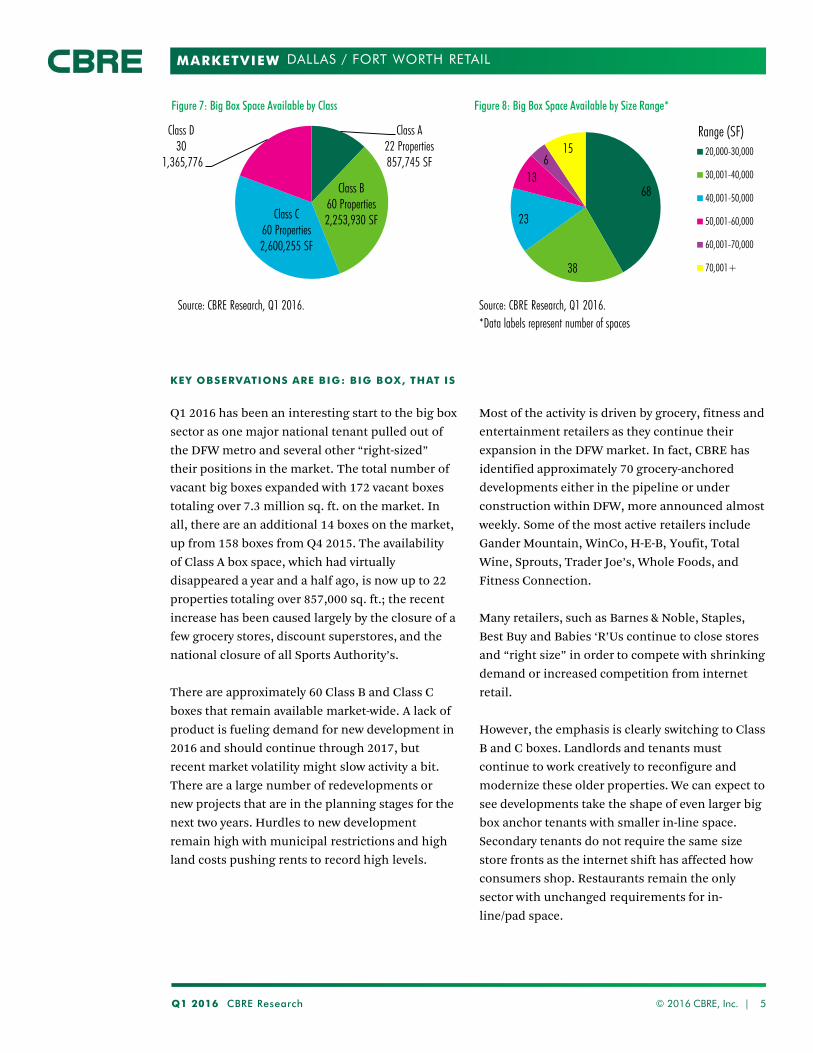
MARKETVIEW
Q1 2016 CBRE Research © 2016 CBRE, Inc. | 5
DALLAS / FORT WORTH RETAIL
Figure 7: Big Box Space Available by Class
Source: CBRE Research, Q1 2016.
Figure 8: Big Box Space Available by Size Range*
Source: CBRE Research, Q1 2016.
KEY OBSERVATIONS ARE BIG: BIG BOX, THAT IS
Q1 2016 has been an interesting start to the big box sector as one major national tenant pulled out of the DFW metro and several other “right-sized” their positions in the market. The total number of vacant big boxes expanded with 172 vacant boxes totaling over 7.3 million sq. ft. on the market. In all, there are an additional 14 boxes on the market, up from 158 boxes from Q4 2015. The availability of Class A box space, which had virtually disappeared a year and a half ago, is now up to 22 properties totaling over 857,000 sq. ft.; the recent increase has been caused largely by the closure of a few grocery stores, discount superstores, and the national closure of all Sports Authority’s. There are approximately 60 Class B and Class C boxes that remain available market-wide. A lack of product is fueling demand for new development in 2016 and should continue through 2017, but recent market volatility might slow activity a bit. There are a large number of redevelopments or new projects that are in the planning stages for the next two years. Hurdles to new development remain high with municipal restrictions and high land costs pushing rents to record high levels.
Most of the activity is driven by grocery, fitness and entertainment retailers as they continue their expansion in the DFW market. In fact, CBRE has identified approximately 70 grocery-anchored developments either in the pipeline or under construction within DFW, more announced almost weekly. Some of the most active retailers include Gander Mountain, WinCo, H-E-B, Youfit, Total Wine, Sprouts, Trader Joe’s, Whole Foods, and Fitness Connection. Many retailers, such as Barnes & Noble, Staples, Best Buy and Babies ‘R’Us continue to close stores and “right size” in order to compete with shrinking demand or increased competition from internet retail. However, the emphasis is clearly switching to Class B and C boxes. Landlords and tenants must continue to work creatively to reconfigure and modernize these older properties. We can expect to see developments take the shape of even larger big box anchor tenants with smaller in-line space. Secondary tenants do not require the same size store fronts as the internet shift has affected how consumers shop. Restaurants remain the only sector with unchanged requirements for in-line/pad space.
*Data labels represent number of spaces
Class A 22 Properties 857,745 SF
Class B 60 Properties 2,253,930 SF Class C
60 Properties 2,600,255 SF
Class D 30
1,365,776
68
38
23
13 6
15 20,000-30,000
30,001-40,000
40,001-50,000
50,001-60,000
60,001-70,000
70,001+
Range (SF)
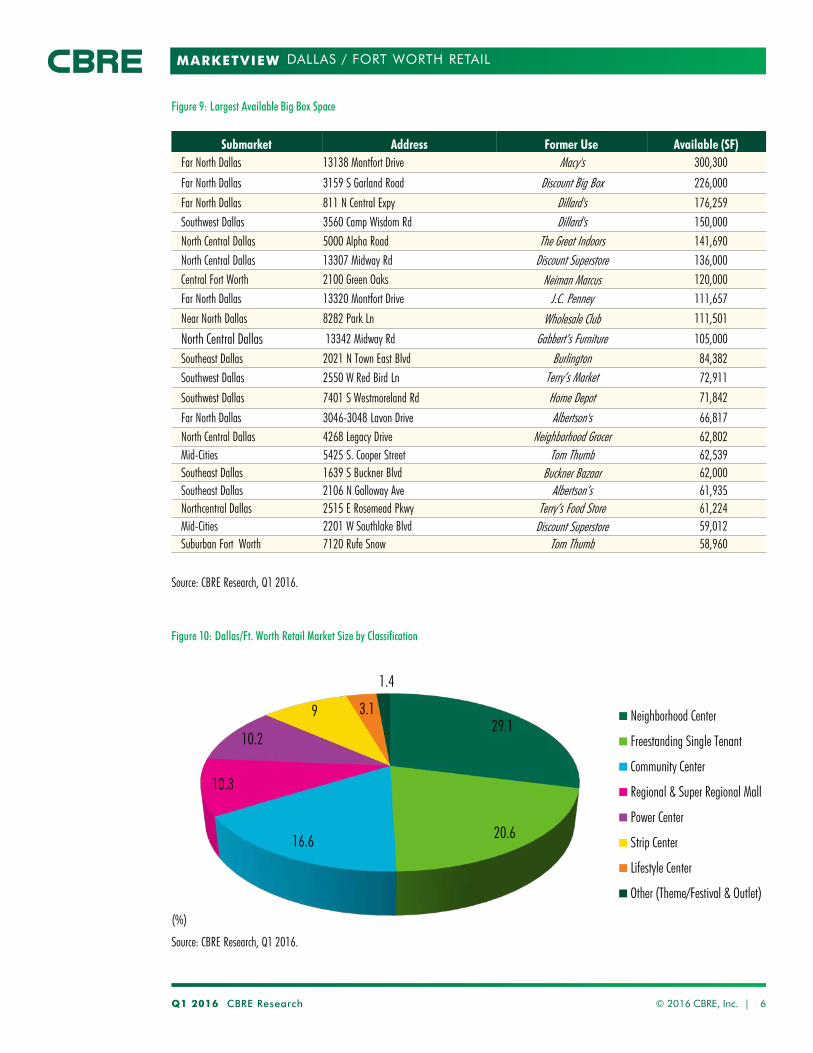
MARKETVIEW
Q1 2016 CBRE Research © 2016 CBRE, Inc. | 6
DALLAS / FORT WORTH RETAIL
Figure 9: Largest Available Big Box Space
Source: CBRE Research, Q1 2016.
Source: CBRE Research, Q1 2016.
Figure 10: Dallas/Ft. Worth Retail Market Size by Classification
29.1
20.6 16.6
10.3
10.2
9 3.1
1.4
(%)
Neighborhood Center
Freestanding Single Tenant
Community Center
Regional & Super Regional Mall
Power Center
Strip Center
Lifestyle Center
Other (Theme/Festival & Outlet)
Submarket Address Former Use Available (SF) Far North Dallas 13138 Montfort Drive Macy's 300,300 Far North Dallas 3159 S Garland Road Discount Big Box 226,000 Far North Dallas 811 N Central Expy Dillard's 176,259 Southwest Dallas 3560 Camp Wisdom Rd Dillard's 150,000 North Central Dallas 5000 Alpha Road The Great Indoors 141,690 North Central Dallas 13307 Midway Rd Discount Superstore 136,000 Central Fort Worth 2100 Green Oaks Neiman Marcus 120,000 Far North Dallas 13320 Montfort Drive J.C. Penney 111,657 Near North Dallas 8282 Park Ln Wholesale Club 111,501 North Central Dallas 13342 Midway Rd Gabbert’s Furniture 105,000 Southeast Dallas 2021 N Town East Blvd Burlington 84,382 Southwest Dallas 2550 W Red Bird Ln Terry’s Market 72,911
Southwest Dallas 7401 S Westmoreland Rd Home Depot 71,842
Far North Dallas 3046-3048 Lavon Drive Albertson's 66,817 North Central Dallas 4268 Legacy Drive Neighborhood Grocer 62,802 Mid-Cities 5425 S. Cooper Street Tom Thumb 62,539 Southeast Dallas 1639 S Buckner Blvd Buckner Bazaar 62,000 Southeast Dallas 2106 N Galloway Ave Albertson’s 61,935 Northcentral Dallas 2515 E Rosemead Pkwy Terry’s Food Store 61,224 Mid-Cities 2201 W Southlake Blvd Discount Superstore 59,012 Suburban Fort Worth 7120 Rufe Snow Tom Thumb 58,960
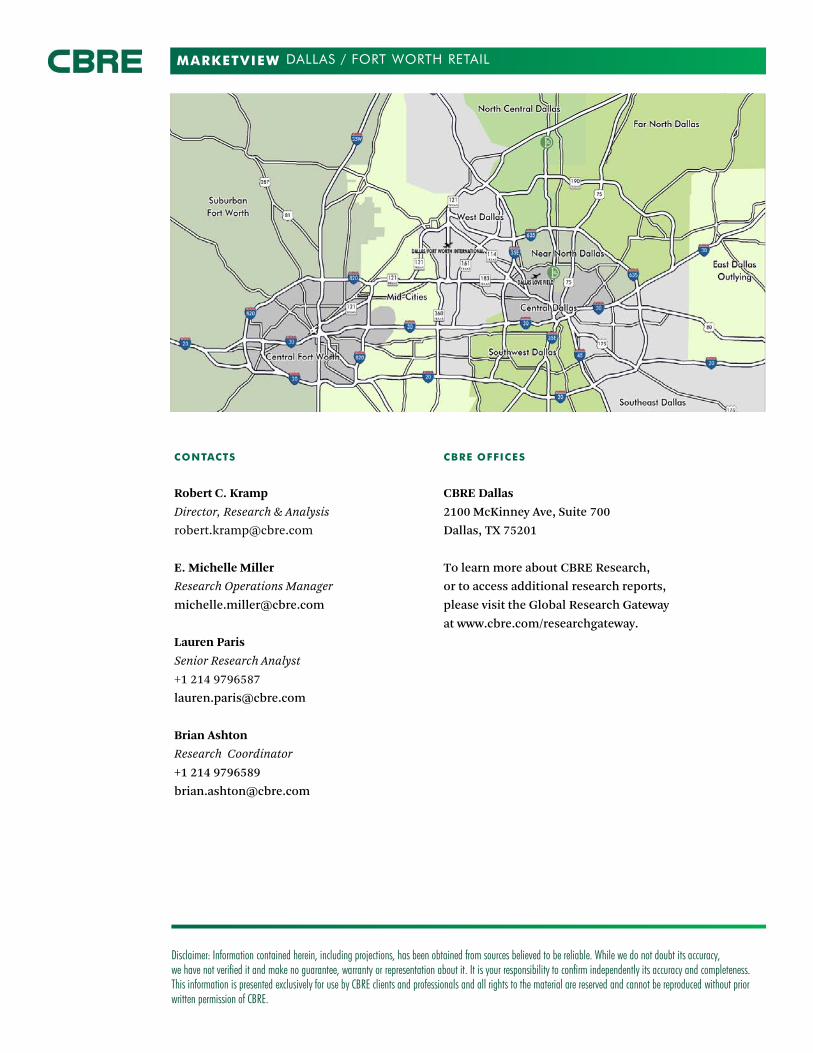
MARKETVIEW
Disclaimer: Information contained herein, including projections, has been obtained from sources believed to be reliable. While we do not doubt its accuracy, we have not verified it and make no guarantee, warranty or representation about it. It is your responsibility to confirm independently its accuracy and completeness. This information is presented exclusively for use by CBRE clients and professionals and all rights to the material are reserved and cannot be reproduced without prior written permission of CBRE.
CONTACTS
Robert C. Kramp Director, Research & Analysis [email protected] E. Michelle Miller Research Operations Manager [email protected]
Lauren Paris Senior Research Analyst +1 214 9796587 [email protected] Brian Ashton Research Coordinator +1 214 9796589 [email protected]
CBRE OFFICES
CBRE Dallas 2100 McKinney Ave, Suite 700 Dallas, TX 75201
To learn more about CBRE Research, or to access additional research reports, please visit the Global Research Gateway at www.cbre.com/researchgateway.
DALLAS / FORT WORTH RETAIL
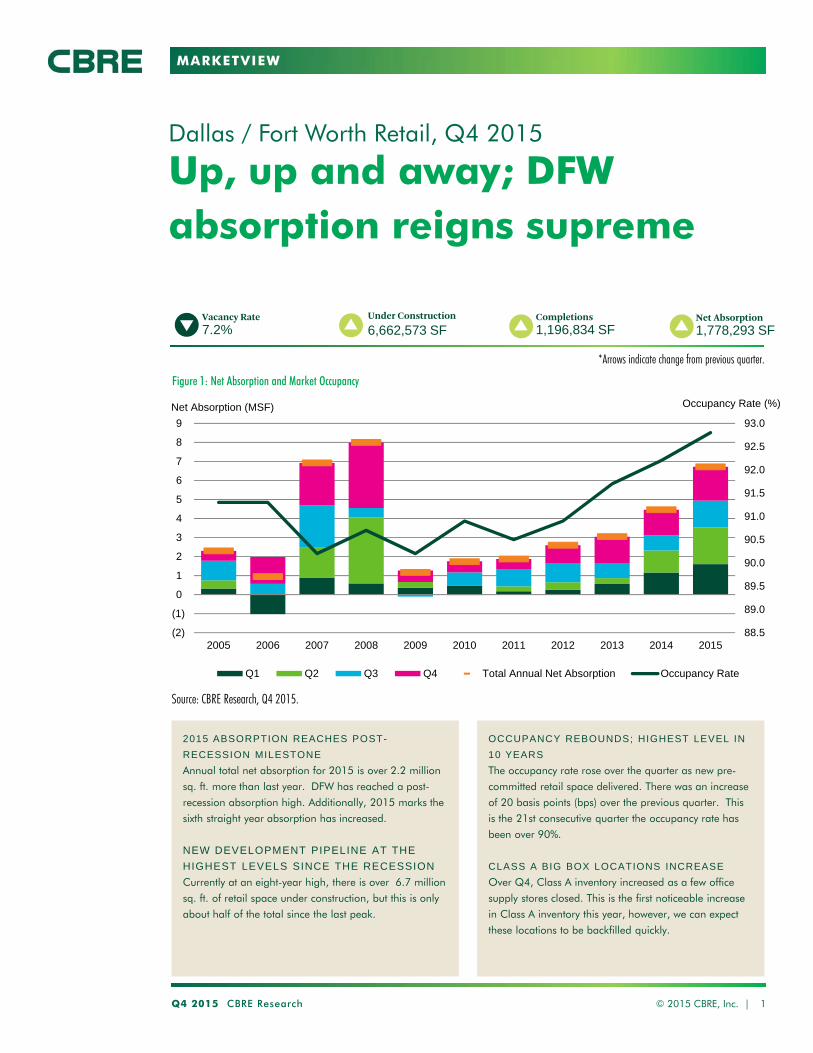
MARKETVIEW
Up, up and away; DFW absorption reigns supreme
Dallas / Fort Worth Retail, Q4 2015
Q4 2015 CBRE Research © 2015 CBRE, Inc. | 1
Vacancy Rate7.2%
*Arrows indicate change from previous quarter.
Under Construction
6,662,573 SFCompletions1,196,834 SF
Net Absorption1,778,293 SF
2015 ABSORPTION REACHES POST-
RECESSION MILESTONE
Annual total net absorption for 2015 is over 2.2 million
sq. ft. more than last year. DFW has reached a post-
recession absorption high. Additionally, 2015 marks the
sixth straight year absorption has increased.
NEW DEVELOPMENT PIPELINE AT THE
HIGHEST LEVELS SINCE THE RECESSION
Currently at an eight-year high, there is over 6.7 million
sq. ft. of retail space under construction, but this is only
about half of the total since the last peak.
Figure 1: Net Absorption and Market Occupancy
Source: CBRE Research, Q4 2015.
OCCUPANCY REBOUNDS; HIGHEST LEVEL IN
10 YEARS
The occupancy rate rose over the quarter as new pre-
committed retail space delivered. There was an increase
of 20 basis points (bps) over the previous quarter. This
is the 21st consecutive quarter the occupancy rate has
been over 90%.
CLASS A BIG BOX LOCATIONS INCREASE
Over Q4, Class A inventory increased as a few office
supply stores closed. This is the first noticeable increase
in Class A inventory this year, however, we can expect
these locations to be backfilled quickly.
88.5
89.0
89.5
90.0
90.5
91.0
91.5
92.0
92.5
93.0
(2)
(1)
0
1
2
3
4
5
6
7
8
9
2005 2006 2007 2008 2009 2010 2011 2012 2013 2014 2015
Occupancy Rate (%)Net Absorption (MSF)
Q1 Q2 Q3 Q4 Total Annual Net Absorption Occupancy Rate

MARKETVIEW
Q4 2015 CBRE Research © 2015 CBRE, Inc. | 2
DALLAS / FORT WORTH RETAIL
Figure 2: Market Snapshot
Market
Net Rentable
Area(SF)
DirectVacant
(SF)
Direct Vacant
(%)
TotalVacant
(SF)
Total Vacant
(%)
Average Asking RateAnnual, NNN
($/SF)
Qtr. TotalNet Absorption
(SF)
2015 Total Net Absorption
(SF)
Central Dallas 9,093,061 389,504 4.3 389,504 4.3 29.75 22,115 245,906
East Dallas Outlying 3,633,860 83,904 2.3 83,904 2.3 22.25 10,726 97,990
Far North Dallas 54,152,868 4,551,576 8.4 4,662,005 8.6 15.25 237,488 942,926
Near North Dallas 21,064,645 1,241,236 5.9 1,241,236 5.9 15.50 125,656 356,557
North Central Dallas 32,020,305 1,974,417 6.2 2,117,732 6.6 16.25 201,739 1,716,562
Southeast Dallas 13,345,878 917,426 6.9 917,426 6.9 11.00 2,052 67,641
Southwest Dallas 17,180,845 1,655,253 9.6 1,700,455 9.9 10.25 91,008 92,066
West Dallas 30,501,537 2,515,915 8.2 2,558,319 8.4 12.75 71,428 502,973
Central Fort Worth 23,777,270 1,809,650 7.6 1,820,285 7.7 12.50 141,329 471,480
Mid-Cities 51,030,130 2,969,906 5.8 2,996,615 5.9 13.50 385,561 1,131,435
Suburban Fort Worth 23,147,717 1,366,612 5.9 1,482,617 6.4 12.00 489,191 1,091,933
TOTAL Dallas 181,192,999 13,366,612 7.4 13,667,581 7.5 15.10 762,212 4,022,621
TOTAL Fort Worth 97,955,117 6,144,168 6.3 6,299,517 6.4 12.97 1,016,081 2,694,848
TOTAL DFW 279,148,116 19,475,399 7.0 19,967,098 7.2 14.35 1,778,293 6,717,469
Another year with nothing to fear, 2015 ends with strong retail market metrics that are expected to continue into 2016. Overall, single digit vacancy has remained the norm for the last five years, along with yearly increases in total absorption and a healthy construction pipeline. Moreover, retail space continues to remain limited; especially for smaller users in the market as end cap and second generation restaurant space continues to be difficult for tenants to acquire.
For retailers in the DFW market the modus operandi stands, as the economic staples of strong
population and employment growth remain constant in the Metroplex. According to the U.S. Bureau of Labor Statistics, employment in DFW grew by nearly 37,000 jobs during Q4 2015, and unemployment decreased by 10 bps to 3.8%. DFW residents are a strong consumer force, with a per capita income estimated at $50,076. According to Moody’s Analytics, per capita income has grown by average of 1.8% over the last 12 months, and is expected to grow another 2.8% by this time next year.
Source: CBRE Research, Q4 2015.
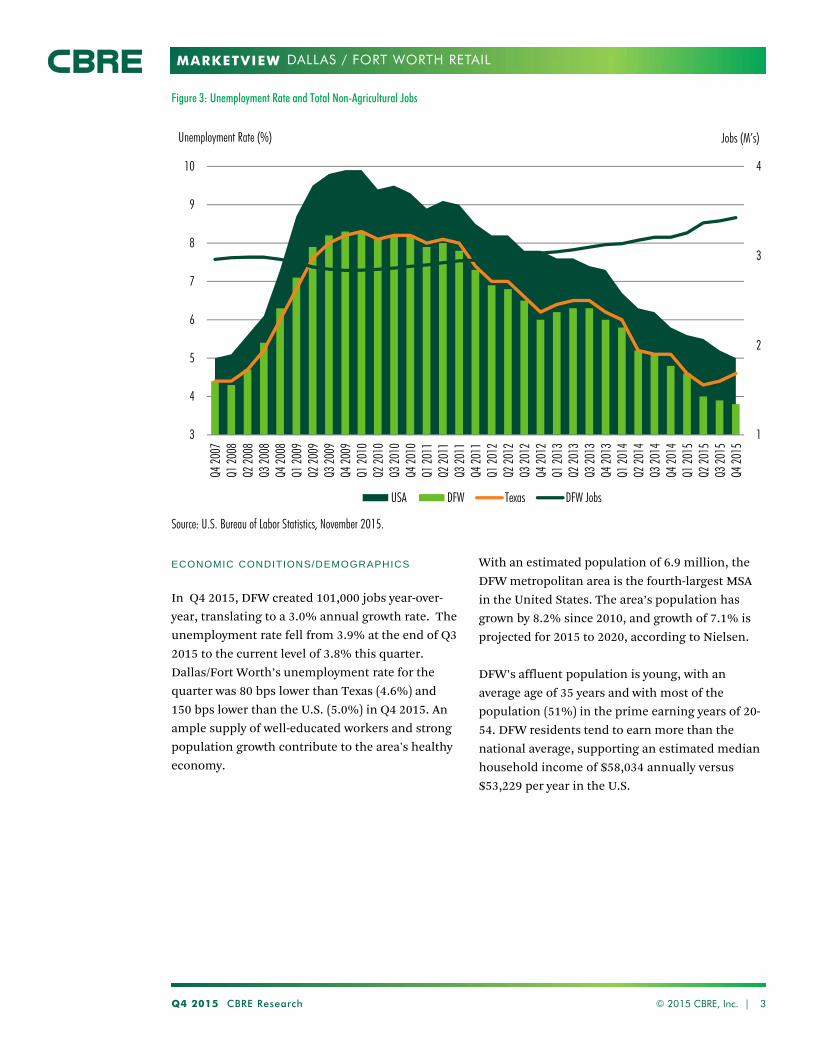
MARKETVIEW
Q4 2015 CBRE Research © 2015 CBRE, Inc. | 3
DALLAS / FORT WORTH RETAIL
Figure 3: Unemployment Rate and Total Non-Agricultural Jobs
ECONOMIC CONDITIONS/DEMOGRAPHICS
In Q4 2015, DFW created 101,000 jobs year-over-year, translating to a 3.0% annual growth rate. The unemployment rate fell from 3.9% at the end of Q3 2015 to the current level of 3.8% this quarter. Dallas/Fort Worth’s unemployment rate for the quarter was 80 bps lower than Texas (4.6%) and 150 bps lower than the U.S. (5.0%) in Q4 2015. An ample supply of well-educated workers and strong population growth contribute to the area's healthy economy.
With an estimated population of 6.9 million, the DFW metropolitan area is the fourth-largest MSA in the United States. The area’s population has grown by 8.2% since 2010, and growth of 7.1% is projected for 2015 to 2020, according to Nielsen.
DFW’s affluent population is young, with an average age of 35 years and with most of the population (51%) in the prime earning years of 20-54. DFW residents tend to earn more than the national average, supporting an estimated median household income of $58,034 annually versus $53,229 per year in the U.S.
1
2
3
4
3
4
5
6
7
8
9
10
Q4 20
07Q1
2008
Q2 20
08Q3
2008
Q4 20
08Q1
2009
Q2 20
09Q3
2009
Q4 20
09Q1
2010
Q2 20
10Q3
2010
Q4 20
10Q1
2011
Q2 20
11Q3
2011
Q4 20
11Q1
2012
Q2 20
12Q3
2012
Q4 20
12Q1
2013
Q2 20
13Q3
2013
Q4 20
13Q1
2014
Q2 20
14Q3
2014
Q4 20
14Q1
2015
Q2 20
15Q3
2015
Q4 20
15
Jobs (M’s)Unemployment Rate (%)
USA DFW Texas DFW Jobs
Source: U.S. Bureau of Labor Statistics, November 2015.
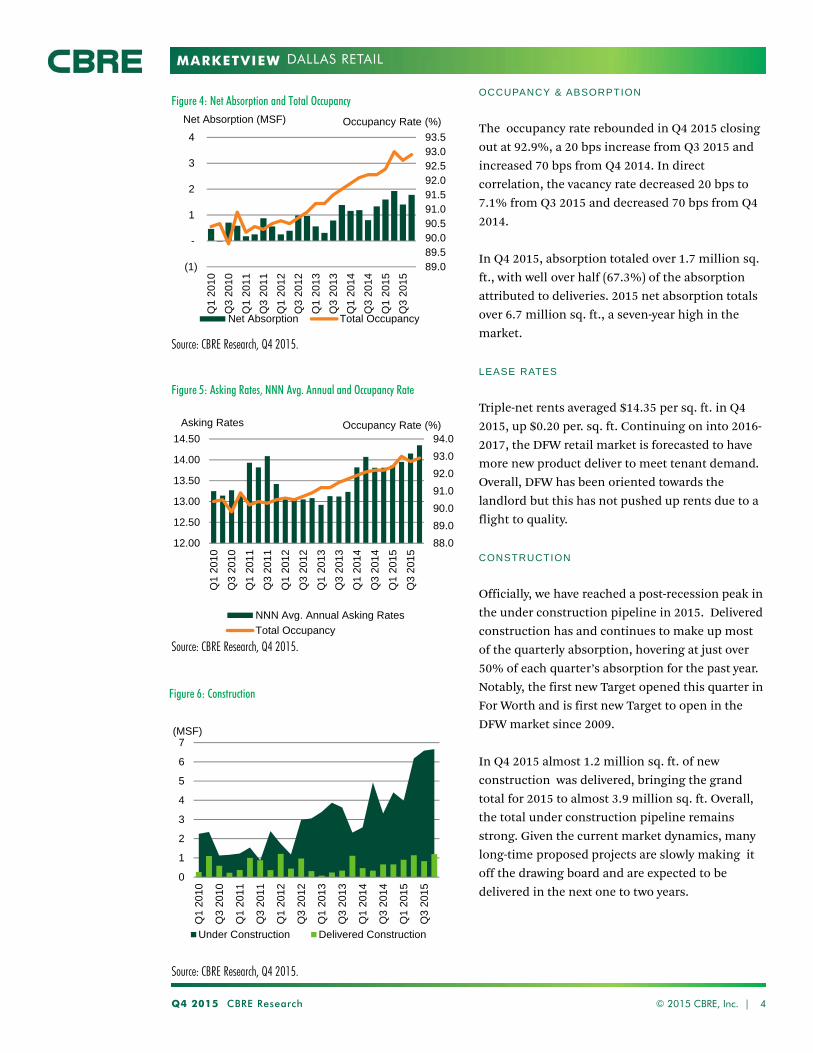
MARKETVIEW
OCCUPANCY & ABSORPTION
The occupancy rate rebounded in Q4 2015 closing out at 92.9%, a 20 bps increase from Q3 2015 and increased 70 bps from Q4 2014. In direct correlation, the vacancy rate decreased 20 bps to 7.1% from Q3 2015 and decreased 70 bps from Q4 2014.
In Q4 2015, absorption totaled over 1.7 million sq. ft., with well over half (67.3%) of the absorption attributed to deliveries. 2015 net absorption totals over 6.7 million sq. ft., a seven-year high in the market.
LEASE RATES
Triple-net rents averaged $14.35 per sq. ft. in Q4 2015, up $0.20 per. sq. ft. Continuing on into 2016-2017, the DFW retail market is forecasted to have more new product deliver to meet tenant demand. Overall, DFW has been oriented towards the landlord but this has not pushed up rents due to a flight to quality.
CONSTRUCTION
Officially, we have reached a post-recession peak in the under construction pipeline in 2015. Delivered construction has and continues to make up most of the quarterly absorption, hovering at just over 50% of each quarter’s absorption for the past year. Notably, the first new Target opened this quarter in For Worth and is first new Target to open in the DFW market since 2009.
In Q4 2015 almost 1.2 million sq. ft. of new construction was delivered, bringing the grand total for 2015 to almost 3.9 million sq. ft. Overall, the total under construction pipeline remains strong. Given the current market dynamics, many long-time proposed projects are slowly making it off the drawing board and are expected to be delivered in the next one to two years.
Q4 2015 CBRE Research © 2015 CBRE, Inc. | 4
DALLAS RETAIL
Figure 4: Net Absorption and Total Occupancy
Figure 5: Asking Rates, NNN Avg. Annual and Occupancy Rate
Source: CBRE Research, Q4 2015.
Source: CBRE Research, Q4 2015.
Figure 6: Construction
Source: CBRE Research, Q4 2015.
89.089.590.090.591.091.592.092.593.093.5
(1)
-
1
2
3
4
Q1
201
0
Q3
201
0
Q1
201
1
Q3
201
1
Q1
201
2
Q3
201
2
Q1
201
3
Q3
201
3
Q1
201
4
Q3
201
4
Q1
201
5
Q3
201
5
Net Absorption (MSF)
Net Absorption Total Occupancy
Occupancy Rate (%)
0
1
2
3
4
5
6
7
Q1
201
0
Q3
201
0
Q1
201
1
Q3
201
1
Q1
201
2
Q3
201
2
Q1
201
3
Q3
201
3
Q1
201
4
Q3
201
4
Q1
201
5
Q3
201
5
(MSF)
Under Construction Delivered Construction
88.0
89.0
90.0
91.0
92.0
93.0
94.0
12.00
12.50
13.00
13.50
14.00
14.50
Q1
201
0
Q3
201
0
Q1
201
1
Q3
201
1
Q1
201
2
Q3
201
2
Q1
201
3
Q3
201
3
Q1
201
4
Q3
201
4
Q1
201
5
Q3
201
5
NNN Avg. Annual Asking Rates
Total Occupancy
Occupancy Rate (%)Asking Rates

MARKETVIEW
Q4 2015 CBRE Research © 2015 CBRE, Inc. | 5
DALLAS / FORT WORTH RETAIL
Figure 7: Big Box Space Available by Class
Source: CBRE Research, Q4 2015.
Figure 8: Big Box Space Available by Size Range*
Source: CBRE Research, Q4 2015.
KEY OBSERVATIONS
The last quarter of 2015, the big box sector finally saw some change. The year ended with 158 vacant boxes totaling over 6.8 million sq. ft. on the market. In all, there are an additional 15 boxes on the market, up from 143 boxes from Q3 2015. The availability of Class A box space, which had virtually disappeared a year ago, is now up to 18 properties totaling over 625,000 sq. ft.; the recent increase has been caused largely by the closure of several Staples, Office Max and Office Depot stores. There are approximately 54 Class B boxes and 56 Class C boxes that remain available market-wide. A lack of product is fueling demand for new development in 2016 and should continue through 2017. There are a large number of redevelopments or new projects that are in the planning stages for the next two years. Hurdles to new development remain high with municipal restrictions and high land costs pushing rents to record high levels.
Most of the activity is driven by grocery, fitness and entertainment retailers as they continue their expansion in the DFW market. In fact, CBRE has identified over 70 grocery-anchored developments either in the pipeline or under construction within DFW. Some of the most active retailers include Gander Mountain, WinCo, H-E-B, Youfit, Total Wine, Sprouts, Trader Joes, Whole Foods, and Fitness Connection.
Many retailers, such as Barnes & Noble, Staples, Tiger Direct, Babies R Us and Sports Authority continue to close stores and “right size” in order to compete with shrinking demand or increased competition from internet retail.
Overall, the emphasis is clearly switching to Class B and C boxes. Landlords and tenants must continue to work creatively to reconfigure and modernize these older properties. We can expect to see developments take the shape of larger big box anchor tenants with smaller in-line space. Secondary tenants do not require the same size store fronts as the internet shift has affected how consumers shop. Restaurants remain the only sector with unchanged requirements for in-line/pad space.
*Data labels represent number of spaces
Class A18 Properties625,034 SF
Class B54 Properties2,395,393 SFClass C
56 Properties2,481,842 SF
Class D30
1,365,776
64
32
21
116
15 20,000-30,00030,001-40,00040,001-50,00050,001-60,00060,001-70,00070,001+
Range (SF)
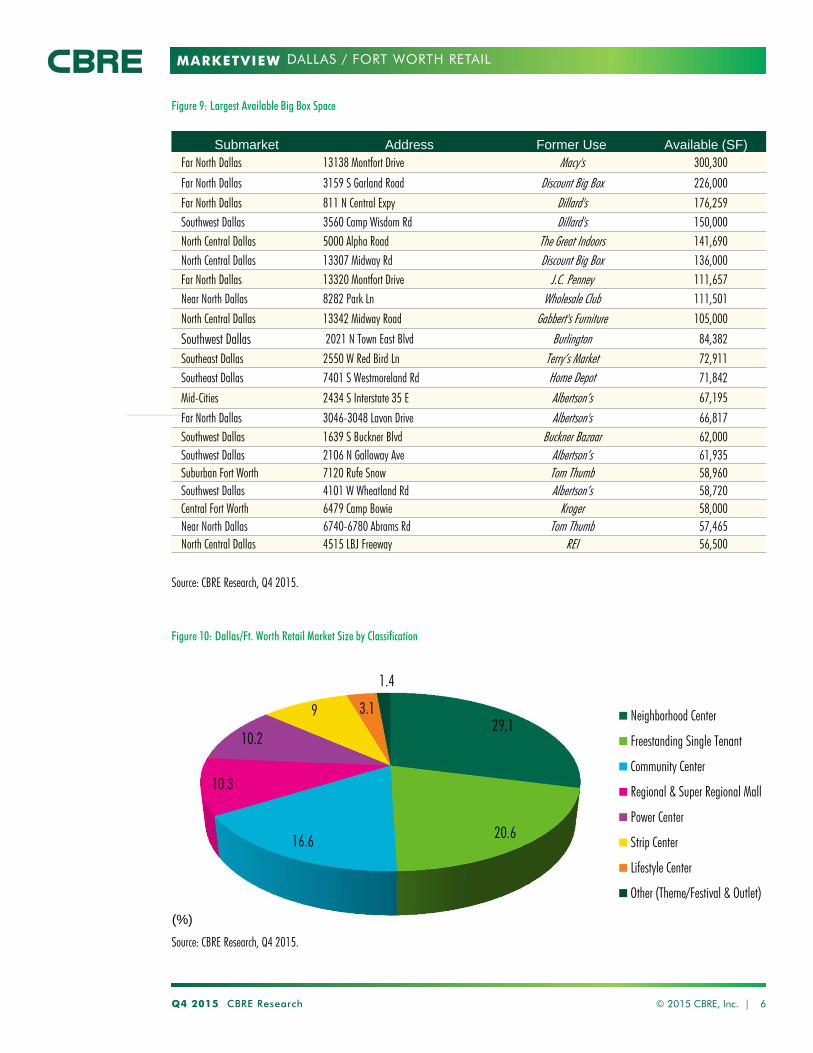
MARKETVIEW
Q4 2015 CBRE Research © 2015 CBRE, Inc. | 6
DALLAS / FORT WORTH RETAIL
Figure 9: Largest Available Big Box Space
Source: CBRE Research, Q4 2015.
Source: CBRE Research, Q4 2015.
Figure 10: Dallas/Ft. Worth Retail Market Size by Classification
29.1
20.616.6
10.3
10.2
9 3.1
1.4
(%)
Neighborhood Center
Freestanding Single Tenant
Community Center
Regional & Super Regional Mall
Power Center
Strip Center
Lifestyle Center
Other (Theme/Festival & Outlet)
Submarket Address Former Use Available (SF)Far North Dallas 13138 Montfort Drive Macy's 300,300
Far North Dallas 3159 S Garland Road Discount Big Box 226,000Far North Dallas 811 N Central Expy Dillard's 176,259Southwest Dallas 3560 Camp Wisdom Rd Dillard's 150,000North Central Dallas 5000 Alpha Road The Great Indoors 141,690North Central Dallas 13307 Midway Rd Discount Big Box 136,000Far North Dallas 13320 Montfort Drive J.C. Penney 111,657Near North Dallas 8282 Park Ln Wholesale Club 111,501North Central Dallas 13342 Midway Road Gabbert's Furniture 105,000
Southwest Dallas 2021 N Town East Blvd Burlington 84,382Southeast Dallas 2550 W Red Bird Ln Terry’s Market 72,911Southeast Dallas 7401 S Westmoreland Rd Home Depot 71,842
Mid-Cities 2434 S Interstate 35 E Albertson’s 67,195
Far North Dallas 3046-3048 Lavon Drive Albertson's 66,817Southwest Dallas 1639 S Buckner Blvd Buckner Bazaar 62,000Southwest Dallas 2106 N Galloway Ave Albertson’s 61,935Suburban Fort Worth 7120 Rufe Snow Tom Thumb 58,960Southwest Dallas 4101 W Wheatland Rd Albertson’s 58,720Central Fort Worth 6479 Camp Bowie Kroger 58,000Near North Dallas 6740-6780 Abrams Rd Tom Thumb 57,465North Central Dallas 4515 LBJ Freeway REI 56,500

MARKETVIEW
Disclaimer: Information contained herein, including projections, has been obtained from sources believed to be reliable. While we do not doubt its accuracy, we have not verified it and make no guarantee, warranty or representation about it. It is your responsibility to confirm independently its accuracy and completeness. This information is presented exclusively for use by CBRE clients and professionals and all rights to the material are reserved and cannot be reproduced without prior written permission of CBRE.
CONTACTS
Robert C. KrampDirector, Research & [email protected]
E. Michelle MillerResearch Operations [email protected]
Lauren ParisSenior Research Analyst+1 214 [email protected]
Brian AshtonResearch Coordinator+1 214 [email protected]
CBRE OFFICES
CBRE Dallas2100 McKinney Ave, Suite 700Dallas, TX 75201
To learn more about CBRE Research,or to access additional research reports,please visit the Global Research Gateway at www.cbre.com/researchgateway.
DALLAS / FORT WORTH RETAIL
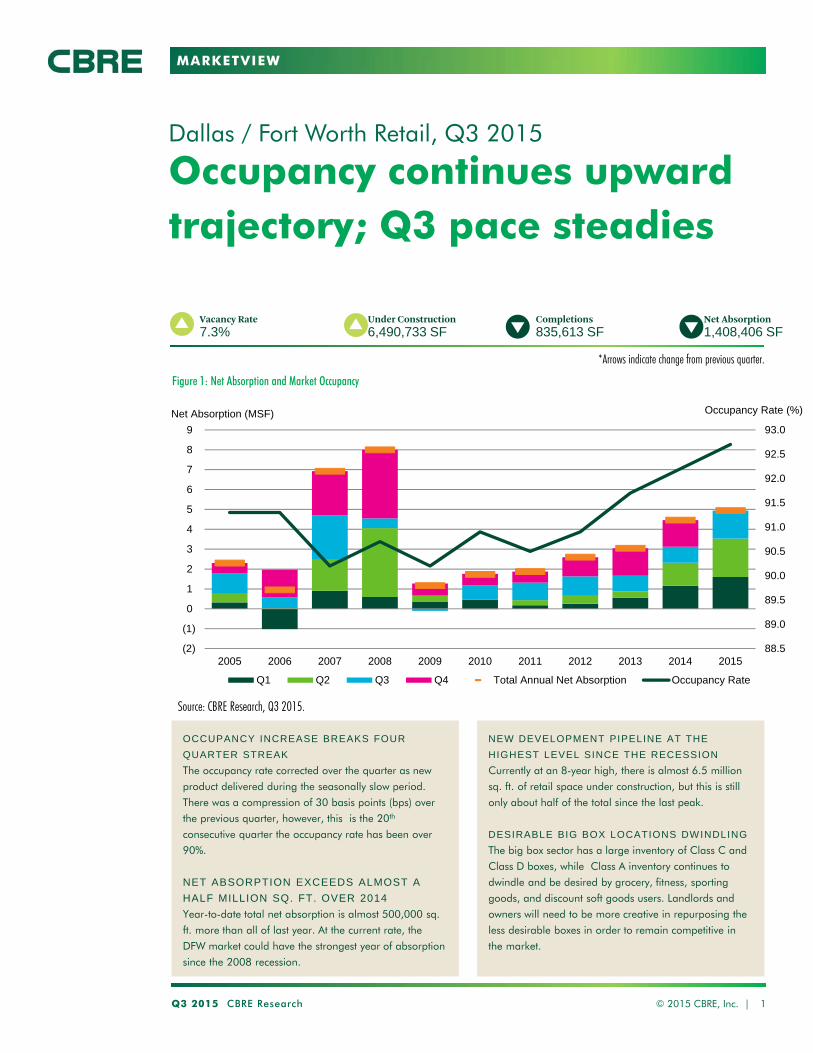
MARKETVIEW
Occupancy continues upward trajectory; Q3 pace steadies
Dallas / Fort Worth Retail, Q3 2015
Q3 2015 CBRE Research © 2015 CBRE, Inc. | 1
Vacancy Rate7.3%
*Arrows indicate change from previous quarter.
Under Construction6,490,733 SF
Completions835,613 SF
Net Absorption1,408,406 SF
OCCUPANCY INCREASE BREAKS FOUR
QUARTER STREAK
The occupancy rate corrected over the quarter as new
product delivered during the seasonally slow period.
There was a compression of 30 basis points (bps) over
the previous quarter, however, this is the 20th
consecutive quarter the occupancy rate has been over
90%.
NET ABSORPTION EXCEEDS ALMOST A
HALF MILLION SQ. FT. OVER 2014
Year-to-date total net absorption is almost 500,000 sq.
ft. more than all of last year. At the current rate, the
DFW market could have the strongest year of absorption
since the 2008 recession.
Figure 1: Net Absorption and Market Occupancy
Source: CBRE Research, Q3 2015.
NEW DEVELOPMENT PIPELINE AT THE
HIGHEST LEVEL SINCE THE RECESSION
Currently at an 8-year high, there is almost 6.5 million
sq. ft. of retail space under construction, but this is still
only about half of the total since the last peak.
DESIRABLE BIG BOX LOCATIONS DWINDLING
The big box sector has a large inventory of Class C and
Class D boxes, while Class A inventory continues to
dwindle and be desired by grocery, fitness, sporting
goods, and discount soft goods users. Landlords and
owners will need to be more creative in repurposing the
less desirable boxes in order to remain competitive in
the market.
88.5
89.0
89.5
90.0
90.5
91.0
91.5
92.0
92.5
93.0
(2)
(1)
0
1
2
3
4
5
6
7
8
9
2005 2006 2007 2008 2009 2010 2011 2012 2013 2014 2015
Occupancy Rate (%)Net Absorption (MSF)
Q1 Q2 Q3 Q4 Total Annual Net Absorption Occupancy Rate
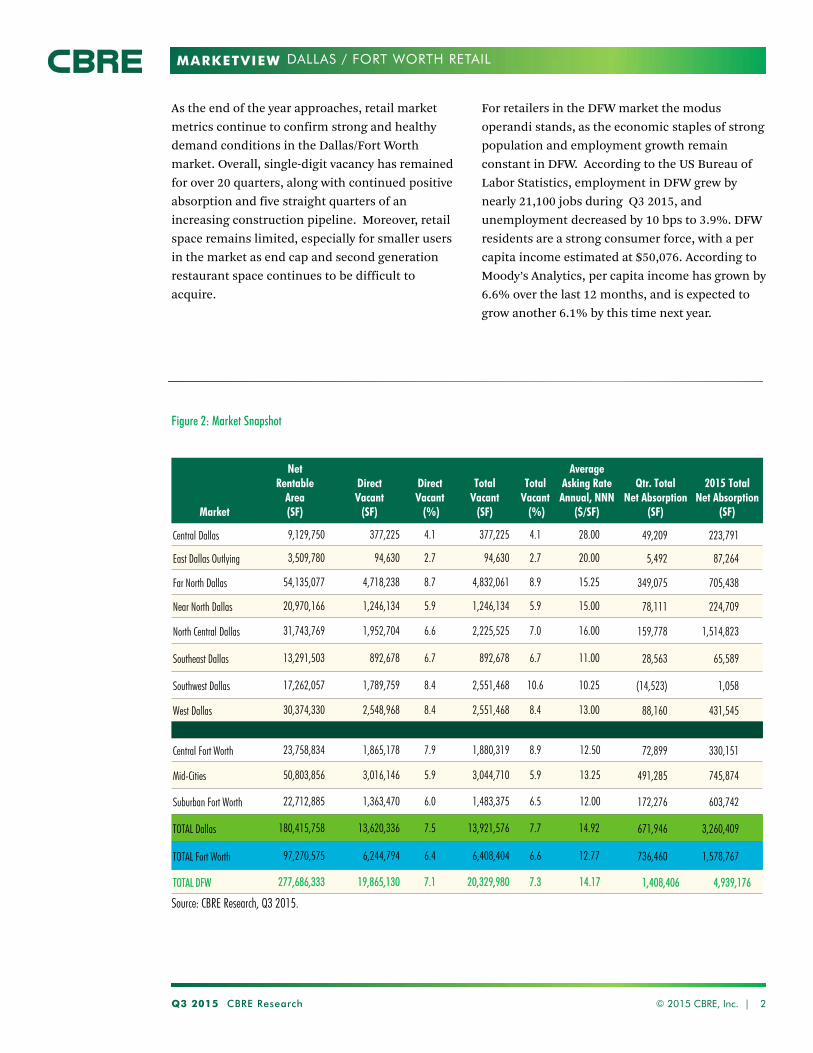
MARKETVIEW
Q3 2015 CBRE Research © 2015 CBRE, Inc. | 2
DALLAS / FORT WORTH RETAIL
Figure 2: Market Snapshot
Market
Net Rentable
Area(SF)
DirectVacant
(SF)
Direct Vacant
(%)
TotalVacant
(SF)
Total Vacant
(%)
Average Asking RateAnnual, NNN
($/SF)
Qtr. TotalNet Absorption
(SF)
2015 Total Net Absorption
(SF)
Central Dallas 9,129,750 377,225 4.1 377,225 4.1 28.00 49,209 223,791
East Dallas Outlying 3,509,780 94,630 2.7 94,630 2.7 20.00 5,492 87,264
Far North Dallas 54,135,077 4,718,238 8.7 4,832,061 8.9 15.25 349,075 705,438
Near North Dallas 20,970,166 1,246,134 5.9 1,246,134 5.9 15.00 78,111 224,709
North Central Dallas 31,743,769 1,952,704 6.6 2,225,525 7.0 16.00 159,778 1,514,823
Southeast Dallas 13,291,503 892,678 6.7 892,678 6.7 11.00 28,563 65,589
Southwest Dallas 17,262,057 1,789,759 8.4 2,551,468 10.6 10.25 (14,523) 1,058
West Dallas 30,374,330 2,548,968 8.4 2,551,468 8.4 13.00 88,160 431,545
Central Fort Worth 23,758,834 1,865,178 7.9 1,880,319 8.9 12.50 72,899 330,151
Mid-Cities 50,803,856 3,016,146 5.9 3,044,710 5.9 13.25 491,285 745,874
Suburban Fort Worth 22,712,885 1,363,470 6.0 1,483,375 6.5 12.00 172,276 603,742
TOTAL Dallas 180,415,758 13,620,336 7.5 13,921,576 7.7 14.92 671,946 3,260,409
TOTAL Fort Worth 97,270,575 6,244,794 6.4 6,408,404 6.6 12.77 736,460 1,578,767
TOTAL DFW 277,686,333 19,865,130 7.1 20,329,980 7.3 14.17 1,408,406 4,939,176
As the end of the year approaches, retail market metrics continue to confirm strong and healthy demand conditions in the Dallas/Fort Worth market. Overall, single-digit vacancy has remained for over 20 quarters, along with continued positive absorption and five straight quarters of an increasing construction pipeline. Moreover, retail space remains limited, especially for smaller users in the market as end cap and second generation restaurant space continues to be difficult to acquire.
For retailers in the DFW market the modus operandi stands, as the economic staples of strong population and employment growth remain constant in DFW. According to the US Bureau of Labor Statistics, employment in DFW grew by nearly 21,100 jobs during Q3 2015, and unemployment decreased by 10 bps to 3.9%. DFW residents are a strong consumer force, with a per capita income estimated at $50,076. According to Moody’s Analytics, per capita income has grown by 6.6% over the last 12 months, and is expected to grow another 6.1% by this time next year.
Source: CBRE Research, Q3 2015.
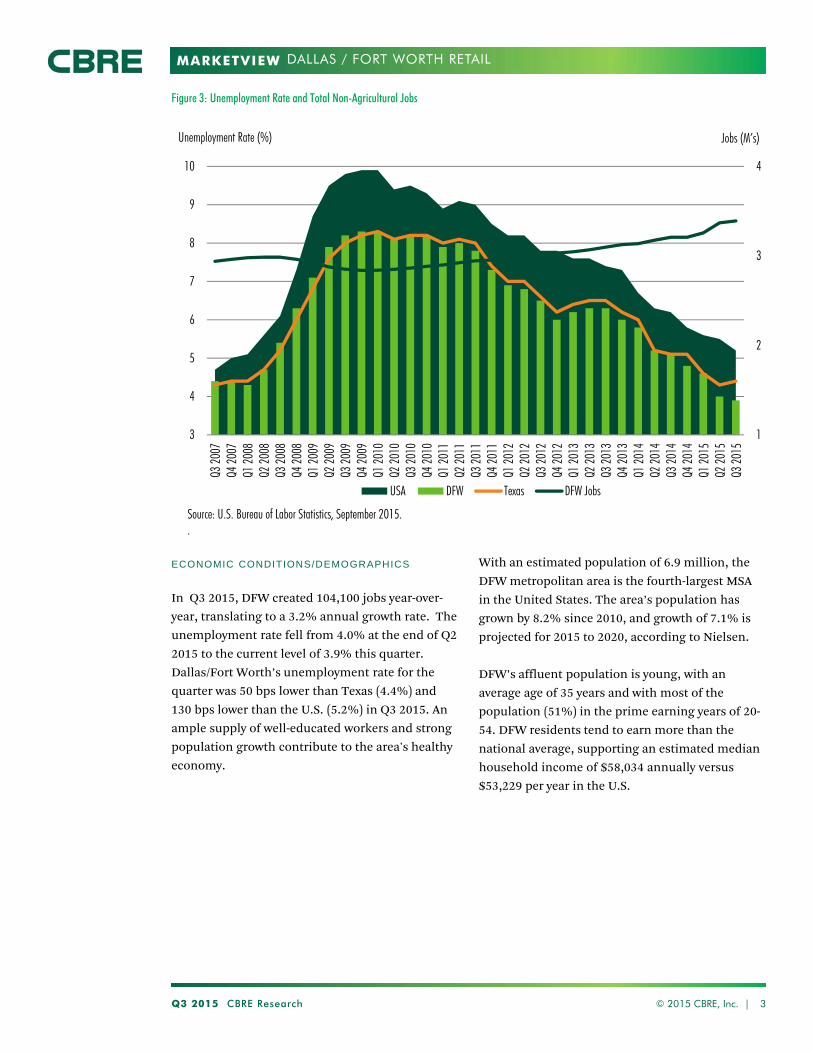
MARKETVIEW
Q3 2015 CBRE Research © 2015 CBRE, Inc. | 3
DALLAS / FORT WORTH RETAIL
Figure 3: Unemployment Rate and Total Non-Agricultural Jobs
ECONOMIC CONDITIONS/DEMOGRAPHICS
In Q3 2015, DFW created 104,100 jobs year-over-year, translating to a 3.2% annual growth rate. The unemployment rate fell from 4.0% at the end of Q2 2015 to the current level of 3.9% this quarter. Dallas/Fort Worth’s unemployment rate for the quarter was 50 bps lower than Texas (4.4%) and 130 bps lower than the U.S. (5.2%) in Q3 2015. An ample supply of well-educated workers and strong population growth contribute to the area's healthy economy.
With an estimated population of 6.9 million, the DFW metropolitan area is the fourth-largest MSA in the United States. The area’s population has grown by 8.2% since 2010, and growth of 7.1% is projected for 2015 to 2020, according to Nielsen.
DFW’s affluent population is young, with an average age of 35 years and with most of the population (51%) in the prime earning years of 20-54. DFW residents tend to earn more than the national average, supporting an estimated median household income of $58,034 annually versus $53,229 per year in the U.S.
1
2
3
4
3
4
5
6
7
8
9
10
Q3 20
07Q4
2007
Q1 20
08Q2
2008
Q3 20
08Q4
2008
Q1 20
09Q2
2009
Q3 20
09Q4
2009
Q1 20
10Q2
2010
Q3 20
10Q4
2010
Q1 20
11Q2
2011
Q3 20
11Q4
2011
Q1 20
12Q2
2012
Q3 20
12Q4
2012
Q1 20
13Q2
2013
Q3 20
13Q4
2013
Q1 20
14Q2
2014
Q3 20
14Q4
2014
Q1 20
15Q2
2015
Q3 20
15
Jobs (M’s)Unemployment Rate (%)
USA DFW Texas DFW Jobs
Source: U.S. Bureau of Labor Statistics, September 2015..
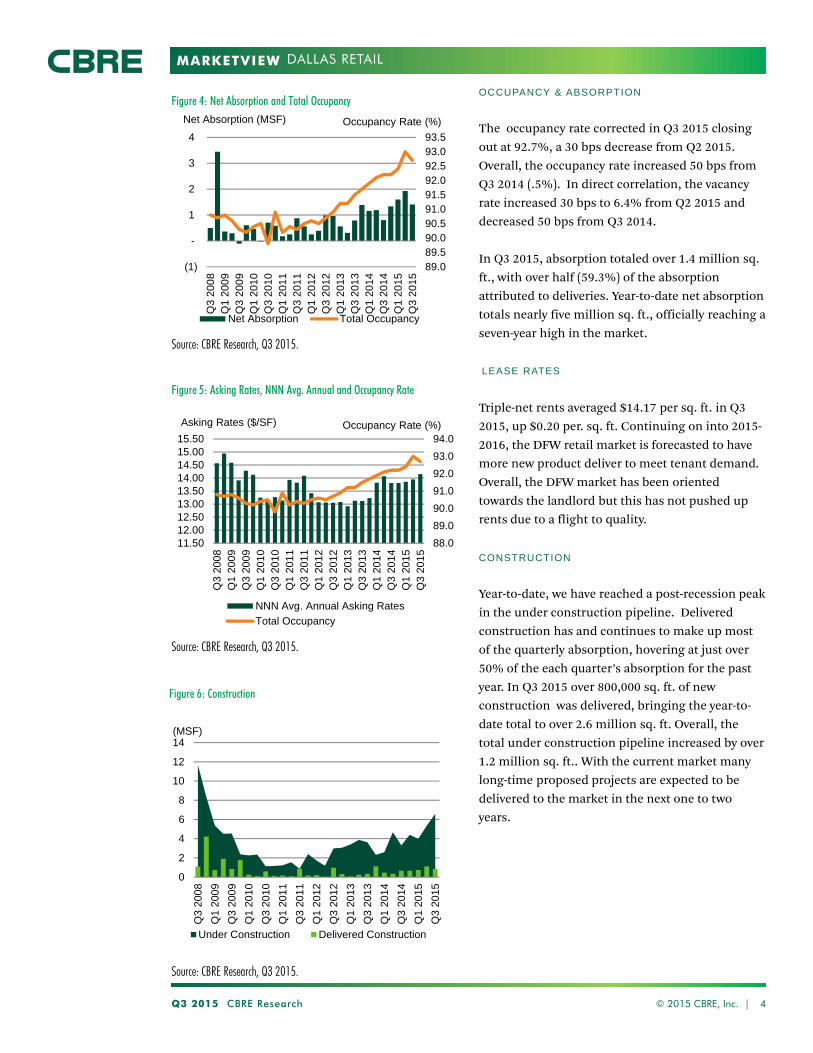
MARKETVIEW
OCCUPANCY & ABSORPTION
The occupancy rate corrected in Q3 2015 closing out at 92.7%, a 30 bps decrease from Q2 2015. Overall, the occupancy rate increased 50 bps from Q3 2014 (.5%). In direct correlation, the vacancy rate increased 30 bps to 6.4% from Q2 2015 and decreased 50 bps from Q3 2014.
In Q3 2015, absorption totaled over 1.4 million sq. ft., with over half (59.3%) of the absorption attributed to deliveries. Year-to-date net absorption totals nearly five million sq. ft., officially reaching a seven-year high in the market.
LEASE RATES
Triple-net rents averaged $14.17 per sq. ft. in Q3 2015, up $0.20 per. sq. ft. Continuing on into 2015-2016, the DFW retail market is forecasted to have more new product deliver to meet tenant demand. Overall, the DFW market has been oriented towards the landlord but this has not pushed up rents due to a flight to quality.
CONSTRUCTION
Year-to-date, we have reached a post-recession peak in the under construction pipeline. Delivered construction has and continues to make up most of the quarterly absorption, hovering at just over 50% of the each quarter’s absorption for the past year. In Q3 2015 over 800,000 sq. ft. of new construction was delivered, bringing the year-to-date total to over 2.6 million sq. ft. Overall, the total under construction pipeline increased by over 1.2 million sq. ft.. With the current market many long-time proposed projects are expected to be delivered to the market in the next one to two years.
Q3 2015 CBRE Research © 2015 CBRE, Inc. | 4
DALLAS RETAIL
Figure 4: Net Absorption and Total Occupancy
Figure 5: Asking Rates, NNN Avg. Annual and Occupancy Rate
Source: CBRE Research, Q3 2015.
Source: CBRE Research, Q3 2015.
Figure 6: Construction
Source: CBRE Research, Q3 2015.
89.089.590.090.591.091.592.092.593.093.5
(1)
-
1
2
3
4
Q3
200
8Q
1 20
09
Q3
200
9Q
1 20
10
Q3
201
0Q
1 20
11
Q3
201
1Q
1 20
12
Q3
201
2Q
1 20
13
Q3
201
3Q
1 20
14
Q3
201
4Q
1 20
15
Q3
201
5
Net Absorption (MSF)
Net Absorption Total Occupancy
Occupancy Rate (%)
0
2
4
6
8
10
12
14
Q3
200
8
Q1
200
9
Q3
200
9
Q1
201
0
Q3
201
0
Q1
201
1
Q3
201
1
Q1
201
2
Q3
201
2
Q1
201
3
Q3
201
3
Q1
201
4
Q3
201
4
Q1
201
5
Q3
201
5
(MSF)
Under Construction Delivered Construction
88.0
89.0
90.0
91.0
92.0
93.0
94.0
11.5012.0012.5013.0013.5014.0014.5015.0015.50
Q3
200
8Q
1 20
09
Q3
200
9Q
1 20
10
Q3
201
0Q
1 20
11
Q3
201
1Q
1 20
12
Q3
201
2Q
1 20
13
Q3
201
3Q
1 20
14
Q3
201
4Q
1 20
15
Q3
201
5
NNN Avg. Annual Asking Rates
Total Occupancy
Occupancy Rate (%)Asking Rates ($/SF)

MARKETVIEW
Q3 2015 CBRE Research © 2015 CBRE, Inc. | 5
DALLAS / FORT WORTH RETAIL
Figure 7: Big Box Space Available by Class
Source: CBRE Research, Q3 2015.
Figure 8: Big Box Space Available by Size Range*
Source: CBRE Research, Q3 2015.
KEY OBSERVATIONS
There has not been much change in 2015 for the big box sector of the market. There are currently 143 vacant boxes totaling over 6.2 million sq. ft. as of Q3 2015. The availability of Class A box space, which had virtually disappeared a year ago is now up to 14 properties totaling over 386,000 sq. ft.; the recent increase has been caused largely by the closure of several Sports Authority, Staples, Office Max and Office Depot stores. There are approximately 46 Class B boxes and 53 Class C boxes that remain available in the entire DFW market. A lack of product is fueling demand for new development in 2015 and should continue through 2017. There are a large number of redevelopments or new projects that are in the planning stages for the next three years. Hurdles to new development remain high with municipal restrictions and high land costs pushing rents to record high levels.
Most of the activity is driven by grocery, fitness, and entertainment retailers as they continue their expansion in the DFW market. In fact, CBRE has identified over 70 grocery-anchored developments either in the pipeline or under construction within DFW. Some of the most active retailers include Gander Mountain, WinCo, Walmart, H-E-B, Youfit, Total Wine, Sprouts, Trader Joes, Whole Foods, and Fitness Connection.
Many retailers, such as Barnes & Noble, Staples, Tiger Direct, Babies R Us, and Sports Authority continue to close stores and “right size” in order to compete with shrinking demand or increased competition from internet retail.
Overall, the emphasis is clearly switching to Class B and C boxes. Landlords and tenants must continue to work creatively to reconfigure and modernize these older properties. We can expect to see developments take the shape of larger big box anchor tenants with smaller in-line space. Secondary tenants do not require the same size store fronts as the internet shift has affected how consumers shop. Restaurants remain the only sector with unchanged requirements for in-line/pad space.
*Data labels represent number of spaces
Class A14 Properties386,556 SF
Class B46 Properties2,00,491 SF
Class C53 Properties2,429,723 SF
Class D30
1,457,142 65
30
19
114
1420,000-30,000
30,001-40,000
40,001-50,000
50,001-60,000
60,001-70,000
70,001+
Range (SF)

MARKETVIEW
Q3 2015 CBRE Research © 2015 CBRE, Inc. | 6
DALLAS / FORT WORTH RETAIL
Figure 9: Largest Available Big Box Space
Source: CBRE Research, Q3 2015.
Source: CBRE Research, Q3 2015.
Figure 10: Dallas/Ft. Worth Retail Market Size by Classification
29.1
20.616.6
10.3
10.2
9 3.1
1.4
(%)
Neighborhood Center
Freestanding Single Tenant
Community Center
Regional & Super Regional Mall
Power Center
Strip Center
Lifestyle Center
Other (Theme/Festival & Outlet)
Submarket Address Former Use Available (SF)Far North Dallas 13138 Montfort Drive Macy's 300,300
Far North Dallas 3159 S Garland Road Walmart 226,000Far North Dallas 811 N Central Expy Dillard's 176,259Southwest Dallas 3560 Camp Wisdom Rd Dillard's 150,000North Central Dallas 5000 Alpha Road The Great Indoors 141,690West Dallas 2625 W Hwy 303 Sam's Club 126,336Far North Dallas 13320 Montfort Drive J.C. Penney 111,657Near North Dallas 8282 Park Ln Sam's Club 111,501North Central Dallas 13342 Midway Road Gabbert's Furniture 105,000
Far North Dallas 3161 Broadway Boulevard Steve N Barry's 104,315Southeast Dallas 2021 N Town East Blvd Burlington 84,382Southwest Dallas 2550 W Red Bird Ln Terry's Market 72,911
Southeast Dallas 7401 S Westmoreland Rd Home Depot 71,842
Far North Dallas 3046-3048 Lavon Drive Albertson's 66,817Southwest Dallas 1639 S Buckner Blvd Buckner Bazaar 62,000Southwest Dallas 2106 N Galloway Ave Albertson’s 61,935Suburban Fort Worth 7120 Rufe Snow Tom Thumb 58,960Southwest Dallas 4101 W Wheatland Rd Albertson’s 58,720Central Fort Worth 6479 Camp Bowie Kroger 58,000Near North Dallas 6740-6780 Abrams Rd Tom Thumb 57,465North Central Dallas 4515 LBJ Freeway REI 56,500

MARKETVIEW
Disclaimer: Information contained herein, including projections, has been obtained from sources believed to be reliable. While we do not doubt its accuracy, we have not verified it and make no guarantee, warranty or representation about it. It is your responsibility to confirm independently its accuracy and completeness. This information is presented exclusively for use by CBRE clients and professionals and all rights to the material are reserved and cannot be reproduced without prior written permission of CBRE.
CONTACTS
Robert C. KrampDirector, Research & [email protected]
E. Michelle MillerResearch Operations [email protected]
Lauren ParisSenior Research Analyst+1 214 [email protected]
Brian AshtonResearch Coordinator+1 214 [email protected]
CBRE OFFICES
CBRE Dallas2100 McKinney Ave, Suite 700Dallas, TX 75201
To learn more about CBRE Research,or to access additional research reports,please visit the Global Research Gateway at www.cbre.com/researchgateway.
DALLAS / FORT WORTH RETAIL
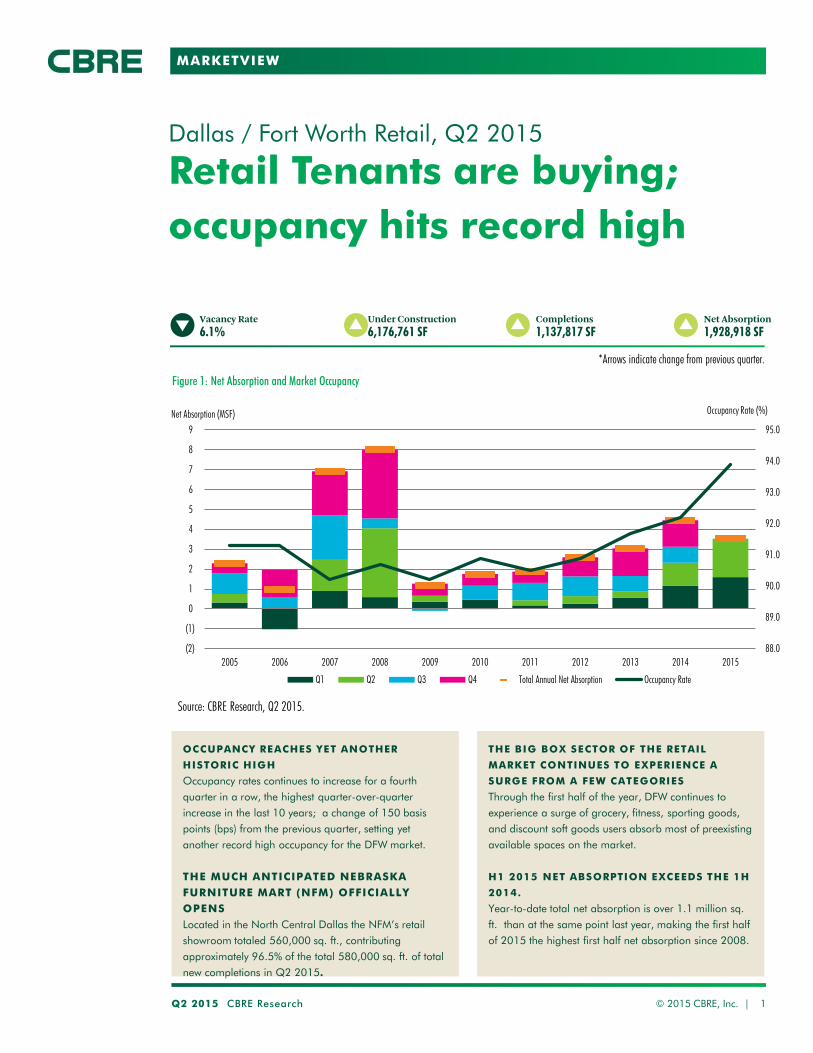
MARKETVIEW
Retail Tenants are buying; occupancy hits record high
Dallas / Fort Worth Retail, Q2 2015
Q2 2015 CBRE Research © 2015 CBRE, Inc. | 1
Vacancy Rate 6.1%
*Arrows indicate change from previous quarter.
Under Construction 6,176,761 SF
Completions 1,137,817 SF
Net Absorption 1,928,918 SF
OCCUPANCY REACHES YET ANOTHER
HISTORIC HIGH
Occupancy rates continues to increase for a fourth quarter in a row, the highest quarter-over-quarter increase in the last 10 years; a change of 150 basis points (bps) from the previous quarter, setting yet another record high occupancy for the DFW market. THE MUCH ANTICIPATED NEBRASKA FURNITURE MART (NFM) OFFICIALLY OPENS Located in the North Central Dallas the NFM’s retail showroom totaled 560,000 sq. ft., contributing approximately 96.5% of the total 580,000 sq. ft. of total new completions in Q2 2015.
Figure 1: Net Absorption and Market Occupancy
Source: CBRE Research, Q2 2015.
THE BIG BOX SECTOR OF THE RETAIL
MARKET CONTINUES TO EXPERIENCE A
SURGE FROM A FEW CATEGORIES
Through the first half of the year, DFW continues to experience a surge of grocery, fitness, sporting goods, and discount soft goods users absorb most of preexisting available spaces on the market.
H1 2015 NET ABSORPTION EXCEEDS THE 1H
2014.
Year-to-date total net absorption is over 1.1 million sq. ft. than at the same point last year, making the first half of 2015 the highest first half net absorption since 2008.
88.0
89.0
90.0
91.0
92.0
93.0
94.0
95.0
(2)
(1)
0
1
2
3
4
5
6
7
8
9
2005 2006 2007 2008 2009 2010 2011 2012 2013 2014 2015
Occupancy Rate (%) Net Absorption (MSF)
Q1 Q2 Q3 Q4 Total Annual Net Absorption Occupancy Rate
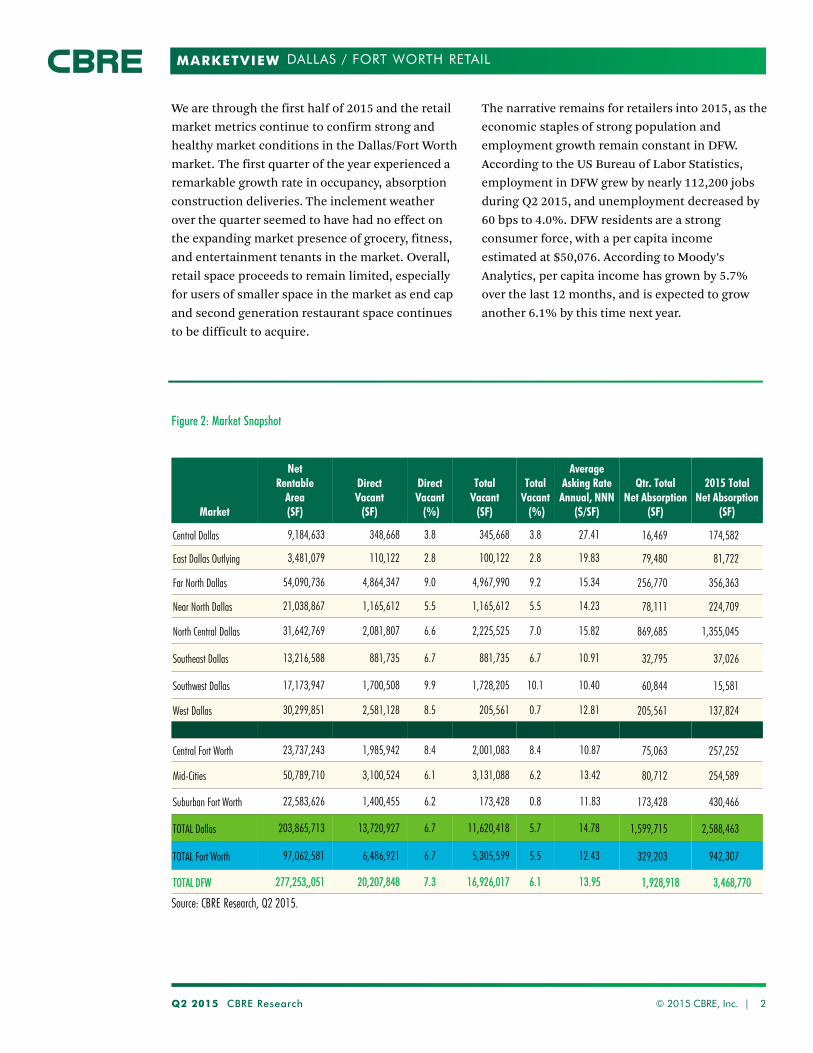
MARKETVIEW
Q2 2015 CBRE Research © 2015 CBRE, Inc. | 2
DALLAS / FORT WORTH RETAIL
Figure 2: Market Snapshot
Market
Net Rentable
Area (SF)
Direct Vacant
(SF)
Direct Vacant (%)
Total Vacant
(SF)
Total Vacant (%)
Average Asking Rate
Annual, NNN ($/SF)
Qtr. Total Net Absorption
(SF)
2015 Total Net Absorption
(SF)
Central Dallas 9,184,633 348,668 3.8 345,668 3.8 27.41 16,469 174,582
East Dallas Outlying 3,481,079 110,122 2.8 100,122 2.8 19.83 79,480 81,722
Far North Dallas 54,090,736 4,864,347 9.0 4,967,990 9.2 15.34 256,770 356,363
Near North Dallas 21,038,867 1,165,612 5.5 1,165,612 5.5 14.23 78,111 224,709
North Central Dallas 31,642,769 2,081,807 6.6 2,225,525 7.0 15.82 869,685 1,355,045
Southeast Dallas 13,216,588 881,735 6.7 881,735 6.7 10.91 32,795 37,026
Southwest Dallas 17,173,947 1,700,508 9.9 1,728,205 10.1 10.40 60,844 15,581
West Dallas 30,299,851 2,581,128 8.5 205,561 0.7 12.81 205,561 137,824
Central Fort Worth 23,737,243 1,985,942 8.4 2,001,083 8.4 10.87 75,063 257,252
Mid-Cities 50,789,710 3,100,524 6.1 3,131,088 6.2 13.42 80,712 254,589
Suburban Fort Worth 22,583,626 1,400,455 6.2 173,428 0.8 11.83 173,428 430,466
TOTAL Dallas 203,865,713 13,720,927 6.7 11,620,418 5.7 14.78 1,599,715 2,588,463
TOTAL Fort Worth 97,062,581 6,486,921 6.7 5,305,599 5.5 12.43 329,203 942,307
TOTAL DFW 277,253,,051 20,207,848 7.3 16,926,017 6.1 13.95 1,928,918 3,468,770
We are through the first half of 2015 and the retail market metrics continue to confirm strong and healthy market conditions in the Dallas/Fort Worth market. The first quarter of the year experienced a remarkable growth rate in occupancy, absorption construction deliveries. The inclement weather over the quarter seemed to have had no effect on the expanding market presence of grocery, fitness, and entertainment tenants in the market. Overall, retail space proceeds to remain limited, especially for users of smaller space in the market as end cap and second generation restaurant space continues to be difficult to acquire.
The narrative remains for retailers into 2015, as the economic staples of strong population and employment growth remain constant in DFW. According to the US Bureau of Labor Statistics, employment in DFW grew by nearly 112,200 jobs during Q2 2015, and unemployment decreased by 60 bps to 4.0%. DFW residents are a strong consumer force, with a per capita income estimated at $50,076. According to Moody’s Analytics, per capita income has grown by 5.7% over the last 12 months, and is expected to grow another 6.1% by this time next year.
Source: CBRE Research, Q2 2015.
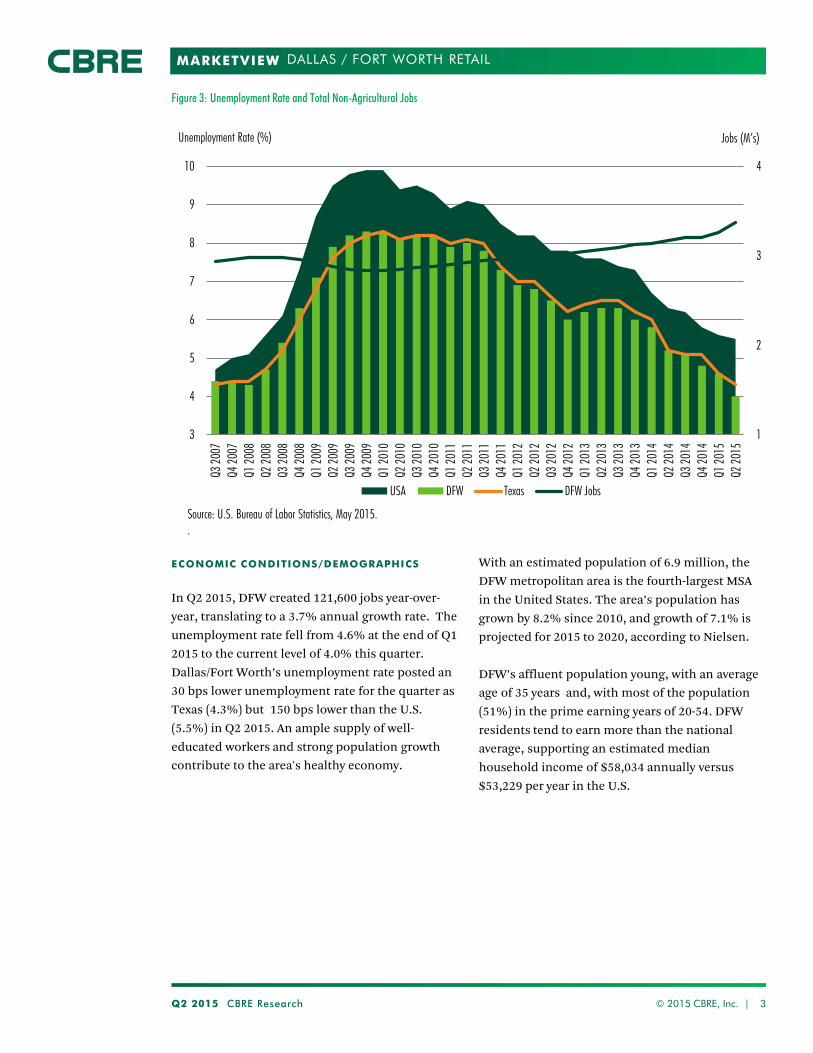
MARKETVIEW
Q2 2015 CBRE Research © 2015 CBRE, Inc. | 3
DALLAS / FORT WORTH RETAIL
Figure 3: Unemployment Rate and Total Non-Agricultural Jobs
ECONOMIC CONDITIONS/DEMOGRAPHICS
In Q2 2015, DFW created 121,600 jobs year-over-year, translating to a 3.7% annual growth rate. The unemployment rate fell from 4.6% at the end of Q1 2015 to the current level of 4.0% this quarter. Dallas/Fort Worth’s unemployment rate posted an 30 bps lower unemployment rate for the quarter as Texas (4.3%) but 150 bps lower than the U.S. (5.5%) in Q2 2015. An ample supply of well-educated workers and strong population growth contribute to the area's healthy economy.
With an estimated population of 6.9 million, the DFW metropolitan area is the fourth-largest MSA in the United States. The area’s population has grown by 8.2% since 2010, and growth of 7.1% is projected for 2015 to 2020, according to Nielsen.
DFW’s affluent population young, with an average age of 35 years and, with most of the population (51%) in the prime earning years of 20-54. DFW residents tend to earn more than the national average, supporting an estimated median household income of $58,034 annually versus $53,229 per year in the U.S.
1
2
3
4
3
4
5
6
7
8
9
10
Q3 20
07Q4
2007
Q1 20
08Q2
2008
Q3 20
08Q4
2008
Q1 20
09Q2
2009
Q3 20
09Q4
2009
Q1 20
10Q2
2010
Q3 20
10Q4
2010
Q1 20
11Q2
2011
Q3 20
11Q4
2011
Q1 20
12Q2
2012
Q3 20
12Q4
2012
Q1 20
13Q2
2013
Q3 20
13Q4
2013
Q1 20
14Q2
2014
Q3 20
14Q4
2014
Q1 20
15Q2
2015
Jobs (M’s) Unemployment Rate (%)
USA DFW Texas DFW Jobs
Source: U.S. Bureau of Labor Statistics, May 2015. .
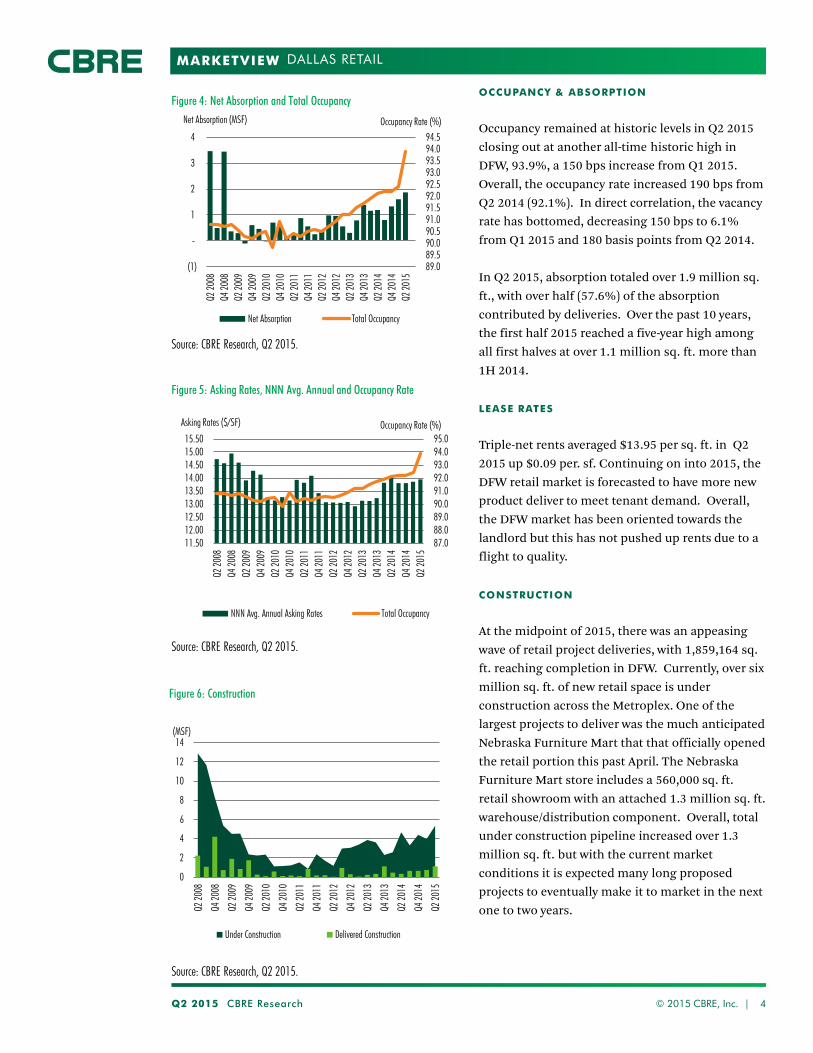
MARKETVIEW
OCCUPANCY & ABSORPTION
Occupancy remained at historic levels in Q2 2015 closing out at another all-time historic high in DFW, 93.9%, a 150 bps increase from Q1 2015. Overall, the occupancy rate increased 190 bps from Q2 2014 (92.1%). In direct correlation, the vacancy rate has bottomed, decreasing 150 bps to 6.1% from Q1 2015 and 180 basis points from Q2 2014.
In Q2 2015, absorption totaled over 1.9 million sq. ft., with over half (57.6%) of the absorption contributed by deliveries. Over the past 10 years, the first half 2015 reached a five-year high among all first halves at over 1.1 million sq. ft. more than 1H 2014.
LEASE RATES
Triple-net rents averaged $13.95 per sq. ft. in Q2 2015 up $0.09 per. sf. Continuing on into 2015, the DFW retail market is forecasted to have more new product deliver to meet tenant demand. Overall, the DFW market has been oriented towards the landlord but this has not pushed up rents due to a flight to quality.
CONSTRUCTION
At the midpoint of 2015, there was an appeasing wave of retail project deliveries, with 1,859,164 sq. ft. reaching completion in DFW. Currently, over six million sq. ft. of new retail space is under construction across the Metroplex. One of the largest projects to deliver was the much anticipated Nebraska Furniture Mart that that officially opened the retail portion this past April. The Nebraska Furniture Mart store includes a 560,000 sq. ft. retail showroom with an attached 1.3 million sq. ft. warehouse/distribution component. Overall, total under construction pipeline increased over 1.3 million sq. ft. but with the current market conditions it is expected many long proposed projects to eventually make it to market in the next one to two years.
Q2 2015 CBRE Research © 2015 CBRE, Inc. | 4
DALLAS RETAIL
Figure 4: Net Absorption and Total Occupancy
Figure 5: Asking Rates, NNN Avg. Annual and Occupancy Rate
Source: CBRE Research, Q2 2015.
Source: CBRE Research, Q2 2015.
Figure 6: Construction
Source: CBRE Research, Q2 2015.
89.089.590.090.591.091.592.092.593.093.594.094.5
(1)
-
1
2
3
4
Q2 20
08Q4
2008
Q2 20
09Q4
2009
Q2 20
10Q4
2010
Q2 20
11Q4
2011
Q2 20
12Q4
2012
Q2 20
13Q4
2013
Q2 20
14Q4
2014
Q2 20
15
Net Absorption (MSF)
Net Absorption Total Occupancy
Occupancy Rate (%)
0
2
4
6
8
10
12
14
Q2 20
08
Q4 20
08
Q2 20
09
Q4 20
09
Q2 20
10
Q4 20
10
Q2 20
11
Q4 20
11
Q2 20
12
Q4 20
12
Q2 20
13
Q4 20
13
Q2 20
14
Q4 20
14
Q2 20
15
(MSF)
Under Construction Delivered Construction
87.088.089.090.091.092.093.094.095.0
11.5012.0012.5013.0013.5014.0014.5015.0015.50
Q2 20
08Q4
2008
Q2 20
09Q4
2009
Q2 20
10Q4
2010
Q2 20
11Q4
2011
Q2 20
12Q4
2012
Q2 20
13Q4
2013
Q2 20
14Q4
2014
Q2 20
15
NNN Avg. Annual Asking Rates Total Occupancy
Occupancy Rate (%) Asking Rates ($/SF)
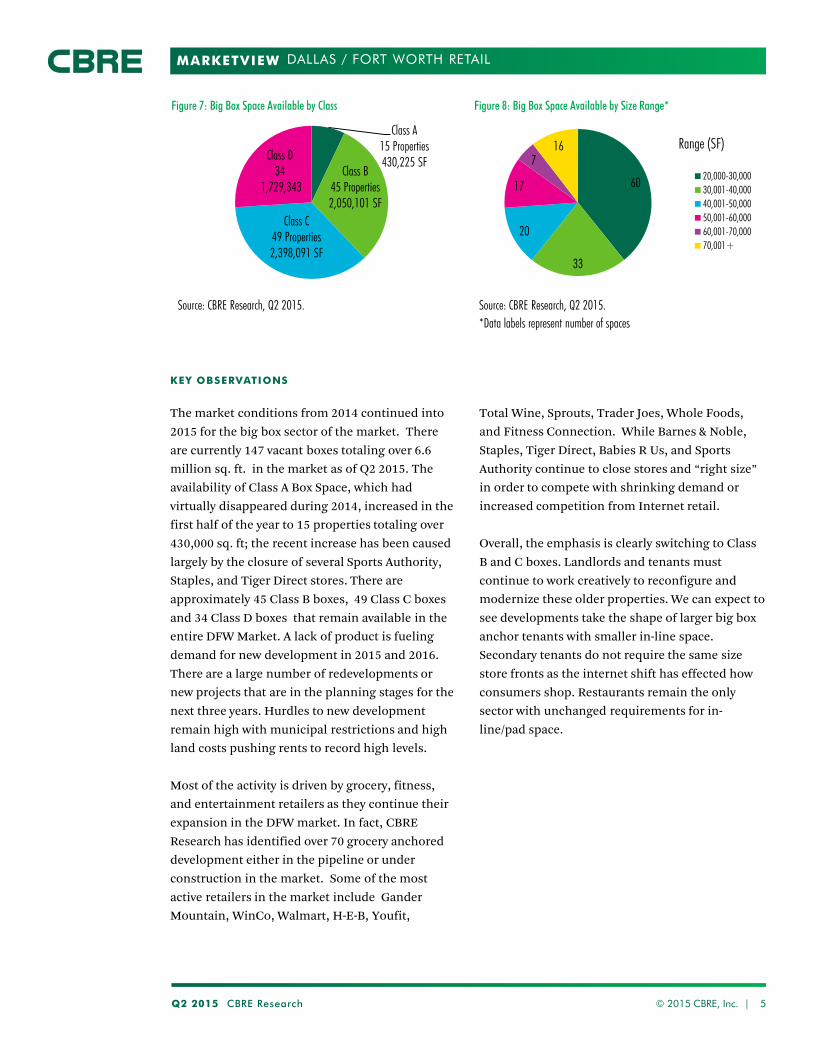
MARKETVIEW
Q2 2015 CBRE Research © 2015 CBRE, Inc. | 5
DALLAS / FORT WORTH RETAIL
Figure 7: Big Box Space Available by Class
Source: CBRE Research, Q2 2015.
Figure 8: Big Box Space Available by Size Range*
Source: CBRE Research, Q2 2015.
KEY OBSERVATIONS
The market conditions from 2014 continued into 2015 for the big box sector of the market. There are currently 147 vacant boxes totaling over 6.6 million sq. ft. in the market as of Q2 2015. The availability of Class A Box Space, which had virtually disappeared during 2014, increased in the first half of the year to 15 properties totaling over 430,000 sq. ft; the recent increase has been caused largely by the closure of several Sports Authority, Staples, and Tiger Direct stores. There are approximately 45 Class B boxes, 49 Class C boxes and 34 Class D boxes that remain available in the entire DFW Market. A lack of product is fueling demand for new development in 2015 and 2016. There are a large number of redevelopments or new projects that are in the planning stages for the next three years. Hurdles to new development remain high with municipal restrictions and high land costs pushing rents to record high levels. Most of the activity is driven by grocery, fitness, and entertainment retailers as they continue their expansion in the DFW market. In fact, CBRE Research has identified over 70 grocery anchored development either in the pipeline or under construction in the market. Some of the most active retailers in the market include Gander Mountain, WinCo, Walmart, H-E-B, Youfit,
Total Wine, Sprouts, Trader Joes, Whole Foods, and Fitness Connection. While Barnes & Noble, Staples, Tiger Direct, Babies R Us, and Sports Authority continue to close stores and “right size” in order to compete with shrinking demand or increased competition from Internet retail. Overall, the emphasis is clearly switching to Class B and C boxes. Landlords and tenants must continue to work creatively to reconfigure and modernize these older properties. We can expect to see developments take the shape of larger big box anchor tenants with smaller in-line space. Secondary tenants do not require the same size store fronts as the internet shift has effected how consumers shop. Restaurants remain the only sector with unchanged requirements for in-line/pad space.
*Data labels represent number of spaces
Class A 15 Properties 430,225 SF
Class B 45 Properties 2,050,101 SF
Class C 49 Properties 2,398,091 SF
Class D 34
1,729,343 60
33
20
17
7 16
20,000-30,00030,001-40,00040,001-50,00050,001-60,00060,001-70,00070,001+
Range (SF)
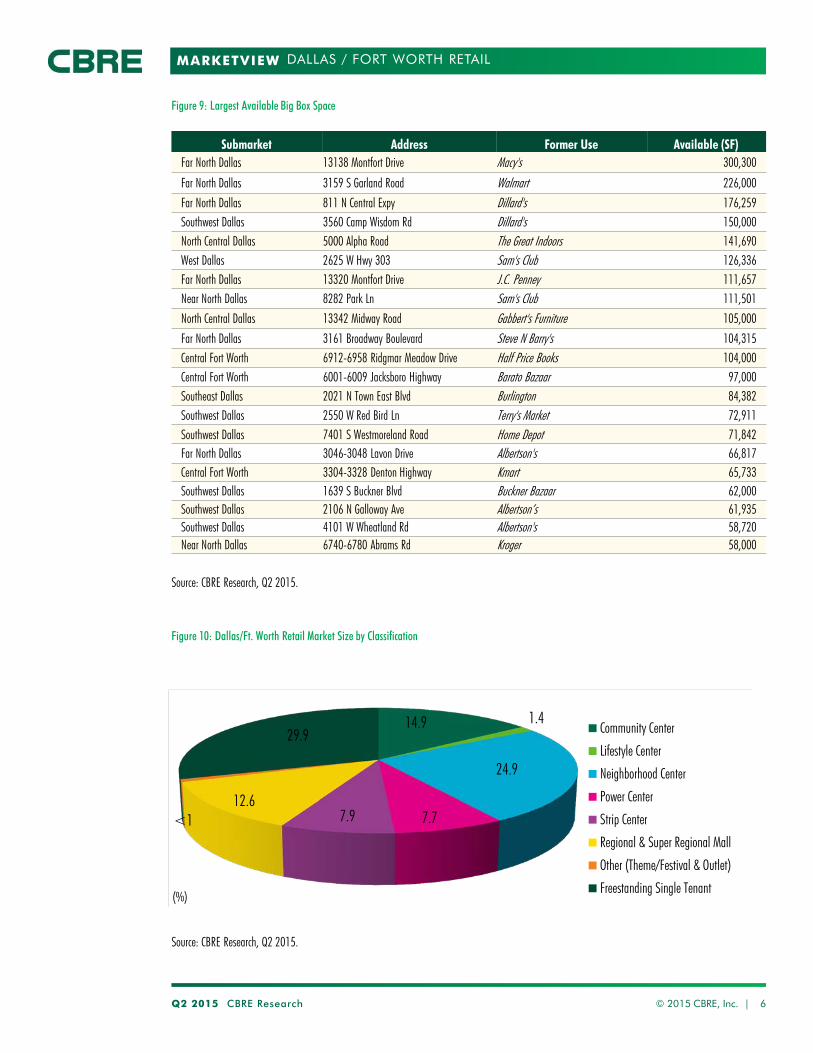
MARKETVIEW
Q2 2015 CBRE Research © 2015 CBRE, Inc. | 6
DALLAS / FORT WORTH RETAIL
Figure 9: Largest Available Big Box Space
Source: CBRE Research, Q2 2015.
Submarket Address Former Use Available (SF) Far North Dallas 13138 Montfort Drive Macy's 300,300 Far North Dallas 3159 S Garland Road Walmart 226,000 Far North Dallas 811 N Central Expy Dillard's 176,259 Southwest Dallas 3560 Camp Wisdom Rd Dillard's 150,000 North Central Dallas 5000 Alpha Road The Great Indoors 141,690 West Dallas 2625 W Hwy 303 Sam's Club 126,336 Far North Dallas 13320 Montfort Drive J.C. Penney 111,657 Near North Dallas 8282 Park Ln Sam's Club 111,501 North Central Dallas 13342 Midway Road Gabbert's Furniture 105,000 Far North Dallas 3161 Broadway Boulevard Steve N Barry's 104,315 Central Fort Worth 6912-6958 Ridgmar Meadow Drive Half Price Books 104,000 Central Fort Worth 6001-6009 Jacksboro Highway Barato Bazaar 97,000 Southeast Dallas 2021 N Town East Blvd Burlington 84,382 Southwest Dallas 2550 W Red Bird Ln Terry's Market 72,911 Southwest Dallas 7401 S Westmoreland Road Home Depot 71,842 Far North Dallas 3046-3048 Lavon Drive Albertson's 66,817 Central Fort Worth 3304-3328 Denton Highway Kmart 65,733 Southwest Dallas 1639 S Buckner Blvd Buckner Bazaar 62,000 Southwest Dallas 2106 N Galloway Ave Albertson’s 61,935 Southwest Dallas 4101 W Wheatland Rd Albertson's 58,720 Near North Dallas 6740-6780 Abrams Rd Kroger 58,000
14.9 1.4
24.9
7.7 7.9 12.6
<1
29.9
(%)
Community Center
Lifestyle Center
Neighborhood Center
Power Center
Strip Center
Regional & Super Regional Mall
Other (Theme/Festival & Outlet)
Freestanding Single Tenant
Source: CBRE Research, Q2 2015.
Figure 10: Dallas/Ft. Worth Retail Market Size by Classification

MARKETVIEW
Disclaimer: Information contained herein, including projections, has been obtained from sources believed to be reliable. While we do not doubt its accuracy, we have not verified it and make no guarantee, warranty or representation about it. It is your responsibility to confirm independently its accuracy and completeness. This information is presented exclusively for use by CBRE clients and professionals and all rights to the material are reserved and cannot be reproduced without prior written permission of CBRE.
CONTACTS
Robert C. Kramp Director, Research & Analysis [email protected] E. Michelle Miller Research Operations Manager [email protected]
Lauren Paris Senior Research Analyst +1 214 9796587 [email protected] Brian Ashton Research Coordinator +1 214 9796589 [email protected]
CBRE OFFICES
CBRE Dallas 2100 McKinney Ave, Suite 700 Dallas, TX 75201
To learn more about CBRE Research, or to access additional research reports, please visit the Global Research Gateway at www.cbre.com/researchgateway.
DALLAS / FORT WORTH RETAIL
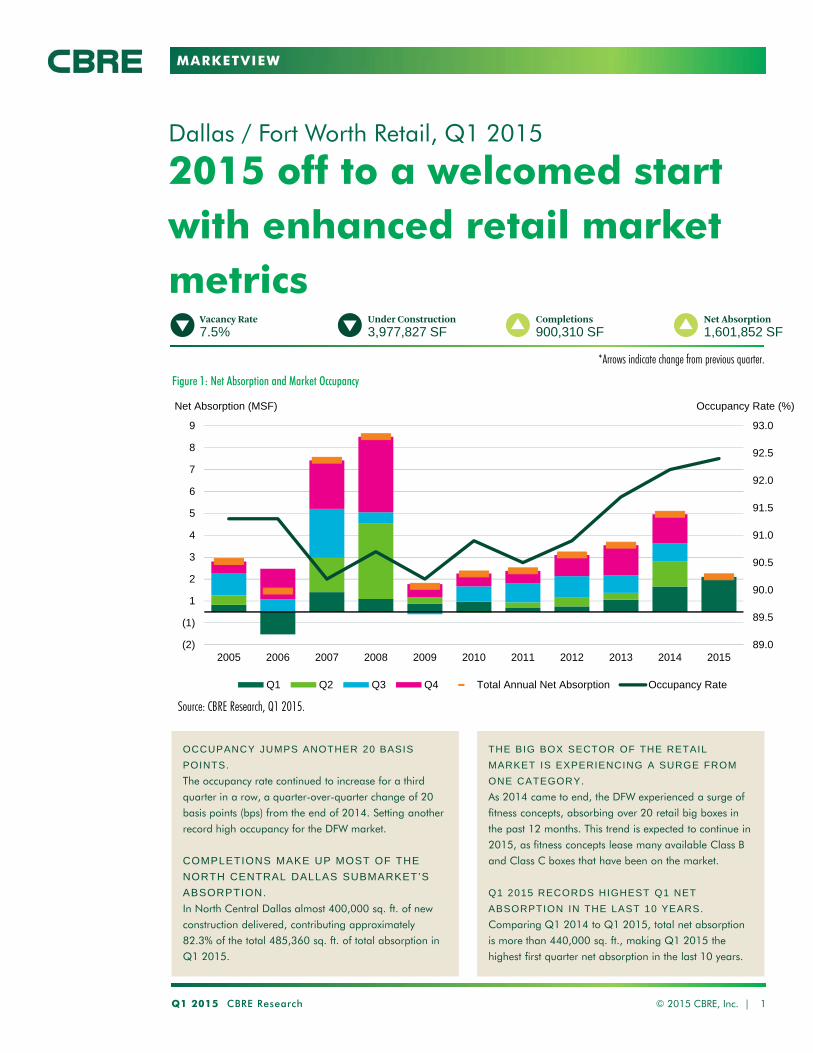
MARKETVIEW
2015 off to a welcomed start with enhanced retail market metrics
Dallas / Fort Worth Retail, Q1 2015
Q1 2015 CBRE Research © 2015 CBRE, Inc. | 1
Vacancy Rate7.5%
*Arrows indicate change from previous quarter.
Under Construction3,977,827 SF
Completions900,310 SF
Net Absorption1,601,852 SF
OCCUPANCY JUMPS ANOTHER 20 BASIS
POINTS.
The occupancy rate continued to increase for a third
quarter in a row, a quarter-over-quarter change of 20
basis points (bps) from the end of 2014. Setting another
record high occupancy for the DFW market.
COMPLETIONS MAKE UP MOST OF THE
NORTH CENTRAL DALLAS SUBMARKET’S
ABSORPTION.
In North Central Dallas almost 400,000 sq. ft. of new
construction delivered, contributing approximately
82.3% of the total 485,360 sq. ft. of total absorption in
Q1 2015.
Figure 1: Net Absorption and Market Occupancy
Source: CBRE Research, Q1 2015.
THE BIG BOX SECTOR OF THE RETAIL
MARKET IS EXPERIENCING A SURGE FROM
ONE CATEGORY.
As 2014 came to end, the DFW experienced a surge of
fitness concepts, absorbing over 20 retail big boxes in
the past 12 months. This trend is expected to continue in
2015, as fitness concepts lease many available Class B
and Class C boxes that have been on the market.
Q1 2015 RECORDS HIGHEST Q1 NET
ABSORPTION IN THE LAST 10 YEARS.
Comparing Q1 2014 to Q1 2015, total net absorption
is more than 440,000 sq. ft., making Q1 2015 the
highest first quarter net absorption in the last 10 years.
89.0
89.5
90.0
90.5
91.0
91.5
92.0
92.5
93.0
(2)
(1)
1
2
3
4
5
6
7
8
9
2005 2006 2007 2008 2009 2010 2011 2012 2013 2014 2015
Occupancy Rate (%)Net Absorption (MSF)
Q1 Q2 Q3 Q4 Total Annual Net Absorption Occupancy Rate
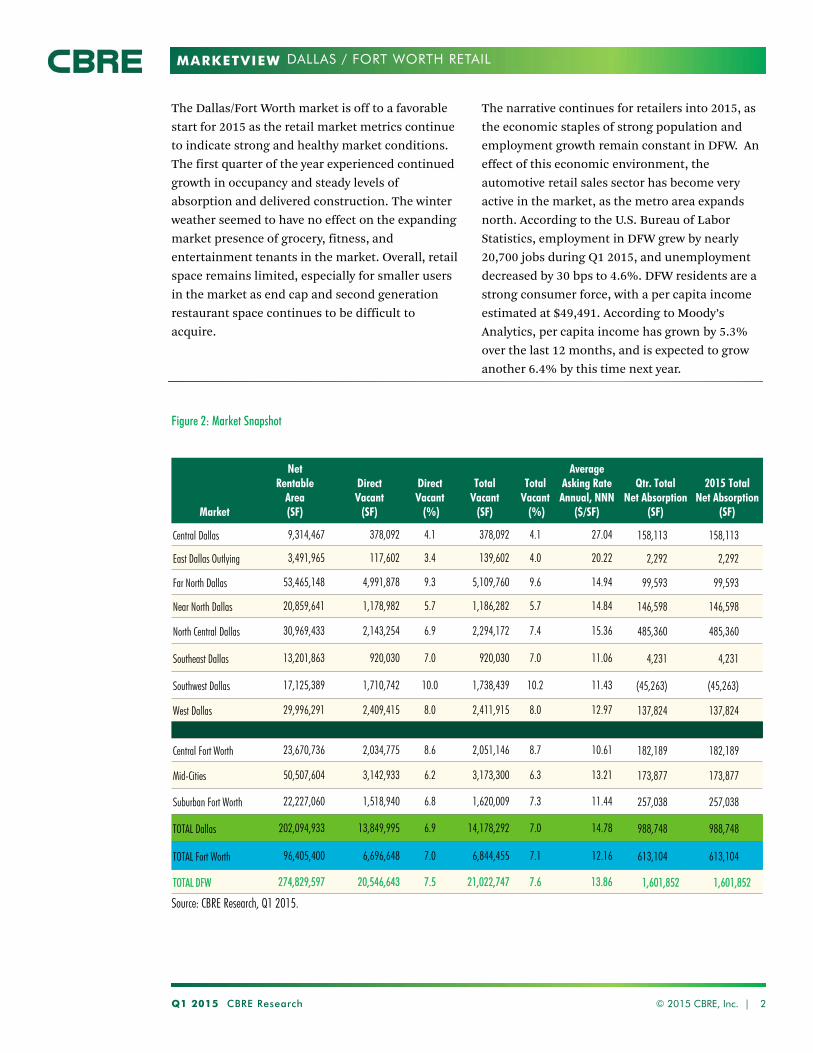
MARKETVIEW
Q1 2015 CBRE Research © 2015 CBRE, Inc. | 2
DALLAS / FORT WORTH RETAIL
Figure 2: Market Snapshot
Market
Net Rentable
Area(SF)
DirectVacant
(SF)
Direct Vacant
(%)
TotalVacant
(SF)
Total Vacant
(%)
Average Asking RateAnnual, NNN
($/SF)
Qtr. TotalNet Absorption
(SF)
2015 Total Net Absorption
(SF)
Central Dallas 9,314,467 378,092 4.1 378,092 4.1 27.04 158,113 158,113
East Dallas Outlying 3,491,965 117,602 3.4 139,602 4.0 20.22 2,292 2,292
Far North Dallas 53,465,148 4,991,878 9.3 5,109,760 9.6 14.94 99,593 99,593
Near North Dallas 20,859,641 1,178,982 5.7 1,186,282 5.7 14.84 146,598 146,598
North Central Dallas 30,969,433 2,143,254 6.9 2,294,172 7.4 15.36 485,360 485,360
Southeast Dallas 13,201,863 920,030 7.0 920,030 7.0 11.06 4,231 4,231
Southwest Dallas 17,125,389 1,710,742 10.0 1,738,439 10.2 11.43 (45,263) (45,263)
West Dallas 29,996,291 2,409,415 8.0 2,411,915 8.0 12.97 137,824 137,824
Central Fort Worth 23,670,736 2,034,775 8.6 2,051,146 8.7 10.61 182,189 182,189
Mid-Cities 50,507,604 3,142,933 6.2 3,173,300 6.3 13.21 173,877 173,877
Suburban Fort Worth 22,227,060 1,518,940 6.8 1,620,009 7.3 11.44 257,038 257,038
TOTAL Dallas 202,094,933 13,849,995 6.9 14,178,292 7.0 14.78 988,748 988,748
TOTAL Fort Worth 96,405,400 6,696,648 7.0 6,844,455 7.1 12.16 613,104 613,104
TOTAL DFW 274,829,597 20,546,643 7.5 21,022,747 7.6 13.86 1,601,852 1,601,852
The Dallas/Fort Worth market is off to a favorable start for 2015 as the retail market metrics continue to indicate strong and healthy market conditions. The first quarter of the year experienced continued growth in occupancy and steady levels of absorption and delivered construction. The winter weather seemed to have no effect on the expanding market presence of grocery, fitness, and entertainment tenants in the market. Overall, retail space remains limited, especially for smaller users in the market as end cap and second generation restaurant space continues to be difficult to acquire.
The narrative continues for retailers into 2015, as the economic staples of strong population and employment growth remain constant in DFW. An effect of this economic environment, the automotive retail sales sector has become very active in the market, as the metro area expands north. According to the U.S. Bureau of Labor Statistics, employment in DFW grew by nearly 20,700 jobs during Q1 2015, and unemployment decreased by 30 bps to 4.6%. DFW residents are a strong consumer force, with a per capita income estimated at $49,491. According to Moody’s Analytics, per capita income has grown by 5.3% over the last 12 months, and is expected to grow another 6.4% by this time next year.
Source: CBRE Research, Q1 2015.
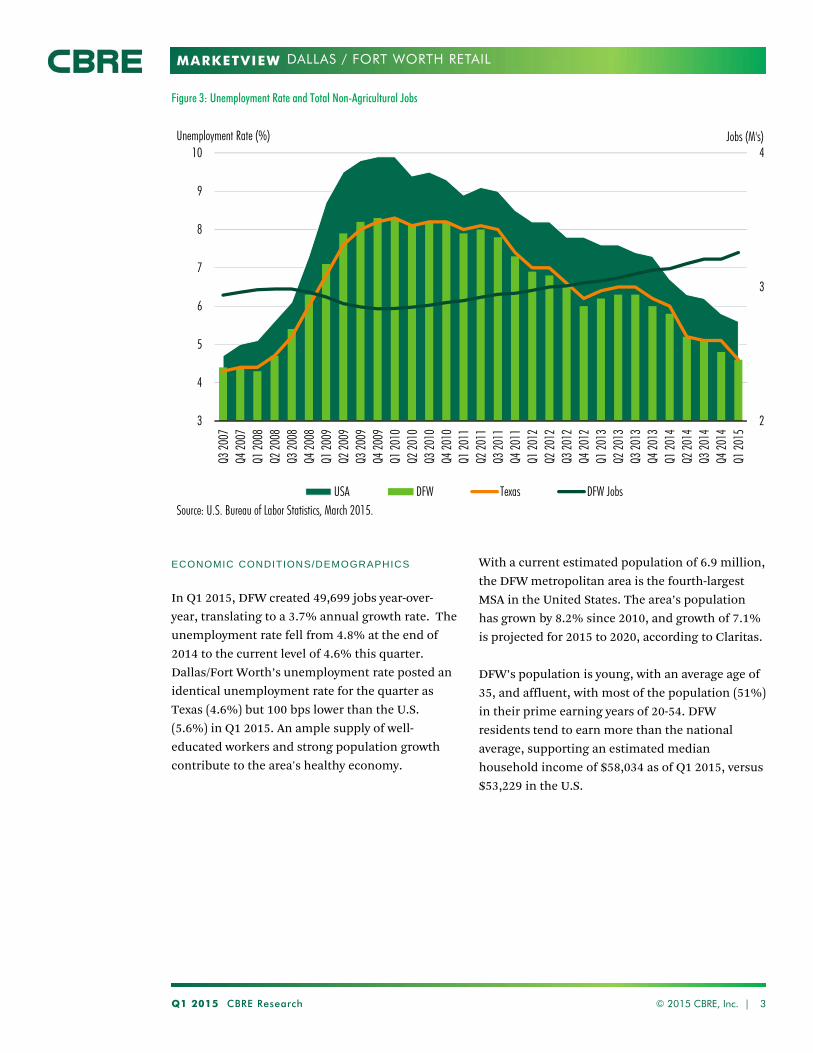
MARKETVIEW
Q1 2015 CBRE Research © 2015 CBRE, Inc. | 3
DALLAS / FORT WORTH RETAIL
Figure 3: Unemployment Rate and Total Non-Agricultural Jobs
ECONOMIC CONDITIONS/DEMOGRAPHICS
In Q1 2015, DFW created 49,699 jobs year-over-year, translating to a 3.7% annual growth rate. The unemployment rate fell from 4.8% at the end of 2014 to the current level of 4.6% this quarter. Dallas/Fort Worth’s unemployment rate posted an identical unemployment rate for the quarter as Texas (4.6%) but 100 bps lower than the U.S. (5.6%) in Q1 2015. An ample supply of well-educated workers and strong population growth contribute to the area's healthy economy.
With a current estimated population of 6.9 million, the DFW metropolitan area is the fourth-largest MSA in the United States. The area’s population has grown by 8.2% since 2010, and growth of 7.1% is projected for 2015 to 2020, according to Claritas.
DFW’s population is young, with an average age of 35, and affluent, with most of the population (51%) in their prime earning years of 20-54. DFW residents tend to earn more than the national average, supporting an estimated median household income of $58,034 as of Q1 2015, versus $53,229 in the U.S.
2
3
4
3
4
5
6
7
8
9
10
Q3 20
07Q4
2007
Q1 20
08Q2
2008
Q3 20
08Q4
2008
Q1 20
09Q2
2009
Q3 20
09Q4
2009
Q1 20
10Q2
2010
Q3 20
10Q4
2010
Q1 20
11Q2
2011
Q3 20
11Q4
2011
Q1 20
12Q2
2012
Q3 20
12Q4
2012
Q1 20
13Q2
2013
Q3 20
13Q4
2013
Q1 20
14Q2
2014
Q3 20
14Q4
2014
Q1 20
15
Jobs (M's)
Source: U.S. Bureau of Labor Statistics, March 2015.
Unemployment Rate (%)
USA DFW Texas DFW Jobs
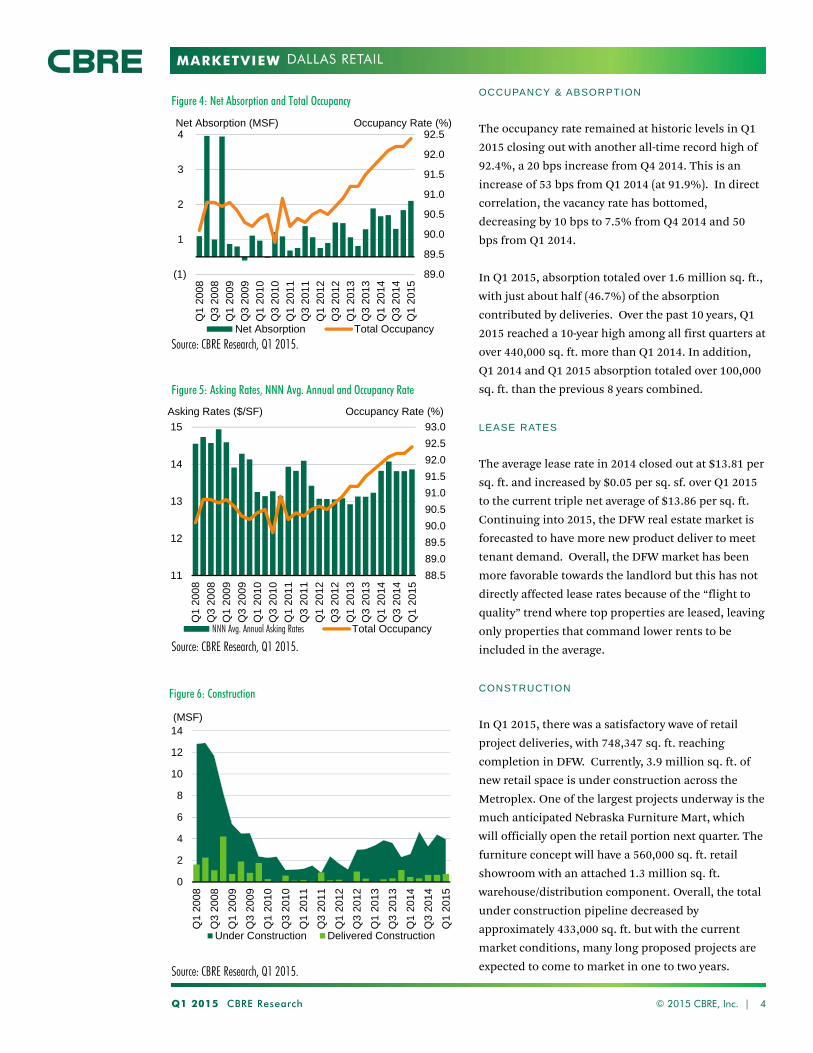
MARKETVIEW
OCCUPANCY & ABSORPTION
The occupancy rate remained at historic levels in Q1 2015 closing out with another all-time record high of 92.4%, a 20 bps increase from Q4 2014. This is an increase of 53 bps from Q1 2014 (at 91.9%). In direct correlation, the vacancy rate has bottomed, decreasing by 10 bps to 7.5% from Q4 2014 and 50 bps from Q1 2014.
In Q1 2015, absorption totaled over 1.6 million sq. ft., with just about half (46.7%) of the absorption contributed by deliveries. Over the past 10 years, Q1 2015 reached a 10-year high among all first quarters at over 440,000 sq. ft. more than Q1 2014. In addition, Q1 2014 and Q1 2015 absorption totaled over 100,000 sq. ft. than the previous 8 years combined.
LEASE RATES
The average lease rate in 2014 closed out at $13.81 per sq. ft. and increased by $0.05 per sq. sf. over Q1 2015 to the current triple net average of $13.86 per sq. ft. Continuing into 2015, the DFW real estate market is forecasted to have more new product deliver to meet tenant demand. Overall, the DFW market has been more favorable towards the landlord but this has not directly affected lease rates because of the “flight to quality” trend where top properties are leased, leaving only properties that command lower rents to be included in the average.
CONSTRUCTION
In Q1 2015, there was a satisfactory wave of retail project deliveries, with 748,347 sq. ft. reaching completion in DFW. Currently, 3.9 million sq. ft. of new retail space is under construction across the Metroplex. One of the largest projects underway is the much anticipated Nebraska Furniture Mart, which will officially open the retail portion next quarter. The furniture concept will have a 560,000 sq. ft. retail showroom with an attached 1.3 million sq. ft. warehouse/distribution component. Overall, the total under construction pipeline decreased by approximately 433,000 sq. ft. but with the current market conditions, many long proposed projects are expected to come to market in one to two years.
Q1 2015 CBRE Research © 2015 CBRE, Inc. | 4
DALLAS RETAIL
Figure 4: Net Absorption and Total Occupancy
Figure 5: Asking Rates, NNN Avg. Annual and Occupancy Rate
Source: CBRE Research, Q1 2015.
Source: CBRE Research, Q1 2015.
Figure 6: Construction
Source: CBRE Research, Q1 2015.
89.0
89.5
90.0
90.5
91.0
91.5
92.0
92.5
(1)
1
2
3
4
Q1
200
8
Q3
200
8
Q1
200
9
Q3
200
9
Q1
201
0
Q3
201
0
Q1
201
1
Q3
201
1
Q1
201
2
Q3
201
2
Q1
201
3
Q3
201
3
Q1
201
4
Q3
201
4
Q1
201
5
Occupancy Rate (%)Net Absorption (MSF)
Net Absorption Total Occupancy
88.5
89.0
89.5
90.0
90.5
91.0
91.5
92.0
92.5
93.0
11
12
13
14
15
Q1
200
8
Q3
200
8
Q1
200
9
Q3
200
9
Q1
201
0
Q3
201
0
Q1
201
1
Q3
201
1
Q1
201
2
Q3
201
2
Q1
201
3
Q3
201
3
Q1
201
4
Q3
201
4
Q1
201
5Occupancy Rate (%)Asking Rates ($/SF)
NNN Avg. Annual Asking Rates Total Occupancy
0
2
4
6
8
10
12
14
Q1
200
8
Q3
200
8
Q1
200
9
Q3
200
9
Q1
201
0
Q3
201
0
Q1
201
1
Q3
201
1
Q1
201
2
Q3
201
2
Q1
201
3
Q3
201
3
Q1
201
4
Q3
201
4
Q1
201
5
(MSF)
Under Construction Delivered Construction

MARKETVIEW
Q1 2015 CBRE Research © 2015 CBRE, Inc. | 5
DALLAS / FORT WORTH RETAIL
Figure 7: Big Box Space Available by Class
Source: CBRE Research, Q1 2015.
Figure 8: Big Box Space Available by Size Range*
Source: CBRE Research, Q1 2015.
KEY OBSERVATIONS
The market conditions from 2014 have continued into 2015 for the big box sector of the market. There are currently 151 vacant boxes totaling over 7.1 million sq. ft. in the market as of Q1 2015. Class A space is the most vulnerable with only 8 spaces left on the market totaling 242,370 sq. ft. There are approximately 56 Class B boxes and 48 Class C boxes that remain available in the entire DFW Market. A lack of product is fueling demand for new development in 2015 and 2016. Over 80 redevelopments or new projects are in the planning stages for the next three years. Hurdles to new development remain high with municipal restrictions and high land costs pushing rents to record high levels.
Most of the activity is driven by grocery, fitness, and entertainment retailers as they continue their expansion in the DFW market. Some of the most active retailers in the market include Gander
Mountain, WinCo, Walmart, H-E-B, Youfit, Total Wine, Sprouts, Trader Joes, Whole Foods, and Fitness Connection. While Barnes & Noble, Office Depot, Staples, Best Buy and Sports Authority continue to close stores and “right size” in order to compete with shrinking demand or increased competition from Internet Retail.
Overall, the emphasis is clearly switching to Class B and C Boxes. Landlords and tenants must continue to work creatively to reconfigure and modernize these older properties. We can expect to see developments take the shape of larger big box anchor tenants with smaller in-line space. Secondary tenants do not require the same size store fronts as the internet shift has effected how consumers shop. Restaurants remain the only sector with unchanged requirements for in-line/ pad space.
Class A8 Properties242,370 SF
Class B56 Properties2,467,160 SF
Class C48 Properties2,437,507 SF 63
37
16
9
715
20,000-30,00030,001-40,00040,001-50,00050,001-60,00060,001-70,00070,001+
Range (SF)
*Data labels represent number of spaces

MARKETVIEW
Q1 2015 CBRE Research © 2015 CBRE, Inc. | 6
DALLAS / FORT WORTH RETAIL
Figure 9: Largest Available Big Box Space
Source: CBRE Research, Q1 2015.
Submarket Address Former Use Available (SF)Far North Dallas 13138 Montfort Drive Macy's 300,300
Far North Dallas 3159 S Garland Road Walmart 226,000Far North Dallas 811 N Central Expy Dillard's 176,259Southwest Dallas 3560 Camp Wisdom Rd Dillard's 150,000North Central Dallas 5000 Alpha Road The Great Indoors 141,690West Dallas 2625 W Hwy 303 Sam's Club 126,336Far North Dallas 13320 Montfort Drive J.C. Penney 111,657Near North Dallas 8282 Park Ln Sam's Club 111,501North Central Dallas 13342 Midway Road Gabbert's Furniture 105,000
Far North Dallas 3161 Broadway Boulevard Steve N Barry's 104,315Central Fort Worth 6912-6958 Ridgmar Meadow Drive Half Price Books 104,000Central Fort Worth 6001-6009 Jacksboro Highway Barato Bazaar 97,000Southeast Dallas 2021 N Town East Blvd Burlington 84,382Southwest Dallas 2550 W Red Bird Ln Terry's Market 72,911Southwest Dallas 7401 S Westmoreland Road Home Depot 71,842Mid-Cities 2430-2434 S I-35 E Albertson's 67,195Far North Dallas 3046-3048 Lavon Drive Albertson's 66,817Central Fort Worth 3304-3328 Denton Highway Kmart 65,733North Central Dallas 279 Main Street Albertson's 65,207Southwest Dallas 4101 W Wheatland Rd Albertson's 58,720Near North Dallas 6740-6780 Abrams Rd Albertson’s 57,465
14.9 1.4
24.9
7.77.912.6
<1
29.9
(%)
Community Center
Lifestyle Center
Neighborhood Center
Power Center
Strip Center
Regional & Super Regional Mall
Other (Theme/Festival & Outlet)
Freestanding Single Tenant
Source: CBRE Research, Q1 2015.
Figure 10: Dallas/Ft. Worth Retail Market Size by Classification
MARKETVIEW
Disclaimer: Information contained herein, including projections, has been obtained from sources believed to be reliable. While we do not doubt its accuracy, we have not verified it and make no guarantee, warranty or representation about it. It is your responsibility to confirm independently its accuracy and completeness. This information is presented exclusively for use by CBRE clients and professionals and all rights to the material are reserved and cannot be reproduced without prior written permission of CBRE.
CONTACTS
Lynn CirilloResearch Operations [email protected]
Lauren ParisSenior Research Analyst+1 214 [email protected]
Brian AshtonResearch Coordinator+1 214 [email protected]
CBRE OFFICES
CBRE Dallas2100 McKinney Ave, Suite 700Dallas, TX 75201
To learn more about CBRE Research,or to access additional research reports,please visit the Global Research Gateway at www.cbre.com/researchgateway.
DALLAS / FORT WORTH RETAIL
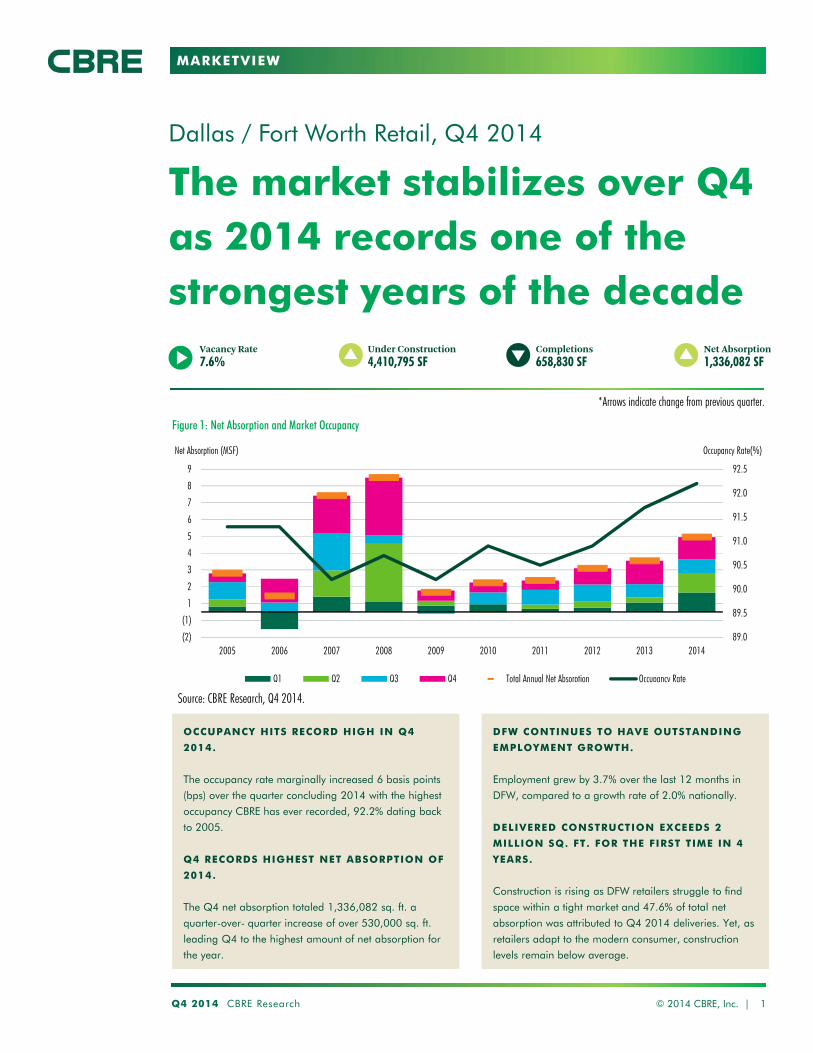
MARKETVIEW
The market stabilizes over Q4 as 2014 records one of the strongest years of the decade
Dallas / Fort Worth Retail, Q4 2014
Q4 2014 CBRE Research © 2014 CBRE, Inc. | 1
Vacancy Rate7.6%
*Arrows indicate change from previous quarter.
Under Construction4,410,795 SF
Completions658,830 SF
Net Absorption1,336,082 SF
OCCUPANCY HITS RECORD HIGH IN Q4
2014.
The occupancy rate marginally increased 6 basis points
(bps) over the quarter concluding 2014 with the highest
occupancy CBRE has ever recorded, 92.2% dating back
to 2005.
Q4 RECORDS HIGHEST NET ABSORPTION OF
2014.
The Q4 net absorption totaled 1,336,082 sq. ft. a
quarter-over- quarter increase of over 530,000 sq. ft.
leading Q4 to the highest amount of net absorption for
the year.
Figure 1: Net Absorption and Market Occupancy
Source: CBRE Research, Q4 2014.
DFW CONTINUES TO HAVE OUTSTANDING
EMPLOYMENT GROWTH.
Employment grew by 3.7% over the last 12 months in
DFW, compared to a growth rate of 2.0% nationally.
DELIVERED CONSTRUCTION EXCEEDS 2
MILLION SQ. FT. FOR THE FIRST TIME IN 4
YEARS.
Construction is rising as DFW retailers struggle to find
space within a tight market and 47.6% of total net
absorption was attributed to Q4 2014 deliveries. Yet, as
retailers adapt to the modern consumer, construction
levels remain below average.
89.0
89.5
90.0
90.5
91.0
91.5
92.0
92.5
(2)
(1)
1
2
3
4
5
6
7
8
9
2005 2006 2007 2008 2009 2010 2011 2012 2013 2014
Occupancy Rate(%)Net Absorption (MSF)
Q1 Q2 Q3 Q4 Total Annual Net Absorption Occupancy Rate

MARKETVIEW
Q4 2014 CBRE Research © 2014 CBRE, Inc. | 2
DALLAS / FORT WORTH RETAIL
Figure 2: Market Snapshot
Market
Net Rentable
Area(SF)
DirectVacant
(SF)
Direct Vacant
(%)
TotalVacant
(SF)
Total Vacant
(%)
Average Asking RateAnnual, NNN
($/SF)
Qtr. TotalNet Absorption
(SF)
2014 Total Net Absorption
(SF)
Central Dallas 9,082,276 460,829 5.1 460,829 5.1 20.21 47,242 101,648
East Dallas Outlying 3,482,829 119,894 3.4 141,894 4.1 19.95 6,441 (8,769)
Far North Dallas 53,443,582 5,169,982 9.7 5,289,946 9.9 14.99 216,419 780,537
Near North Dallas 20,879,785 1,226,869 5.9 1,241,169 5.9 14.66 67,376 116,135
North Central Dallas 30,314,475 1,976,652 6.5 2,127,570 7.0 15.43 171,294 316,706
Southeast Dallas 13,186,023 924,261 7.0 924,261 7.0 11.37 44,210 4,942
Southwest Dallas 17,070,389 1,607,504 9.4 1,635,201 9.6 11.57 59,876 503,218
West Dallas 30,076,169 2,407,595 8.0 2,410,095 8.0 13.74 48,153 514,750
Central Fort Worth 23,662,009 2,160,330 9.1 2,173,835 9.2 10.41 201,667 368,008
Mid-Cities 50,397,194 3,269,300 9.5 3,322,796 6.6 13.53 313,798 1,103,732
Suburban Fort Worth 21,816,257 1,410,978 6.5 1,512,047 6.9 11.86 159,606 657,681
TOTAL Dallas 177,535,528 13,893,586 7.8 14,230,965 8.0 14.58 661,011 2,329,167
TOTAL Fort Worth 95,875,460 6,840,608 7.1 7,008,678 7.3 12.38 675,071 2,129,421
TOTAL DFW 273,410,988 20,734,194 7.6 21,239,643 7.8 13.81 1,336,082 4,458,588
Fundamentally, the Dallas/Fort Worth market stabilized over the final months of the year. Overall, activity was strong in 2014 as occupancy reached a new high of 92.2% in Q4. With over 4.4 million sq. ft. of total net absorption, demand for DFW retail space reached a 6-year high. Retailers continued to expand in 2014 as Grocery, Fitness, Entertainment, and Furniture made up most of the major activity in the market. Retail space continues to remain limited, especially for smaller users in the market as end cap and second generation restaurant space continues to be difficult to acquire.
The story remains consistent for retailers as they continue to focus on DFW for its strong population and employment growth. According to the US Bureau of Labor Statistics, employment in DFW grew by nearly 37,800 jobs during Q4 2014, and the unemployment rate decreased by 30 bps to 4.8%. DFW residents are a strong consumer force, with a per capita income estimated at $56,781. According to Moody’s Analytics, per capita income has grown by 7.0% over the last 12 months, and is expected to grow another 8.7% by this time next year.
Source: CBRE Research, Q4 2014.
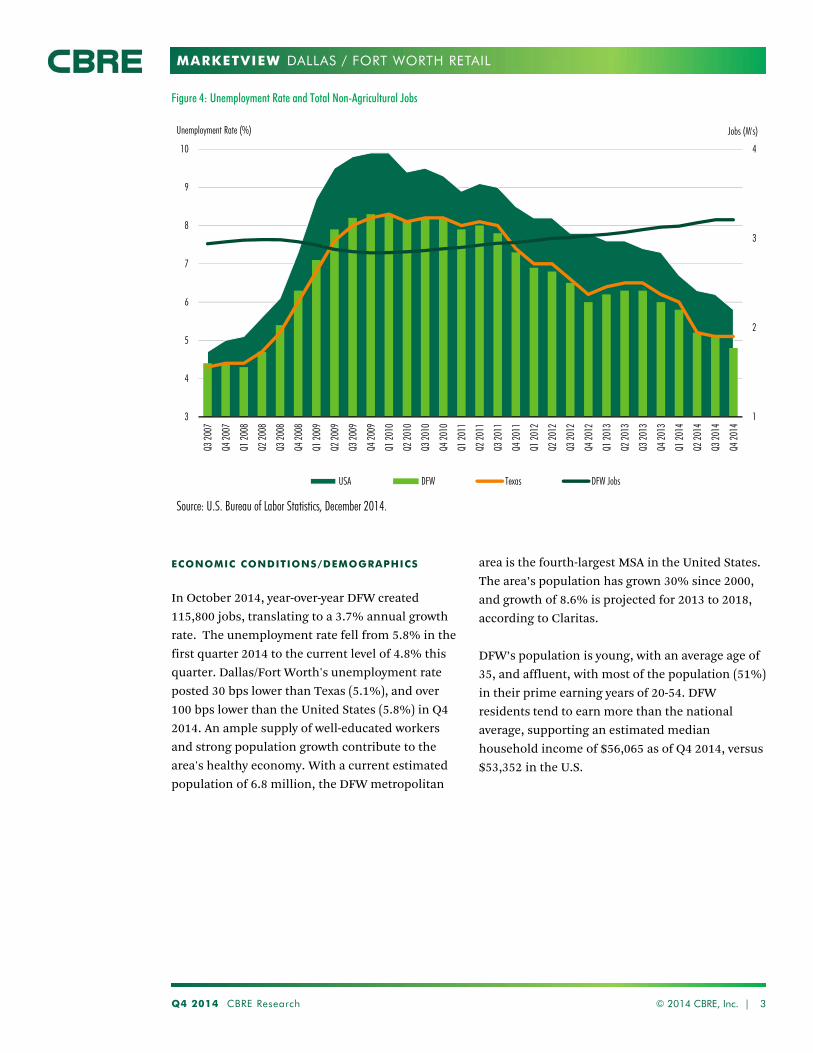
MARKETVIEW
Q4 2014 CBRE Research © 2014 CBRE, Inc. | 3
DALLAS / FORT WORTH RETAIL
1
2
3
4
3
4
5
6
7
8
9
10
Q3 20
07
Q4 20
07
Q1 20
08
Q2 20
08
Q3 20
08
Q4 20
08
Q1 20
09
Q2 20
09
Q3 20
09
Q4 20
09
Q1 20
10
Q2 20
10
Q3 20
10
Q4 20
10
Q1 20
11
Q2 20
11
Q3 20
11
Q4 20
11
Q1 20
12
Q2 20
12
Q3 20
12
Q4 20
12
Q1 20
13
Q2 20
13
Q3 20
13
Q4 20
13
Q1 20
14
Q2 20
14
Q3 20
14
Q4 20
14
Jobs (M's)
Source: U.S. Bureau of Labor Statistics, December 2014.
Unemployment Rate (%)
USA DFW Texas DFW Jobs
Figure 4: Unemployment Rate and Total Non-Agricultural Jobs
ECONOMIC CONDITIONS/DEMOGRAPHICS
In October 2014, year-over-year DFW created 115,800 jobs, translating to a 3.7% annual growth rate. The unemployment rate fell from 5.8% in the first quarter 2014 to the current level of 4.8% this quarter. Dallas/Fort Worth's unemployment rate posted 30 bps lower than Texas (5.1%), and over 100 bps lower than the United States (5.8%) in Q4 2014. An ample supply of well-educated workers and strong population growth contribute to the area's healthy economy. With a current estimated population of 6.8 million, the DFW metropolitan
area is the fourth-largest MSA in the United States. The area’s population has grown 30% since 2000, and growth of 8.6% is projected for 2013 to 2018, according to Claritas.
DFW’s population is young, with an average age of 35, and affluent, with most of the population (51%) in their prime earning years of 20-54. DFW residents tend to earn more than the national average, supporting an estimated median household income of $56,065 as of Q4 2014, versus $53,352 in the U.S.
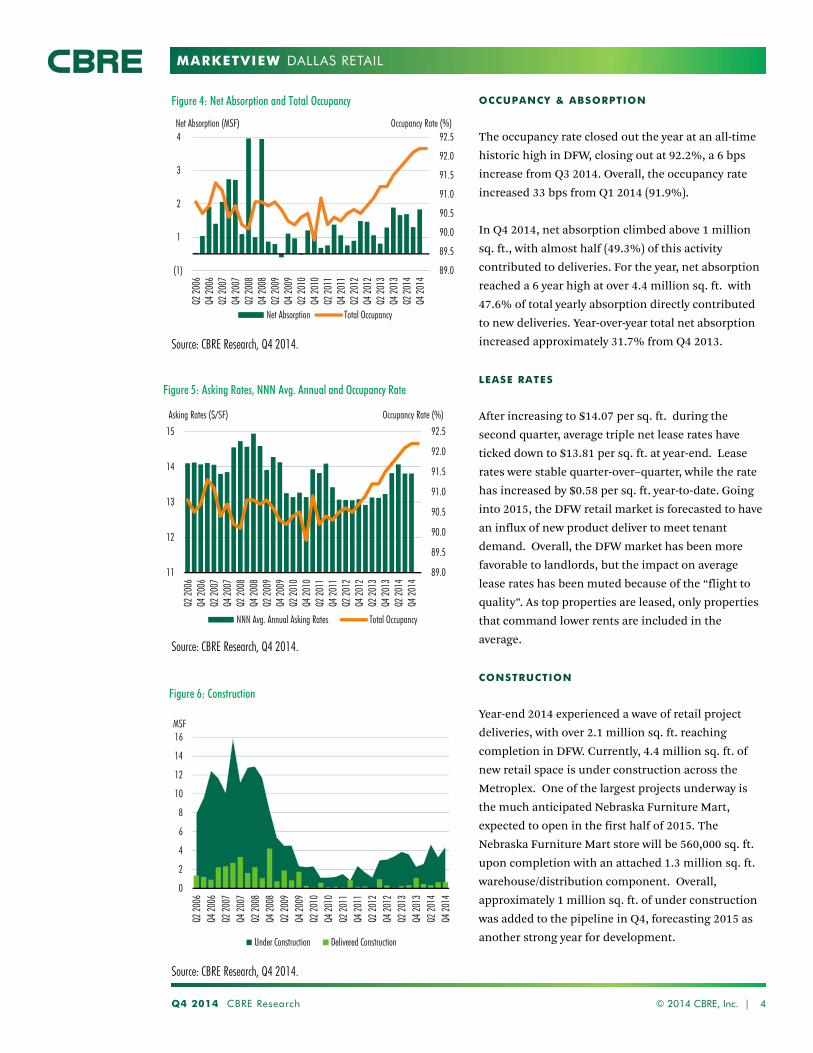
MARKETVIEW
OCCUPANCY & ABSORPTION
The occupancy rate closed out the year at an all-time historic high in DFW, closing out at 92.2%, a 6 bps increase from Q3 2014. Overall, the occupancy rate increased 33 bps from Q1 2014 (91.9%).
In Q4 2014, net absorption climbed above 1 million sq. ft., with almost half (49.3%) of this activity contributed to deliveries. For the year, net absorption reached a 6 year high at over 4.4 million sq. ft. with 47.6% of total yearly absorption directly contributed to new deliveries. Year-over-year total net absorption increased approximately 31.7% from Q4 2013.
LEASE RATES
After increasing to $14.07 per sq. ft. during the second quarter, average triple net lease rates have ticked down to $13.81 per sq. ft. at year-end. Lease rates were stable quarter-over–quarter, while the rate has increased by $0.58 per sq. ft. year-to-date. Going into 2015, the DFW retail market is forecasted to have an influx of new product deliver to meet tenant demand. Overall, the DFW market has been more favorable to landlords, but the impact on average lease rates has been muted because of the “flight to quality”. As top properties are leased, only properties that command lower rents are included in the average.
CONSTRUCTION
Year-end 2014 experienced a wave of retail project deliveries, with over 2.1 million sq. ft. reaching completion in DFW. Currently, 4.4 million sq. ft. of new retail space is under construction across the Metroplex. One of the largest projects underway is the much anticipated Nebraska Furniture Mart, expected to open in the first half of 2015. The Nebraska Furniture Mart store will be 560,000 sq. ft. upon completion with an attached 1.3 million sq. ft. warehouse/distribution component. Overall, approximately 1 million sq. ft. of under construction was added to the pipeline in Q4, forecasting 2015 as another strong year for development.
Q4 2014 CBRE Research © 2014 CBRE, Inc. | 4
DALLAS RETAIL
Figure 4: Net Absorption and Total Occupancy
89.0
89.5
90.0
90.5
91.0
91.5
92.0
92.5
(1)
1
2
3
4
Q2 20
06Q4
2006
Q2 20
07Q4
2007
Q2 20
08Q4
2008
Q2 20
09Q4
2009
Q2 20
10Q4
2010
Q2 20
11Q4
2011
Q2 20
12Q4
2012
Q2 20
13Q4
2013
Q2 20
14Q4
2014
Occupancy Rate (%)Net Absorption (MSF)
Net Absorption Total Occupancy
89.0
89.5
90.0
90.5
91.0
91.5
92.0
92.5
11
12
13
14
15
Q2 20
06Q4
2006
Q2 20
07Q4
2007
Q2 20
08Q4
2008
Q2 20
09Q4
2009
Q2 20
10Q4
2010
Q2 20
11Q4
2011
Q2 20
12Q4
2012
Q2 20
13Q4
2013
Q2 20
14Q4
2014
Occupancy Rate (%)Asking Rates ($/SF)
NNN Avg. Annual Asking Rates Total Occupancy
Figure 5: Asking Rates, NNN Avg. Annual and Occupancy Rate
Source: CBRE Research, Q4 2014.
Source: CBRE Research, Q4 2014.
0
2
4
6
8
10
12
14
16
Q2 20
06Q4
2006
Q2 20
07Q4
2007
Q2 20
08Q4
2008
Q2 20
09Q4
2009
Q2 20
10Q4
2010
Q2 20
11Q4
2011
Q2 20
12Q4
2012
Q2 20
13Q4
2013
Q2 20
14Q4
2014
MSF
Under Construction Delivered Construction
Figure 6: Construction
Source: CBRE Research, Q4 2014.

MARKETVIEW
Q4 2014 CBRE Research © 2014 CBRE, Inc. | 5
DALLAS / FORT WORTH RETAIL
Figure 8: Big Box Space Available by Class
Source: CBRE Research, Q4 2014.
Class A8 Properties225,106 SF
Class B60 Properties2,349,226 SF
Class C51 Properties2,444,449 SF
63
37
16
9
715
20,000-30,00030,001-40,00040,001-50,00050,001-60,00060,001-70,000
Range (SF)
Figure 9: Big Box Space Available by Size Range
Source: CBRE Research, Q4 2014.
KEY OBSERVATIONS
The plot thickens for big box space as 2014 comes to an end. Class A big box space has virtually disappeared with only 8 of these spaces available, compared to 60 Class B boxes and 51 Class C boxes in the entire DFW Market. A lack of product is fueling demand for new development in 2015 and 2016. Over 75 redevelopments or new projects are in the planning stages for the next three years. Hurdles to new development remain high, including municipal challenges and high land costs.
Most of the activity is driven by Grocery, Fitness, and Entertainment retailers as they continue their expansion in the DFW market. Some of the most active retailers in the market include Gander Mtn., WinCo, Walmart, H-E-B, Youfit, Total Wine,
Sprouts, Trader Joes, Whole Foods, and Fitness Connection. While Barnes & Noble, Office Depot, Staples, Best Buy and Sports Authority continue to close stores and “Right Size” in order to compete with shrinking demand or increased competition from Internet Retail.
Overall, retail space is still needed in the market; retailers still need and want stores in the market. The active users in the market offer a competitive advantage with services that ecommerce cannot replace. There is still room to expand in the DFW market and development should continue. We expect to see development take shape with big box anchor tenants and smaller in-line space, as secondary tents do not require the same size store fronts due to the internet shift. Restaurants remain the only sector with unchanged requirements for in-line/pad space.
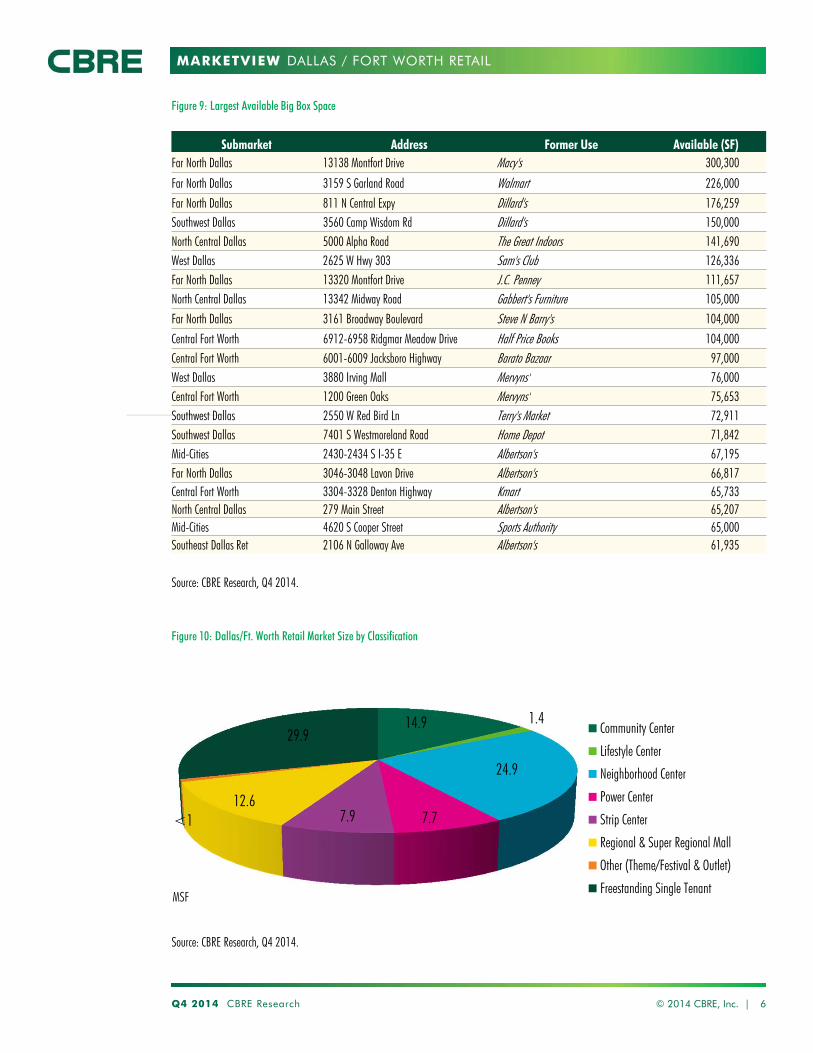
MARKETVIEW
Q4 2014 CBRE Research © 2014 CBRE, Inc. | 6
DALLAS / FORT WORTH RETAIL
Figure 9: Largest Available Big Box Space
Source: CBRE Research, Q4 2014.
Submarket Address Former Use Available (SF)Far North Dallas 13138 Montfort Drive Macy's 300,300
Far North Dallas 3159 S Garland Road Walmart 226,000Far North Dallas 811 N Central Expy Dillard's 176,259Southwest Dallas 3560 Camp Wisdom Rd Dillard's 150,000North Central Dallas 5000 Alpha Road The Great Indoors 141,690West Dallas 2625 W Hwy 303 Sam's Club 126,336Far North Dallas 13320 Montfort Drive J.C. Penney 111,657North Central Dallas 13342 Midway Road Gabbert's Furniture 105,000Far North Dallas 3161 Broadway Boulevard Steve N Barry's 104,000
Central Fort Worth 6912-6958 Ridgmar Meadow Drive Half Price Books 104,000Central Fort Worth 6001-6009 Jacksboro Highway Barato Bazaar 97,000West Dallas 3880 Irving Mall Mervyns' 76,000Central Fort Worth 1200 Green Oaks Mervyns' 75,653Southwest Dallas 2550 W Red Bird Ln Terry's Market 72,911Southwest Dallas 7401 S Westmoreland Road Home Depot 71,842Mid-Cities 2430-2434 S I-35 E Albertson's 67,195Far North Dallas 3046-3048 Lavon Drive Albertson's 66,817Central Fort Worth 3304-3328 Denton Highway Kmart 65,733North Central Dallas 279 Main Street Albertson's 65,207Mid-Cities 4620 S Cooper Street Sports Authority 65,000Southeast Dallas Ret 2106 N Galloway Ave Albertson's 61,935
14.9 1.4
24.9
7.77.912.6
<1
29.9
MSF
Community Center
Lifestyle Center
Neighborhood Center
Power Center
Strip Center
Regional & Super Regional Mall
Other (Theme/Festival & Outlet)
Freestanding Single Tenant
Source: CBRE Research, Q4 2014.
Figure 10: Dallas/Ft. Worth Retail Market Size by Classification

MARKETVIEW
Disclaimer: Information contained herein, including projections, has been obtained from sources believed to be reliable. While we do not doubt its accuracy, we have not verified it and make no guarantee, warranty or representation about it. It is your responsibility to confirm independently its accuracy and completeness. This information is presented exclusively for use by CBRE clients and professionals and all rights to the material are reserved and cannot be reproduced without prior written permission of CBRE.
CONTACTS
Lynn CirilloResearch Operations [email protected]
Lauren ParisSenior Research Analyst+1 214 [email protected]
Brian AshtonResearch Coordinator+1 214 [email protected]
CBRE OFFICES
CBRE Dallas2100 McKinney Ave, Suite 700Dallas, TX 75201
To learn more about CBRE Research,or to access additional research reports,please visit the Global Research Gateway at www.cbre.com/researchgateway.
DALLAS / FORT WORTH RETAIL

CBRE Global Research and Consulting
Dallas/Fort Worth RetailMarketView Q3 2014
© 2014, CBRE, Inc.
The summer months in Dallas/Fort Worth experienced decreased activity, but mar-ket fundamentals remain positive. With more construction and further move-ins anticipated in Q4 2014 and throughout 2015, positive growth is expected to be uninterrupted. Occupancy has been over 90% for the past 4 years (2010-2014) and has grown on average 56 bps over that period of time, compared to 31 bps over the previous 4 year period (2008-2010). The unemployment rate continued to de-cline in Q3 2014, from 6.3% in 3Q 2013 to the current level of 5.1%.
Source: CBRE Research, Q3 2014.
Figure 2: DFW Retail Market by Classification
The Dallas/Fort Worth economy has sustained strong economic conditions and continues as a popular location for retailers and businesses alike. In Q3 2014, Toyota announced the relocation of their North American Headquarters to DFW. This movement has sparked a lot of interest in the implications that it will have on Dallas/Fort Worth economy. With an expected 3,650 jobs added directly from the move and a reported $7.2 billion in total economic impact, according to a Grant Thornton study, the future is bright for DFW.
Figure 1: Quick Stats Q3 2014 Q-o-Q Y-o-Y
Vacancy 7.6%
Under Construction 3.4 million SF #
Delivered Construction 659,033 SF # #
Net Absorption 802,937 SF #
Unemployment Rate 5.1%
Hot TopicsDelivered construction nearly doubles over Q2 2014. As expected, delivered construction increased
318,501 sq. ft. over last quarter to 659,033 sq.
ft. near double the amount delivered in Q2
2014.
Net absorption declines over third quarter.The total net absorption of 802,937 sq. ft. was a
decrease of 355,369 sq. ft. from Q2 2014.
Overall, net absorption is still up for the year and
has surpassed the 2013 total.
DFW at the top of the list for job growth, again. Among the 12 largest metros in the United States, DFW ranked second for year-over-year total employment growth, according to the Bureau of Labor Statistics July Report.
Development concentrated in Northern and North Western portions of DFWDallas/Fort Worth continues to experience
development activity in the Northern and North
Western portions of the Metroplex. Specifically,
development is focused along State Highway 380
between Denton and McKinney, as well as North
Plano/Frisco along The Dallas North Tollway and
Sam Rayburn Tollway.
CONSTRUCTION DELIVERIES
MARKET FUNDAMENTALS REMAIN STRONG AS OCCUPANCY GROWTH SLOWS OVER THE QUARTER.
TRADE VOLUME JOB GROWTHUNEMPLOYMENTVACANCY
Directional arrows based on change from the previous quarter. Data reflects market totals.
15% 2%
24%
8% 8% 13%
<1%
30%
Community Center
Lifestyle Center
Neighborhood Center
Power Center
Strip Center
Regional & Super Regional Mall
Other (Theme/FesKval & Outlet)
Freestanding Single Tenant
7.6% 3,461,577 Sq. Ft. 659,033 Sq. Ft. 21% Y-o-Y 5.1% 104,700 Y-o-Y
2%
1%
15%
24%
8%
8%
13%30%
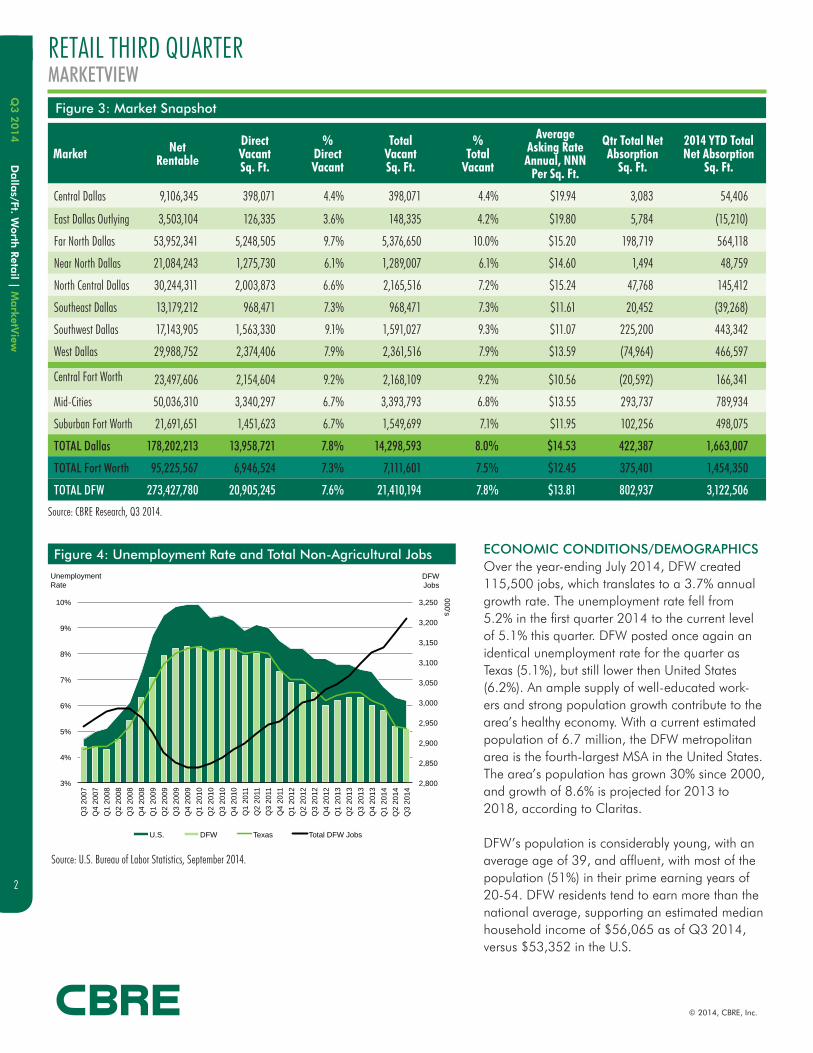
Dalla
s/Ft. Worth
Retail | M
arketV
iewQ
3 2
014
2
© 2014, CBRE, Inc.
Figure 3: Market Snapshot
ECONOMIC CONDITIONS/DEMOGRAPHICSOver the year-ending July 2014, DFW created 115,500 jobs, which translates to a 3.7% annual growth rate. The unemployment rate fell from 5.2% in the first quarter 2014 to the current level of 5.1% this quarter. DFW posted once again an identical unemployment rate for the quarter as Texas (5.1%), but still lower then United States (6.2%). An ample supply of well-educated work-ers and strong population growth contribute to the area’s healthy economy. With a current estimated population of 6.7 million, the DFW metropolitan area is the fourth-largest MSA in the United States. The area’s population has grown 30% since 2000, and growth of 8.6% is projected for 2013 to 2018, according to Claritas.
DFW’s population is considerably young, with an average age of 39, and affluent, with most of the population (51%) in their prime earning years of 20-54. DFW residents tend to earn more than the national average, supporting an estimated median household income of $56,065 as of Q3 2014, versus $53,352 in the U.S.
Market Net Rentable
Direct Vacant Sq. Ft.
% Direct Vacant
Total Vacant Sq. Ft.
% Total
Vacant
Average Asking Rate Annual, NNN
Per Sq. Ft.
Qtr Total Net Absorption
Sq. Ft.
2014 YTD Total Net Absorption
Sq. Ft.
Central Dallas 9,106,345 398,071 4.4% 398,071 4.4% $19.94 3,083 54,406
East Dallas Outlying 3,503,104 126,335 3.6% 148,335 4.2% $19.80 5,784 (15,210)
Far North Dallas 53,952,341 5,248,505 9.7% 5,376,650 10.0% $15.20 198,719 564,118
Near North Dallas 21,084,243 1,275,730 6.1% 1,289,007 6.1% $14.60 1,494 48,759
North Central Dallas 30,244,311 2,003,873 6.6% 2,165,516 7.2% $15.24 47,768 145,412
Southeast Dallas 13,179,212 968,471 7.3% 968,471 7.3% $11.61 20,452 (39,268)
Southwest Dallas 17,143,905 1,563,330 9.1% 1,591,027 9.3% $11.07 225,200 443,342
West Dallas 29,988,752 2,374,406 7.9% 2,361,516 7.9% $13.59 (74,964) 466,597
Central Fort Worth 23,497,606 2,154,604 9.2% 2,168,109 9.2% $10.56 (20,592) 166,341
Mid-Cities 50,036,310 3,340,297 6.7% 3,393,793 6.8% $13.55 293,737 789,934
Suburban Fort Worth 21,691,651 1,451,623 6.7% 1,549,699 7.1% $11.95 102,256 498,075
TOTAL Dallas 178,202,213 13,958,721 7.8% 14,298,593 8.0% $14.53 422,387 1,663,007
TOTAL Fort Worth 95,225,567 6,946,524 7.3% 7,111,601 7.5% $12.45 375,401 1,454,350
TOTAL DFW 273,427,780 20,905,245 7.6% 21,410,194 7.8% $13.81 802,937 3,122,506
Figure 4: Unemployment Rate and Total Non-Agricultural Jobs
Source: CBRE Research, Q3 2014.
Source: U.S. Bureau of Labor Statistics, September 2014.
2,800
2,850
2,900
2,950
3,000
3,050
3,100
3,150
3,200
3,250
3%
4%
5%
6%
7%
8%
9%
10%
Q3
2007
Q4
2007
Q1
2008
Q2
2008
Q3
2008
Q4
2008
Q1
2009
Q2
2009
Q3
2009
Q4
2009
Q1
2010
Q2
2010
Q3
2010
Q4
2010
Q1
2011
Q2
2011
Q3
2011
Q4
2011
Q1
2012
Q2
2012
Q3
2012
Q4
2012
Q1
2013
Q2
2013
Q3
2013
Q4
2013
Q1
2014
Q2
2014
Q3
2014
DFW Jobs
000's
Unemployment Rate
Source: U.S. Bureau of Labor Statistics, September 2014.
U.S. DFW Texas Total DFW Jobs
RETAIL THIRD QUARTERMARKETVIEW
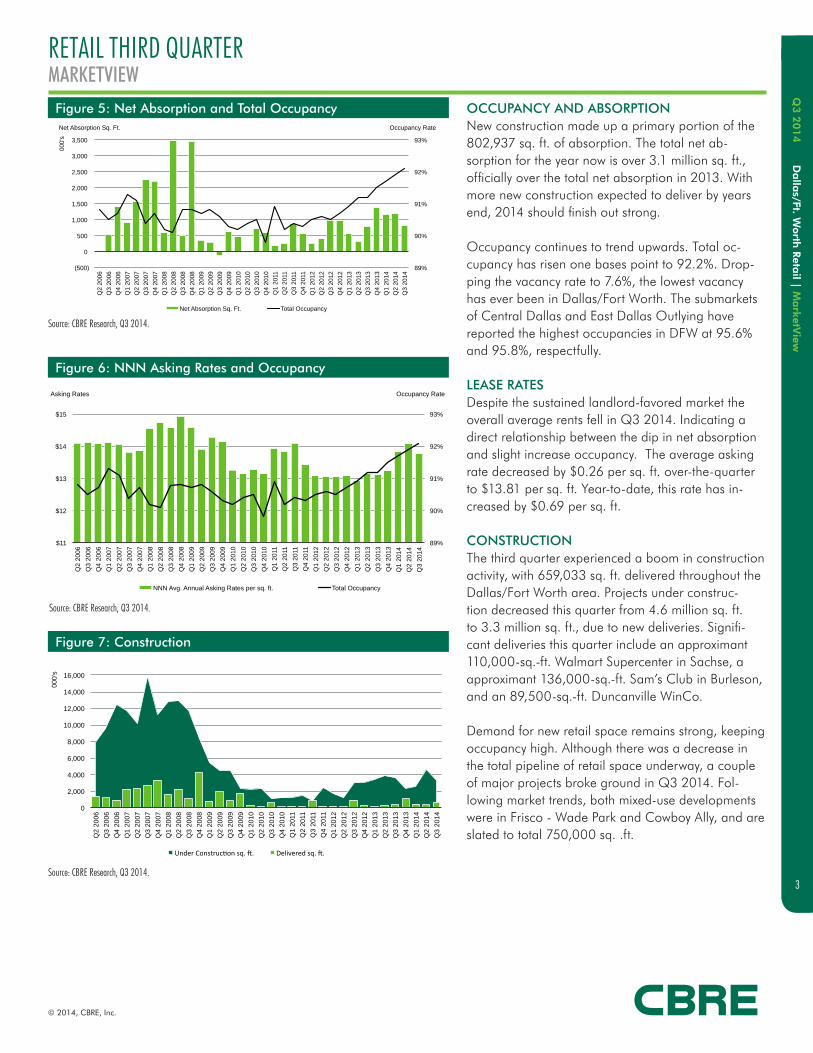
© 2014, CBRE, Inc.
Dalla
s/Ft. Worth
Retail | M
arketV
iewQ
3 2
014
3
RETAIL THIRD QUARTERMARKETVIEW
OCCUPANCY AND ABSORPTION New construction made up a primary portion of the 802,937 sq. ft. of absorption. The total net ab-sorption for the year now is over 3.1 million sq. ft., officially over the total net absorption in 2013. With more new construction expected to deliver by years end, 2014 should finish out strong.
Occupancy continues to trend upwards. Total oc-cupancy has risen one bases point to 92.2%. Drop-ping the vacancy rate to 7.6%, the lowest vacancy has ever been in Dallas/Fort Worth. The submarkets of Central Dallas and East Dallas Outlying have reported the highest occupancies in DFW at 95.6% and 95.8%, respectfully.
LEASE RATES Despite the sustained landlord-favored market the overall average rents fell in Q3 2014. Indicating a direct relationship between the dip in net absorption and slight increase occupancy. The average asking rate decreased by $0.26 per sq. ft. over-the-quarter to $13.81 per sq. ft. Year-to-date, this rate has in-creased by $0.69 per sq. ft.
CONSTRUCTIONThe third quarter experienced a boom in construction activity, with 659,033 sq. ft. delivered throughout the Dallas/Fort Worth area. Projects under construc-tion decreased this quarter from 4.6 million sq. ft. to 3.3 million sq. ft., due to new deliveries. Signifi-cant deliveries this quarter include an approximant 110,000-sq.-ft. Walmart Supercenter in Sachse, a approximant 136,000-sq.-ft. Sam’s Club in Burleson, and an 89,500-sq.-ft. Duncanville WinCo.
Demand for new retail space remains strong, keeping occupancy high. Although there was a decrease in the total pipeline of retail space underway, a couple of major projects broke ground in Q3 2014. Fol-lowing market trends, both mixed-use developments were in Frisco - Wade Park and Cowboy Ally, and are slated to total 750,000 sq. .ft.
Figure 5: Net Absorption and Total Occupancy
Figure 6: NNN Asking Rates and Occupancy
Figure 7: Construction
Source: CBRE Research, Q3 2014.
Source: CBRE Research, Q3 2014.
Source: CBRE Research, Q3 2014.
89%
90%
91%
92%
93%
(500)
0
500
1,000
1,500
2,000
2,500
3,000
3,500
Q2
2006
Q3
2006
Q4
2006
Q1
2007
Q2
2007
Q3
2007
Q4
2007
Q1
2008
Q2
2008
Q3
2008
Q4
2008
Q1
2009
Q2
2009
Q3
2009
Q4
2009
Q1
2010
Q2
2010
Q3
2010
Q4
2010
Q1
2011
Q2
2011
Q3
2011
Q4
2011
Q1
2012
Q2
2012
Q3
2012
Q4
2012
Q1
2013
Q2
2013
Q3
2013
Q4
2013
Q1
2014
Q2
2014
Q3
2014
Occupancy Rate
000'
s
Net Absorption Sq. Ft.
Net Absorption Sq. Ft. Total Occupancy
89%
90%
91%
92%
93%
$11
$12
$13
$14
$15
Q2
2006
Q3
2006
Q4
2006
Q1
2007
Q2
2007
Q3
2007
Q4
2007
Q1
2008
Q2
2008
Q3
2008
Q4
2008
Q1
2009
Q2
2009
Q3
2009
Q4
2009
Q1
2010
Q2
2010
Q3
2010
Q4
2010
Q1
2011
Q2
2011
Q3
2011
Q4
2011
Q1
2012
Q2
2012
Q3
2012
Q4
2012
Q1
2013
Q2
2013
Q3
2013
Q4
2013
Q1
2014
Q2
2014
Q3
2014
Occupancy Rate Asking Rates
NNN Avg. Annual Asking Rates per sq. ft. Total Occupancy
0
2,000
4,000
6,000
8,000
10,000
12,000
14,000
16,000
Q2
2006
Q3
2006
Q4
2006
Q1
2007
Q2
2007
Q3
2007
Q4
2007
Q1
2008
Q2
2008
Q3
2008
Q4
2008
Q1
2009
Q2
2009
Q3
2009
Q4
2009
Q1
2010
Q2
2010
Q3
2010
Q4
2010
Q1
2011
Q2
2011
Q3
2011
Q4
2011
Q1
2012
Q2
2012
Q3
2012
Q4
2012
Q1
2013
Q2
2013
Q3
2013
Q4
2013
Q1
2014
Q2
2014
Q3
2014
000'
s
Under Construc-on sq. 0. Delivered sq. 0.
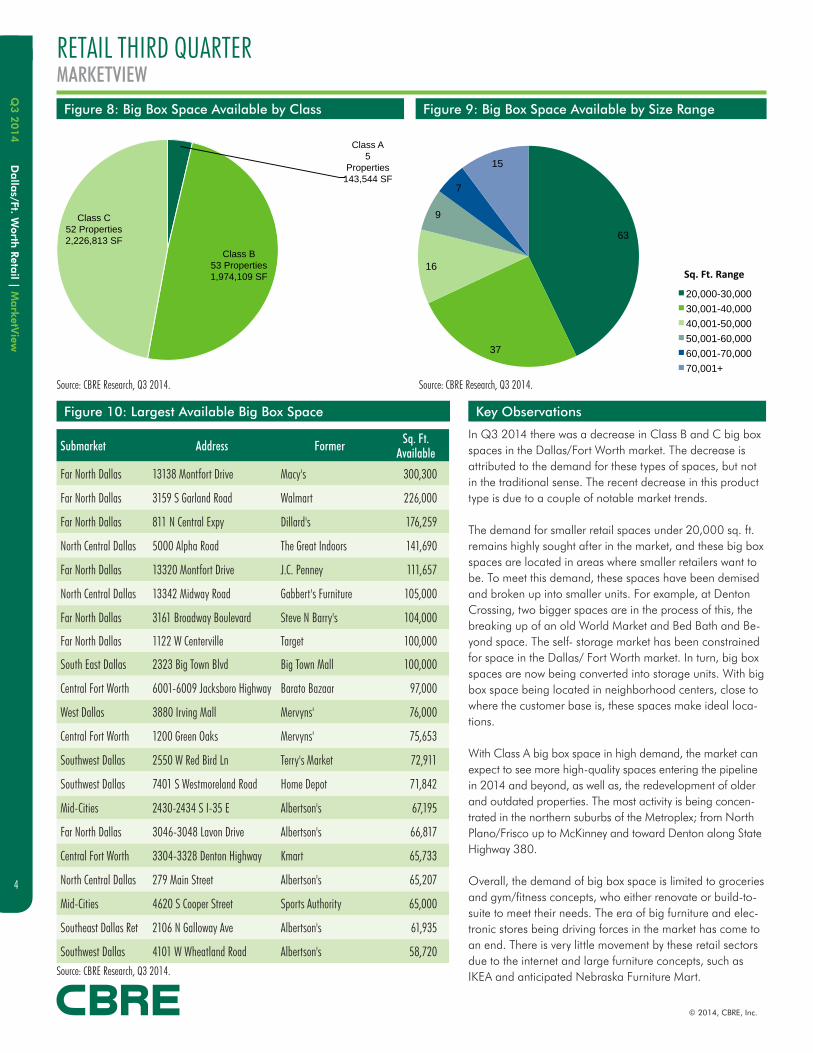
Dalla
s/Ft. Worth
Retail | M
arketV
iewQ
3 2
014
4
© 2014, CBRE, Inc.
Class A 5
Properties 143,544 SF
Class B 53 Properties 1,974,109 SF
Class C 52 Properties 2,226,813 SF
RETAIL THIRD QUARTERMARKETVIEW
Source: CBRE Research, Q3 2014.
Source: CBRE Research, Q3 2014. Source: CBRE Research, Q3 2014.
Figure 8: Big Box Space Available by Class Figure 9: Big Box Space Available by Size Range
Key ObservationsFigure 10: Largest Available Big Box Space
In Q3 2014 there was a decrease in Class B and C big box spaces in the Dallas/Fort Worth market. The decrease is attributed to the demand for these types of spaces, but not in the traditional sense. The recent decrease in this product type is due to a couple of notable market trends.
The demand for smaller retail spaces under 20,000 sq. ft. remains highly sought after in the market, and these big box spaces are located in areas where smaller retailers want to be. To meet this demand, these spaces have been demised and broken up into smaller units. For example, at Denton Crossing, two bigger spaces are in the process of this, the breaking up of an old World Market and Bed Bath and Be-yond space. The self- storage market has been constrained for space in the Dallas/ Fort Worth market. In turn, big box spaces are now being converted into storage units. With big box space being located in neighborhood centers, close to where the customer base is, these spaces make ideal loca-tions.
With Class A big box space in high demand, the market can expect to see more high-quality spaces entering the pipeline in 2014 and beyond, as well as, the redevelopment of older and outdated properties. The most activity is being concen-trated in the northern suburbs of the Metroplex; from North Plano/Frisco up to McKinney and toward Denton along State Highway 380.
Overall, the demand of big box space is limited to groceries and gym/fitness concepts, who either renovate or build-to-suite to meet their needs. The era of big furniture and elec-tronic stores being driving forces in the market has come to an end. There is very little movement by these retail sectors due to the internet and large furniture concepts, such as IKEA and anticipated Nebraska Furniture Mart.
Submarket Address Former Sq. Ft. Available
Far North Dallas 13138 Montfort Drive Macy's 300,300
Far North Dallas 3159 S Garland Road Walmart 226,000
Far North Dallas 811 N Central Expy Dillard's 176,259
North Central Dallas 5000 Alpha Road The Great Indoors 141,690
Far North Dallas 13320 Montfort Drive J.C. Penney 111,657
North Central Dallas 13342 Midway Road Gabbert's Furniture 105,000
Far North Dallas 3161 Broadway Boulevard Steve N Barry's 104,000
Far North Dallas 1122 W Centerville Target 100,000
South East Dallas 2323 Big Town Blvd Big Town Mall 100,000
Central Fort Worth 6001-6009 Jacksboro Highway Barato Bazaar 97,000
West Dallas 3880 Irving Mall Mervyns' 76,000
Central Fort Worth 1200 Green Oaks Mervyns' 75,653
Southwest Dallas 2550 W Red Bird Ln Terry's Market 72,911
Southwest Dallas 7401 S Westmoreland Road Home Depot 71,842
Mid-Cities 2430-2434 S I-35 E Albertson's 67,195
Far North Dallas 3046-3048 Lavon Drive Albertson's 66,817
Central Fort Worth 3304-3328 Denton Highway Kmart 65,733
North Central Dallas 279 Main Street Albertson's 65,207
Mid-Cities 4620 S Cooper Street Sports Authority 65,000
Southeast Dallas Ret 2106 N Galloway Ave Albertson's 61,935
Southwest Dallas 4101 W Wheatland Road Albertson's 58,720
63
37
16
9
7
15
20,000-30,000
30,001-40,000
40,001-50,000
50,001-60,000
60,001-70,000
70,001+
Sq. Ft. Range

© 2014, CBRE, Inc.
Dalla
s/Ft. Worth
Retail | M
arketV
iewQ
3 2
014
5
TEXAS RESEARCH
Lynn Cirillo Research Operations Manager CBRE Americas Research 2800 Post Oak, Suite 2300 Houston, TX 77056 e: [email protected]
Lauren Paris Senior Research Analyst CBRE Dallas Research 2100 McKinney Ave, Suite 700 Dallas, TX 75201 t: +1 214 9796587 e: [email protected]
Brian Ashton Research Coordinator CBRE Dallas Research 2100 McKinney Ave, Suite 700 Dallas, TX 75201 t: +1 214 9796589 e: [email protected]
CONTACTSFor more information about this Dallas/Ft. Worth MarketView, please contact:
FOLLOW CBRE
GLOBAL RESEARCH AND CONSULTING This report was prepared by the CBRE U.S. Research Team which forms part of CBRE Global Research and Consulting – a network of preeminent researchers and consultants who collaborate to provide real estate market research, econometric forecasting and consulting solutions to real estate investors and occupiers around the globe. Additional U.S. research produced by Global Research and Consulting can be found at www.cbre.us/research.
DISCLAIMER
Information contained herein, including projections, has been obtained from sources believed to be reliable. While we do not doubt its accuracy, we
have not verified it and make no guarantee, warranty or representation about it. It is your responsibility to confirm independently its accuracy and
completeness. This information is presented exclusively for use by CBRE clients and professionals and all rights to the material are reserved and cannot be
reproduced without prior written permission of CBRE.
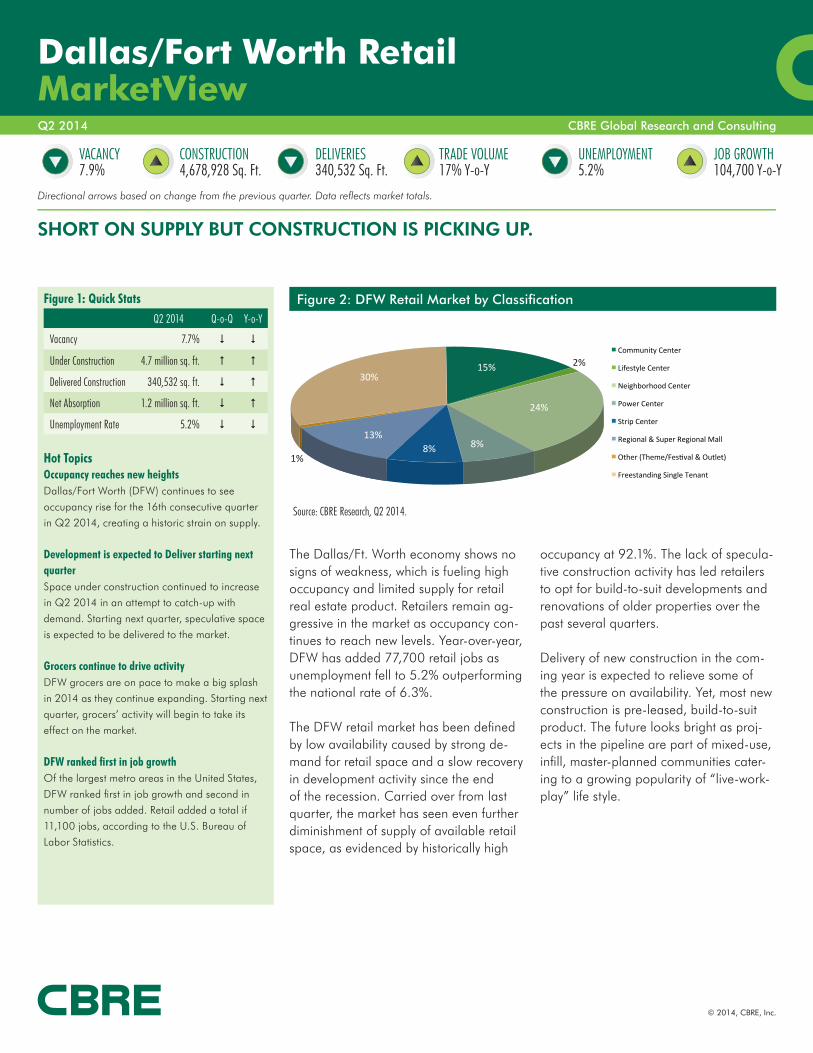
CBRE Global Research and Consulting
Dallas/Fort Worth RetailMarketViewQ2 2014
© 2014, CBRE, Inc.
The Dallas/Ft. Worth economy shows no signs of weakness, which is fueling high occupancy and limited supply for retail real estate product. Retailers remain ag-gressive in the market as occupancy con-tinues to reach new levels. Year-over-year, DFW has added 77,700 retail jobs as unemployment fell to 5.2% outperforming the national rate of 6.3%.
The DFW retail market has been defi ned by low availability caused by strong de-mand for retail space and a slow recovery in development activity since the end of the recession. Carried over from last quarter, the market has seen even further diminishment of supply of available retail space, as evidenced by historically high
Source: CBRE Research, Q2 2014.
Figure 2: DFW Retail Market by Classifi cation
occupancy at 92.1%. The lack of specula-tive construction activity has led retailers to opt for build-to-suit developments and renovations of older properties over the past several quarters.
Delivery of new construction in the com-ing year is expected to relieve some of the pressure on availability. Yet, most new construction is pre-leased, build-to-suit product. The future looks bright as proj-ects in the pipeline are part of mixed-use, infi ll, master-planned communities cater-ing to a growing popularity of “live-work-play” life style.
Figure 1: Quick Stats Q2 2014 Q-o-Q Y-o-Y
Vacancy 7.7% $ $
Under Construction 4.7 million sq. ft. # #
Delivered Construction 340,532 sq. ft. $ #
Net Absorption 1.2 million sq. ft. $ #
Unemployment Rate 5.2% $ $
Hot TopicsOccupancy reaches new heights Dallas/Fort Worth (DFW) continues to see
occupancy rise for the 16th consecutive quarter
in Q2 2014, creating a historic strain on supply.
Development is expected to Deliver starting next quarterSpace under construction continued to increase
in Q2 2014 in an attempt to catch-up with
demand. Starting next quarter, speculative space
is expected to be delivered to the market.
Grocers continue to drive activityDFW grocers are on pace to make a big splash
in 2014 as they continue expanding. Starting next
quarter, grocers’ activity will begin to take its
effect on the market.
DFW ranked fi rst in job growthOf the largest metro areas in the United States,
DFW ranked fi rst in job growth and second in
number of jobs added. Retail added a total if
11,100 jobs, according to the U.S. Bureau of
Labor Statistics.
CONSTRUCTION DELIVERIES
SHORT ON SUPPLY BUT CONSTRUCTION IS PICKING UP.
TRADE VOLUME JOB GROWTHUNEMPLOYMENTVACANCY
Directional arrows based on change from the previous quarter. Data refl ects market totals.
15% 2%
24%
8% 8% 13%
<1%
30%
Community Center
Lifestyle Center
Neighborhood Center
Power Center
Strip Center
Regional & Super Regional Mall
Other (Theme/FesKval & Outlet)
Freestanding Single Tenant
7.9% 4,678,928 Sq. Ft. 340,532 Sq. Ft. 17% Y-o-Y 5.2% 104,700 Y-o-Y
15%
24%
8%8%13%
30%2%
1%
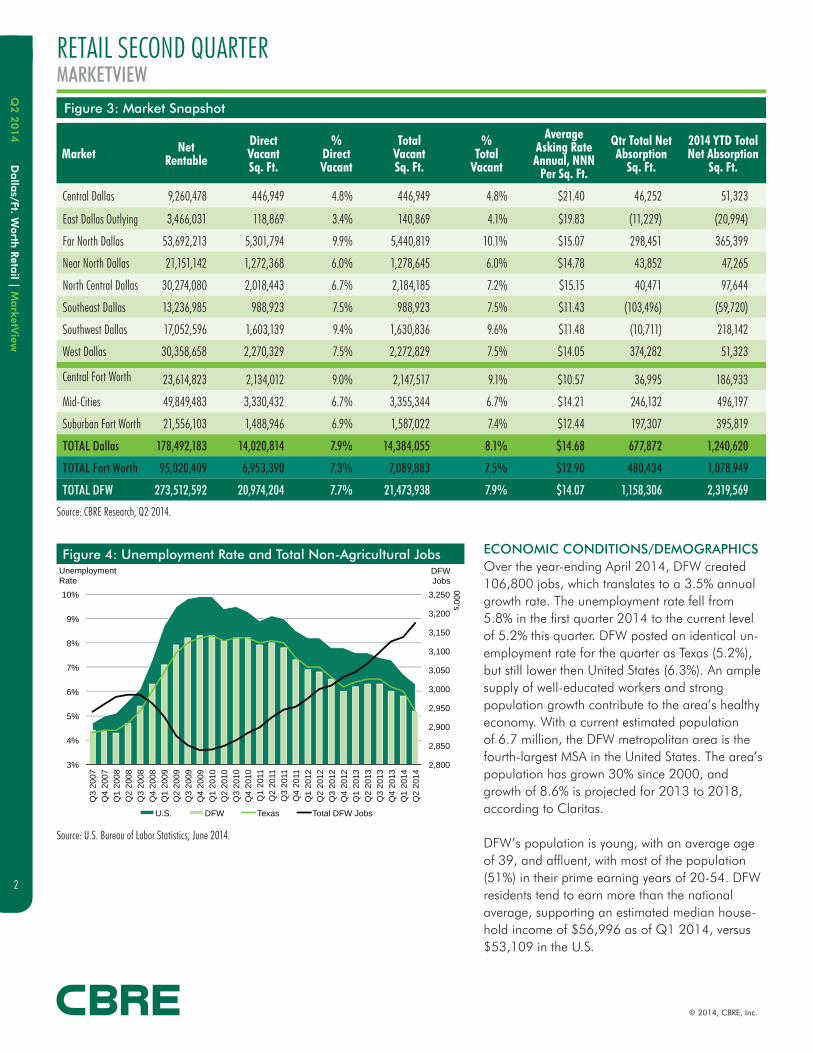
Dalla
s/Ft. Worth
Retail | M
arketV
iewQ
2 2
014
2
© 2014, CBRE, Inc.
Figure 3: Market Snapshot
ECONOMIC CONDITIONS/DEMOGRAPHICSOver the year-ending April 2014, DFW created 106,800 jobs, which translates to a 3.5% annual growth rate. The unemployment rate fell from 5.8% in the fi rst quarter 2014 to the current level of 5.2% this quarter. DFW posted an identical un-employment rate for the quarter as Texas (5.2%), but still lower then United States (6.3%). An ample supply of well-educated workers and strong population growth contribute to the area’s healthy economy. With a current estimated population of 6.7 million, the DFW metropolitan area is the fourth-largest MSA in the United States. The area’s population has grown 30% since 2000, and growth of 8.6% is projected for 2013 to 2018, according to Claritas.
DFW’s population is young, with an average age of 39, and affl uent, with most of the population (51%) in their prime earning years of 20-54. DFW residents tend to earn more than the national average, supporting an estimated median house-hold income of $56,996 as of Q1 2014, versus $53,109 in the U.S.
Market Net Rentable
Direct VacantSq. Ft.
% Direct Vacant
Total VacantSq. Ft.
% Total
Vacant
Average Asking RateAnnual, NNN
Per Sq. Ft.
Qtr Total Net Absorption
Sq. Ft.
2014 YTD Total Net Absorption
Sq. Ft.
Central Dallas 9,260,478 446,949 4.8% 446,949 4.8% $21.40 46,252 51,323
East Dallas Outlying 3,466,031 118,869 3.4% 140,869 4.1% $19.83 (11,229) (20,994)
Far North Dallas 53,692,213 5,301,794 9.9% 5,440,819 10.1% $15.07 298,451 365,399
Near North Dallas 21,151,142 1,272,368 6.0% 1,278,645 6.0% $14.78 43,852 47,265
North Central Dallas 30,274,080 2,018,443 6.7% 2,184,185 7.2% $15.15 40,471 97,644
Southeast Dallas 13,236,985 988,923 7.5% 988,923 7.5% $11.43 (103,496) (59,720)
Southwest Dallas 17,052,596 1,603,139 9.4% 1,630,836 9.6% $11.48 (10,711) 218,142
West Dallas 30,358,658 2,270,329 7.5% 2,272,829 7.5% $14.05 374,282 51,323
Central Fort Worth 23,614,823 2,134,012 9.0% 2,147,517 9.1% $10.57 36,995 186,933
Mid-Cities 49,849,483 3,330,432 6.7% 3,355,344 6.7% $14.21 246,132 496,197
Suburban Fort Worth 21,556,103 1,488,946 6.9% 1,587,022 7.4% $12.44 197,307 395,819
TOTAL Dallas 178,492,183 14,020,814 7.9% 14,384,055 8.1% $14.68 677,872 1,240,620
TOTAL Fort Worth 95,020,409 6,953,390 7.3% 7,089,883 7.5% $12.90 480,434 1,078,949
TOTAL DFW 273,512,592 20,974,204 7.7% 21,473,938 7.9% $14.07 1,158,306 2,319,569
Figure 4: Unemployment Rate and Total Non-Agricultural Jobs
Source: CBRE Research, Q2 2014.
Source: U.S. Bureau of Labor Statistics, June 2014.
2,800
2,850
2,900
2,950
3,000
3,050
3,100
3,150
3,200
3,250
3%
4%
5%
6%
7%
8%
9%
10%
Q3
2007
Q4
2007
Q1
2008
Q2
2008
Q3
2008
Q4
2008
Q1
2009
Q2
2009
Q3
2009
Q4
2009
Q1
2010
Q2
2010
Q3
2010
Q4
2010
Q1
2011
Q2
2011
Q3
2011
Q4
2011
Q1
2012
Q2
2012
Q3
2012
Q4
2012
Q1
2013
Q2
2013
Q3
2013
Q4
2013
Q1
2014
Q2
2014
DFW Jobs
000's
Unemployment Rate
U.S. DFW Texas Total DFW Jobs
RETAIL SECOND QUARTERMARKETVIEW
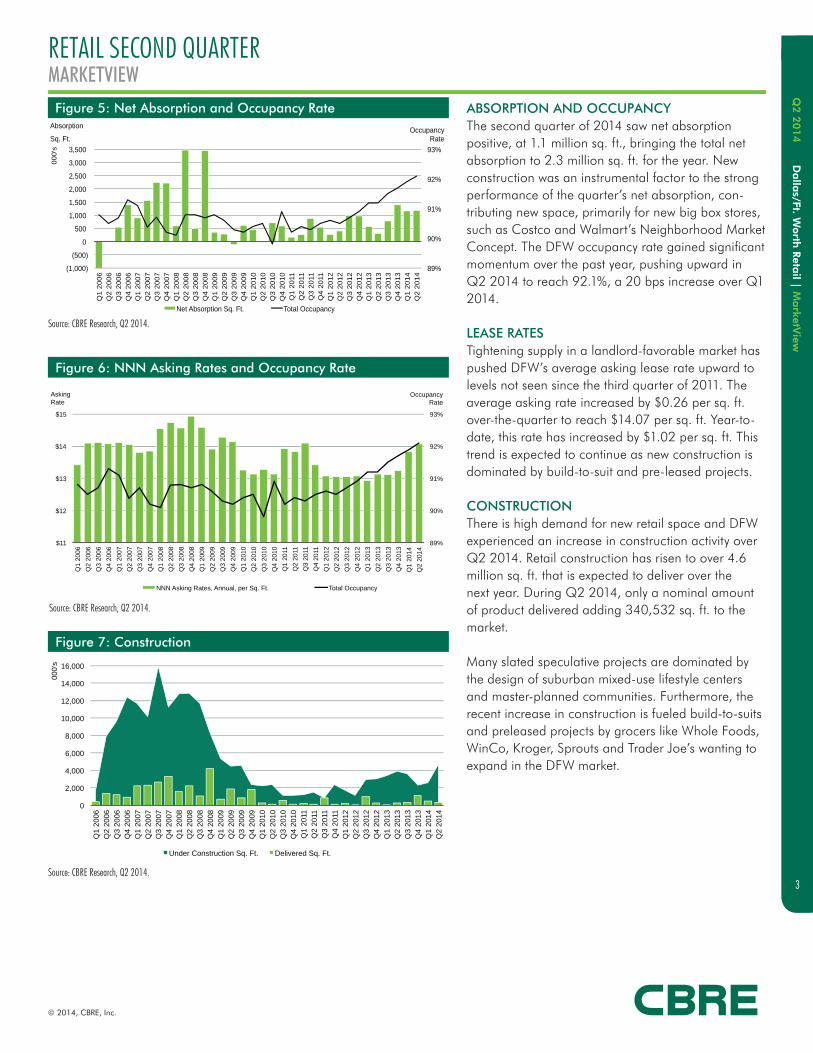
© 2014, CBRE, Inc.
Dalla
s/Ft. Worth
Retail | M
arketV
iewQ
2 2
014
3
RETAIL SECOND QUARTERMARKETVIEW
ABSORPTION AND OCCUPANCYThe second quarter of 2014 saw net absorption positive, at 1.1 million sq. ft., bringing the total net absorption to 2.3 million sq. ft. for the year. New construction was an instrumental factor to the strong performance of the quarter’s net absorption, con-tributing new space, primarily for new big box stores, such as Costco and Walmart’s Neighborhood Market Concept. The DFW occupancy rate gained signifi cant momentum over the past year, pushing upward in Q2 2014 to reach 92.1%, a 20 bps increase over Q1 2014.
LEASE RATES Tightening supply in a landlord-favorable market has pushed DFW’s average asking lease rate upward to levels not seen since the third quarter of 2011. The average asking rate increased by $0.26 per sq. ft. over-the-quarter to reach $14.07 per sq. ft. Year-to-date, this rate has increased by $1.02 per sq. ft. This trend is expected to continue as new construction is dominated by build-to-suit and pre-leased projects.
CONSTRUCTIONThere is high demand for new retail space and DFW experienced an increase in construction activity over Q2 2014. Retail construction has risen to over 4.6 million sq. ft. that is expected to deliver over the next year. During Q2 2014, only a nominal amount of product delivered adding 340,532 sq. ft. to the market.
Many slated speculative projects are dominated by the design of suburban mixed-use lifestyle centers and master-planned communities. Furthermore, the recent increase in construction is fueled build-to-suits and preleased projects by grocers like Whole Foods, WinCo, Kroger, Sprouts and Trader Joe’s wanting to expand in the DFW market.
Figure 6: NNN Asking Rates and Occupancy Rate
Figure 7: Construction
Source: CBRE Research, Q2 2014.
Source: CBRE Research, Q2 2014.
Source: CBRE Research, Q2 2014.
89%
90%
91%
92%
93%
(1,000)
(500)
0
500
1,000
1,500
2,000
2,500
3,000
3,500
Q1
20
06
Q
2 2
00
6
Q3
20
06
Q
4 2
00
6
Q1
20
07
Q
2 2
00
7
Q3
20
07
Q
4 2
00
7
Q1
20
08
Q
2 2
00
8
Q3
20
08
Q
4 2
00
8
Q1
20
09
Q
2 2
00
9
Q3
20
09
Q
4 2
00
9
Q1
20
10
Q
2 2
01
0
Q3
20
10
Q
4 2
01
0
Q1
20
11
Q2
20
11
Q3
20
11
Q4
20
11
Q1
20
12
Q
2 2
01
2
Q3
20
12
Q
4 2
01
2
Q1
20
13
Q
2 2
01
3
Q3
20
13
Q
4 2
01
3
Q1
20
14
Q
2 2
01
4
Occupancy Rate
Figure 5: Net Absorption and Occupancy Rate Absorption
Sq. Ft.
00
0's
Net Absorption Sq. Ft. Total Occupancy
89%
90%
91%
92%
93%
$11
$12
$13
$14
$15
Q1
2006
Q2
2006
Q3
2006
Q4
2006
Q1
2007
Q2
2007
Q3
2007
Q4
2007
Q1
2008
Q2
2008
Q3
2008
Q4
2008
Q1
2009
Q2
2009
Q3
2009
Q4
2009
Q1
2010
Q2
2010
Q3
2010
Q4
2010
Q1
2011
Q2
2011
Q3
2011
Q4
2011
Q1
2012
Q2
2012
Q3
2012
Q4
2012
Q1
2013
Q2
2013
Q3
2013
Q4
2013
Q1
2014
Q2
2014
Occupancy Rate
Asking Rate
NNN Asking Rates, Annual, per Sq. Ft. Total Occupancy
0
2,000
4,000
6,000
8,000
10,000
12,000
14,000
16,000
Q1 2
006
Q2 2
006
Q3 2
006
Q4 2
006
Q1 2
007
Q2 2
007
Q3 2
007
Q4 2
007
Q1 2
008
Q2 2
008
Q3 2
008
Q4 2
008
Q1 2
009
Q2 2
009
Q3 2
009
Q4 2
009
Q1 2
010
Q2 2
010
Q3 2
010
Q4 2
010
Q1 2
011
Q
2 2
011
Q
3 2
011
Q
4 2
011
Q
1 2
012
Q2 2
012
Q3 2
012
Q4 2
012
Q1 2
013
Q2 2
013
Q3 2
013
Q4 2
013
Q1 2
014
Q2 2
014
000's
Under Construction Sq. Ft. Delivered Sq. Ft.
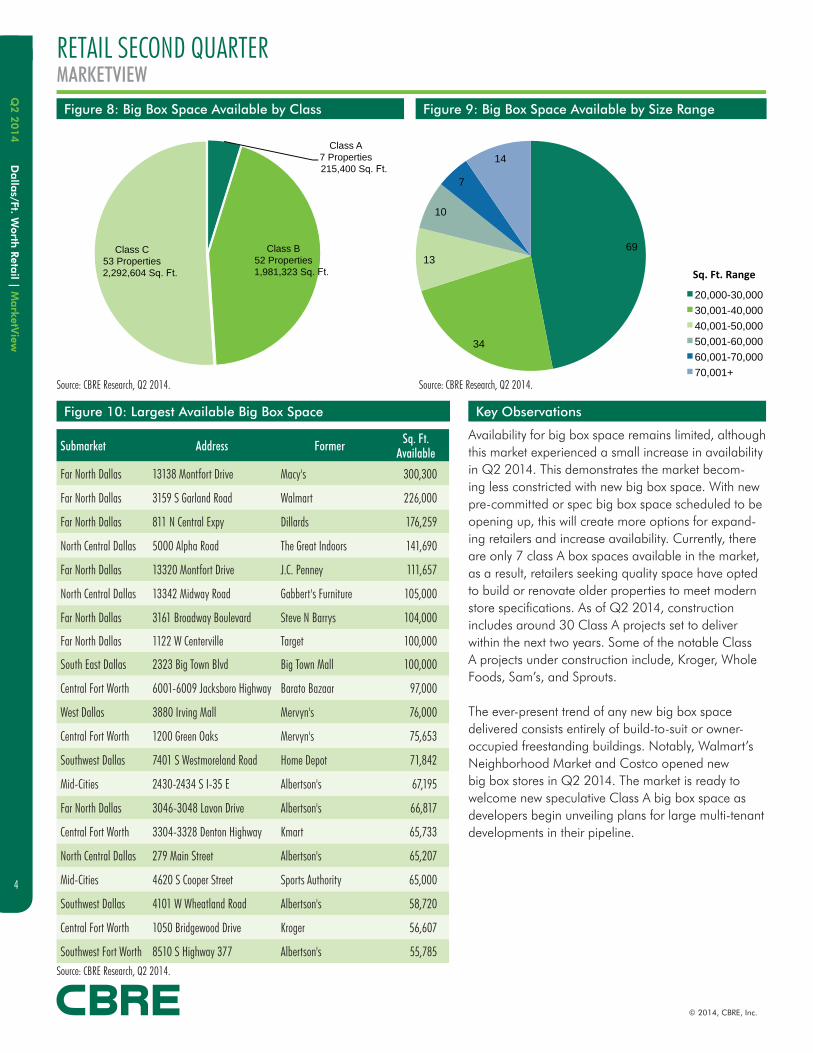
Dalla
s/Ft. Worth
Retail | M
arketV
iewQ
2 2
014
4
© 2014, CBRE, Inc.
Class A 7 Properties 215,400 Sq. Ft.
Class B 52 Properties 1,981,323 Sq. Ft.
Class C 53 Properties 2,292,604 Sq. Ft.
RETAIL SECOND QUARTERMARKETVIEW
Source: CBRE Research, Q2 2014.
Source: CBRE Research, Q2 2014. Source: CBRE Research, Q2 2014.
Figure 8: Big Box Space Available by Class Figure 9: Big Box Space Available by Size Range
Key ObservationsFigure 10: Largest Available Big Box Space
Availability for big box space remains limited, although this market experienced a small increase in availability in Q2 2014. This demonstrates the market becom-ing less constricted with new big box space. With new pre-committed or spec big box space scheduled to be opening up, this will create more options for expand-ing retailers and increase availability. Currently, there are only 7 class A box spaces available in the market, as a result, retailers seeking quality space have opted to build or renovate older properties to meet modern store specifi cations. As of Q2 2014, construction includes around 30 Class A projects set to deliver within the next two years. Some of the notable Class A projects under construction include, Kroger, Whole Foods, Sam’s, and Sprouts.
The ever-present trend of any new big box space delivered consists entirely of build-to-suit or owner-occupied freestanding buildings. Notably, Walmart’s Neighborhood Market and Costco opened new big box stores in Q2 2014. The market is ready to welcome new speculative Class A big box space as developers begin unveiling plans for large multi-tenant developments in their pipeline.
Submarket Address Former Sq. Ft. Available
Far North Dallas 13138 Montfort Drive Macy's 300,300
Far North Dallas 3159 S Garland Road Walmart 226,000
Far North Dallas 811 N Central Expy Dillards 176,259
North Central Dallas 5000 Alpha Road The Great Indoors 141,690
Far North Dallas 13320 Montfort Drive J.C. Penney 111,657
North Central Dallas 13342 Midway Road Gabbert's Furniture 105,000
Far North Dallas 3161 Broadway Boulevard Steve N Barrys 104,000
Far North Dallas 1122 W Centerville Target 100,000
South East Dallas 2323 Big Town Blvd Big Town Mall 100,000
Central Fort Worth 6001-6009 Jacksboro Highway Barato Bazaar 97,000
West Dallas 3880 Irving Mall Mervyn's 76,000
Central Fort Worth 1200 Green Oaks Mervyn's 75,653
Southwest Dallas 7401 S Westmoreland Road Home Depot 71,842
Mid-Cities 2430-2434 S I-35 E Albertson's 67,195
Far North Dallas 3046-3048 Lavon Drive Albertson's 66,817
Central Fort Worth 3304-3328 Denton Highway Kmart 65,733
North Central Dallas 279 Main Street Albertson's 65,207
Mid-Cities 4620 S Cooper Street Sports Authority 65,000
Southwest Dallas 4101 W Wheatland Road Albertson's 58,720
Central Fort Worth 1050 Bridgewood Drive Kroger 56,607
Southwest Fort Worth 8510 S Highway 377 Albertson's 55,785
69
34
13
10
7
14
20,000-30,000
30,001-40,000
40,001-50,000
50,001-60,000
60,001-70,000
70,001+
Sq. Ft. Range
© 2014, CBRE, Inc.
Dalla
s/Ft. Worth
Retail | M
arketV
iewQ
2 2
014
5
TEXAS RESEARCH
Lynn CirilloResearch Operations ManagerCBRE Americas Research2800 Post Oak, Suite 2300Houston, TX 77056 e: [email protected]
Lauren ParisSenior Research AnalystCBRE Dallas Research2100 McKinney Ave, Suite 700Dallas, TX 75201t: +1 214 9796587e: [email protected]
Brian AshtonResearch CoordinatorCBRE Dallas Research2100 McKinney Ave, Suite 700Dallas, TX 75201t: +1 214 9796589e: [email protected]
CONTACTSFor more information about this Dallas/Ft. Worth MarketView, please contact:
FOLLOW CBRE
GLOBAL RESEARCH AND CONSULTINGThis report was prepared by the CBRE U.S. Research Team which forms part of CBRE Global Research and Consulting – a network of preeminent researchers and consultants who collaborate to provide real estate market research, econometric forecasting and consulting solutions to real estate investors and occupiers around the globe.
Additional U.S. research produced by Global Research and Consulting can be found at www.cbre.us/research.
DISCLAIMER
Information contained herein, including projections, has been obtained from sources believed to be reliable. While we do not doubt its accuracy, we
have not verifi ed it and make no guarantee, warranty or representation about it. It is your responsibility to confi rm independently its accuracy and
completeness. This information is presented exclusively for use by CBRE clients and professionals and all rights to the material are reserved and cannot be
reproduced without prior written permission of CBRE.
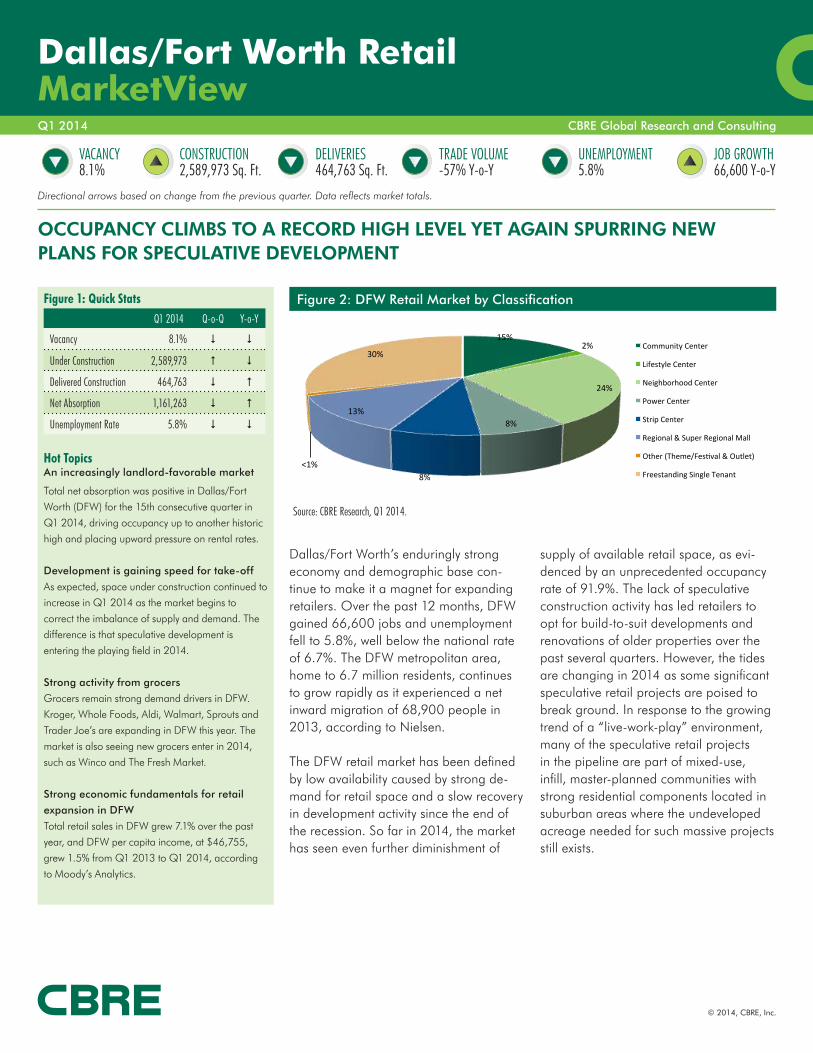
CBRE Global Research and Consulting
Dallas/Fort Worth RetailMarketView Q1 2014
© 2014, CBRE, Inc.
Dallas/Fort Worth’s enduringly strong economy and demographic base con-tinue to make it a magnet for expanding retailers. Over the past 12 months, DFW gained 66,600 jobs and unemployment fell to 5.8%, well below the national rate of 6.7%. The DFW metropolitan area, home to 6.7 million residents, continues to grow rapidly as it experienced a net inward migration of 68,900 people in 2013, according to Nielsen.
The DFW retail market has been defined by low availability caused by strong de-mand for retail space and a slow recovery in development activity since the end of the recession. So far in 2014, the market has seen even further diminishment of
Source: CBRE Research, Q1 2014.
Figure 2: DFW Retail Market by Classification
supply of available retail space, as evi-denced by an unprecedented occupancy rate of 91.9%. The lack of speculative construction activity has led retailers to opt for build-to-suit developments and renovations of older properties over the past several quarters. However, the tides are changing in 2014 as some significant speculative retail projects are poised to break ground. In response to the growing trend of a “live-work-play” environment, many of the speculative retail projects in the pipeline are part of mixed-use, infill, master-planned communities with strong residential components located in suburban areas where the undeveloped acreage needed for such massive projects still exists.
Figure 1: Quick Stats Q1 2014 Q-o-Q Y-o-Y
Vacancy 8.1%
Under Construction 2,589,973
Delivered Construction 464,763
Net Absorption 1,161,263
Unemployment Rate 5.8%
Hot TopicsAn increasingly landlord-favorable market
Total net absorption was positive in Dallas/Fort
Worth (DFW) for the 15th consecutive quarter in
Q1 2014, driving occupancy up to another historic
high and placing upward pressure on rental rates.
Development is gaining speed for take-off
As expected, space under construction continued to
increase in Q1 2014 as the market begins to
correct the imbalance of supply and demand. The
difference is that speculative development is
entering the playing field in 2014.
Strong activity from grocers
Grocers remain strong demand drivers in DFW.
Kroger, Whole Foods, Aldi, Walmart, Sprouts and
Trader Joe’s are expanding in DFW this year. The
market is also seeing new grocers enter in 2014,
such as Winco and The Fresh Market.
Strong economic fundamentals for retail
expansion in DFW
Total retail sales in DFW grew 7.1% over the past
year, and DFW per capita income, at $46,755,
grew 1.5% from Q1 2013 to Q1 2014, according
to Moody’s Analytics.
CONSTRUCTION2,589,973 Sq. Ft.
DELIVERIES464,763 Sq. Ft.
OCCUPANCY CLIMBS TO A RECORD HIGH LEVEL YET AGAIN SPURRING NEW PLANS FOR SPECULATIVE DEVELOPMENT
TRADE VOLUME-57% Y-o-Y
JOB GROWTH66,600 Y-o-Y
UNEMPLOYMENT5.8%
VACANCY8.1%
Directional arrows based on change from the previous quarter. Data reflects market totals.
15% 2%
24%
8%
8%
13%
<1%
30% Community Center
Lifestyle Center
Neighborhood Center
Power Center
Strip Center
Regional & Super Regional Mall
Other (Theme/FesKval & Outlet)
Freestanding Single Tenant
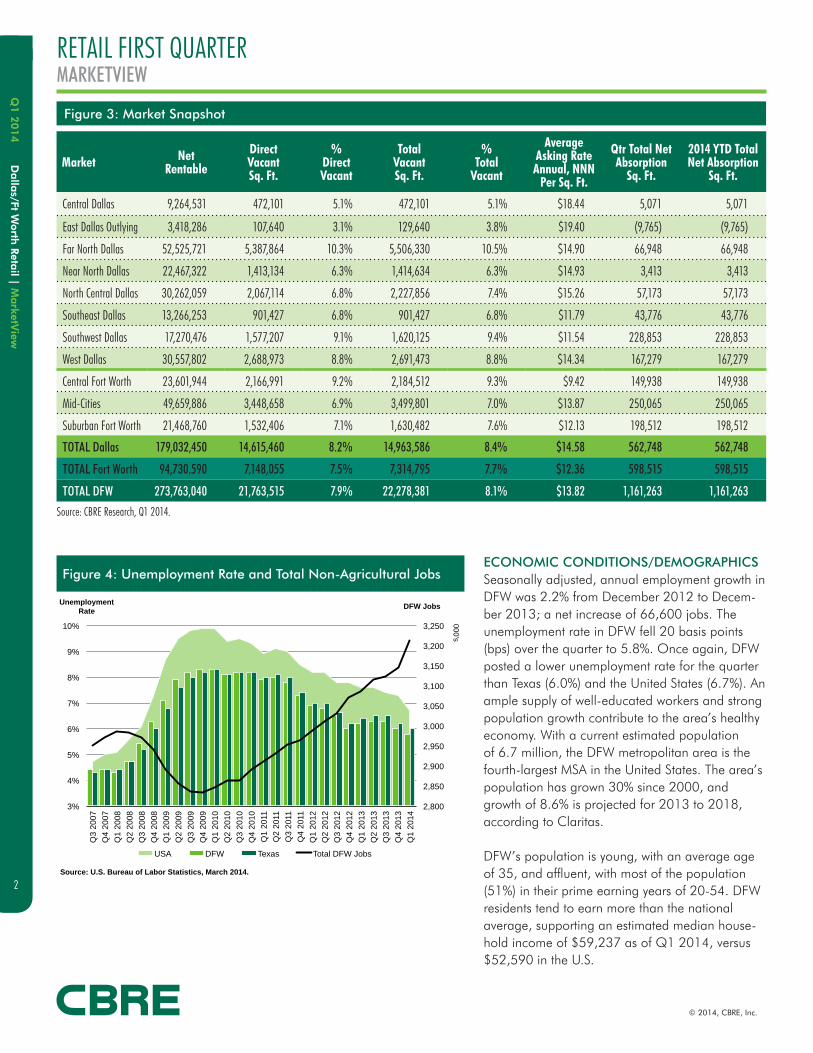
Dalla
s/Ft Worth
Retail | M
arketV
iewQ
1 2
014
2
© 2014, CBRE, Inc.
Figure 3: Market Snapshot
ECONOMIC CONDITIONS/DEMOGRAPHICSSeasonally adjusted, annual employment growth in DFW was 2.2% from December 2012 to Decem-ber 2013; a net increase of 66,600 jobs. The unemployment rate in DFW fell 20 basis points (bps) over the quarter to 5.8%. Once again, DFW posted a lower unemployment rate for the quarter than Texas (6.0%) and the United States (6.7%). An ample supply of well-educated workers and strong population growth contribute to the area’s healthy economy. With a current estimated population of 6.7 million, the DFW metropolitan area is the fourth-largest MSA in the United States. The area’s population has grown 30% since 2000, and growth of 8.6% is projected for 2013 to 2018, according to Claritas.
DFW’s population is young, with an average age of 35, and affluent, with most of the population (51%) in their prime earning years of 20-54. DFW residents tend to earn more than the national average, supporting an estimated median house-hold income of $59,237 as of Q1 2014, versus $52,590 in the U.S.
Market Net Rentable
Direct Vacant Sq. Ft.
% Direct Vacant
Total Vacant Sq. Ft.
% Total
Vacant
Average Asking Rate Annual, NNN
Per Sq. Ft.
Qtr Total Net Absorption
Sq. Ft.
2014 YTD Total Net Absorption
Sq. Ft.
Central Dallas 9,264,531 472,101 5.1% 472,101 5.1% $18.44 5,071 5,071
East Dallas Outlying 3,418,286 107,640 3.1% 129,640 3.8% $19.40 (9,765) (9,765)
Far North Dallas 52,525,721 5,387,864 10.3% 5,506,330 10.5% $14.90 66,948 66,948
Near North Dallas 22,467,322 1,413,134 6.3% 1,414,634 6.3% $14.93 3,413 3,413
North Central Dallas 30,262,059 2,067,114 6.8% 2,227,856 7.4% $15.26 57,173 57,173
Southeast Dallas 13,266,253 901,427 6.8% 901,427 6.8% $11.79 43,776 43,776
Southwest Dallas 17,270,476 1,577,207 9.1% 1,620,125 9.4% $11.54 228,853 228,853
West Dallas 30,557,802 2,688,973 8.8% 2,691,473 8.8% $14.34 167,279 167,279
Central Fort Worth 23,601,944 2,166,991 9.2% 2,184,512 9.3% $9.42 149,938 149,938
Mid-Cities 49,659,886 3,448,658 6.9% 3,499,801 7.0% $13.87 250,065 250,065
Suburban Fort Worth 21,468,760 1,532,406 7.1% 1,630,482 7.6% $12.13 198,512 198,512
TOTAL Dallas 179,032,450 14,615,460 8.2% 14,963,586 8.4% $14.58 562,748 562,748
TOTAL Fort Worth 94,730,590 7,148,055 7.5% 7,314,795 7.7% $12.36 598,515 598,515
TOTAL DFW 273,763,040 21,763,515 7.9% 22,278,381 8.1% $13.82 1,161,263 1,161,263
Figure 4: Unemployment Rate and Total Non-Agricultural Jobs
Source: CBRE Research, Q1 2014.
2,800
2,850
2,900
2,950
3,000
3,050
3,100
3,150
3,200
3,250
3%
4%
5%
6%
7%
8%
9%
10%
Q3
2007
Q4
2007
Q1
2008
Q2
2008
Q3
2008
Q4
2008
Q1
2009
Q2
2009
Q3
2009
Q4
2009
Q1
2010
Q2
2010
Q3
2010
Q4
2010
Q1
2011
Q2
2011
Q3
2011
Q4
2011
Q1
2012
Q2
2012
Q3
2012
Q4
2012
Q1
2013
Q2
2013
Q3
2013
Q4
2013
Q1
2014
DFW Jobs
000's
Unemployment Rate
Source: U.S. Bureau of Labor Statistics, March 2014.
USA DFW Texas Total DFW Jobs
RETAIL FIRST QUARTERMARKETVIEW
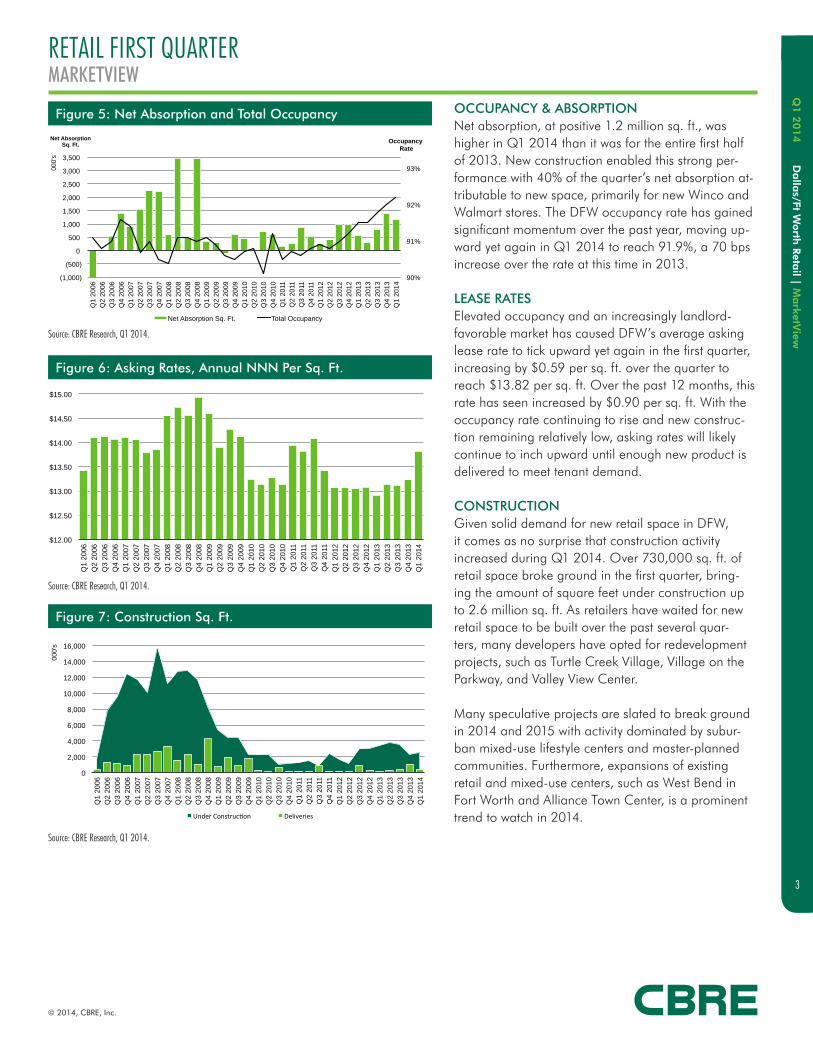
© 2014, CBRE, Inc.
Dalla
s/Ft Worth
Retail | M
arketV
iewQ
1 2
014
3
RETAIL FIRST QUARTERMARKETVIEW
OCCUPANCY & ABSORPTION Net absorption, at positive 1.2 million sq. ft., was higher in Q1 2014 than it was for the entire first half of 2013. New construction enabled this strong per-formance with 40% of the quarter’s net absorption at-tributable to new space, primarily for new Winco and Walmart stores. The DFW occupancy rate has gained significant momentum over the past year, moving up-ward yet again in Q1 2014 to reach 91.9%, a 70 bps increase over the rate at this time in 2013.
LEASE RATES Elevated occupancy and an increasingly landlord-favorable market has caused DFW’s average asking lease rate to tick upward yet again in the first quarter, increasing by $0.59 per sq. ft. over the quarter to reach $13.82 per sq. ft. Over the past 12 months, this rate has seen increased by $0.90 per sq. ft. With the occupancy rate continuing to rise and new construc-tion remaining relatively low, asking rates will likely continue to inch upward until enough new product is delivered to meet tenant demand.
CONSTRUCTIONGiven solid demand for new retail space in DFW, it comes as no surprise that construction activity increased during Q1 2014. Over 730,000 sq. ft. of retail space broke ground in the first quarter, bring-ing the amount of square feet under construction up to 2.6 million sq. ft. As retailers have waited for new retail space to be built over the past several quar-ters, many developers have opted for redevelopment projects, such as Turtle Creek Village, Village on the Parkway, and Valley View Center.
Many speculative projects are slated to break ground in 2014 and 2015 with activity dominated by subur-ban mixed-use lifestyle centers and master-planned communities. Furthermore, expansions of existing retail and mixed-use centers, such as West Bend in Fort Worth and Alliance Town Center, is a prominent trend to watch in 2014.
Figure 5: Net Absorption and Total Occupancy
Figure 6: Asking Rates, Annual NNN Per Sq. Ft.
Figure 7: Construction Sq. Ft.
Source: CBRE Research, Q1 2014.
Source: CBRE Research, Q1 2014.
Source: CBRE Research, Q1 2014.
90%
91%
92%
93%
(1,000)
(500)
0
500
1,000
1,500
2,000
2,500
3,000
3,500
Q1
2006
Q
2 20
06
Q3
2006
Q
4 20
06
Q1
2007
Q
2 20
07
Q3
2007
Q
4 20
07
Q1
2008
Q
2 20
08
Q3
2008
Q
4 20
08
Q1
2009
Q
2 20
09
Q3
2009
Q
4 20
09
Q1
2010
Q
2 20
10
Q3
2010
Q
4 20
10
Q1
2011
Q
2 20
11
Q3
2011
Q
4 20
11
Q1
2012
Q
2 20
12
Q3
2012
Q
4 20
12
Q1
2013
Q
2 20
13
Q3
2013
Q
4 20
13
Q1
2014
Occupancy Rate
Net Absorption Sq. Ft.
000'
s
Net Absorption Sq. Ft. Total Occupancy
$12.00
$12.50
$13.00
$13.50
$14.00
$14.50
$15.00
Q1
2006
Q2
2006
Q3
2006
Q4
2006
Q1
2007
Q2
2007
Q3
2007
Q4
2007
Q1
2008
Q2
2008
Q3
2008
Q4
2008
Q1
2009
Q2
2009
Q3
2009
Q4
2009
Q1
2010
Q2
2010
Q3
2010
Q4
2010
Q1
2011
Q2
2011
Q3
2011
Q4
2011
Q1
2012
Q2
2012
Q3
2012
Q4
2012
Q1
2013
Q2
2013
Q3
2013
Q4
2013
Q1
2014
0
2,000
4,000
6,000
8,000
10,000
12,000
14,000
16,000
Q1
2006
Q
2 20
06
Q3
2006
Q
4 20
06
Q1
2007
Q
2 20
07
Q3
2007
Q
4 20
07
Q1
2008
Q
2 20
08
Q3
2008
Q
4 20
08
Q1
2009
Q
2 20
09
Q3
2009
Q
4 20
09
Q1
2010
Q
2 20
10
Q3
2010
Q
4 20
10
Q1
2011
Q
2 20
11
Q3
2011
Q
4 20
11
Q1
2012
Q
2 20
12
Q3
2012
Q
4 20
12
Q1
2013
Q
2 20
13
Q3
2013
Q
4 20
13
Q1
2014
000'
s
Under Construc-on Deliveries
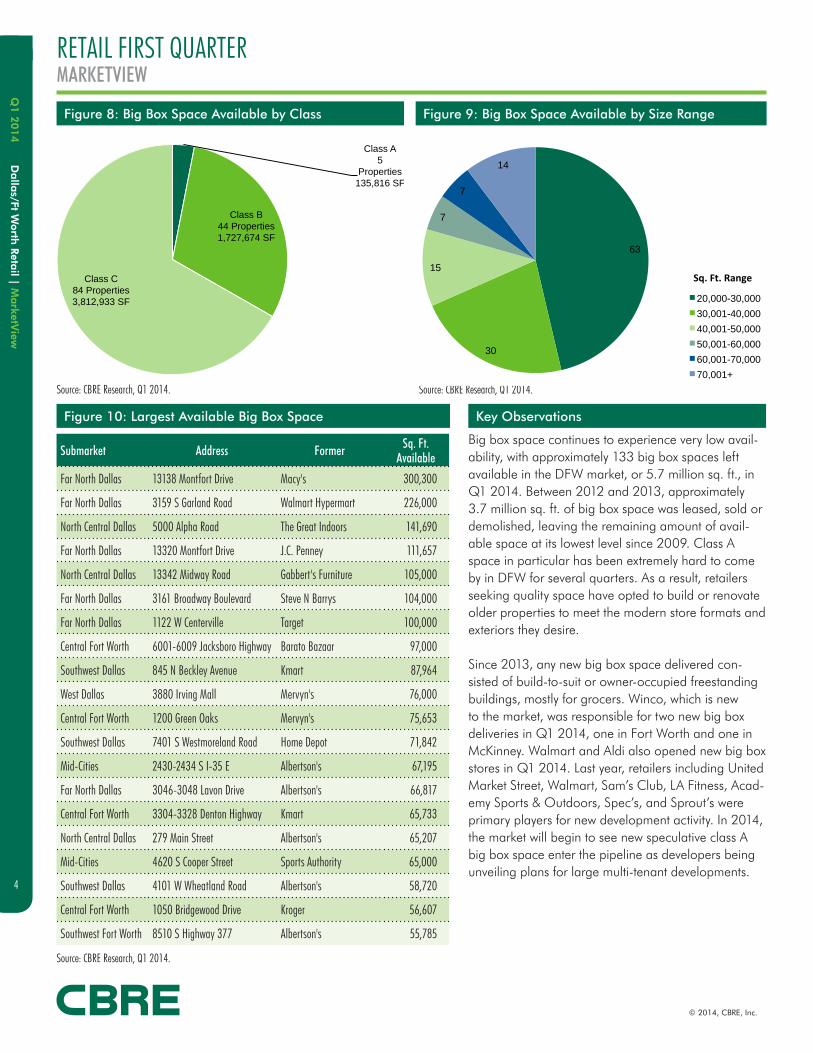
Dalla
s/Ft Worth
Retail | M
arketV
iewQ
1 2
014
4
© 2014, CBRE, Inc.
Class A 5
Properties 135,816 SF
Class B 44 Properties 1,727,674 SF
Class C 84 Properties 3,812,933 SF
RETAIL FIRST QUARTERMARKETVIEW
Source: CBRE Research, Q1 2014.
Source: CBRE Research, Q1 2014. Source: CBRE Research, Q1 2014.
Figure 8: Big Box Space Available by Class Figure 9: Big Box Space Available by Size Range
Key ObservationsFigure 10: Largest Available Big Box Space
Big box space continues to experience very low avail-ability, with approximately 133 big box spaces left available in the DFW market, or 5.7 million sq. ft., in Q1 2014. Between 2012 and 2013, approximately 3.7 million sq. ft. of big box space was leased, sold or demolished, leaving the remaining amount of avail-able space at its lowest level since 2009. Class A space in particular has been extremely hard to come by in DFW for several quarters. As a result, retailers seeking quality space have opted to build or renovate older properties to meet the modern store formats and exteriors they desire.
Since 2013, any new big box space delivered con-sisted of build-to-suit or owner-occupied freestanding buildings, mostly for grocers. Winco, which is new to the market, was responsible for two new big box deliveries in Q1 2014, one in Fort Worth and one in McKinney. Walmart and Aldi also opened new big box stores in Q1 2014. Last year, retailers including United Market Street, Walmart, Sam’s Club, LA Fitness, Acad-emy Sports & Outdoors, Spec’s, and Sprout’s were primary players for new development activity. In 2014, the market will begin to see new speculative class A big box space enter the pipeline as developers being unveiling plans for large multi-tenant developments.
Submarket Address Former Sq. Ft. Available
Far North Dallas 13138 Montfort Drive Macy's 300,300
Far North Dallas 3159 S Garland Road Walmart Hypermart 226,000
North Central Dallas 5000 Alpha Road The Great Indoors 141,690
Far North Dallas 13320 Montfort Drive J.C. Penney 111,657
North Central Dallas 13342 Midway Road Gabbert's Furniture 105,000
Far North Dallas 3161 Broadway Boulevard Steve N Barrys 104,000
Far North Dallas 1122 W Centerville Target 100,000
Central Fort Worth 6001-6009 Jacksboro Highway Barato Bazaar 97,000
Southwest Dallas 845 N Beckley Avenue Kmart 87,964
West Dallas 3880 Irving Mall Mervyn's 76,000
Central Fort Worth 1200 Green Oaks Mervyn's 75,653
Southwest Dallas 7401 S Westmoreland Road Home Depot 71,842
Mid-Cities 2430-2434 S I-35 E Albertson's 67,195
Far North Dallas 3046-3048 Lavon Drive Albertson's 66,817
Central Fort Worth 3304-3328 Denton Highway Kmart 65,733
North Central Dallas 279 Main Street Albertson's 65,207
Mid-Cities 4620 S Cooper Street Sports Authority 65,000
Southwest Dallas 4101 W Wheatland Road Albertson's 58,720
Central Fort Worth 1050 Bridgewood Drive Kroger 56,607
Southwest Fort Worth 8510 S Highway 377 Albertson's 55,785
63
30
15
7
7
14
20,000-30,000
30,001-40,000
40,001-50,000
50,001-60,000
60,001-70,000
70,001+
Sq. Ft. Range
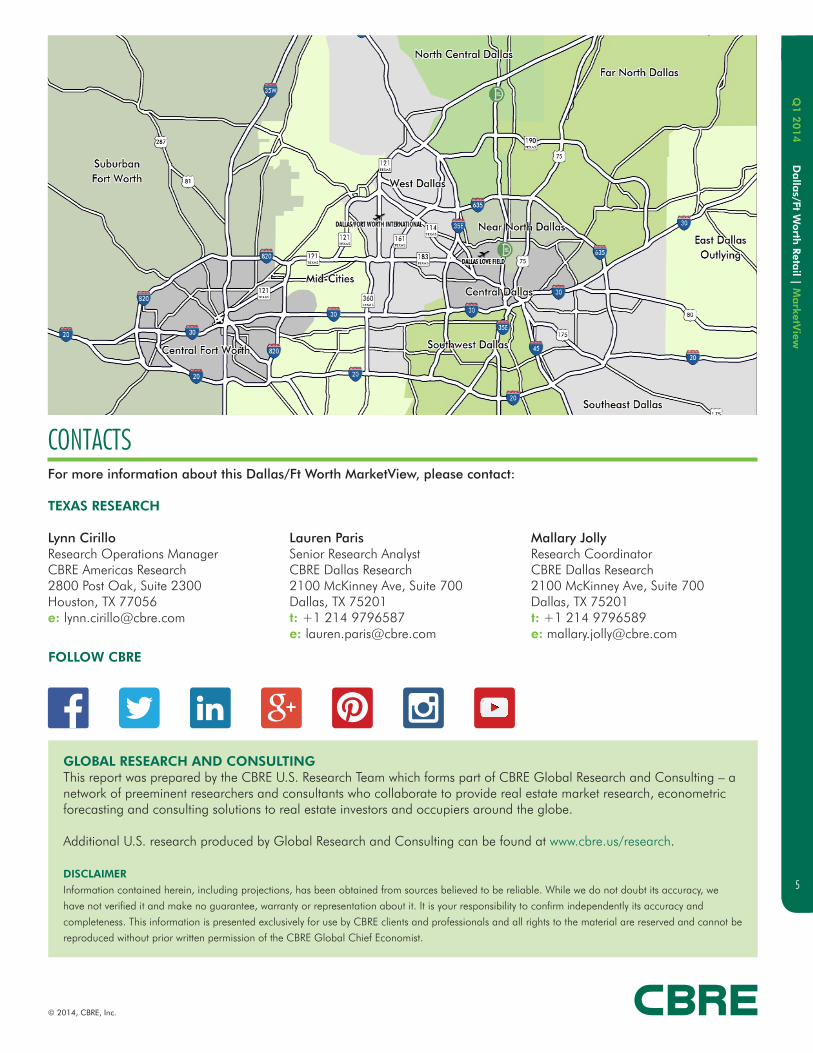
© 2014, CBRE, Inc.
Dalla
s/Ft Worth
Retail | M
arketV
iewQ
1 2
014
5
TEXAS RESEARCH
Lynn Cirillo Research Operations Manager CBRE Americas Research 2800 Post Oak, Suite 2300 Houston, TX 77056 e: [email protected]
Lauren Paris Senior Research Analyst CBRE Dallas Research 2100 McKinney Ave, Suite 700 Dallas, TX 75201 t: +1 214 9796587 e: [email protected]
Mallary Jolly Research Coordinator CBRE Dallas Research 2100 McKinney Ave, Suite 700 Dallas, TX 75201 t: +1 214 9796589 e: [email protected]
CONTACTSFor more information about this Dallas/Ft Worth MarketView, please contact:
FOLLOW CBRE
GLOBAL RESEARCH AND CONSULTING This report was prepared by the CBRE U.S. Research Team which forms part of CBRE Global Research and Consulting – a network of preeminent researchers and consultants who collaborate to provide real estate market research, econometric forecasting and consulting solutions to real estate investors and occupiers around the globe. Additional U.S. research produced by Global Research and Consulting can be found at www.cbre.us/research.
DISCLAIMER
Information contained herein, including projections, has been obtained from sources believed to be reliable. While we do not doubt its accuracy, we
have not verified it and make no guarantee, warranty or representation about it. It is your responsibility to confirm independently its accuracy and
completeness. This information is presented exclusively for use by CBRE clients and professionals and all rights to the material are reserved and cannot be
reproduced without prior written permission of the CBRE Global Chief Economist.
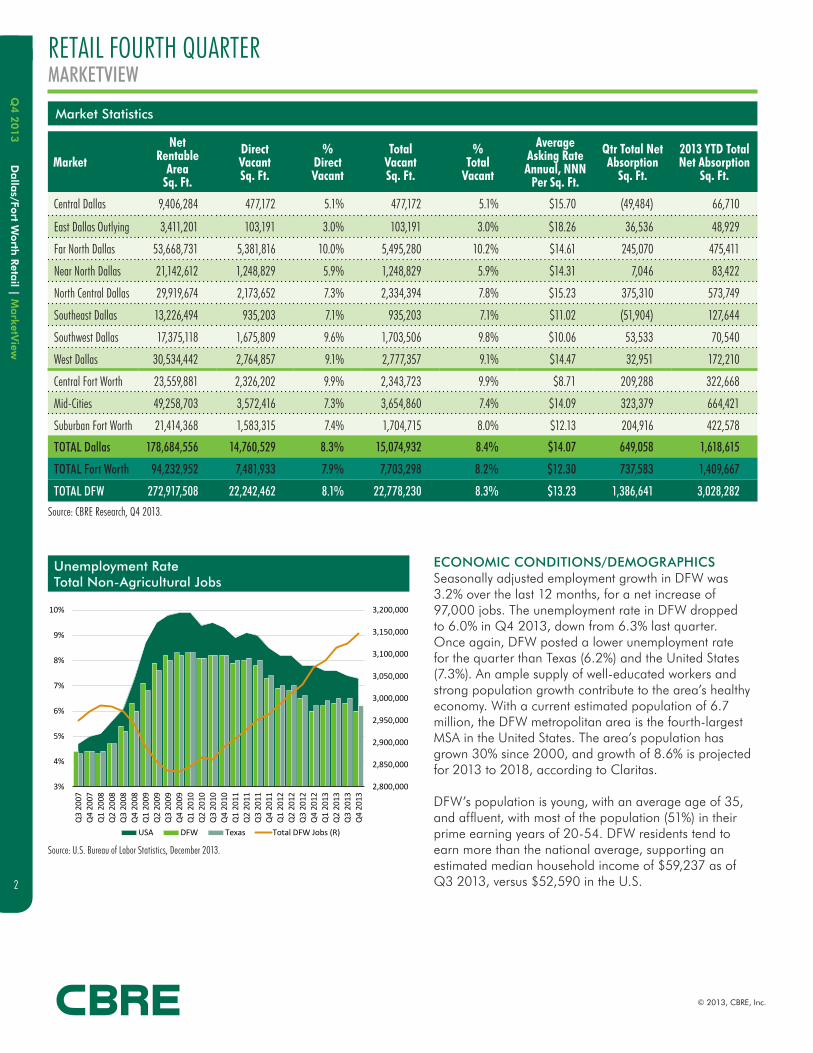
Dalla
s/Fort W
orth
Retail | M
arketV
iewQ
4 2
013
2
Market Statistics
ECONOMIC CONDITIONS/DEMOGRAPHICSSeasonally adjusted employment growth in DFW was 3.2% over the last 12 months, for a net increase of 97,000 jobs. The unemployment rate in DFW dropped to 6.0% in Q4 2013, down from 6.3% last quarter. Once again, DFW posted a lower unemployment rate for the quarter than Texas (6.2%) and the United States (7.3%). An ample supply of well-educated workers and strong population growth contribute to the area’s healthy economy. With a current estimated population of 6.7 million, the DFW metropolitan area is the fourth-largest MSA in the United States. The area’s population has grown 30% since 2000, and growth of 8.6% is projected for 2013 to 2018, according to Claritas.
DFW’s population is young, with an average age of 35, and affluent, with most of the population (51%) in their prime earning years of 20-54. DFW residents tend to earn more than the national average, supporting an estimated median household income of $59,237 as of Q3 2013, versus $52,590 in the U.S.
Market
Net Rentable
Area Sq. Ft.
Direct Vacant Sq. Ft.
% Direct Vacant
Total Vacant Sq. Ft.
% Total
Vacant
Average Asking Rate Annual, NNN
Per Sq. Ft.
Qtr Total Net Absorption
Sq. Ft.
2013 YTD Total Net Absorption
Sq. Ft.
Central Dallas 9,406,284 477,172 5.1% 477,172 5.1% $15.70 (49,484) 66,710
East Dallas Outlying 3,411,201 103,191 3.0% 103,191 3.0% $18.26 36,536 48,929
Far North Dallas 53,668,731 5,381,816 10.0% 5,495,280 10.2% $14.61 245,070 475,411
Near North Dallas 21,142,612 1,248,829 5.9% 1,248,829 5.9% $14.31 7,046 83,422
North Central Dallas 29,919,674 2,173,652 7.3% 2,334,394 7.8% $15.23 375,310 573,749
Southeast Dallas 13,226,494 935,203 7.1% 935,203 7.1% $11.02 (51,904) 127,644
Southwest Dallas 17,375,118 1,675,809 9.6% 1,703,506 9.8% $10.06 53,533 70,540
West Dallas 30,534,442 2,764,857 9.1% 2,777,357 9.1% $14.47 32,951 172,210
Central Fort Worth 23,559,881 2,326,202 9.9% 2,343,723 9.9% $8.71 209,288 322,668
Mid-Cities 49,258,703 3,572,416 7.3% 3,654,860 7.4% $14.09 323,379 664,421
Suburban Fort Worth 21,414,368 1,583,315 7.4% 1,704,715 8.0% $12.13 204,916 422,578
TOTAL Dallas 178,684,556 14,760,529 8.3% 15,074,932 8.4% $14.07 649,058 1,618,615
TOTAL Fort Worth 94,232,952 7,481,933 7.9% 7,703,298 8.2% $12.30 737,583 1,409,667
TOTAL DFW 272,917,508 22,242,462 8.1% 22,778,230 8.3% $13.23 1,386,641 3,028,282
Unemployment RateTotal Non-Agricultural Jobs
RETAIL FOURTH QUARTERMARKETVIEW
Source: CBRE Research, Q4 2013.
Source: U.S. Bureau of Labor Statistics, December 2013.
2,800,000
2,850,000
2,900,000
2,950,000
3,000,000
3,050,000
3,100,000
3,150,000
3,200,000
3%
4%
5%
6%
7%
8%
9%
10%
Q3
2007
Q4
2007
Q1
2008
Q2
2008
Q3
2008
Q4
2008
Q1
2009
Q2
2009
Q3
2009
Q4
2009
Q1
2010
Q2
2010
Q3
2010
Q4
2010
Q1
2011
Q2
2011
Q3
2011
Q4
2011
Q1
2012
Q2
2012
Q3
2012
Q4
2012
Q1
2013
Q2
2013
Q3
2013
Q4
2013
Source: U.S. Bureau of Labor Statistics, December 2013.
USA DFW Texas Total DFW Jobs (R)
© 2013, CBRE, Inc.