observations on waveforms of capillary …xzhang/publication/zhang1999a.pdf · observations on...
TRANSCRIPT

Eur. 3. Mech. B/Fluids @ Elsevier, Paris
OBSERVATIONS ON WAVEFORMS OF CAPILLARY AND GRAVITY-CAPILLARY WAVES
Xin Zhaq$] [l] : Scripps Institution of Oceanography, University of Californaa Sara Diego, La Jolla, California 92093-0230, USA
(Received 22 September 1998, revised and accepted 30 January 1999)
Abstract - Due to extreme conditions in the field, there has not been any observational report on three-dimensional waveforms of short ocean surface waves. Three-dimensional waveforms of short wind waves can be found from integrating surface gradient image data (Zhang 1996a). Ocean surface gradient images are captured by an optical surface gradient detector mounted on a raft operating in the water offshore California (Cox and Zhang 1997). Waveforms and spatial structures of short wind waves are compared with early laboratory wind wave data (Zhang 1994, 1995). Although the large-scale wind and wave conditions are quite different, the waveforms are resoundingly similar at the small scale. It is very common, among steep short wind waves, that waves in the capillary range feature sharp troughs and flat crests. The observations show that most short waves are far less steep than the limiting waveform under weak wind conditions. Waveforms that resemble capillary-gravity solitons are observed with a close match to the form theoretically predicted for potential flows (Longuet-Higgins 1989, Vanden-Broeck and Dias 1992). Capillaries are mainly found as parasitic capillaries on the forward face of short gravity waves. The maximum wavelength in a parasitic wave train is less than a centimeter. The profiles of parasitic wave trains and longitudinal variations are shown. The phenomenon of capillary blockage (Phillips 1981) on dispersive freely traveling short waves is observed in the tank but not at sea. The short waves seen at sea propagate in all directions while waves in the tank are much more unidirectional. @ Elsevier, Paris
1. Introduction
Nonlinearity in finite amplitude gravity surface waves of permanent form leads to sharp crests and flat troughs (Stokes, 1880). Wilton (1915) made a pioneering study of nonlinear gravity-capillary waves. Later Crapper (1957) predicted that capillary deep water waves in an inviscid, irrotational flow have profiles characterized by steep troughs and flat crests, the opposite of the nonlinear gravity waveforms. It is an exact closed-form solution for waves of arbitrary amplitude. This prediction has received some visual evidence from laboratory studies by Schooley (1958). For gravity-capillary waves, no exact solutions are known because of the complexity of the equations, but through numerical calculations, Schwartz and Vanden-Broeck (1979) and Hogan (1980) showed that their waveforms are very much like capillaries.
The existence of solitary gravity surface waves of permanent form in shallow water was discovered by Scott Russell (1838) and explained by the approximate theories of Boussinesq (1872), Rayleigh (1876) and Korteweg and de Vries (1895). Solitary capillary-gravity waves in the water of finite depth were discussed with similar approximation by Kawahara (1972), Hunter and Vanden-Broeck (1983), Zufiria (1987), Iooss and Kirchgassner (1990)) and Dias and Iooss (1993). In reality the bottom boundary layer due to wall friction is thick compared to the water depth. However, this is neglected in the above calculations. For more realistic deep water waves, Longuet-Higgins (1988) first suggested the existence of solitary waves for capillary-gravity waves from a different approach to the nonlinear water wave equations. The subsequent calculations (Longuet-Higgins 1989, 1993, and Vanden-Broeck and Dias 1992) predicted many properties of solitons. Capillary-gravity solitons are predicted

374
X. Zhang
to have a sharp trough similar to periodic capillary waves of finite amplitude with damped oscillations on both sides of the sharp trough. Laboratory observations were reported by Zhang and Cox (1994), Zhang (1995) and Longuet-Higgins and Zhang (1997).
Parasitic capillary waves on the downwind faces of gravity waves propagate as groups (Cox 1958). The linear theory of parasitic waves (Longuet-Higgins 1963) predicts that the wavelengths of parasitic capillaries decrease toward the trough of the long wave on which they ride. It is observed that, in the wind wave tanks (Schooley 1958, and Ebuchi et al 1987), there is a steep dip at the upper end of parasitic capillaries near the long wave crest. From fluid visualizations, Okuda et aE (1977) suggested the occurrence of a very strong vertical region at the crest of the gravity wave. Longuet-Higgins (1992) accounted for this phenomenon by including the vort,icity introduced by steep capillary waves. Ebuchi et al (1987) concluded, from an observation of ‘specular facets’ of short wind waves, that there is a streamwise streak structure on the rear face of long waves at a certain wind speed. The wave shape of parasitic capillaries was recently measured in a wind wave tank with surface gradient, imaging techniques (Zhang 1995). The waveforms fit the description of the theories. It is also found t,hat the maximum wavelength of parasitic capillaries is less than 1 cm.
Under the influence of wind, there is a wind drift shear layer just below the water surface. Wu (1968) measured a surface drift of about 4% of the mean wind speed, and a thickness of 335 mm. The wind drift surface boundary layer is very complicated and the effect on the waveform of very short waves is unknown. It has been shown (Simmen and Saffman 1985) that a uniform vorticity field (a linear shear layer) can change the form of gravity waves.
The discussion so far refers to two-dimensional plane waves propagating horizontally in one dimension. Chen and Saffman (1985) and Dias and Haragug-Courcelle (1999) calculated the three-dimensional capillary waves that diverge from two-dimensional capillary waves under the influence of nonlinearity. There are virtually no other quantitative measurements of waveforms of very short waves in three dimensions. Our elevation gradient measurements (Zhang and Cox 1994) allow 2-D wave surface reconstruction and provide a way of examining the 3-D waveforms of very short waves in detail.
In this paper, we report the short wind waves we observed in the California coastal water. Due to very different environments and processes involved, it is important to verify short wave behaviors in the field from direct observations. Short wind waves in the ocean are difficult to measure due to the harsh environment. Field observations are rare, and there are no measurements of the waveforms of short waves. The aim of this study is to acquire short wave field data and compare some aspects of very short wind waves between field data and lab data to improve our understanding on the dynamics of short wind waves.
The scattering of microwaves by the sea surface is influenced by Bragg scattering from very short water waves. For ocean surface waves, there are a wide range of wavelengths extending from long swells down to ripples with lengths of the order of a millimeter. Capillarity is dominant in waves with wavelengths shorter than 1.7 cm. The capillaries can be very steep with great curvature which can generate turbulence at and below the surface which contribute to the ocean surface mixing. Short surface waves can be generated and modulated by the wind and longer surface waves. Observing the shapes and structures of short wind waves is of vital importance to our understanding of these processes at the sea surface.
2. Data sets
The water surface is measured by a surface gradient imager that consists of a strobe light source, a color screen and a beam forming lens set underwater, and a photographic recording camera. It records color-coded light beams refracted at the sea surface over an area about of 20 cm x 16 cm. The recorded surface color images can be used to recover the shape of the water surface which is important to study the small scale roughness of the sea surface. Figure 1 shows our raft based optical surface measurement system in operation in Mission Bay, San Diego, The raft consists of a catamaran, 5.4 m long, with the optical equipment supported by two booms extending beyond the bow of the catamaran (on the left). One boom, extending upward into the air, supports anemometers and a mirror to reflect an image of the water surface to a photographic camera mounted just above the bow of the catamaran (see figure 2 for details). The other boom extends underwater and supports an

375
Observations on waveforms of capillary and gravity-capillary waves
FIGURE 1. A raft based optical surface measurement platform in Mission Bay water.
optical system to color code water surface slopes as seen by the photographic camera as well as a PIV system consisting a laser diode array and a CCD camera (not in the drawing). The battery and computer control unit is mounted near the stern. The controlling computer is operated by a laptop on the mothership nearby through radio communication.
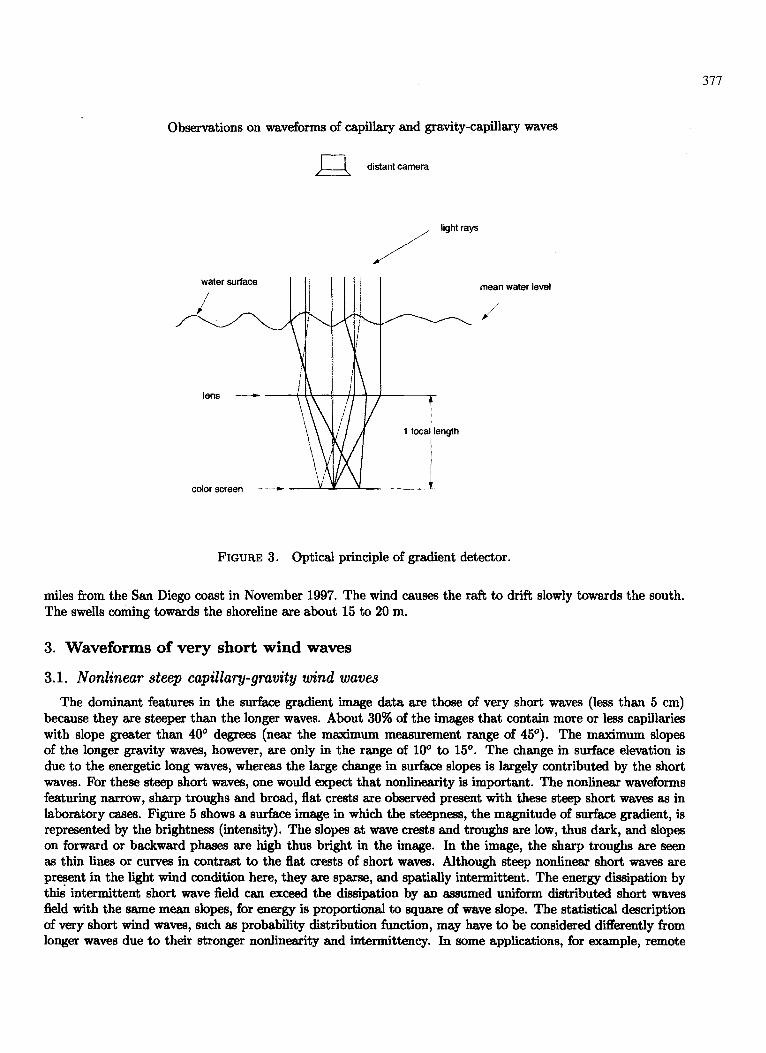
The technique of coding the two dimensional slopes of the water surface at full resolution (Zhang and Cox 1994) can be understood with reference to figure 3. A translucent color screen containing a distribution of hues and saturation of colors is illuminated from below and is at the focus of a Fresnel lens, so that beams of distinctly different colors are projected above the lens. Each colored beam comprises a parallel bunch of rays at an angle to the vertical determined by the location of their origin on the color screen, thus their color. The Fresnel lens set is of sufficiently large diameter (50 cm) and close enough to the water surface (50 cm) so that a circular area on the sea surface about 25 cm in diameter is illuminated by all the color beams. An imaging detector looking down on the sea surface from well above will see only those beams which have been refracted so that the rays are directed towards the detector (essentially parallel to the “optical axis” in the figure). Sell’s law of refraction ensures that the color as imaged is determined by the two components of surface slope at each point in the field of view. In this way the slopes of the water surface are color-coded. The dynamical range of the system is limited to water slopes of about 45O by the vertical angles of the parallel beams above the Fresnel lens, and the resolution of small water wavelength is limited by the resolution of the imaging detector. To achieve full resolution to sub millimeter scales and also cover a 25 cm surface diameter with the capability of

316
X. Zhang
Directional wind vane
-Anemometers
sensors
Mean water su
00 05 10 15 20
Scale in meters
f 0. m _5
Fresnel lens to color code water slopes
color screen
Xenon flash lamp
FIGURE 2. The optical surface slope measurement system is supported by two booms extending beyond the bow of the catamaran.
successive recording at rapid time intervals we have found it necessary to use color photography at a reasonable cost. In this application, a 16 mm movie camera is used. The water surface elevation can be calculated directly from the gradient image (Zhang 1996a).
The camera is mounted just above the bow of the catamaran looking at the sea surface through a mirror on the upper boom. The real distance from the sea surface to the camera is about 365 cm. This is large enough compared with the imaging area of 25 cm. The frame of the booms is rigid to prevent any relative motions among the camera, the mirror, and the under water optical system. Even if there is any small movement, for example 2 cm, it will not introduce appreciable error (very small change in viewing angle), since the distance between the camera and imaging sea surface is two order of magnitude larger.
Environmental data and raft motion is also recorded digitally by a computer. These include pitch, roll and yaw and accelerations of the platform, wind speeds and directions, surface level from a wave staff, air temperature and humidity. Figure 4 shows an example of wind speed collected by two anemometers about 90 cm and 150 cm above the sea surface.
The raft is designed to be towed offshore by a launch that also serves as a mothership. During towing, the booms are tilted to bring the underwater parts up into the air, and the entire boom assembly is then stowed inboard on the raft. When the raft is towed into a measurement station, the booms are lowed down facing the wind, and the raft is allowed to drift freely (or it can be anchored). The data in the paper were collected 5
377
Observations on waveforms of capillary and gravity-capillary waves
I distant camera
/
light rays
mean water level
J
FIGURE 3. Optical principle of gradient detector.
miles from the San Diego coast in November 1997. The wind causes the raft to drii slowly towards the south. The swells coming towards the shoreline are about 15 to 20 m.
3. Waveforms of very short wind waves
3.1. Nonlinear steep capillary-gravity wind waves The dominant features in the surface gradient image data am those of very short waves (less than 5 cm)
because they are steeper than the longer waves. About 30% of the images that contain more or less capillaries with slope greater than 40° degrees (near the maximum measurement range of 45O). The maximum slopes of the longer gravity waves, however, are only in the range of loo to 15O. The change in surface elevation is due to the energetic long waves, whereas the large change in surface slopes is largely contributed by the short waves. For these steep short waves, one would expect that nonlinearity is important. The nonlinear waveforms featuring narrow, sharp troughs and broad, flat crests are observed present with these steep short waves as in laboratory cases. Figure 5 shows a surface image in which the steepness, the magnitude of surface gradient, is represented by the brightness (intensity). The slopes at wave crests and troughs are low, thus dark, and slopes on forward or backward phases are high thus bright in the image. In the image, the sharp troughs are seen as thin lines or curves in contrast to the flat crests of short waves. Although steep nonlinear short waves are present in the light wind condition here, they are sparse, and spatially intermittent. The energy dissipation by this intermittent short wave field can exceed the dissipation by an assumed uniform distributed short waves field with the same mean slopes, for energy is proportional to square of wave slope. The statistical description of very short wind waves, such as probability distribution function, may have to be considered differently from longer waves due to their stronger nonlinearity and intermittency. In some applications, for example, remote

378
X. Zhang
Wind speed m/s
5
4.5
4
3.5
3
2S I I I 1 I I I I 0 20 40 60 80 100 120 140 160'
1 180 200
set
FIGURE 4. An example of in situ wind speed records. The dark lines correspond to the upper anemometer while the light lines correspond to the lower anemometer.
sensing of ocean surfaces through radar backscatter, one has to be very cautious in interpreting the statistical quantities of short waves, such as the mean square slopes (MSS), and wavenumber or frequency spectrum. Most of the steep short waves in this set of image data are parasitic capillaries. Other steep waves are those solitary capillary-gravity waves, and on rare occasions, irregular random short waves.
3.2. Parasitic capillaries The existence of parasitic capillaries on the forward face of gravity waves is persistent in laboratory wind
wave tanks at all wind speeds, even on purely mechanically generated waves. Parasitic waves are generated at the crests of long waves (Longuet-Higgins 1963, 1992). In resonating with the orbital velocity and gradient of orbital velocity of underlying long waves (Zhang 1995), they extract energy from the underlying long waves to work against the strong viscous dissipation (which is proportional to the square of wavenumber). Otherwise, short waves would be very short lived at a low wind speed. The favorable conditions for the parasitic capillaries are the existence of 10 to 100 cm steep gravity waves. Under the short fetch conditions in laboratory wind tanks, these short gravity waves are dominant, and parasitic waves are very important in dissipating wave energy and contributing to the small scale of surface roughness.
Parasitic capillaries in this data set are still dominant features among the steep short waves. The wavelengths of the parasitic capillaries are mainly in a range of 1 m m to 1 cm as shown in figure 6. The data of this wavelength histogram plot are collected by measuring the wavelength of each wavelet of all the parasitic wave trains found in our image data set.
Images of parasitic capillaries on long and short gravity waves are shown in figures 7 and 8. The wavelength decays from the crest towards the trough of the underlying waves, so do the slopes. In each parasitic wave train, the wavelength of the first wavelet (the nearest to the carrying wave crest) is the longest, varying from 0.5 cm to 1 cm or more. The shorter the first wavelet is, the steeper it is. The slopes of wavelets over 1 cm are very small. The parasitic wave trains starting with the extremely short wavelet are those associated with

379
Observations on waveforms of capillary and gravity-capillary waves
FIGURE 5. Top: A color-coded sea surface slope image of size 20.7 cm x 14.5 cm. Bottom: Surface steepness in brightness.

380
X. Zhang
0.06
0 0 0.2 0.4 0.6 08 1 12 14
cm
FIGURE 6. The wavelength distribution of parasitic capillaries.
incipient breaking (Banner and Phillips 1974) of the underlying waves as can be seen from the image data (Figure 9). The small-scale breaking of gravity waves can thus be detected by the change in wavelength of the parasitic waves. The steeper the carrying waves are, the shorter the starting parasitic wavelets, the steepest being those about 0.5 cm to 0.7 cm long. As the carrying waves steepen, the parasitic waves are compressed and become shorter wavelets as a result of increasing surface flow speed at the incipient breaking crest. The viscous dissipation limits the further growth of extremely short waves. The wavelength of the wavelets in a parasitic wave train decreases quickly for the first few wavelets, then the change diminishes gradually. There is little difference in wavelengths of the last few wavelets. In each of the parasitic capillary trains, there are more short wavelets than longer ones, which is why the shorter wavelet counts are enhanced in figure 6.
The parasitic waves are locally parallel to the underlying wave crests. Locally, they have a narrow angular distribution which limit the triad wave-wave interactions, for the triad resonant condition requires a much wide angular distribution (McGoldrick 1965). However, four wave-wave resonant interactions are possible for the narrow spectral capillaries (Zhang 1995). The wave trains are also propagating in the long wave orbital motion field which is inhomogeneous. These nonlinear waves can be visually detected in some instances (figure 9) when waves focus and defocus in the interaction process and form surface caustics in the direction of propagating waves (Peregrine and Smith 1979).
3.3. Solitary capillary-gravity waves
Another important observed phenomenon is the isolated steep dips which resemble solitons of capillary- gravity waves. These solitary waves propagate slower than the free linear waves, and are dissipated twice as fast as those of linear waves by viscosity (Longuet-Higgins 1997). They are extremely short lived without continuous forcing. A weak pressure disturbance at the speed of the solitary waves proved to be very effective in generating these solitons (Longuet-Higgins and Zhang 1997). Thus, any small disturbance of air pressure advected along with the wind field is capable of resonantly generating the capillary-gravity solitary waves, if the velocity difference between the orbital velocity of the underlying long wave and wind speed is less than the minimal linear wave speed, &in, as illustrated in figure 10. In a coordinate moving with the long wave phase speed C, but in the opposite direction, the long wave orbital velocity, U,, is minimum near the crest and maximum at the trough. The wind profile decays towards the water surface. At the critical layer wind speed, U,, is zero; that is wind speed matches the wave speed. The wind speed further reduces, near the surface. A favorable condition for the existence of the capillary-gravity solitary waves then is U, - U, < Cmin.

381
Observations on waveforms of capillary and gravity-capillary waves
FIGURE 7. An example of parasitic wave trains. The wave trains are riding on a gravity wave of longer than the image size (about 20.7 cm x 16.5 cm). The bottom surface elevation image corresponds to the central part area of the top image which is outlined.

382
X. Zhang
0.4 1 1 I I I 1 I , I I
1 1.5 2 2.5 3 cm3.5 4 4.5 5 5.5 6
/ 0.4 1 1 I I I , I I
0.2 0.4 0.6 0.8 drn 1.2 1.4 1.6 1.8 2
FIGURE 8. Parasitic wave on 10 cm short gravity waves. The image size is 20.7 cm x 14.5 cm. Two surf& height profiles marked in the image are plotted below the image.
383
Observations on waveforms of capillary and gravity-capillary waves
FIGURE 9. Incipient wave breaking and parasitic wave focusing and defocusing. The crest of a gravity wave just begins breaking in the bottom part of the picture where parasitic waves are compressed by higher local orbital velocity of the breaking crest. The focusing and defocusing a narrow band parasitic wave train due to nonlinearity can be observed as longitudinal caustics across the parasitic wave train.
Figure 11 shows an image of wave surface gradient from our data set. There is an isolated short line of sharp gradient change in the upper middle part of the image. We take a surface profile (vertically across the isolated short line) along the section as shown in figure 11 and plot it below the image. This profile fits remarkably well with the profile of Longuet-Higgins’ soliton of phase speed 1.30(gT/p) li4. The whole trough length of the wave structure is of about 2.5 cm which is large in comparison with the width of the steep dip of less than 0.5 cm. In the left part of the gradient image of Figure 12, there is a soliton with a very long trough.
3.4. Three dimensionality of very short waves The parasitic waves are, locally, quasi two dimensional and parallel to the carrying wave phase. Most of the
analytic and numerical calculations on parasitic waves are only two-dimensional and are good approximations, especially to explore the dynamics. A more realistic model could include a narrow spectrum presentation of capillaries to reflect their threedimensionality.
The troughs of capillary-gravity solitary waves in our data set are generally rather short, in the range of 1 to 2 cm. The examples shown above are the longest found. The theoretical and numerical studies on these solitary waves are so far still limited in twodiiensional space. However, it seems the theories do provide an adequate prediction. The random short waves, as shown in figure 5, are much more three-dimensional. The three-dimensional pattern of waveforms is similar to those of nonlinear capillary-gravity waves that were calculated by Chen and SafFman (1985) and Dias and HMgu@ourcelle (1999). In these calculations, the

384
X. Zhang
c
FIGURE 10. A possible mechanism of generating gravity-capillary solitary waves by wind.
5.50 5.75 600 8.25 6.50 6.75 7 .oo 725 750 7.75 6 00
cm
FIGURE 11. A wind wave field with soliton-like structures. Color-coded gradient image of short wave field (about 20.7 cm x 16.5 cm) and wave profile along the section marked in the image. The measured data points agree with the solitary wave form of phase speed equal to 1.30(gTlp)1/4 (solid curve).

385
Observations on waveforms of capillary and gravity-capillary waves
Solitary wave
0.5 5 5.5 6 6.5 7 7.5
cm
FIGURE 12. The image of a long trough solitary wave and its profile.
external forcing and nonuniformity of the medium are not considered. The wave patterns and waveforms of nonlinear capillary-gravity waves are very diient from the three-dimensional waveform of nonlinear gravity waves (Su 1982). These short random waves are probably directly generated or strongly forced by wind.
4. Wave number spectra
The wavenumber spectrum of short waves is estimated from averaging all the image data. The first order 2-D Slepian window is multiplied with image slope data before FFT calculations to eliinate the effect of image size @hang 1994). This window function has a steep spectral cut-off which is critical, since the spectrum has a wide range of values (seven order of magnitude). The spectral leakage of the window (< 10-l’) has to be less than the miniium value of estimated spectral value.
To the first order, the wavenmber spectrum related to its slope spectrum, S(2), by
of wave energy density of gravity-capillary waves, E($), is
q-2) = l/2(& + T)S(?)
where p, g, and T are water density, gravity acceleration, and surface tension respectively. The omnidirectional spectrum of energy density is defined as the integral of 2-D energy density spectrum over all directions. It

386
x. Zhang
omnidirectional wavenumber specta
FIGURE 13. Omnidirectional wavenumber spectra of energy density of very short wind waves. The dark blue curve is the spectrum calculated from the sea surface data set. The other curves are the laboratory data from Zhang (1994).
is plotted in figure 13 (the dark blue curve) against laboratory measurements @hang 1994). The high spatial frequency noise of the optical apparatus is higher than that of laboratory as shown in the figure. The higher noise level is due to the 6lm resolution. The spectral shape of capillaries (k > 27r &/cm) is similar to the laboratory measurements which is dominated by parasitic capillary waves. The spectral dip in the capillary-gravity range (near k = 2 &/cm) is much less pronounced. This can be explained as follows: the capillary blockage (Phillips 1981) is less important in the field than in the lab. In the short fetch laboratory condition, the short gravity waves are extremely steep. The less pronounced energy spectral dip could be due to a larger energy flux due to triad wave-wave interactions (Valenzuela and Laing 1972). It could also be due to the pronounced parasitic peak. The two-dimensional wavenumber slope spectrum is shown in Figure 14. The angular distribution of field data is much wider than that of laboratory measurements (Zhang 1994) which is expected.
Short wind waves spectra have also been measured in the coastal waters with scanning laser slope gauges (Hwang et al 1996 and Hara et al 1998). The slope gauges are based on same optical geometry as the slope imaging technique (Zhang 1996b). Th e imaging technique measures surface area simultaneously while the scanning scheme scans the surface points rapidly in various ways. The wavenumber ranges of spectra measured by Hwang et al (1996) and Hara et al (1998) are about 1 < k < 16 rad/cm and 0.5 < k < 8 &/cm respectively. Hwang et al (1996) found a characteristic change in spectral power law at a wavenumber about 9 &/cm or a wavelenght of 0.7 cm. This is about the maximum wavelength of the parasitic capillaries. The spectral shapes in the two regions of k<9 and k>>9 rad/cm are reasonably smooth and can be represented by power-law functions of wavenumber k, -1 and -3 for the slope spectra. The capillary wave spectral shape is consistent with our measurement, a typical parasitic capillary wave spectrum (Zhang 1995). For k<9 rad/cm, all measured spectra show very different behavior from the laboratory measurements. Apparently, the capillary blockage (Phillips 1981) is less important in the field.

387
Observations on waveforms of capillary and gravity-capillary waves
FIGURE 14. Two-dimensional wavenumber spectrum.
5. Conclusions and future work
The three dimensional waveforms of capillary-gravity and capillary waves are observed at sea during a recent experiment in California coastal waters. The waveforms are compared with laboratory observations. They are resoundingly similar to the laboratory observations. It is very common, among steep short wind waves, that waves in the capillary range featuring sharp troughs and flat crests. Waveforms that resemble capillary-gravity solitons are observed with a close match to the form theoretically predicted for potential flows. Capillaries are mainly found as parasitic capillaries on the forward faces of short gravity waves. The maximum wavelength in a parasitic wave train is less than a centimeter. The profiles of parasitic wave trains and longitudinal variations are shown. The phenomenon of capillary blockage (Phillips 1981) on dispersive freely traveling short waves is observed in the tank but not at sea. The short waves seen at sea propagate in the all the directions while the waves in the tank are much more unidirectional.
However, statistical distributions of very short wind waves are not that as close resemble as the local wave properties. One should be cautious to extend statistics of laboratory short wave data directly to the field conditions. Systematic field experiments at different wind conditions are required to understand the statistics of these very short wind waves.
References [l] Banner, M. L. and Phillips, 0. M. 1974 On the incipient breaking of small scale waves. J. Fluid Mech. 65, 647-656. [2] Boussinnesq, J. 1872 Theorie des ondes et des remous qui se propagent le long d’un canal rectangulaire horizontal. J. Math.
Pure Appl. 17, 55-108. [3] Chen, B. and Saffman, P. G. 1985 Three-dimensional stability and bifurcation of capillary and gravity waves on deep water.
Stud. Appl. Math. 72, 125147. [4] Crapper, G. D. 1957 An exact solution for progressive capillary waves of arbitrary amplitude. J. Fluid Me& 96, 417-445. [5] Chx, C. S. 1958 Measurement of slopes of high-frequency wind waves. J. Marine Res., v.16, No.3 : 199225. [6] Cox, C. S. and Zhang, X. 1997 Optical methods for study of sea surface roughness and microscale turbulence, SPIE, Vol. 3172,
165-172. [7] Dias, F. and H&r&gu&ourcelle, M. 1999 On the transition from two-dimensional to threodimensional water waves, Stud.
Appl. Math. (in pm.w). [81-D&, F. and Iooss, G. 1993 Capillary-gravity solitary waves with damped oscillations. Physica D 65, 399-423. [9] Ebuchi, N., Kawamura, H. and Toba, Y. 1987 Fine structure of laboratory wind-wave surfaces studies using an optical method.
Boundary-Layer Meteorology 39,133151. [lo] Hara, T., Bock, E. J., Edson, J. B., and McGill&, W. R. 1998 Observation of short wind waves in coastal waters. J. Phys.
Oceanogr. 28, 1425-1438

388
X. Zhang
[ll] Hwang, P. A., Atakturk, S., Sletten, M. A., and Trizna, D. B. 1996 A study of the wavenumber spectra of short water waves in the ocean. J. Phys. Oceanogr. 26, 1266-1285
[12] Hogan, S. J. 1980 Some effects of surface tension on steep water waves. Part 2. J. Fluid Mech. 96, 417-445. [13] Hunter, J. K. and Vanden-Broeck, J. M. 1983 Solitary and periodic gravity-capillary waves of finite amplitude, J. Fluid Me&.
134, 205-219 [14] IOOSS, G. and Kirchgbsner, K. 1990 Bifurcation d’ondes solitaires en presence d’une faible tension superficielle. C. R. Acad.
Sci. Paris 311 I, 265-268 [15] Kawahara, T. 1972 Oscillatory solitary waves in dispersive media. J. Phys. Sot. Japan 33, 260-264 [16] Korteweg, D. J. and devries, G. 1895 On the change of form of long waves advancing in a rectangular canal, and on a new
type of long stationary waves. Phil. Mag. 39, 422-443. [17] Longuet-Higgins, M. S. 1963 The generation of capillary waves by steep gravity waves. J. Fluid Mech. 16, 138-159. [18] Longuet-Higgins, M. S. 1988 Limiting forms for capillary-gravity waves, J. Fluid Mech., 194, 351-375 [19] Longuet-Higgins, M. S. 1989. Capillary-gravity waves of solitary type on deep water. J. Fluid Mech. 200, 451-478. [20] Longuet-Higgins, M. S. 1992 Capillary rollers and bores. J. Fluid Mech. 240, 659-679. [21] Longuet-Higgins, M. S. 1993 Capillary-gravity waves of solitary type and envelop solitons on deep water. J. Fluid Mech. 252,
703-711 [22] Longuet-Higgins, M. S. and Zhang, X. 1997 Experiments on capillary-gravity waves of solitary type on deep water. Phys.
Fluids. 9/7, 1963-1968 [23] McGoldrick, L. F. 1965 Resonant interactions among capillary-gravity waves. J. Fluid Mech. 21, 305-331. [24] Okuda, K., Kawai, S. and Toba, Y. 1977 Measurements of skin friction distribution along the surface of wind waves. J.
Oceanogr. Sot. Japan 33, 190-198. [25] Phillips, 0. M. 1981 The dispersion of short wavelets in the presence of a dominant long wave. J. Fluid Mech. 107, 465-485. [26] Peregrine, D. H. and Smith, R. 1979 Nonlinear effects upon waves near caustics, Phil. Trans. A292, 241-370. [27] Rayleigh, Lord 1976 On waves. Phil. Mag. 1, 257-279. [28] Russell, J. S. 1838 Report of the committee on waves. Proc. Brit. Ass. Adv. Sci., Liverpool 1837. London. John Murray,
417-496. [29] Schooley, A. H. 1958 Profiles of wind-created water waves in the capillary-gravity transition region. J. Mar. Res. 16, 100-108. [30] Schwartz, L. W. and Vanden-Broeck, J.-M. 1979 Numerical solution of the exact equations for capillary-gravity waves. J. Fluid
Mech. 95, 119-39. [31] Simmen, J. A. and Saffman, P. G. 1985 Steady deep-water waves on a linear shear current. Stud. Appl. Math. 73, 35-57. [32] Stokes, G. G. 1880 Supplement to a paper on the theory of oscillatory waves. in Mathematical and Physical Paper, 1. Cambridge
University Press, 1880, 197-229. [33] Su, M.-Y., 1982, Three-dimensional deep-water waves, Part I, Experimental measurement of skew and symmetric wave patterns,
J. Fluid Mech. 124, 73-108 [34] Valenzuela, G. R. and Laing M. B. 1972 Nonlinear energy transfer in gravity-capillary wave spectra, with applications, J Fluid
Mech. 54, 507-520. [35] Vanden-Broeck, J.M. and Dias, F. 1992 Gravity-capillary solitary waves in water of infinite depth and related free surface
flows. J. Fluid Mech. 240, 549-557. [36] Wilton, J. R. 1915 On ripples Phil. Mag. (6) 29, 688-700. [37] Wu, J. 1968 Laboratory studies of wind-wave interactions. J. Fluid Mech. 34, 91-111. [38] Zhang, X. and Cox, C. S. 1994 Measuring the two dimensional structure of a wavy water surface optically: A surface gradient
detector. Experiments in Fluids 17, 225-237. [39] Zhang, X. 1994 Wavenumber spectrum of very short wind waves: An application of 2-D Slepian windows to the spectral
estimation. J. Atmos. Oceanic Tech. 11, part 2, 489-505 [40] Zhang, X. I995 Capillary-gravity and capillary waves generated in a wind wave tank: Observations and theories, J. Fluid
Mech. 289, 51-82. [41] Zhang, X. 1996a An algorithm for calculating water surface elevations from surface gradient image data, Exp. Fluids 21, 43-48. [42] Zhang, X. 199613 Optical mapping of fluid density interfaces: Concepts and implementations, Rev. Scientific Instr. Vol.67, No.
5, 1858-1868 [43] Zufiria, J. A. 1987 Symmetry breaking in periodic and solitary gravity-capillary waves on water of finite depth. J. Fluid Mech.
184, 183-206