observations on the developmental stages of pardalophora ......observations on the developmental...
TRANSCRIPT

June, 2007
Observations on the developmental stages of Pardalophora haldemani (Orthoptera:Acrididae)
under selected laboratory temperatures
R. Nelson Foster. K. Chris Reuter and Lonnie R. Black
United States Department of Agriculture, Animal and Plant Health Inspection Service, Plant Protection and Quarantine, Center for Plant Health Science and
Technology, Decision Support and Pest Management Systems Laboratory, 3645 E. Wier Avenue, Phoenix, Arizona 85040, USA
1

Observations on the developmental stages of Pardalophora haldemani (Orthoptera:Acrididae) under selected laboratory temperatures
R. Nelson Foster. K. Chris Reuter and Lonnie R. Black
United States Department of Agriculture, Animal and Plant Health Inspection Service, Plant Protection and Quarantine, Center for Plant Health Science and Technology, Decision Support and Pest Management Systems Laboratory, 3645 E. Wier Avenue,
Phoenix, Arizona 85040, USA
R. Nelson Foster (602) 437-1295 ex 225; (602) 437-1295 Fax; [email protected] K. Chris Reuter (602) 437-1295 ex 228; (602) 437-1295 Fax; [email protected] Lonnie R. Black (602) 437-1295 ex 232; (602) 437-1295 Fax; [email protected]
For Final Journal Submission: Number lines and name each page upper right Indent as guidelines show Double space REMOVE HEADINGS REVIEW AGAIN particularly red
2
Abstract
Approximately 500 Pardalophora haldemani (Scudder) were collected from central South Dakota rangeland as newly eclosed first instars and held in the laboratory at 4.4o , 15.6o and 26.7o C. At 4.4o C, all 161 individuals died and no molting was observed. At 15.6o C, 76% of the individuals had died within 2 months and 6% of those had molted to the second instar. At 26.7o C some survived for over a year. At this temperature 54.7% of the individuals survived to reach adult. Males and females survived as adults an average of 60.02 and 56.09 days respectively. Males generally developed through less instars than females to reach adult, but generally spent more time in each instar compared to females. In this study P. haldemani developed through 5, 6 or 7 instars as males and 6, 7 or 8 instars as females before becoming adults and demonstrated extended periods of survival. Compared to most rangeland grasshopper species, this species requires development through additional immature stages.
3

Introduction Control or suppression of damaging populations of rangeland grasshoppers in the western United States typically occurs during the summer months, particularly June and July. This is when most grasshopper species on western rangelands are in the late instars or are young adults. However, a few species are seen very early in the year because they over-winter in the nymphal stage. These early occurring species are usually the band-winged (Oedipodinae), Arphia conspersa Scudder , Chortophaga viridifasciata (DeGeer), Pardalophora apiculata (Harris), P. haldemani (Scudder), Xanthippus corallipes (Haldeman) and X. montanus (Thomas) and the slant-faced (Gomphocerinae) Eritettix simplex (Scudder), Psoloessa delacatula (Scudder) and P. texana Scudder. Populations of these over-wintering species, individually or combined, rarely reach levels that cause significant damage, particularly over large areas, and are usually ignored as a potential rangeland pest. However, populations of P. haldemani, a mostly mixed feeder of grasses with little preference for specific species (Mulkhern et al. 1964, 1969), have reached damaging levels serious enough to require treatments in 1989 and 1990 in Utah, 2002 and 2003 in Nebraska and in 1990, 2004 and 2005 in South Dakota. Remarkable numbers of this species also occurred in July of 1932 when nocturnal flights of great magnitude were reported throughout southern South Dakota and northeastern Nebraska (Parker and Connin 1964.) P. haldemani has accounted for the majority of outbreaks of over-wintering rangeland grasshopper species in the west U.S. While these occurrences are not unique they are certainly rare but nevertheless require appropriate attention. United States Department of Agriculture (USDA) Animal and Plant Health Inspection Service (APHIS) sponsored cooperative programs are typically organized toward applying treatments in the summer months after seasonal personnel are added for survey and treatment activities. The phenology of P. haldemani places it out of synchrony with the typical rangeland grasshopper activities. Therefore, treatment timing options are much earlier or later than usual. Most rangeland grasshopper species typically develop through 5 instars before becoming adults. Because little is known about the developmental stages of P. haldemani and to better understand its phenology, the following laboratory study was conducted in an attempt to develop some data on the immature developmental stages.
Materials and Methods First instar P. haldemani were collected 29 August 2005 east of Pierre, South Dakota on the Crow Creek Indian Reservation. Insects were packaged in plastic bags containing crumpled newspaper to increase the resting surface area, and shipped over-night inside a blue ice brick cooled cardboard shipping container to the USDA APHIS Decision Support and Pest Management Systems Laboratory in Phoenix, Arizona. Upon arrival they were transferred to 25 x 41 x 41 cm screen rearing cages where they were maintained with fresh romaine lettuce and Cheerios ® daily until final set-up within the study design.
4

Single first instar P. haldemani were placed in 118.28 ml plastic specimen cups with lids modified with screen for ventilation. One hundred and sixty-one cups containing individual grasshoppers were held in each of three constant temperature control cabinets with 13 h of light/day at 4.4o C, 15.6oC and 26.7o C. Individual molting and death was recorded daily. Fresh food was provided daily. Measurements were started when insects molted to the second instar since the exact hatch date of individuals from the field was unknown. The sex of each individual was determined upon reaching the adult stage. The study was conducted from 30 August 2005 through 5 September 2006. A temperature control malfunction in the 4.4 o C group resulted in a second group of equal numbers of first instars being set up in another 4.4 o C cabinet on 8 September 2005.
Results and Discussion First instars held at 4.4o C – 8 September 2005 – 8 November 2005. Over this period, all 161 individuals died and no molting was observed. Insects remained in the 1st instar. First instars held at 15.6oC – 31 August 2005 – 27 October 2005. During the first month, 24.8% died (40 of 161) and only one individual had molted to the 2nd instar. By the end of the second month, 75.8% had died (122 of 161) and 5.6% (9 of 161) had molted to the 2nd instar. Unfortunately, on 26 October the temperature control of the chamber malfunctioned and temperature dropped to 3.9o C resulting in death to the remaining individuals the next day. Even though equipment malfunction truncated the study of cohorts at 15.6o C, it is clear that under these laboratory conditions, development is slow and mortality is high. First instars held at 26.7o C – 31 August 2005 – 5 September 2006. Of the 161 individuals held at this temperature 54.7% survived to reach the adult stage. Some individuals survived for over a year at this temperature. Survival rates were highest in the 2nd-6th instars but declined in the 7 th and 8th instars. After becoming adults, males lived from 1 to 128 days and averaged 60.02 days. Females lived from 1 to 106 days and averaged 56.09 days. Development took substantially longer in the 4th and 5th instars where some individuals lived as long as 92 – 120 days (Table 1). Males generally developed through less instars than females to reach adult, but generally spent more time in each instar compared to females. Four males molted from the 5th instar to adult. Thirty six males required 6 instars of development while 3 males required 7 instars of development before becoming adult. One female molted from the 6th instar to adult. Thirty five females required 7 instars of development while 8 females required a remarkable 8 instars of development before becoming adult. The findings in this study were not unexpected. Some species, and in particular the closely related and over-wintering species, X. corallipes, develops through 5 or 6 instars as males and 6 instars as females, before becoming adults (Pfadt 2002). A few other U.S. species, Melanoplus differentialis (6-8 instars) (Dingle and Haskell 1967), M. femurrubrum (6-8 instars) (Bellinger and Pienkowski 1987, 1989), and M. sanguinipes (5-6 instars) (Smith 1959 , Hodson and Chapco 1986) have demonstrated some development through more than 5 instars (Esperk, Tammaru and Nylin, 2007). In our study, study P. haldemani demonstrated the potential for extended periods of survival, perhaps as a result of an unusual number of developmental instars required before reaching adult. Additional field studies or laboratory studies simulating naturally occurring
5

fluctuating temperatures and decreasing followed by increasing photoperiods will be required to fully understand and accurately describe the phenology of this unusual species. Compared to most rangeland grasshopper species, P. haldemani may be considered potentially long-lived and requiring development through additional immature stages.
Acknowledgements The authors thank Bruce Helbig and Amy Messman (USDA, APHIS, PPQ, Pierre, SD) for locating, collecting and shipping large numbers of newly hatched P. haldemani to Phoenix, AZ for the study. Special thanks are extended to Greg Abbott, Steve Johnson and Bruce Helbig, all of the USDA, for supplying historical information from Utah, Nebraska and South Dakota, respectively.
References
Bellinger, R. G. and R. L. Pienkowsky. 1987. Developmental polymorphism in the red-legged grasshopper Melanoplus femurrubrum (De Geer) (Orthoptera:Acrididae). Environ. Entomol. 16: 120-125. Bellinger, R. G. and R. L. Pienkowsky. 1989. Polymorphic development in relation to the life history of Melanoplus femurrubrum (De Geer) (Orthoptera: Acrididae) Ann. Entomol. Soc. Am. 82: 166-171. Dingle, H., and J. B. Haskell. 1967. Polymorphism in the grasshopper Melanoplus differentialis . Science.(Wash. D.C.) 155: 590-592. Esperk, T., T. Tammaru, and Nylen Soren. 2007. Intraspecific Variability in Number of Larval Instars in Insects. Journal of Economic Entomology, 100: 627-645. Hodson, F. R. H. and W. Chapco. 1986. Fitness traits associated with the red back phenotype in the migratory grasshopper , Melanoplus sanguinipes. Experientia 42: 444-445. Mulkhern, G. B., D. R. Toczek and M. A. Brusvan. 1964. Biology and ecology of North Dakota grasshoppers II. Food habits and preferences of grasshoppers associated with the sand hills prairie. Researsch Report No. 11. North Dakota Agricultural Experiment Station, Fargo, North Dakota. 59 pp. Mulkhern, G. B., K. E. Pruess, H. Knutson, A. F. Hagen, J. B. Campbell and J. D. Lambley. 1969. Food habits and preferences of grasslands grasshoppers of the North Central Great Plains. Bulletin No. 481. Agricultural Experimental Station, North Dakota State University, Fargo, North Dakota 58102. 32 pp. Parker, J. R., and R. V. Connin. 1964. Grasshoppers: Their habits and damage. U.S. Dept. of Agriculture . Info. Bull. 287: 1-28.
6

Pfadt, Robert E. 2002. Field Guide to Common Western Grasshoppers. Wyoming Agricultural Experiment Station. Bulletin 912. Smith, D. S. 1959. Utilization of food plants by the migratory grasshopper, Melanoplus bilituratus (Walker) (Orthoptera: Acrididae), with some observations on the nutritional value of plants. Ann. Entomol. Soc. Am. 52: 674-680. Esperk, T., T. Tammaru, and Nylen Soren. 2007. Intraspecific Variability in Number of Larval Instars in Insects. Journal of Economic Entomology, 100: 627-645. Use the blue ref and delete the red ones.
7

Table 1. Number of days Pardalophora haldemani spent in each instar of development at 26.7° C. nymphal instar 1
all specimens 2 3 4 5 6 7 8 adult
longevity mean # days 13.26 22.91 51.30 53.85 34.76 29.71 24.13 58.03 minimum 10 11 14 15 9 14 18 1 maximum 35 123 120 118 99 76 34 128 % survival 97 91 91 92 92 87 57 - total no. gh 2 150 145 132 120 106 60 14 87 male mean # days 13.72 28.77 57.77 48.98 36.10 62.00 - 60.02 minimum 10 11 14 18 9 35 - 1 maximum 23 123 107 118 99 76 - 128 total no. gh 43 43 43 43 39 3 - 43 female mean # days 12.86 16.82 42.09 59.02 32.52 27.30 24.13 56.09 minimum 11 12 16 15 13 14 18 1
8

maximum 17 28 120 112 88 67 34 106 total no. gh 44 44 44 44 44 43 8 44 1 Molting to adults occurred in the 6th, 7th and 8th instars. 2 Of original 161 grasshoppers, 10 died before reaching 2nd instar.
MANUSCRIPT PEER REVIEW RECORD
Title of Manuscript: Observations on the developmental stages of Pardalophora haldemani (Orthoptera:Acrididae) under selected laboratory temperatures Author(s): R. Nelson Foster. K. Chris Reuter and Lonnie R. Black Proposed Publisher or Journal and/or Place of Presentation: The Canadian Entomologist
Name, Title, and Address of Reviewer: I have reviewed the above paper and find it:
acceptable as is
acceptable with minor revision
acceptable with major revision
unacceptable
1. Scientific content
2. Clarity
3. Contribution to
literature
Further comments:
9

10
Date of Review: Signature of Reviewer:

Field Evaluation of a new Arizona strain of Metarhizium anisopliae
against immature Mormon crickets (Orthoptera:Tettigonidae) using improved field cages and simulated aerial sprays.
R. Nelson Foster, K. Chris Reuter and Lonnie R. Black USDA-APHIS-PPQ-CPHST- CPHST Laboratory, Phoenix, Arizona.
Stefan Jaronski and Rob Schlothauer
USDA-ARS-NPARL, Pest Management Unit, Sidney, MT
Donald W. Roberts Utah State University, Logan, Utah
December 2007- February 2008
1

Field Evaluation of a new Arizona strain of Metarhizium anisopliae against immature Mormon crickets (Orthoptera:Tettigonidae) using
improved field cages and simulated aerial sprays.
R. Nelson Foster, K. Chris Reuter and Lonnie R. Black USDA-APHIS-PPQ-CPHST- CPHST Laboratory, Phoenix, Arizona.
Stefan Jaronski and Rob Schlothauer
USDA-ARS-NPARL, Pest Management Unit, Sidney, MT
Donald W. Roberts Utah State University, Logan, Utah
Cooperators
Gary Chatriand, Leverlam International, Butte, MT
Crow Indian Tribe
Abstract
The Field Aerial Application Spray Simulation Tower Technique (FAASSTT) in combination with newly designed field cages was used to field evaluate Metarhizium anisopliae DWR346 (a newly discovered strain from Arizona), M. anisopliae F52 and Beauveria bassiana GHA against immature Mormon crickets. Thermal surrogates were used to model the time to onset of mortality as affected by Mormon cricket body temperatures. Mormon crickets exposed to treated plots and subsequently moved to the laboratory confirmed that lethal doses of all 3 isolates had been applied. In-field time at temperatures permissive for fungal development to yield rapid mortality varied greatly among the isolates. The new strain, M. anisopliae DWR 346, demonstrated significant mortality (19 %) at 7 days after treatment and reached mortality levels (90 %) expected of traditional chemical treatments at about 3.5 weeks after treatment. This strain appears superior compared to other U. S. strains tested to date and offers an excellent potential as a realistic non-chemical treatment for Mormon crickets and grasshoppers. The thermal model accurately predicted the onset of mortality for DWR 346 but under-estimated onset for the other isolates. Future surrogate thermal data will provide information for further development of reliable models for predicting onset of mortality. The use of FAASSTT, and newly designed field cages will greatly facilitate developmental efforts, particularly early field evaluations with fungal pathogens in the future.
2

Introduction
Rangeland grasshoppers and Mormon crickets, a shieldbacket katydid, occur as serious pests on a diversity of rangelands in the western United States. Control efforts rely on traditional insecticide sprays or baits. However, environmentally sensitive areas commonly preclude the use of insecticide treatments. The numbers of sensitive situations associated with rangelands are increasing and at best complicate and more often prevent much needed local or area-wide treatments of these range pests. The need for and development of economic non-chemical treatments for these range pests in the United States has been identified and seriously pursued to some degree, for almost 30 years. During that time Nosema locustae, a microsporidian, (Henry et al. 1978, Onsager et al. 1981) and Beauveria bassiana strain GHA (an insect pathogenic fungus) have been registered for grasshoppers in the U.S. However, widespread acceptance and competitive economics have not been achieved for N. locustae (Vaughn et al. 1996) or B. bassiana, (Jaronsski and Goettel, 1997). The development of fungal pathogens for use on U. S. rangeland is complicated by few available candidate U. S. isolates, lack of an economical system for early evaluation of candidate pathogens in the field and the normal thermo-regulating behavior of grasshoppers (Chappel and Whitman, 1990) and Mormon crickets (Turnbow, 1998) that interferes with rapid pathogen development within the insect (Inglis et al. 1996). This behavior is altered or prevented in traditional field cage evaluations, therefore causing false positive responses. Poor economics associated with insect pathogens has also acted somewhat as a disincentive to registration and commercialization. Different isolates of the fungal pathogen Metarhizium anisopliae var. acridum from Australia (Milner, 1997) and Africa (Lomar et al. 1997) have been developed for use in several countries. This Orthopteran host specific pathogen has been found in Mexico (Hernandez-Velazquez et al. 1997 ; Milner et al. 2003), Brazil (Magalhaes et al. 1997) and Peru (Magalhaes et al. 2003). However, it or a more heat tolerant useful strain of Beauveria bassiana or Metarhizium anisopliae has yet to be found in the U.S. The concerns about using non-indigenous strains of pathogens, including ones that are commercialized in other regions, make the development of a foreign strain for use in the U.S difficult at best. The obvious solution is to find a usable strain (highly efficacious and heat tolerant) in the U.S. The attention has historically been on development of fungal pathogens for grasshoppers, but recent focus has been on Mormon crickets. The latter occur earlier in the year than grasshoppers and therefore may present different, more favorable body temperatures for fungal development within the insect. Fungal isolates that do not work well on grasshoppers because of seasonally high temperatures may work better on immature Mormon crickets that occur earlier in the season when environmental temperatures may be lower. We report here a field evaluation of a newly discovered strain of Metarhizium anisopliae from Arizona in addition to two registered entomopathogenic fungi using an economical method of simulating aerial spray treatments in the field (Field Aerial Application Spray
3
Simulation Tower Technique) and cages newly designed to alleviate past shading problems (Foster et al. 2006, 2007).
OBJECTIVES
The following are specific objectives of the study.
1. Evaluate selected fungal pathogens against immature Mormon crickets under early season thermal conditions.
2. Evaluate an isolate of Metarhizium anisopliae recently discovered from Arizona
by Don Roberts and the US registered fungal pathogens Beauveria bassiana GHA and Metathizun anoisopliae F52.
3. Predict the actual field time necessary to show onset of mortality based on
laboratory determined thermal characteristics of the fungi and daily duration of body temperatures permissive for fungal growth measured with Mormon Cricket surrogates in the field.
4. Combine the latest version of Field Aerial Application Spray Simulation Tower
Technology (FAASSTT) to simulate liquid aerial application with cages newly designed to minimize cage effect for an economically early evaluation of candidate pathogens under field conditions.
Materials and Methods Field Cage Study The study was located on the northern outskirts of Sidney, Montana. This location was selected because of the ease for almost continuous observation and the proximity of the USDA-ARS-Northern Plains Agricultural Research Laboratory in Sidney. Each of three isolates, Beauveria bassiana GHA (Levarlam International) (EPA. 2000), Metarhizium anisopliae F52 ( Novozymes Biological Inc.) (EPA. 2003), Metarhizium anisopliae DWR346 (newly discovered by Donald Roberts, Utah State University) were applied in food grade canola oil diluent to 0.508 m diameter grass plots near Sidney, Montana on June 4-5 ,2007. An oil carrier only treatment was included for comparison. Field test amounts of all three strains were produced by USDA ARS Northern Plains Agricultural Research Laboratory (NPARL) using a biphasic, liquid-solid substrate fermentation process (Bradley et al. 2002). Prior to formulation, conidial viabilities were determined by plating dilute aqueous suspensions of each technical powder onto potato dextrose agar, incubating at 27-28° C. for 16-19 hr, and then examining the conidia with 400X phase contrast microscopy. The Metarhizium required a preliminary step to determine viability, in which a small quantity of conidia was exposed to 100% relative
4

humidity for 1-2 hr before suspension and plating. A minimum of 400 conidia were examined for germination; a conidium was considered viable (germinated) if it had produced a visible germination peg during the specified incubation time. Viability of the B. bassiana GHA, M. anisopliae F52 and DWR346 technical powder was 95%, 92% and 90% respectively. The fungal formulations were applied at an intended rate of 3.705 conidia / 12.35 l/ha (1.5 x 10 13 viable conidia/169.1 fluid oz/acre). A carrier control (oil carrier only applied at the same volume per acre) was included in the experimental design. Treatments were applied to 0.508 m diameter grass plots marked with aluminum rings separated by about 1-1.5 meters and arranged in 24 rows of 12 (Fig. 1). The design provided each of the four treatments (including control) with 6 replications (rows) of 12 small plots (288 total plots and cages). Treatments were applied by using Field Aerial Application Spray Simulation Tower Technology (FAASSTT). This now mobile technology evolved from a fixed laboratory spray tower and air brush that was developed to replace laboratory topical application study rates with actual field application rates. (Foster and Reuter, 1991) (Foster et al. 1996-1999) (Foster et al. 1996) (Reuter et al. 1996) and (Foster et al. 2004). The fixed tower was adapted to field use for glassy-winged sharpshooter studies on rangeland in California in 2001 and Mormon cricket studies in Idaho in 2005 (Foster - unpublished data) and evolved to become a small portable enclosed plastic chamber (Foster et al. 2006), a larger portable plastic chamber (Foster et al. 2007) and finally the current cardboard chamber (Fig. 2) which alleviates static electricity produced in the previous designed plastic chambers. Sprays of treatments were specifically applied through the FAASSTT by means of an airbrush (Paasche Type H with 75 regulator) modified with a customized syringe needle for liquid injection to produce droplets which simulate aerially applied sprays (Foster and Reuter 1991), (Foster et al. 1996) to the area to be treated. The spraying system was attached to the top of a portable containment chamber which prevented drift (Fig. 3). The detailed protocol can be seen in Figure 4. Because of the time required to treat each of the plots with sprays, treatments occurred over two days. Three replications of the fungal treatments were each applied on June 4 and 5, 2007. All oil only controls were sprayed on June 4. Following treatment, cages 8.5 in high x 7 in diameter, fashioned from 1/8 inch hardware cloth (22 cm high by 17.8 cm diameter fashioned from 0.32 cm hardware cloth) (Fig. 5) (Foster et al. 2006, 2007) were established on each sprayed area (Fig.6). Immediately following treatment and cage placement, each of the cages was stocked with a single sixth or seventh instar Mormon cricket. Stocking cages with single crickets prevented cannibalism, a common occurrence when more than one cricket is confined in a cage. Once field cages were stocked, cricket mortality within field cages was monitored daily. Crickets were previously captured on June 3, 2007 near Lodge Grass, Montana and transferred in cooled Styrofoam containers to the ARS Laboratory in Sidney where they were maintained under cool conditions until placed in field cages. Within the Styrofoam
5
containers, crickets were individually held in 120 ml specimen cups with screw cap lids. Each lid had a screened 3-4 cm diameter opening for ventilation. The study was conducted from June 4 through July 25, 2007. After two days of exposure to spray residuals in the field cages, crickets from two of the six replicates (24 insects per treatment) were transferred to the laboratory for incubation at (28° C) 82.4 °F to determine efficacy under known, constant, optimal developmental temperature for the fungi. The other 4 replicates remained in the field for the duration of the study. During the study, cages were supplemented with additional food, ca. 10 cc pulverized sunflower seed per cage twice weekly. Mormon Cricket Surrogates – Prediction of Mortality Onset Mormon cricket thermal surrogates (Fig. 7) were used to measure the temperature that a cricket would generate through body positioning on the ground and at canopy level inside and outside of a cage. They were also used to estimate the duration of time individuals spent within selected thermal ranges for fungal growth as determined from the literature and data generated by USDA ARS Sidney, MT (Jaronski, unpublished). Surrogates consisted of 1.5 ml Eppendorff tubes filled with soy sauce and fitted with a copper-constatin thermocouple wire connected to a data logger recording device (DualogR®, Cole Palmer) These surrogates have been shown to reasonably represent the ability of Orthoptera to absorb solar radiant heat as well as indicate typical body temperatures when Orthoptera are unable to thermo-regulate (Lactin and Johnson 1998). The recorder was set to record temperatures in the surrogates every 15 min. for the duration of the field aspect of the study. In addition, air temperatures and precipitation were recorded daily by a weather station established in the study area for the duration of the study. Statistical Analysis. Field data were analyzed using an analysis of variance with the Tukey’s HSD Test to separate means when the ANOVA F ratio was significant. Analyses were performed with SYSTAT for Windows® (SPSS Inc. 1977). Mortality in laboratory incubations was manually analyzed with Fisher’s Exact Test.
Results and Discussion Field Cage Study No significant mortality was detected for 0-6 days after treatment (DAT) in the populations exposed to sprays of Beauveria bassiana GHA, Metarhizium anisopliae F52 or Metarhizium anisopliae DWR346, when compared to the oil only treated controls (Fig. 8, Table 1). At 7 DAT, DWR346 demonstrated significantly higher (19% vs. 2-4%) mortality than the other treatments, which were statistically equivalent. Mortality steadily increased in the populations treated with DWR346 through 26 DAT (90%) and rose to 94% at 47 DAT. The DWR346 treatment remained significantly higher than in untreated populations from 7 – 50 DAT and outperformed all other treatments for that period. Mortality in both B. bassiana GHA and M. anisopliae F52 increased slowly to 38 DAT and while numerically higher were not statistically higher than untreated populations. At
6

39 DAT mortality in M. anisopliae F52 treated populations increased to a level significantly higher (38%) than in untreated populations. At the end of the study both treatments with M. anisopliae were producing mortality significantly greater than occurred in the untreated populations. Mortality in untreated populations ranged from 0-13% during the study. Additional analysis using grasshopper feeding days (GFD) (accumulated area under the mortality curves) from day 0-50 showed only M. anisopliae DWR 346 significantly reducing grasshopper feeding days from 20-50 days after treatments compared to damage (GFD’s) in the carrier only treated populations. In this analysis all other treatments were statistically equivalent. (Fig. 9, Table 2). Laboratory Incubation Incubation in the lab at 28° C of two of the six replicates after 2 days in field cages (Fig. 10 ) resulted in B. bassiana GHA producing initial and 100% mortality at 3 and 19 DAT respectively; M. anisopliae F52 producing initial and 100% mortality at 4 and 7 DAT, respectively; and M. anisopliae DWR346 producing initial and 100% mortality at 2 and 4 DAT, respectively. Therefore, a lethal dose of all fungi were applied. Only non-optimal field temperatures for a particular isolate and or behavioral thermoregulation by the crickets prevented higher mortality from being expressed in the field. Evaluation of cadavers for presence of fungal outgrowth characteristic of Beauveria or Metarhizium as an indication of mycosis was planned to support the fungal cause of death conclusion. However, field cage cadavers resulting from all treatments were unavailable for evaluation of fungal outgrowth and sporulation because ants in the area rapidly removed cadavers. Often only a leg or portion of the carapace remained within a day of death. Mormon Cricket Surrogates – Prediction of Mortality Onset Data from the thermal surrogates provided time estimates for when mortality attributable to the fungal treatments should begin. The temperatures measured in the surrogates inside (on the ground, on the side of the cage, or foliage) and outside cages on the ground and at the plant canopy demonstrate the number of possible hours of the day where fungal growth could occur at different locations. It is apparent from the data that the recently designed cages (Fig 5) produced little if any cage effect in terms of temperature, as very little differences in temperatures were recorded inside and outside of cages. A 24-hour snapshot of these differences on June 15 illustrates the similarities (Figs. 11 and 12). To predict times for onset of mortality, growth rates for the individual fungi must be known. Laboratory studies (Jaronski, unpublished; Fargues et al. 1997; Ouedraogo et al. 1997) show all three isolates exhibit maximum growth at 28 °C. However, developmental rates above and below 28 °C vary among the three isolates studied (Table 3). For predictive purposes the amount of time individuals spent at temperatures that would produce 50-100% growth were accumulated. The temperature ranges used for B. bassiana GHA, M. anisopliae F52 and M. anisopliae DWR346 were 17.5 – 31.5 °C, 16.2 - 31.0° C and 16.5 - 33.5° C, respectively (Table 3).
7

Laboratory bioassays conducted with nymphal and adult Mormon crickets and/or grasshoppers (Jaronski unpublished) demonstrate that under optimal conditions, B. bassiana GHA, M. anisopliae F52 and M. anisopliae DWR346 will typically grow to produce mortality starting in 7-8 days (168-192 hrs), 5-6 days (120-144 hrs) and 3-4 days (72-96 hrs), respectively. When the accumulated days of 50-100 % growth for each isolate (Table 3) are plotted against their respective initial mortality levels, the in–field day for onset can be predicted. A limitation to this approach is that while Mormon crickets are mobile and can adjust their location and posture to change body temperature, the surrogates are fixed in position. The accumulated surrogate temperatures (from parameters in Table 3) at canopy and ground levels were similar and are seen in Figs. 13 and 14). Temperatures from surrogates on the ground indicated the onset of mortality for B. bassiana GHA, M. anisopliae F52 and M. anisopliae DWR346 to be 19, 12 and 7 days, respectively. Temperatures from surrogates at canopy level indicated the onset of mortality for B. bassiana GHA, M. anisopliae F52 and M. anisopliae DWR346 to be 18, 12 and 6 days, respectively (Figs. 13, 14, Table 4). These predictions were very similar to actual numerical and statistical in-field days where onset occurred with M. anisopliae DWR346. However, surrogate based predictors were less accurate for M. anisopliae F52 and B. bassiana GHA, Table 4. As indicated earlier, outside and inside cage temperatures were almost identical, indicating un-caged populations may experience similar temperatures to those experienced inside cages. However, care must be taken in extrapolating such considerations to normal field situations. While thermo-regulating behavior to raise body temperature at a specific location should not be effected by the cages, the cage does restrict the insect from other normal movements, particularly to other types of physical surroundings in the environmental, which can affect its body temperature and therefore the potential growth of an inoculated fungus.
Conclusions
Mormon crickets exposed to treated plots and moved to the laboratory confirmed that lethal doses of all 3 isolates had been applied. However, sufficient in-field time at temperatures permissive for fungal development to yield rapid mortality varied greatly among the isolates. Compared to the control, the new strain, Metarhizium anisopliae DWR 346 demonstrated significant mortality (P = 0.04) against immature Mormon crickets at 7 days after treatment and reached mortality levels highly significant (P < 0.001) and expected of current chemical treatments at about 3 weeks after treatment. This strain appears outstanding compared to other registered U. S. strains and offers excellent potential as a realistic non-chemical treatment for Mormon crickets and grasshoppers. The fungi M. anisopliae F52 and Beauveria bassiana GHA only produced significant mortality 39 days after treatment (P = 0.027) and (P = 0.113), respectively. The model accurately predicted the onset of mortality for M. anisopliae DWR 346 but underestimated onset for the other isolates. Surrogate thermal data will provide additional information for further development of reliable models for predicting onset of mortality.
8

The development of FAASSTT, coupled with the newly designed field cage will greatly facilitate developmental efforts with fungal pathogens in the future.
Acknowledgements
The authors wish to thank Glenn Hurruff for locating and obtaining permission to capture appropriate aged populations of Mormon crickets near Lodge Grass, Montana for testing. Thanks are extended to Justin Harper, USDA ARS Sidney, MT for collection of field and laboratory data.
References Cited
Analytical Software Inc. 2007. Statistix® 8 for Windows. Analytical Software. Tallahassee, Florida. Bradley, C. A., Wood, P. P., Black, W. E., Kearns, R. D., and Britton, J. 2002. Solid culture substrate including barley. US Patent Application Number 20020006650.
Chappell M. A and D. W. Whitman. 1990. Grasshopper thermoregulation. In: Chapman RF, Joern A, editors. The Biology of Grasshoppers. John Wiley & Sons. Fargues, J., M.S. Goettel, N. Smits, A. Ouedraogo, and M. Rougier. 1997. Effect of temperature on vegetative growth of Beauveria bassiana isolates from different origins. Mycologia 89(3):383-392. Foster, R. N. and K. C. Reuter. 1991. Using a spray tower to simulate aerially applied liquid sprays for bioassaying insects in the laboratory: standard operating procredure. Phoenix, AZ. U.S. Department of Agriculture, Animal and Plant Health Inspection Service, Methods Development, Rangeland Section. 5 pp. Foster, R.N. K. Christian Reuter, Jim Britton, and Cliff Bradley. 1996-1999. Lab Studies and Field Trials With the Fungus Beauveria bassiana Against Grasshoppers. In: Cunningham, G.L., and M.W. Sampson tech cords. Grasshopper integrated pest management user handbook. Tech Bull. 1809. Washington, DC: U.S. Dept. of Agriculture, Animal and Plant Health Inspection Service: VII.5-1—VII.5-8. Foster, R.N., K.C. Reuter, L. Black, E. Kahler, B. Fuller, and E.A. Flora. 1996. Laboratory evaluation of dose and manner of pickup of Spinosad on the migratory grasshopper,1995. Arthropod Management Tests. 21: 416. Foster, R. N., K. C. Reuter, L. K. Winks, T. E. Reule, and R. D. Richard. 2004. Biological Control of Leafy Spurge, Euphorbia esula L: Impacts of Eight Rangeland Grasshopper Insecticide Treatments on Aphthona lacertosa (Rosh.) and A. nigriscutis
9

Foster, R. N., Stefan Jaronski, K. Chris Reuter, and Lonnie R. Black. 2006. Field cage evaluations of Beauveria bassiana and Metarhizium anisopliae in spray and bait formulations for potential use against Mormon cricket in Idaho. Report. February, 2006. USDA-APHIS-PPQ-CPHST-DS&PMSL, Phoenix, Arizona, 21 pp. Foster, R. N., K. Chris Reuter, Lonnie R. Black, Stefan Jaronski and Justin Harper. 2007. Simulated aerial sprays of Beauveria bassiana and Metarhizium anisopliae against Anabrus simplex in Montana. Report. August, 2007. USDA-APHIS-PPQ-CPHST-DS&PMSL, Phoenix, Arizona, 33 pp. Henry, J. E., E. A. Oma, and J. A. Onsager. 1978. Relative effectiveness of ULV sprays application of spores of Nosema Locustae against grasshoppers. J. Econ. Entomol. 71: 629-32. Hernández-Velázquez, V.M., A.M. Berlanga-Padilla and E. Garza-Gonzales, 1997. Detection de Metarhizium flavoviride sobre Schistocerca piceifrons piceifrons (Orthoptera: Acididae) en la Isla Socorro, Archipielago de Revillagigedo, Mexico. Vedalia 4: 45–46. Inglis, G.D., D.L. Johnson, and M.S. Goettel. 1996. Effects of temperature and thermoregulation on mycosis by Beauveria bassiana in grasshoppers. Biological Control 7(2):131-139 Inglis, G.D.; G.M. Duke, L.M. Kawchuk, and M.S. Goettel. 1999. Influence of oscillating temperatures on the competitive infection and colonization of the migratory grasshopper by Beauveria bassiana and Metarhizium flavoviride. Biological Control 14(2): 111-120 Jaronski, S. T. and M. S. Goettel. 1997. Development of Beauveria bassiana for Control of Grasshoppers and Locusts. Memoires Entomological Society of Canada. 171: 225-237. Lactin, D. J., and D. L. Johnson. 1998. Environmental, physical, and behavioural determinants of body temperature in grasshopper nymphs (Orthoptera: Acrididae). Can. Entomologist 130(5): 551-577. Lomer, C.J., C. Prior and C. Kooyman, 1997. Development of Metarhizium spp. for the control of grasshoppers and locusts. Memoires Entomological Society of Canada 171: 265–286. Magalhaes, B.P., M. Faria, M.S. Tigano and B.W.S. Sobral, 1997. Characterization and virulence of a Brazilian isolate of Metarhizium flavoviride Gams & Rozsypal (Hyphomyces). Memoires Entomological Society of Canada 171: 313–321. Magalhaes, B.P., M.S. Tigano, I. Martins, H. Frazao, and H.G. Ramirez. 2003 Characterization of a Peruvian isolate of Metarhizium anisopliae var. acridum, a pathogen of grasshoppers. Pesquisa Agropecuaria Brasiliera 38(12): 1469-1475.
10

Milner, R.J. 1997. Metarhizium flavoviride (FI985) as a mycoinsecticide for Australian acridids. Memoires Entomological Society of Canada 171: 287–300. Milner, R.J., L.B. Lozano, F. Driver, and D. Hunter. 2003. A comparative study of two Mexican isolates with an Australian isolate of Metarhizium anisopliae var. acridum – strain characterization, temperature profile and virulence for wingless grasshopper, Phaulacridium vittatum. BioControl 48: 335–348. Onsager, J.A., N.E. Ress, J.E. Henry, and R.N. Foster. 1981. Integration of bait formulations of Nosema locustae and carbaryl for control of rangeland grasshoppers. Jour. Econ. Entomol. 74: 183-187. Ouedraogo, A., J. Fargues, M.S. Goettel, and C.J. Lomer. 1997. Effect of temperature on vegetative growth among isolates of Metarhizium anisopliae and M. flavoviride. Mycopathologia 137:37-43. Reuter, K.C., R.N. Foster, L. Black, and J. Britton. 1996. Laboratory evaluation of Beauveria bassiana with an added chemical stressor. 1995. Arthropod Management Tests. 21:415. SPSS Inc. 1997. SYSTAT for Windows: Statistics, SPSS Inc., Chicago, Illinois. Turnbow, J.H. 1998. Temperature-sensitive Beauveria bassiana mycosis in the Mormon cricket, Anabrus simplex. M.S. Thesis. Montana State University, Bozeman MT. U.S. Environmental Protection Agency Office of Pesticide Products, Biopesticides and Pollution Prevention Division. 2000. Beauveria bassiana Strain GHA (128924). Technical document Available at http://www.epa.gov/oppbppd1/biopesticides/ingredients/tech docs/tech 128924.htm. U.S. Environmental Protection Agency Office of Pesticide Products, Biopesticides and Pollution Prevention Division. 2003. Metarhizium, anisopliae strain F52. Available at http://www.epa.gov/oppbppd1/biopesticides/ingredients/tech docs/brad 029056.pdf. Vaughn, James L., W. M. Brooks, J. L. Capinera, Terry L. Couch, and Joe V. Maddox. 1996. Utility of Nosema Locustae in the Suppression of Rangeland Grasshoppers. In: Cunningham, G.L., and M.W. Sampson tech cords. Grasshopper integrated pest management user handbook. Tech Bull. 1809. Washington, DC: U.S. Dept. of Agriculture, Animal and Plant Health Inspection Service: I.4-1 – I.4-5.
11

Figure 1. Ring marking centermost area of 0.508 m diameter grass plots.
Figure 2. Field Aerial Application Spray Simulation Tower Technology (FAASSTT) used to apply treatments in 2007.
12

Figure 3. Close-up of FAASSTT. Figure 4. Detailed protocol for FAASSTT.
The FAASSTT procedure involves three people, an applicator, a regulator/evaluator and locator. The evaluator places spray card near the center of the area to be sprayed. Locator opens top inspection door and moves and precisely locates (centers) spray unit directly over the area to be sprayed. (Location identified by 0.1 m2 ring to assist in centering). Locator closes top inspection door. Applicator agitates material and draws predetermined amount of material into syringe, removes bubbles, adjusts volume in syringe for accuracy, attaches hilt and inserts syringe into the side port of the airbrush. Regulator turns on the compressed air source and sets the pressure as predetermined. Applicator checks (through side service door) airbrush for air movement through system and wipes off any excess material from the airbrush tip. Locator closes side service door. Applicator dispenses material into the stream of air flowing through the airbrush. Applicator removes the syringe dispenser from the airbrush side port. Regulator dispenses two “puffs” of squeeze bottle supplied air through the side port of the airbrush to insure all material dispensed has been applied through the side port and then adjusts the pressure regulator to zero. Locator opens side inspection door and moves spray unit from treated area and places it on the next area to be treated. Evaluator retrieves and examines the spray card to determine positive deposition of material on the desired area. Process repeated.
13

Figure 5. Hardware cloth cage used to minimize cage effect.
Figure 6. Field cages on grass plots near Sidney, Montana, 2007.
14

Figure 7. Mormon cricket thermal surrogates positioned at ground and canopy levels.
0
20
40
60
80
100
0 10 20 30 40 5Days after treatment
Aver
age
% m
orta
lity
0
M. anisopliae DWR 346M. anisopliae F52B. bassiana GHACarrier oil
Figure 8. Mortality of immature Mormon crickets exposed to sprays of Beauveria bassiana GHA, Metarhizium anisopliae F52, Metarhizium anisopliae DWR346 and canola oil diluent.
15

0
500
1000
1500
2000
2500
0 10 20 30 40 5Days after treatment
Cum
ulat
ive
GFD
0
M. anisopliae DWR346
M. anisopliae F52
B. bassiana GHA
Carrier oil
Figure 9. Grasshopper Feeding Days accumulated between June 5 and July 25 near Sidney, Montana, 2007.
0
20
40
60
80
100
1 4 7 10 13 16 1Days after treatment
% M
orta
lity
9
DWR 346F52GHAOil
Figure 10. Mortality of Mormon crickets exposed for two days to treated plots then brought indoors for incubation at 28° C.
16

05
1015202530354045
0 4 8 12 16 20 2
24 hr period
Tem
pera
ture
oC
4
Inside cage, ground
Outside cage, ground
Figure 11. Twenty-four hour snapshot of temperatures inside and outside cages at ground level.
05
1015202530354045
0 4 8 12 16 20 2
24 hr period
Tem
pera
ture
o C
4
Inside cage, canopy
Outside cage, canopy
Figure 12. Twenty-four hour snapshot of temperatures inside and outside cages at canopy level.
17

Figure 14. Cumulative fungal growing hours inside cage at ground level through time.
Figure 13. Cumulative fungal growing hours inside cage at canopy level through time.
18
Cumulative fungal growing degree hours (In cage, in canopy)(Based on Mormon cricket surrogate temperatures)
0
96
192
288
384
480
576
672
0 10 20 30
Days after treatment
Cum
ulat
ive
degr
ee h
ours
Cumulative fungal growing degree hours (In cage, on ground)(Based on Mormon cricket surrogate temperatures)
0
96
192
288
384
480
576
672
0 10 20 30 40 50 60
Days after treatment
Cum
ulat
ive
degr
ee h
ours
F52 16.2 - 31.0 CDWR346 16.5 - 33.5 CGHA 17.5 - 31.5 C
F52 16.2 - 31.0 CDWR346 16.5 - 33.5 CGHA 17.5 - 31.5 C
Ma DWR 346 mortality starts
Ma F52 mortality starts
Bb GHA mortality starts
Ma DWR 346 mortality start
Ma F52 mortality starts
Bb GHA mortality starts
s
40 50 60

19
Table 1. Mortality of immature Mormon crickets exposed to sprays of Beauveria bassiana GHA, Metarhizium anisopliae F52, Metarhizium anisopliae DWR346 and canola oil diluent. DAT – mean % mortality 1
Trt 1 2 3 4 5 6 7 8 9 10 11 12 13 14 15 16 17 18 19 20 21 22 23 24 25 DWR 346 0 a 0 a 0 a 2 a 4 a 8 a 19 a 23 a 31 a 33 a 33 a 38 a 38 a 40 a 50 a 54 a 56 a 63 a 67 a 71 a 75 a 81 a 85 a 88 a 88 a F52 0 a 0 a 4 a 4 a 4 a 4 a 4 b 6 ab 6 a 6 a 6 a 6 ab 6 a 6 b 10 b 10 b 10 b 10 b 13 b 15 b 17 b 17 b 19 b 19 b 19 b GHA 0 a 0 a 0 a 2 a 2 a 2 a 2 b 2 b 6 a 8 a 8 a 10 ab 10 a 10 ab 13 ab 17 ab 17 b 17 b 17 b 17 b 21 b 21 b 21 b 21 b 25 b Oil 0 a 4 a 4 a 4 a 4 a 4 a 4 b 4 b 4 a 4 a 4 a 4 b 6 a 6 b 8 b 8 b 10 b 10 b 10 b 13 b 13 b 13 b 13 b 13 b 13 b DAT – mean % mortality Trt 26 27 28 29 30 31 32 33 34 35 36 37 38 39 40 41 42 43 44 45 46 47 48 49 50 DWR 346 90 a 90 a 90 a 90 a 90 a 90 a 90 a 90 a 90 a 90 a 90 a 90 a 90 a 90 a 90 a 90 a 90 a 92 a 92 a 92 a 92 a 94 a 94 a 94 a 94 a F52 21 b 25 b 25 b 25 b 27 b 27 b 27 b 27 b 27 b 27 b 27 b 27 b 27 b 38 b 38 b 40 b 40 b 40 b 40 b 40 b 40 b 40 b 40 b 40 b 40 b GHA 25 b 25 b 25 b 25 b 25 b 27 b 27 b 27 b 27 b 27 b 27 b 27 b 27 b 31 bc 31 bc 31 bc 31 bc 31 bc 33 bc 33 bc 33 bc 33 bc 33 bc 33 bc 33 bc Oil 13 b 13 b 13 b 13 b 13 b 13 b 13 b 13 b 13 b 13 b 13 b 13 b 13 b 13 c 13 c 13 c 13 c 13 c 13 c 13 c 13 c 13 c 13 c 13 c 13 c
1 ANOVA conducted on unranked data. Means in a column followed by the same letter are not significantly different (P ≤ 0.05).

Table 2. Grasshopper Feeding Days accumulated between June 5 and July 25 near Sidney, Montana, 2007. Mean no. GFD – days after treatment 1
Treatment 10 20 30 40 50 Ma DWR346 118 a 177 a 194 a 207 a 216 a Ma F52 127 a 236 b 331 b 416 b 488 b Bb GHA 129 a 233 b 325 b 411 b 492 b Canola oil 128 a 238 b 343 b 448 b 553 b 1 ANOVA conducted on unranked data. Means in a column followed by the same letter are not significantly different (P ≤ 0.05). Table 3. Temperature parameters for fungal growth. Bb GHA Ma F52 Ma DWR 346 0 growth ~ 35.0 ~ 35.0 ~ 36.0 20% of max growth 33.4 33.4 35.0 50% of max growth 31.5 31.0 33.5 max growth 28.0 28.0 28.0 50% of max growth 17.5 16.2 16.5 20% of max growth 9.0 12.0 11.3 0 growth 5.0 5.0 8.0 Table 4. Onset of mortality. Surrogates Indicate Field Cages Show Isolate In Cage - ground In Cage - canopy Numerical Statistical
(P=) Ma DWR346 7 days 6 days 6-7 days 7 days 0.04) MA F52 12 days 12 days 21-23 days 39 days
(0.03) Bb GHA 19 days 18 days 12-16 days 39 days
(0.11)
20
Increasing the field activity period of spinosad against rangeland grasshoppers: Field evaluation of initial mortality and residual activity
of six formulations
R. Nelson Foster 1, K. Chris Reuter 1, Lonnie R. Black 1, Bruce Helbig 2,
Cheryl Huddleston 2, David Cowan 3 and Daryl Hill 4
December 2007
1

December, 2007
Increasing the field activity period of spinosad against rangeland grasshoppers: Field evaluation of initial mortality and residual activity
of six formulations
R. Nelson Foster 1, K. Chris Reuter 1, Lonnie R. Black 1, J. Bruce Helbig
2, Cheryl Huddleston 2, David Cowan 3 and Daryl Hill 4
1USDA-APHIS-PPQ-CPHST-Decision Support and Pest Management Systems Laboratory, Phoenix, Arizona.
2USDA-APHIS-PPQ-Pierre, South Dakota. 3USDA-APHIS-PPQ-CPHST-Pest Survey and Detection Exclusion
Laboratory, Otis, Massachusetts 4USDA-APHIS-PPQ-Aircraft and Equipment Operations, Mission, Texas.
Cooperators:
Mark Hertline, Ray Boucher and Doris Paroonagain, Dow AgroSciences Agenor Mafra-Neto and Reginald Cooler ISCA Technologies
Jack Jenkins, Pacific Biocontrol Corporation
2

Abstract
Five experimental formulations containing spinosad were evaluated to determine if the activity in the field against rangeland grasshoppers could be extended compared to the standard spinosad formulation, Tracer. Heavy rain that occurred 1-5 days after treatment most likely had a negative impact on (1) initial field mortality, (2) extended persistence of treatment activity measured in field cages and (3) treatment residues on range grass samples. However, all treatments produced significant initial mortality and were statistically equivalent at 1, 3 and 7 days after treatment except for PBC which produced significantly lower mortality than the Tracer standard at 3-7 days after treatment. Not surprising, the two formulations resulting in the lowest initial field mortality were applied the day preceding the rain. The PBC formulation demonstrated mortality attributable to residual activity statistically greater than that produced by the Tracer standard in 3 of 12 post-treatment interval cases. Numerically, the residual activity of Tracer was exceeded by the other formulations in a total of 21 of 60 interval-exposure cases. Results from residue analysis from the range grass samples were inconclusive. The varying spinosad levels measured on the day of treatment is currently unexplained. While rain likely resulted in underestimating the residual activity of all treatments, NAF and PBC Spray, probably would have been impacted the most. Both were sprayed on the grass one day prior to the rain. This one day interval between treatment and rain compares with 3 – 5 days for the other treatments. Therefore, the residual mortality levels for both Spinosad NAF and PBC Spray may be further under-estimated compared to the other treatments in this study. However, the evidence both statistical and numerical indicates that the persistence of spinosad can be extended.
3

Introduction
Rangeland grasshopper treatments in USDA sponsored programs in the U.S. rely on traditional insecticide sprays or baits, except for the insect growth regulator, diflubenzuron. Sensitive areas commonly encountered within the western states, in potential program areas, commonly preclude the use of traditional insecticide treatments. The number of sensitive situations is increasing and in areas of grasshopper infestations these situations at best complicate and more often prevent much needed local or area-wide treatments of grasshoppers and/or Mormon crickets on rangeland. Treatments allowed in such areas could be extremely important to both local and area- wide control efforts. Spinosad (the active ingredient (AI) in Tracer) is a bacteria-derived toxin which has shown activity against grasshoppers (Foster et al. 1996, 2002, 2004 and 2006) and is registered for use against other pests on organically grown crops. If developed to be economical for controlling rangeland grasshoppers, such a treatment might be accepted in many, if not all, sensitive areas. Spinosad doses of 42.5 and 85 g AI/acre (3 and 6 fluid oz/acre of Tracer) have shown excellent control when aerially applied to grasshoppers on rangeland. While the higher dose showed significant activity diminishing between 7 and 14 days after treatment, activity of the lower dose disappeared between 0 and 7 days after treatment (Foster et al. 2002). Although these rapid and high kill rates with short residual appear ideal for rangeland grasshoppers, the expected costs at such rates would probably preclude their use. Subsequent studies showed that 21.3 to 42.5 g AI/acre of Spinosad (1.5 to 3 fl oz/acre of Tracer) yielded acceptable control (84% to 98%) while 5.3 and 10.6 g AI/acre (0.375 and 0.75 fl oz/ac of Tracer) both yielded 78% mortality, probably slightly less than acceptable (Foster et al 2004). Most of the doses in the later study were considered too expensive. However, the lowest dose 5.3 g AI/acre (0.375 fl oz/ac of Tracer) was estimated to be economically competitive with existing spray treatment options. Additionally and as expected, this dose showed no residual activity beyond the day of treatment. Lengthening the residual activity of low dose treatments may result in higher mortality levels. Any improvements in the lower dose formulation that could even slightly increase resulting mortality levels would appear to make such a treatment acceptable in terms of both control and cost levels. With some other pests (pink bollworm and gypsy moth), liquid formulations containing insect pheromones depend on extended persistence for economy. If the core components of those formulations or other components could be combined with Spinosad to produce longer treatment activity, a lower dose producing acceptable mortality that is cost competitive, may be realized. In an attempt to extend the residual activity of a low dose of Spinosad to increase mortality, the following study was conducted.
4

Objectives
Demonstrate that the length of residual activity of Spinosad could be extended by modifying the formulation. Evaluate and compare aerial applications of six formulations (five new) containing Spinosad for initial activity against field populations of grasshoppers on rangeland. Evaluate and compare aerial applications of six formulations (five new) containing Spinosad in field cages for potential extended activity. Evaluate and compare aerial applications of six formulations (five new) containing Spinosad for extended persistence using residue analysis of range grasses. Determine if extended residual activity can be translated into increased overall mortality.
Materials and Methods
Study Area The center of the study was located in Fall River County in southwestern South Dakota, approximately 11 miles west and 8 miles north of the town of Edgemont on the Mark Tubbs ranch. The general location was selected because of the density of grasshoppers, history of grasshopper problems and the abundance of contiguous grasshopper infested rangeland at a time when cattle were not present. Cattle would complicate the field cage portion of the study. Field Study (Initial field efficacy) Six different formulations containing Spinosad were each aerially applied to square 9.9 acre rangeland plots. Each treated plot was embedded within a separate square 40 acre plot to insure against contamination from other treatments (Fig. 1). An untreated plot, also embedded, was included in the experimental design. The formulation containing Nu-Lure (a proteinaceous liquid designed for use as an attractant and bait in insecticide sprays – Miller Chemical and Fertilizer Corp) and Tracer (Dow AgroSciences) (premixed in 1 gallon of water and then mixed with 19 gal of Nu-Lure), was applied on July 3. The Nu-Lure was screened through 24 mesh brass screen to remove large particles before being combined with the Tracer. The ISCA Technologies formulation containing spinosad (formulated by the company) and Tracer (the standard formulation containing spinosad - Dow AgroSciences) mixed with water were each applied on July 4. A formulation containing Tracer, water, 3% Grandma”s Unsulphured Molasses and Nalcotrol (Monterey Chemical Company) at one ounce per 10 gallons of mix was applied on July 5. The NAF (26% spinosad wettable granular) formulation (DowAgroScience) and the Pacific Biocontrol formulation (Pink Bollworm Pheromone formulation and Tracer) were each applied on July 7. All treatments were applied at 32 fluid oz/acre and contained 21.3 g AI Spinosad/acre.
5

Treatments were applied with a Cessna Ag Truck owned by the USDA, Animal and Plant Health Inspection Service (APHIS) and equipped with winglets (DBA- Ag Tips: Clack Oberholtzer, Alberta, Canada). Winglets are added to spray aircraft to reduce the production of fine droplets and to improve handling characteristics. The aircraft was operated by a USDA – APHIS pilot. The aircraft was equipped with a standard commercial spraying system and differentially corrected guidance and recording system. Ground personnel also provided guidance and ensured acceptable operating parameters during application. All treatments were applied to 75 foot wide swaths and occurred from an altitude of 35 to 50 feet at 120 mph. Prior to application, the aircraft spray system was calibrated to operate under parameters which resulted in delivery of spray within 1% of the desired rate per acre. Calibration was accomplished by collecting and measuring the amount of material sprayed through each nozzle for a predetermined amount of time, and making adjustments in pressure until the desired output was achieved. The specific mix, total volume applied per acre, number of nozzles, nozzle screen size, nozzle tip size, boom pressure, aircraft speed, and swath width used for each of the 6 different treatments is summarized in Table 1. Meteorological conditions recorded during application are summarized in Table 2. Daily minimum and maximum temperatures and precipitation recorded for the duration of the study are shown in Figure 2. Generally, grasshopper density and species composition sampling followed protocols established by Foster and Reuter, 1996. Grasshopper populations in treated and untreated plots were counted and sampled 1 to 3 days before treatment and at 1, 3 and 7 days after treatment. The untreated control plot was also counted and sampled on any day a treated plot was monitored. Grasshopper densities were determined by counting grasshoppers in (40) 0.1 m2 rings arranged in 4 rows of 10 immediately east of the center of each 10 acre plot. Rows were separated from adjacent rows by 5 yards. Within each row, rings were separated from adjacent rings by ca, 5 yards. Because of the plot size limitations in this study, each row was considered a replicate. The abundance of each species was determined from uniform sweep samples taken at each site (Foster and Reuter, 1996). Each sample consisted of 50 high and fast sweeps and 50 low and slow sweeps. Low and slow sweeps performed at ground level insured capture of very young instars and less active grasshopper species while high and fast sweeps performed at the canopy of the vegetation insured capture of older instars and the more active species. Sweep samples were always collected immediately after grasshopper densities had been determined at each site on each visitation. Densities of individual species can be determined by multiplying the frequency of occurrence times the total density of grasshoppers at the same site. After collection, samples were cold stored until they could be sorted and identified in the lab.
Field Cage Study (Evaluation of extended activity) To determine the length of residual activity of Spinosad in candidate formulations for comparison with the standard Tracer formulation, small bucket cages (two gallon bottomless buckets modified with screen sides and top) were established on plots treated with each of the formulations. Ten cages (replicates) were established immediately west
6

(Fig. 3) of the center of each plot (including the untreated plot) on 0, 3, 6, 9, 12 and 15 days after treatments occurred. At each interval, five of the cages were each stocked with 5 Ageneotettix deorum (fifth instar – adult stage). The remaining 5 cages were each stocked with 5 adult Aulocara elliotti. Grasshoppers for cage studies were collected from a nearby untreated area. Grasshopper mortality within cages was monitored daily for 7 days after each set up Grass analysis for spinosad An approximate 500 g composite grass sample was taken at each of the post treatment evaluation intervals, The sample was taken in the vicinity of the rings by clipping numerous randomly selected clumps of grasses and combining in a freezer zip loc bag until the bag was essentially full. The samples were freezer stored until the end of the study, when all samples were cold shipped to the USDA, APHIS, PPQ, CPHST, Pest Survey and Detection Laboratory in Otis, Massachusetts for analysis. The total amount of spinosad in the grass samples was determined with the Strategic Diagnostics Inc. Spinosad RaPID Assay Spinosad Test Kit, part number A00178, an Enzyme-Linked ImmunoSorbent Assay (ELISA) using a method adapted from the work of Young et al. (2000). The composite grass samples were held in cold storage at -20o C for a period of -?- months. After removal from cold storage, the samples were transferred to brown paper bags, and air dried for a period of one week at room temperature. The top of the bag was folded over to prevent exposure to light. The samples were homogenized and ground to a medium fine powder using a commercial Waring food blender (number 7010, model 31BL91) and stainless steel 32 fl. oz. container (CAC33). The powder was then transferred to individual polypropylene cups and returned to cold storage until the spinosad extraction was performed. After allowing the samples to warm to room temperature, 5 g of powder was transferred to a 60 ml polypropylene centrifuge tube containing 10 ml of 80% acetonitrile in water. The samples were shaken on low speed at room temperature for a period of four hours using an Eberbach model 6000 shaker and then centrifuged for 10 minutes at 6,000 RPM. A 1 ml aliquot of supernatant was then transferred to a 10 ml polypropylene vial containing 9 ml of SDI Sample Diluent, part # 7800000. The diluted samples were then mixed by vortex mixer for 15 seconds on high. Serial dilutions of the samples were then necessary to bring the spinosad concentrations into the range (0.05 – 1.0 ng/ml) that the RaPID Assay Spinosad Test Kit was designed to read. The dilution factor varied by sample and was dependent upon the initial concentration of the applied products and decreased as the time period between application and sample date increased. 1 ml aliquots of each the final dilutions were then transferred to 1.5 ml plastic centrifuge tubes and centrifuged for five minutes at #### RPM. 200 μl aliquots of each sample were transferred to the ELISA test tubes of the Rapid Assay Spinosad Test Kit and the ELISA was performed per the kit instructions. After completing the final step of ELISA, the contents of the test tubes were poured into 1.5 ml methacrylate semimicro cuvetts.
7

The absorbance of each sample was measured using a Beckman Coulter, DU530 Spectrophotometer at a wavelength of 450 nm. Standard calibration curves were constructed based on the absorbencies of the spinosad standards and their known concentrations using the SDI Ln/Logit B Microsoft Excel spreadsheet. To ensure internal validity, the curves had correlations (r) of 0.990 or greater and percent coefficients of variation (%CV) of 10% or less as specified by the test kit instructions. The absorbance of each sample was fit to the standard calibration curve in order to determine the spinosad concentration. Concentrations below the limit of detection, 0.05 ng/ml were reported as non-detectable (ND). Samples with concentrations above the limit of detection, 1.0 ng/ml were diluted so that they fell within the detectable range of the kit. The concentrations were then multiplied by their corresponding total dilution factor in order to arrive at the concentration of spinosad in the original grass samples. Analysis For the general population, data were expressed as percent survival based on pretreatment counts in the same plot or cage and were adjusted for the natural population change by the method of Connin and Kuitert (1952) by using the mean values of the untreated plots on the appropriate day. This allowed for converting data from percentage mortality to percentage control and accommodated the natural population change to insure against natural mortality and other environmental factors that affect grasshopper counts, which can confound real differences between treatments. The adjusted percentage control of the treatment (which takes into account natural changes in the untreated population) was calculated by the formula 100 (1 – Ta x Cb/Tb x Ca).Where Tb equals the total population of grasshoppers counted before the plot was treated, Ta equals the total counted after treatment, Cb equals the total counted for the check sites before treatment, and Ca equals the total counted for the check sites after treatment. Percentage control data were converted to rank data (Conover and Iman, 1981). An analysis of variance was performed with the Tukey multiple comparison test used to separate means. The Kruskal-Wallis one way analysis of variance with a non-parametric Tukey type multiple comparison was also used in an additional analyses (Zar, 1974). All analyses were performed with Systat 6.1 For Windows.
Results and Discussion
Field Study (Initial field efficacy) The species composition and age structure of the grasshopper population in the study area prior to treatment is summarized in Table 3.
8

All treatments produced mortality significantly greater than occurred in untreated populations. Mortality increased with all treatments from 1-3 days after treatment, but unexpectedly decreased by 7 days after treatment. This decrease was not recovery as no evidence of recovery has been seen in earlier studies (Foster et al. 2002 and Foster et al. 2004).The decrease was attributed to an increase in population due to movement into the small plots and some possible additional hatch of the late hatching and over-wintering species, Erittetix simplex and Psoloessa delicatula (Table 3). Mean grasshopper populations increased from 12.25 to 20/m2 in the untreated plot during the study (Figure 4). When densities were adjusted (Table 4) for population changes that occurred in the untreated plot, there was no significant difference in mortality produced by any of the treatments at one day after treatment, where mean control ranged from 41 to 70%. At both 3 and 7 days after treatment all treatments produced statistically equivalent mortality except for the PBC spray. The Nu-Lure with Tracer treatment produced significantly greater mortality than the PBC spray with Tracer but was equivalent in performance with all other treatments. The PBC spray with Tracer was statistically equivalent to all of the treatments except Nu-Lure with Tracer, which was superior. The dose selected for this study was predicted to produce about 84% mortality at three days after treatment with the standard Tracer treatment. Mortality with this treatment in our study was substantially higher, resulting in 70%, 96% and 84% mortality at 1, 3 and 7 days post treatment respectively (Table 4) compared to 52%, 84% and 85% mortality at 1,3 and 6 days post treatment in an earlier study (Foster et al. 2004). It is important to note that 2.157 in. of rain was recorded in the plots late on July 8 (recorder read on July 9), 1-5 days after treatment, depending on the specific treatment. This rain could have washed some of the material from the vegetation and may be significant because rangeland grasshopper mortality resulting from spinosad is entirely attributable to ingestion of sprayed vegetation (Foster et al. 1996). While, substantial mortality was seen for all of the treatments, by 3 days after application, both of the lowest performing treatments, NAF and PBC Spray, had only been available for uptake for one day prior to the rain. This one day interval between treatment and rain compares with 3 – 5 days for the other treatments (Table 4). Therefore, the mortality levels for both Spinosad 36% WG and PBC Spray may be under-estimated in this study. Field Cage Study (Evaluation of extended activity) Aulocara elliotti (non-ranked data) When insects were exposed to treated vegetation on the day of treatment (Figure 5, Table 5), Tracer at 3-7 days after exposure (DAE), NuLure at 2-7 DAE, ISCA at 3-7 DAE and Nalcotrol at 4, 6 and 7 DAE produced mortality greater than occurred in the untreated populations. All of these treatments were statistically equivalent except for Tracer and Nalcotrol which produced higher mortality at 3-7 DAE. At this post treatment interval no treatments performed better than the standard Tracer treatment. When insects were exposed to treated vegetation 3 days after treatment (Figure 6, Table 6), only NuLure at 4-7 DAE produced mortality greater than occurred in the untreated
9

population. At this post treatment interval no treatments performed better than the standard Tracer treatment. When insects were exposed to treated vegetation 6 days after treatment (Figure 7, Table 7), Tracer at 7 DAE and PBC at 5-7 DAE produced mortality greater than occurred in untreated populations. However, at this post treatment interval, PBC at 5 DAE produced mortality significantly greater than the standard Tracer treatment. When insects were exposed to treated vegetation 9 days after treatment (Figure 8, Table 8), only Tracer at 3-6 DAE produced mortality greater than occurred in the untreated population. At this post treatment interval no treatments performed better than the standard Tracer treatment. When insects were exposed to treated vegetation 12 days after treatment (Figure 9, Table 9), PBC at 5-6 DAE and NAF at 5 DAE produced mortality greater than occurred in the untreated populations. Mortality resulting from the standard Tracer treatment was statistically equivalent to what occurred in the untreated population at 1-7 DAE. However, at this post treatment interval, PBC at 5-6 DAE produced mortality significantly greater than the standard Tracer treatment. The study was terminated early at 4 DAE for the insects exposed to treated vegetation 15 days after treatment. During this time there was no significant difference between any of the treatments including the untreated population (Figure 10, Table 10). In summary, with Aulocara elliotti cage studies, only PBC produced any cases where mortality statistically exceeded that produced by the standard Tracer. This occurred when insects were exposed to treated vegetation 6 and 12 days after treatments occurred, 5 DAE and 5-6 DAE, respectively for each of those post treatment intervals prior to exposure. Ageneotettix deorum (non-ranked data) When insects were exposed to treated vegetation on the day of treatment (Figure 11, Table 11), Tracer at 3-7 DAE, NuLure at 2-7 DAE, ISCA at 3-7 DAE, Nalcotrol at 3-7 DAE, and NAF at 4-5 DAE produced mortality greater than in untreated populations. At this post treatment interval no treatments performed better than the standard Tracer treatment although NuLure and Nalcotrol treatments resulted in substantially higher numerical values. When insects were exposed to treated vegetation 3 days after of treatment (Figure 12, Table 12), Tracer at 1 DAE, and ISCA at 6-7 DAE produced mortality greater than in untreated populations. At this post treatment interval no treatments performed better than the standard Tracer treatment. When insects were exposed to treated vegetation 6 days after treatment (Figure 13, Table 13), there was no difference seen between any of the treatments including the untreated populations.
10

When insects were exposed to treated vegetation 9 days after treatment (Figure 14, Table 14), only Tracer at 4-7 DAE produced mortality greater than occurred in the untreated population. At this post treatment interval no treatments performed better than the standard Tracer treatment. When insects were exposed to treated vegetation 12 days after treatment (Figure 15, Table 15), only PBC at 5 DAE produced mortality greater than in untreated populations. However, PBC at 5-7 DAE produced mortality significantly greater than the standard Tracer treatment. The study was terminated early at 4 DAE for the insects exposed to treated vegetation 15 days after treatment. During this time there was no significant difference between any of the treatments including the untreated population (Figure 16, Table 16). In summary, with Ageneotettix deorum cage studies, only PBC produced any cases where mortality statistically exceeded that produced by the standard Tracer. This occurred when insects were exposed to treated vegetation 12 days after treatment at 5-7 DAE. It is noteworthy that this is consistent with the results with Aulocara Elliott that demonstrated a significant higher mortality than the standard Tracer treatment on 6 and 12 days after treatment. When the numerical values are examined after 7 days of exposure at each of the post-treatment intervals, numerous cases suggest potential extension of residual activity. With Aulocara elliotti, 8 out of 30 cases show higher mortality compared to the Tracer standard (Table 17). With Ageneotettix deorum 13 of 30 cases demonstrate higher mortality compared to the Tracer standard. (Table 18). These numerical comparisons are valuable since low observation numbers at each interval for each grasshopper species (5 grasshoppers / each of 5 cages) made statistical separation of means difficult. As noted earlier, very heavy rain occurred 1-5 days after treatment, depending on the specific treatment. Because fine spray droplets were applied to the vegetation to insure complete coverage it is not unreasonable to believe that a heavy rain would have some impact on the amount of droplets remaining on the vegetation. Again, this is important because rangeland grasshopper mortality resulting from spinosad is entirely attributable to ingestion of sprayed vegetation (Foster et al. 1996). Most of the data was collected after the heavy rain. Data collected before the heavy rain is denoted in red in Tables 5, 6, 11 and 12, all other data shown in the tables occurred after the rain. While reduced mortality due to wash off is suspected, residual activity was indicated when mortality was greater than occurred in the untreated populations (three cases statistically and 21 cases numerically). While rain likely resulted in underestimating the residual activity of all treatments, NAF and PBC Spray, probably would have been impacted the hardest. Both were sprayed on the grass one day prior to the rain. This one day interval between treatment and rain compares with 3 – 5 days for the other treatments (Table 4). Therefore, the residual mortality levels for both NAF and PBC Spray may be further under-estimated compared to the other treatments in this study. Grass analysis for spinosad
11

Results from the grass analysis were unexpected and considered inconclusive (Fig. 17). Treatment day levels (day 0) of spinosad varied greatly among the 6 formulations. Although, all treatments were expected to demonstrate similar levels at 0 day, beginning levels ranged from 4,488 ng/ml for NAF to 11,353 ng/ml for NuLure. All treatments showed equivalent and very little residual at 6 days after treatment. It is important to note that the lowest day 0 residuals, NAF and PBC formulations, were applied closest to the rain event (one day) and therefore offered the shortest cure time if not the greatest wash-off potential. The variation in initial levels of spinosad in the grass sample drastically impacted subsequent post treatment interval residual evaluation and is currently unexplained.
Conclusions
Heavy rain which occurred 1-5 days after treatment most likely had a negative impact on (1) initial field mortality, (2) extended persistence of treatment activity measured in field cages and (3) treatment residues on range grass samples. However, all treatments produced significant initial mortality and were statistically equivalent at 1, 3 and 7 days after treatment except for PBC which produced significantly lower mortality than the Tracer standard at 3-7 days after treatment. Not surprising, the two formulations resulting in the lowest initial field mortality were applied the day preceding the rain. The PBC formulation demonstrated mortality attributable to residual activity statistically greater than that produced by the Tracer standard in 3 cases. (Aulocara elliotti – at 6 DAT and 5 DAE and at 12 DAT and 5-6 DAE; Ageneotettix deorum – at 12 DAT and 5-7 DAE). Numerically (in terms of mortality), the residual activity of Tracer was exceeded by the other formulations in a total of 21 of 60 cases. Numerically, PBC, NU-Lure and NAF exceeded Tracer in mortality attributable to residual activity in 4 of 6, 2 of 6 and 2 of 6 cases respectively, using Aulocara elliotti. Numerically Nu-Lure, ISCA, Nalcotrol, PBC and NAF exceeded Tracer in mortality attributable to residual activity in 3 of 6, 3 of 6, 3 of 6, 2 of 6 and 2 of 6 cases respectively, using Ageneotettix deorum. Results from residue analysis from the range grass samples were inconclusive and the varying levels measured on the day of treatment are currently unexplained. While rain likely resulted in underestimating the residual activity of all treatments, NAF and PBC Spray, probably would have been impacted the most. Both were sprayed on the grass one day prior to the rain. This one day interval between treatment and rain compares with 3 – 5 days for the other treatments. Therefore, the residual mortality levels for both Spinosad NAF and PBC Spray may be further under-estimated compared to the other treatments in this study. Most importantly, the evidence both statistical and numerical indicates that the persistence of spinosad can be extended. Additional development could yield a usable and economic formulation for grasshoppers on rangeland. To insure that the potential of some of the formulations studied are not excluded from further development the study is planned to be repeated on a smaller scale in the winter in Phoenix, Arizona by spraying potted grass in the lab followed by outside exposure and bioassay with lab reared grasshoppers.
12

Acknowledgements
The authors wish to thank Bob Ecles (Wilbur- Ellis) for supplying Nalcotrol, which is no longer produced, Randy Hedge (Edgemont City Manager) for supplying water and airport facilities and Mark Tubbs (rancher) for supplying the rangeland used in the study. Appreciation is also extended to Dave Hirsh (State Plant Health Director, North Dakota) for looking for potential areas to conduct the research.
13

References Connin, R.V. and L. C. Kuitert. 1952. Control of the American Grasshopper with Organic Insecticides in Florida. J.Econ. Entomol. 45: 684-687. Conover, W.J. and R.L. Iman. 1981. Rank Transformations as a Bridge Between Parametic and Nonparametric Statistics. The American Statistician. 35: (3) 124-129. Foster, R.N. and K.C. Reuter. 1996-1999. Evaluation of rangeland grasshopper controls: A general protocol for efficacy studies of insecticides applied from the air. In: Cunningham, G.L., and M.W. Sampson tech cords. Grasshopper integrated pest management user handbook. Tech Bull. 1809. Washington, DC: U.S. Dept. of Agriculture, Animal and Plant Health Inspection Service: II.2-1—II.2-7.
Foster, R. Nelson, K. Chris Reuter, Lonnie Black. 2006. Field cage comparison of a food waste bait containing three doses of Spinosad for activity against the grasshopper Aulocara elliotti (Thomas) on rangeland. Final Report. February 2006. USDA, APHIS, PPQ, CPHST, DS&PMSL, Phoenix, Az. 9 pp. Foster, R. Nelson, K. Chris Reuter, Bruce Helbig, Cheryl Huddleston, and Nathan Bradley. 2002. Initial evaluations of malathion and Spinosad formulations for control of grasshoppers on rangeland in South Dakota. Final Report. December 2002. USDA, APHIS, PPQ, CPHST, DS&PMSL, Phoenix, Az. 17 pp. Foster, R.N., K.C. Reuter, L. Black, E. Kahler, B. Fuller, and E.A. Flora. 1996. Laboratory evaluation of dose and manner of pickup of Spinosad on the migratory grasshopper, 1995. Arthropod Management Tests. 21: 416. Foster, R. Nelson, Stefan T. Jaronski, K. Chris Reuter, Bruce Helbig, John Bradley, Cheryl Huddleston, Bryan Fitzgerald, Julie Grace and Bruce Radsick. 2004. Evaluation of the fungus Beauveria bassiana in canola oil and paraffinic oil and identifying the low dose of a bacteria derived toxin, Spinosad, for use against rangeland grasshopper. Final Report. April 2004. USDA, APHIS, PPQ, CPHST, DS&PMSL, Phoenix, Az. 33 pp. SPSS Inc. 1997. SYSTAT for Windows: Statistics, SPSS Inc., Chicago, Illinois. Zar, J.H. 1974 Biostatistical Analysis, Prentice Hall, Inc. Englewood Cliffs, N.J.
Young at al. 2000. SEE Dave Cowan.
14

1 2 3 4 5 6 7
8
UTC NAF Molasses PBC ISCA NuLure
Tracer
Wyo
min
g
Sout
h D
akot
aN
1 2 3 4 5 6 7
8
UTC NAF Molasses PBC ISCA NuLure
Tracer
Wyo
min
g
Sout
h D
akot
a 1 2 3 4 5 6 7
8
UTC NAF Molasses PBC ISCA NuLure
Tracer
1 2 3 4 5 6 7
8
UTC NAF Molasses PBC ISCA NuLure
Tracer
1 2 3 4 5 6 7
8
UTC NAF Molasses PBC ISCA NuLure
Tracer
Wyo
min
g
Sout
h D
akot
aN
Figure 1. Design showing layout of 10 acre plots on the Tubbs ranch near Edgemont, SD.
50
60
70
80
90
100
110
3-Jul 10-Jul 17-Jul 24-Jul
2007
Tem
pera
ture
o F
0.0
0.5
1.0
1.5
2.0
2.5
inch
es
minimum maximum precipitation
Figure 2. Minimum and maximum temperatures and precipitation recorded at the study area.
15

Figure 3. Field cage setup on one plot near Edgemont, SD.
10
12
14
16
18
20
22
2-Jul 4-Jul 6-Jul 8-Jul 10-Jul 12-Jul 14-Jul
2007
Den
sity
(gh/
m2 )
Figure 4. Density of rangeland grasshoppers in the untreated plot during the study.
16

0
20
40
60
80
100
1 2 3 4 5 6 7
Days after exposure
Mea
n %
mor
talit
y
Nu-Lure ISCA Tracer NalcotrolNAF PBC Untreated
Figure 5. Mean mortality of adult Aulocara elliotti grasshoppers exposed to 0 day old residuals of selected Spinosad formulations in field cages.
0
20
40
60
80
100
1 2 3 4 5 6 7
Days after exposure
Mea
n %
mor
talit
y
Nu-Lure ISCA Tracer NalcotrolNAF PBC Untreated
Figure 6. Mean mortality of adult Aulocara elliotti grasshoppers exposed to 3 day old residuals of selected Spinosad formulations in field cages.
17

0
20
40
60
80
100
1 2 3 4 5 6 7
Days after exposure
Mea
n %
mor
talit
y
Nu-Lure ISCA Tracer NalcotrolNAF PBC Untreated
Figure 7. Mean mortality of adult Aulocara elliotti grasshoppers exposed to 6 day old residuals of Spinosad formulations in field cages.
0
20
40
60
80
100
1 2 3 4 5 6 7
Days after exposure
Mea
n %
mor
talit
y
Nu-Lure ISCA Tracer NalcotrolNAF PBC Untreated
Figure 8. Mean mortality of adult Aulocara elliotti grasshoppers exposed to 9 day old residuals of selected Spinosad formulations in field cages.
18

0
20
40
60
80
100
1 2 3 4 5 6 7
Days after exposure
Mea
n %
mor
talit
y
Nu-Lure ISCA Tracer NalcotrolNAF PBC Untreated
Figure 9. Mean mortality of adult Aulocara elliotti grasshoppers exposed to 12 day old residuals of selected Spinosad formulations in field cages.
0
20
40
60
80
100
1 2 3 4
Days after exposure
Mea
n %
mor
talit
y
Nu-Lure ISCA Tracer NalcotrolNAF PBC Untreated
Figure 10. Mean mortality of adult Aulocara elliotti grasshoppers exposed to 15 day old residuals of selected Spinosad formulations in field cages.
19

0
20
40
60
80
100
1 2 3 4 5 6 7
Days after exposure
Mea
n %
mor
talit
y
Nu-Lure ISCA Tracer NalcotrolNAF PBC Untreated
Figure 11. Mean mortality of 5th instar and adult Ageneotettix deorum grasshoppers exposed to 0 day old residuals of selected Spinosad formulations in field cages.
0
20
40
60
80
100
1 2 3 4 5 6 7
Days after exposure
Mea
n %
mor
talit
y
Nu-Lure ISCA Tracer NalcotrolNAF PBC Untreated
Figure 12. Mean mortality of 5th instar and adult Ageneotettix deorum grasshoppers exposed to 3 day old residuals of selected Spinosad formulations in field cages.
20

0
20
40
60
80
100
1 2 3 4 5 6 7
Days after exposure
Mea
n %
mor
talit
y
Nu-Lure ISCA Tracer NalcotrolNAF PBC Untreated
Figure 13. Mean mortality of 5th instar and adult Ageneotettix deorum grasshoppers exposed to 6 day old residuals of selected Spinosad formulations in field cages.
0
20
40
60
80
100
1 2 3 4 5 6 7
Days after exposure
Mea
n %
mor
talit
y
Nu-Lure ISCA Tracer NalcotrolNAF PBC Untreated
Figure 14. Mean mortality of 5th instar and adult Ageneotettix deorum grasshoppers exposed to 9 day old residuals of selected Spinosad formulations in field cages.
21

0
20
40
60
80
100
1 2 3 4 5 6 7
Days after exposure
Mea
n %
mor
talit
y
Nu-Lure ISCA Tracer NalcotrolNAF PBC Untreated
Figure 15. Mean mortality of 5th instar and adult Ageneotettix deorum grasshoppers exposed to 12 day old residuals of selected Spinosad formulations in field cages.
0
20
40
60
80
100
1 2 3 4
Days after exposure
Mea
n %
mor
talit
y
Nu-Lure ISCA Tracer NalcotrolNAF PBC Untreated
Figure 16. Mean mortality of 5th instar and adult Ageneotettix deorum grasshoppers exposed to 15 day old residuals of selected Spinosad formulations in field cages.
22

Spinosad residual on grass
0
2000
4000
6000
8000
10000
12000
0 3 6 9 12 15Days after treatment
ng/m
lTracer NAF Mol/Nalcotrol PBC ISCA NuLure
Fig 17. Summary of chemical residue analysis of range grass samples.
23

Table 1. Summary of calibration parameters. Formulation
Spinosad
(g)
Total Fluid oz/ac
Nozzle
No.
Tip Size
NozzleScreen
Size
Pressure
(psi)
Aircraft Speed (mph)
Swath Width
(ft)
Appl. Date
Nu-Lure / 21.3 32 8 8006 50 36 120 75 July 3 Tracer ISCA 21.3 32 12 8006 slotted 15 120 75 July 4 Technologies Tracer 21.3 32 14 8003 50 39 120 75 July 4 Molasses/ 21.3 32 14 8003 50 39 120 75 July 5 Nalcotrol/Tracer Dow Agro Science 21.3 32 14 8003 50 39 120 75 July 7 Spinosad 36% WG Pacific BioControl 21.3 32 14 8003 50 39 120 75 July 7 PBW spray / Tracer Table 2. Meteorological conditions recorded during aerial application of treatments. Temperatures ºF. Plot Trt. Time (AM) Ground Air Pilot Wind (mph) Formulation no. Date Start End Start End Start End Start End
Nu-Lure / 7 July 3 5:09 5:17 65 65 70 74 78 1-2 SE 1-1.5 SE Tracer ISCA 6 July 4 5:37 5:44 63 63 64 64 68 2 E < 1 E Technologies Tracer 8 July 4 7:36 7:44 77 78 77 79 72 2 E 2-3 E Molasses/ 4 July 5 5:10 5:18 63 62 67 65 71 1-2 S 1-3 S Nalcotrol/Tracer Dow Agro Science 3 July 7 4:56 5:06 63 64 68 68 77 1 E 2-4 E Spinosad 36% WG Pacific BioControl PBW spray / Tracer
5 July 7 5:57 6:04 63 62 68 67 74 < 1 S 1-1.5 S
24
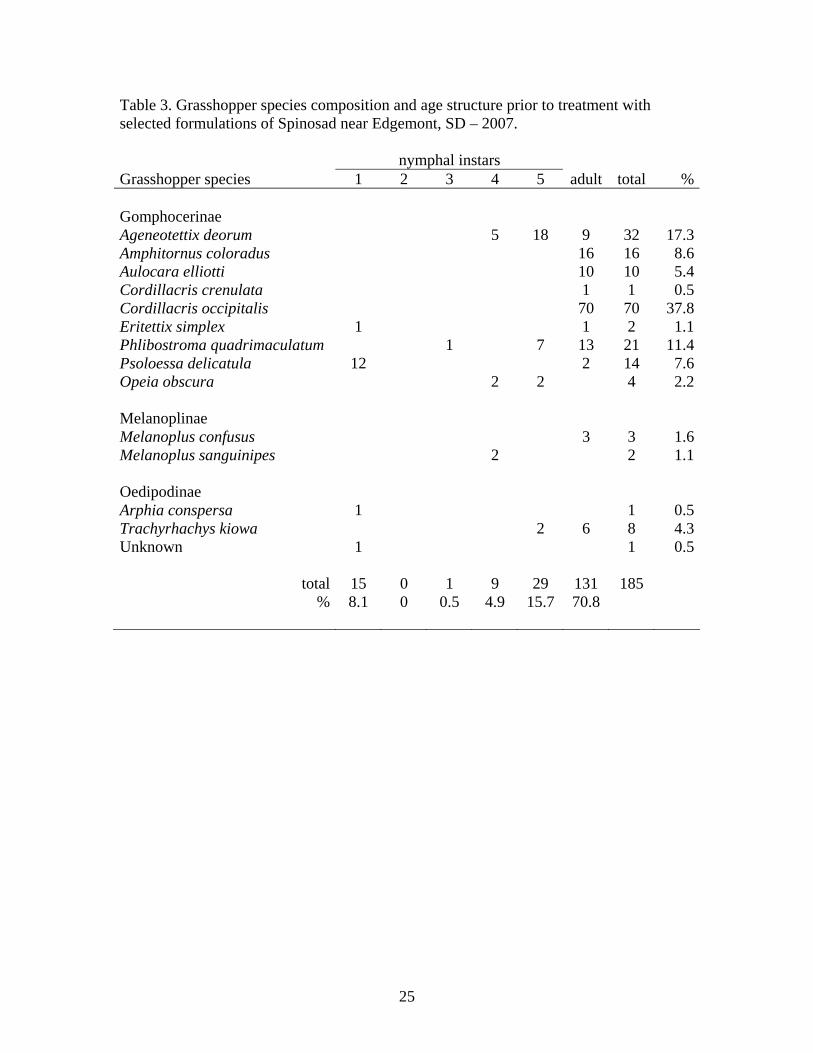
Table 3. Grasshopper species composition and age structure prior to treatment with selected formulations of Spinosad near Edgemont, SD – 2007. nymphal instars Grasshopper species 1 2 3 4 5 adult total % Gomphocerinae Ageneotettix deorum 5 18 9 32 17.3Amphitornus coloradus 16 16 8.6Aulocara elliotti 10 10 5.4Cordillacris crenulata 1 1 0.5Cordillacris occipitalis 70 70 37.8Eritettix simplex 1 1 2 1.1Phlibostroma quadrimaculatum 1 7 13 21 11.4Psoloessa delicatula 12 2 14 7.6Opeia obscura 2 2 4 2.2 Melanoplinae Melanoplus confusus 3 3 1.6Melanoplus sanguinipes 2 2 1.1 Oedipodinae Arphia conspersa 1 1 0.5Trachyrhachys kiowa 2 6 8 4.3Unknown 1 1 0.5
total 15 0 1 9 29 131 185 % 8.1 0 0.5 4.9 15.7 70.8
25

Table 4. Adjusted mortality figures based on densities from ring counts. Trt. Days after treatment – adjusted % mortality 1
Formulation Date Plot no. 1 3 7 Nu-Lure / July 3 7 52 a 100 a 96 a Tracer ISCA July 4 6 41 a 96 ab 82 ab Technologies Tracer July 4 8 70 a 96 ab 84 ab Molasses/ July 5 4 59 a 95 ab 89 ab Nalcotrol/Tracer Dow Agro Science July 7 3 53 a 80 ab 78 ab NAF (Spinosad 36% WG)
Pacific BioControl July 7 5 69 a 74 b 49 b PBW spray / Tracer
1 Percentage mortalities were corrected for population changes in the untreated plots. Connin and Kuitert 1952.
Table5. Mean mortality of caged Aulocara elliotti exposed to 0 day old residuals sprays of selected Spinosad treatments to rangeland vegetation. (Red values = pre rain data.) Mean % mortality – days after exposure Treatment 1 2 3 4 5 6 7 Tracer 0 a 12 ab 72 a 88 a 88 a 88 a 88 a NuLure 8 a 40 a 76 a 84 a 92 a 96 a 96 a PBC 12 a 20 ab 20 bc 32 bc 40 bc 40 bc 44 bc ISCA 0 a 12 ab 56 ab 64 ab 68 ab 72 ab 72 ab Nalcotrol 0 a 12 ab 24 bc 44 b 48 bc 56 ab 60 ab NAF 12 a 24 ab 32 bc 32 bc 36 bc 40 bc 40 bc Untreated 0 a 4 b 4 c 6 c 9 c 9 c 10 c
26

Table 6. Mean mortality of caged Aulocara elliotti exposed to 3 day old residual sprays of selected Spinosad treatments to rangeland vegetation. (Red values = pre rain data.) Mean % mortality – days after exposure Treatment 1 2 3 4 5 6 7 Tracer 0 a 12 a 16 a 20 ab 24 ab 36 ab 44 ab NuLure 0 a 16 a 36 a 56 a 60 a 64 a 64 a PBC 4 a 8 a 16 a 28 ab 36 ab 40 ab 52 ab ISCA 4 a 4 a 8 a 12 ab 12 b 12 b 16 ab Nalcotrol 4 a 4 a 8 a 8 b 8 b 12 b 16 ab NAF 0 a 4 a 12 a 20 ab 40 ab 44 ab 60 ab Untreated 0 a 2 a 5 a 6 b 6 b 7 b 10 b Table 7. Mean mortality of caged Aulocara elliotti exposed to 6 day old residual sprays of selected Spinosad treatments to rangeland vegetation. Mean % mortality – days after exposure Treatment 1 2 3 4 5 6 7 Tracer 0 a 0 a 8 a 28 ab 28 bc 48 ab 60 ab NuLure 0 a 0 a 8 a 12 abc 12 cd 12 c 20 c PBC 0 a 4 a 20 a 32 a 72 a 72 a 72 a ISCA 0 a 4 a 4 a 4 c 4 d 16 c 32 bc Nalcotrol 0 a 4 a 4 a 8 bc 12 cd 20 c 36 bc NAF 0 a 4 a 8 a 20 abc 36 b 36 bc 36 bc Untreated 1 a 4 a 7 a 12 abc 16 bcd 23 bc 30 c Table 8. Mean mortality of caged Aulocara elliotti exposed to 9 day old residual sprays of selected Spinosad treatments to rangeland vegetation. Mean % mortality – days after exposure Treatment 1 2 3 4 5 6 7 Tracer 4 a 8 a 40 a 56 a 60 a 60 a 60 a NuLure 4 a 4 a 12 b 20 b 36 ab 40 ab 44 ab PBC 0 a 0 a 4 b 8 b 12 b 12 b 20 b ISCA 0 a 0 a 4 b 8 b 12 b 12 b 12 b Nalcotrol 0 a 0 a 4 b 12 b 12 b 12 b 12 b NAF 4 a 4 a 4 b 4 b 8 b 28 ab 48 ab Untreated 1 a 2 a 4 b 10 b 14 b 18 b 25 ab
27

Table 9. Mean mortality of caged Aulocara elliotti exposed to 12 day old residual sprays of selected Spinosad treatments to rangeland vegetation Mean % mortality – days after exposure Treatment 1 2 3 4 5 6 7 Tracer 4 a 8 a 8 a 8 a 8 bc 20 b 28 ab NuLure 0 a 8 a 8 a 12 a 12 bc 12 b 12 b PBC 0 a 0 a 0 a 16 a 48 a 64 a 72 a ISCA 0 a 4 a 4 a 4 a 4 c 12 b 16 b Nalcotrol 0 a 0 a 4 a 8 a 8 bc 16 b 28 ab NAF 0 a 0 a 4 a 12 a 40 ab 48 ab 52 ab Untreated 1 a 1 a 2 a 2 a 6 c 17 b 30 ab Table 10. Mean mortality of caged Aulocara elliotti exposed to 15 day old residual sprays of selected Spinosad treatments to rangeland vegetation. Mean % mortality – days after exposure Treatment 1 2 3 4 5 6 7 Tracer 0 a 0 a 12 a 32 a NuLure 4 a 4 a 4 a 24 a PBC 4 a 4 a 28 a 44 a ISCA 0 a 8 a 12 a 24 a Nalcotrol 0 a 16 a 20 a 24 a NAF 4 a 8 a 12 a 28 a Untreated 0 a 0 a 2 a 3 a Table 11. Mean mortality of caged Ageneotettix deorum exposed to 0 day old residual sprays of selected Spinosad treatments to rangeland vegetation. (Red = pre rain data.) Mean % mortality – days after exposure Treatment 1 2 3 4 5 6 7 Tracer 12 a 36 ab 56 ab 68 ab 72 ab 72 ab 72 ab NuLure 36 a 80 a 88 a 96 a 96 a 96 a 96 a PBC 4 a 20 b 20 bc 24 cd 24 cd 24 c 28 c ISCA 20 a 36 ab 64 ab 72 ab 72 ab 76 ab 76 ab Nalcotrol 24 a 52 ab 64 ab 76 ab 92 a 92 a 92 a NAF 24 a 40 ab 48 abc 48 bc 48 bc 48 bc 48 bc Untreated 2 a 2 b 4 c 5 d 5 d 6 c 6 c
28

Table 12. Mean mortality of caged Ageneotettix deorum exposed to 3 day old residual sprays of selected Spinosad treatments to rangeland vegetation. (Red = pre rain data.) Mean % mortality – days after exposure Treatment 1 2 3 4 5 6 7 Tracer 20 a 20 a 28 ab 32 ab 32 ab 36 abc 40 abc NuLure 12 ab 28 a 44 a 56 a 56 a 56 a 56 a PBC 8 ab 20 a 20 ab 20 ab 20 ab 20 bc 24 bc ISCA 16 ab 20 a 24 ab 28 ab 32 ab 40 ab 48 ab Nalcotrol 8 ab 12 a 16 ab 16 b 20 ab 20 bc 24 bc NAF 0 b 4 a 4 b 4 b 4 b 4 c 4 c Untreated 0 b 1 a 1 b 2 b 2 b 2 c 2 c Table 13. Mean mortality of caged Ageneotettix deorum exposed to 6 day old residual sprays of selected Spinosad treatments to rangeland vegetation. Mean % mortality – days after exposure Treatment 1 2 3 4 5 6 7 Tracer 4 a 20 a 28 a 36 a 40 a 40 a 48 a NuLure 0 a 16 a 20 a 24 a 28 a 32 a 44 a PBC 4 a 8 a 8 a 8 a 8 a 8 a 8 a ISCA 0 a 4 a 4 a 12 a 16 a 16 a 20 a Nalcotrol 0 a 4 a 4 a 4 a 8 a 20 a 20 a NAF 0 a 8 a 16 a 16 a 20 a 20 a 24 a Untreated 0 a 1 a 1 a 2 a 2 a 2 a 2 a Table 14. Mean mortality of caged Ageneotettix deorum exposed to 9 day old residual sprays of selected Spinosad treatments to rangeland vegetation. Mean % mortality – days after exposure Treatment 1 2 3 4 5 6 7 Tracer 16 a 20 a 20 a 40 a 48 a 48 a 48 a NuLure 0 a 8 a 8 a 12 b 16 ab 24 ab 24 ab PBC 4 a 8 a 8 a 8 b 8 b 8 b 8 b ISCA 8 a 8 a 16 a 24 ab 28 ab 28 ab 28 ab Nalcotrol 4 a 4 a 4 a 4 b 4 b 4 b 4 b NAF 0 a 8 a 8 a 8 b 8 b 12 ab 12 ab Untreated 0 a 0 a 1 a 2 b 2 b 2 b 3 b
29

Table 15. Mean mortality of caged Ageneotettix deorum exposed to 12 day old residual sprays of selected Spinosad treatments to rangeland vegetation. Mean % mortality – days after exposure Treatment 1 2 3 4 5 6 7 Tracer 0 a 4 a 4 a 4 a 4 b 4 b 4 b NuLure 4 a 12 a 12 a 12 a 16 ab 16 ab 20 ab PBC 0 a 4 a 8 a 20 a 32 a 40 a 48 a ISCA 0 a 0 a 4 a 4 a 4 b 4 b 4 b Nalcotrol 8 a 8 a 8 a 8 a 8 ab 12 ab 12 ab NAF 0 a 4 a 4 a 4 a 12 ab 16 ab 32 ab Untreated 0 a 1 a 1 a 3 a 5 b 8 ab 14 ab Table 16. Mean mortality of caged Ageneotettix deorum exposed to 15 day old residual sprays of selected Spinosad treatments to rangeland vegetation. Mean % mortality – days after exposure Treatment 1 2 3 4 5 6 7 Tracer 0 a 0 a 8 a 12 a NuLure 0 a 0 a 4 a 12 a PBC 0 a 16 a 24 a 28 a ISCA 4 a 4 a 16 a 20 a Nalcotrol 0 a 4 a 12 a 16 a NAF 0 a 0 a 20 a 28 a Untreated 0 a 2 a 3 a 6 a Table 17. Numerical comparisons of Aulocara elliotti mortality at post treatment intervals Post-treatment interval Treatment 0 3 6 9 12 15 1
Tracer 88 44 60 60 28 32 Nu-Lure 96 64 20 44 12 24 PBC 44 52 72 20 72 44 ISCA 72 16 32 12 16 24 Nalcotrol 60 16 36 12 28 24 NAF 40 60 36 48 52 28 Untreated 10 10 30 25 30 3 1 Mean % mortality within 4 days of exposure after indicated post-treatment interval. Study terminated early. Values numerically higher than the spinosad standard, Tracer.
30

31
Table 18. Numerical comparisons of Ageneotettix deorum mortality at post treatment intervals Post-treatment interval Treatment 0 3 6 9 12 15 1
Tracer 72 40 48 48 4 12 Nu-Lure 96 56 44 24 20 12 PBC 28 24 8 8 48 28 ISCA 76 48 20 28 4 20 Nalcotrol 92 24 20 4 12 16 NAF 48 4 24 12 32 28 Untreated 6 2 2 3 14 6 1 Mean % mortality within 4 days of exposure after indicated post-treatment interval. Study terminated early. Values numerically higher than the spinosad standard, Tracer.