objectives - university of idaho · the ieee 1243, guide to improving the lightning performance of...
TRANSCRIPT

5/6/2014
1
The Mysteries of Lightning and It’s MitigationThe Mysteries of Lightning and It’s Mitigation
Stacey PagePower Engineers05/02/2014
1
ObjectivesObjectives
• Discuss basic lightning terminology and types of strokes
• Understand how lightning affects transmission and• Understand how lightning affects transmission and distribution systems
• Learn the basics of substation protection and standards
• Discuss where/how to get lightning data and what you can do with it
• Discuss examples of lightning transient work to illustrate behavior and mitigation schemes and techniques
2

5/6/2014
2
Basic TerminologyBasic Terminology
• BIL-Basic Lightning Impulse Insulation Level
• CFO Critical Flashover Voltage• CFO-Critical Flashover Voltage
• OHSW, OPGW-Overhead Shield Wire, Optical Ground Wire
• SFFOR-Shield Failure Flashover Rate
• BFR-Back Flashover Rate
• GFD-Ground Flash Density fl/sq km/yr
• MCOV-Maximum Continuous Operating Voltage
• Characteristic/Surge Impedance Zc
3
Lightning in HistoryLightning in History
• 2000 Thunderstorms in progress at any time resulting in 100 lightning flashes to ground per second-8 million per dday
• For many centuries in Europe and England it was common practice to ring church bells during a lightning storm. The poor and uneducated people believed that this dispersed evil spirits, while the more educated knew that it caused a vibration in air that broke up the continuity of the lightning path. A book was published in 1784 entitled “A Proof that the Ringing of Bells During1784 entitled A Proof that the Ringing of Bells During Thunderstorms May Be More Dangerous than Useful” showed that in a 33 yr period 386 church steeples were hit by lightning, killing 103 bell ringers at the rope.
4

5/6/2014
3
World Lightning MapWorld Lightning Map
Lightning occurrence varies:• Geographically• Seasonally• Annually
5
Why Bother?Why Bother?
• Why is lightning a concern?
Strikes on power line propagate down the line– Strikes on power line propagate down the line arrive at substations damage equipment and bus work.
– Power outages
• Flash over protection operates no damage but an outage
6
• Reliability concerns
5/6/2014
4
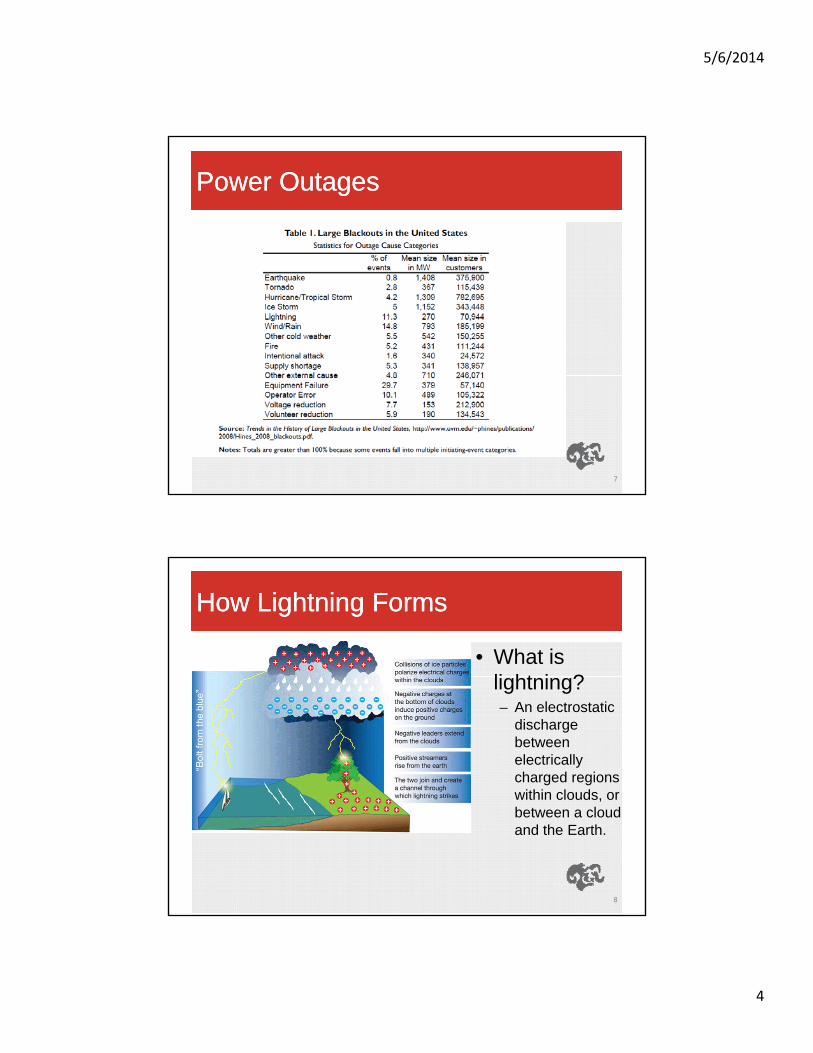
Power OutagesPower Outages
7
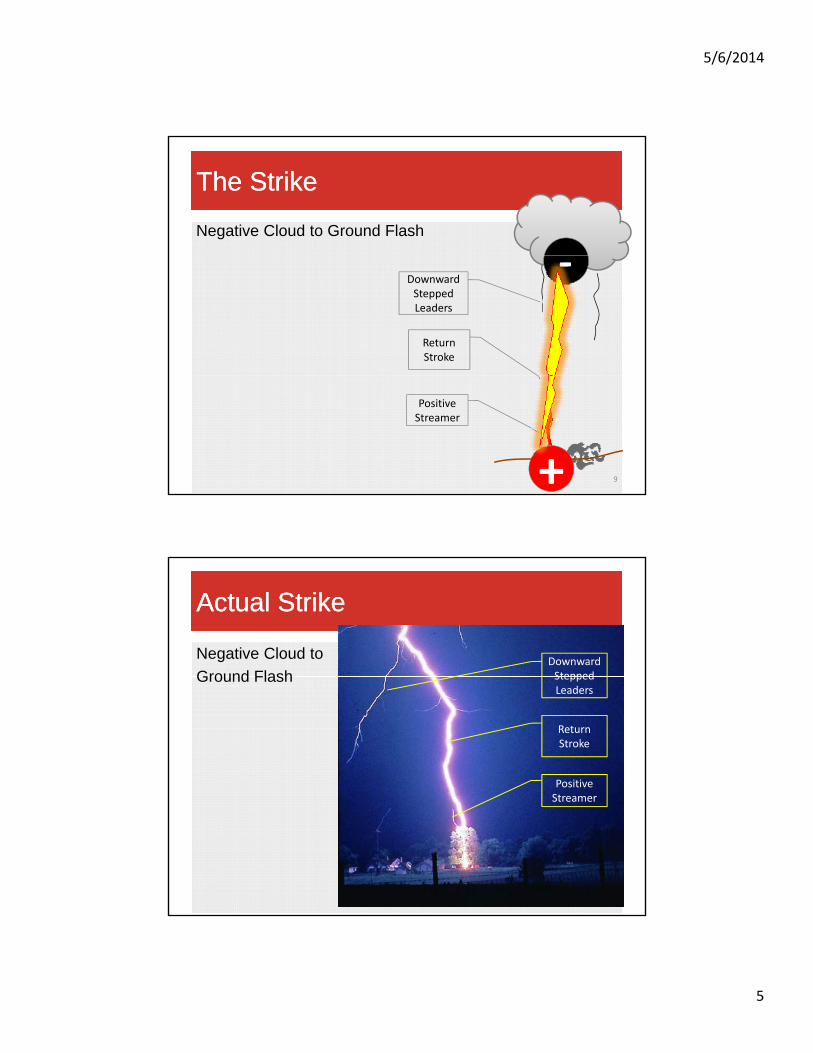
How Lightning FormsHow Lightning Forms
• What is li ht i ?lightning?– An electrostatic
discharge between electrically charged regions within clouds or
8
within clouds, or between a cloud and the Earth.
5/6/2014
5
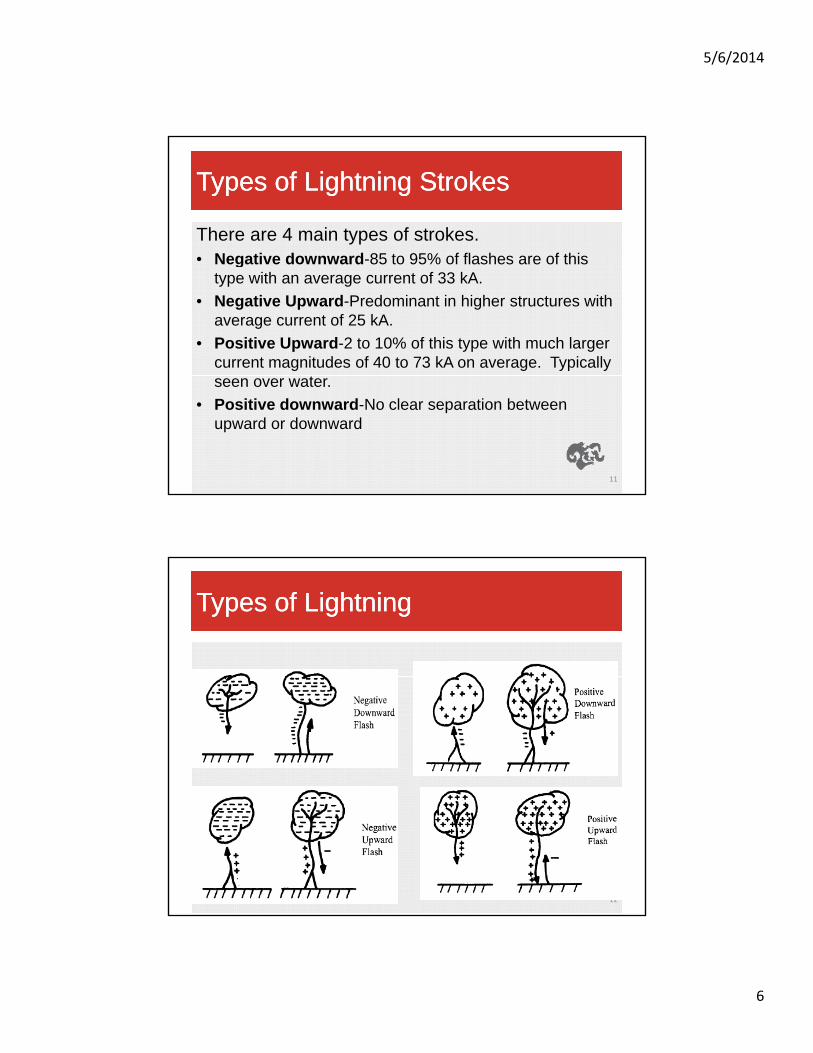
The StrikeThe Strike
Negative Cloud to Ground Flash
‐DownwardStepped Leaders
Return Stroke
9+
Positive Streamer
Actual StrikeActual Strike
Negative Cloud to
Ground FlashDownwardSteppedGround Flash Stepped Leaders
Positive Streamer
Return Stroke
10
Streamer
5/6/2014
6
Types of Lightning StrokesTypes of Lightning Strokes
There are 4 main types of strokes.Negative downward 85 to 95% of flashes are of this• Negative downward-85 to 95% of flashes are of this type with an average current of 33 kA.
• Negative Upward-Predominant in higher structures with average current of 25 kA.
• Positive Upward-2 to 10% of this type with much larger current magnitudes of 40 to 73 kA on average. Typically
tseen over water.
• Positive downward-No clear separation between upward or downward
11
Types of LightningTypes of Lightning
12
5/6/2014
7
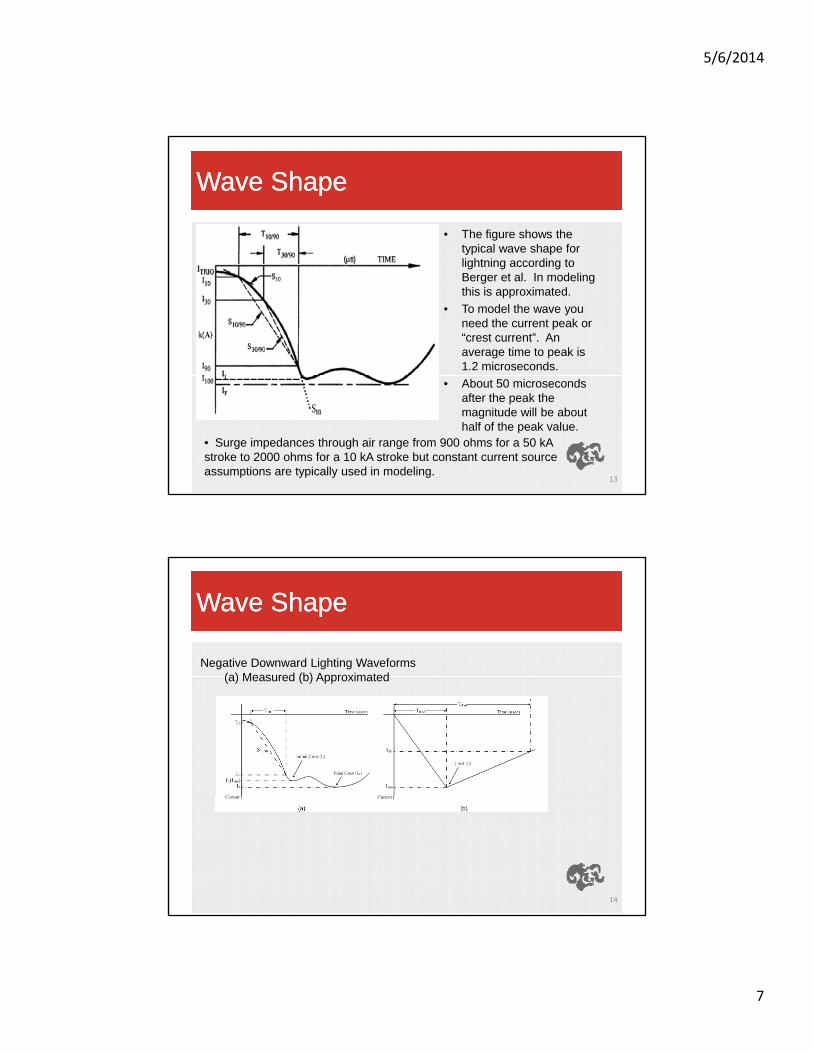
Wave ShapeWave Shape
• The figure shows the typical wave shape for lightning according to Berger et al. In modeling this is approximated.
• To model the wave you need the current peak or “crest current”. An average time to peak is 1.2 microseconds.
• About 50 microseconds after the peak the magnitude will be about half of the peak value.
• Surge impedances through air range from 900 ohms for a 50 kA stroke to 2000 ohms for a 10 kA stroke but constant current source assumptions are typically used in modeling.
13
Wave ShapeWave Shape
Negative Downward Lighting Waveforms(a) Measured (b) Approximated(a) Measured (b) Approximated
14
5/6/2014
8
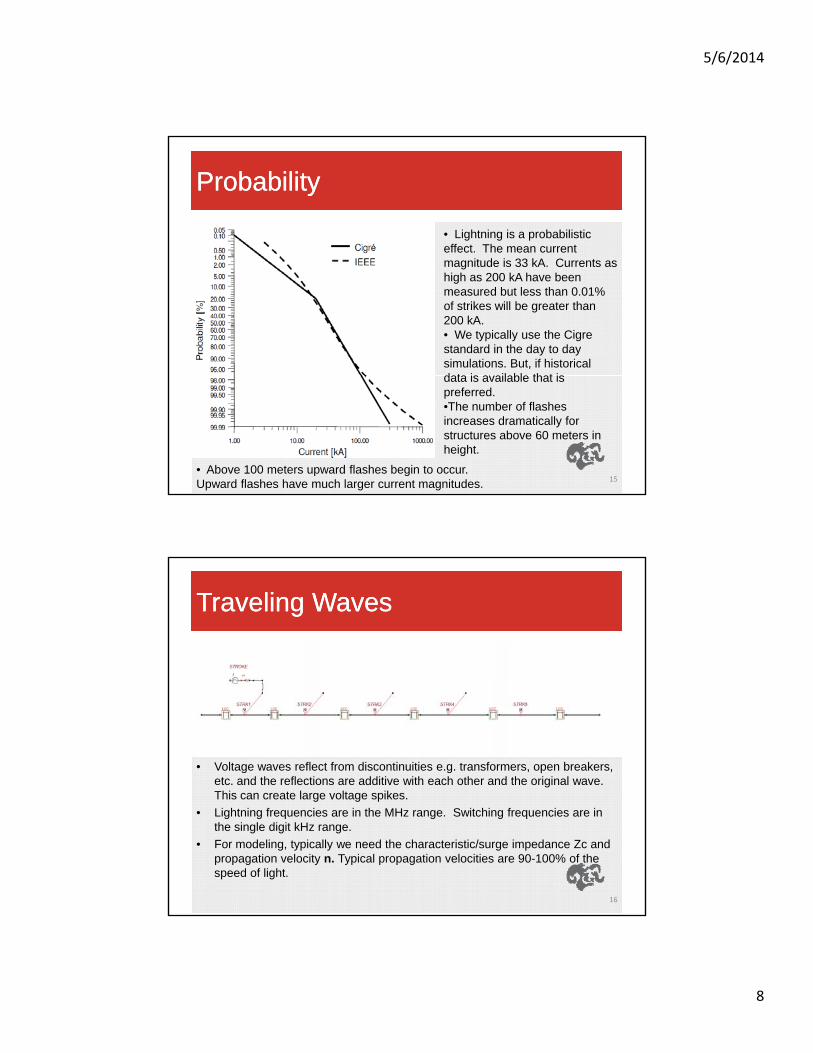
ProbabilityProbability
• Lightning is a probabilistic effect. The mean current magnitude is 33 kA. Currents as high as 200 kA have been measured but less than 0.01% of strikes will be greater than 200 kA.• We typically use the Cigrestandard in the day to day simulations. But, if historical data is available that isdata is available that is preferred.•The number of flashes increases dramatically for structures above 60 meters in height.
15• Above 100 meters upward flashes begin to occur. Upward flashes have much larger current magnitudes.
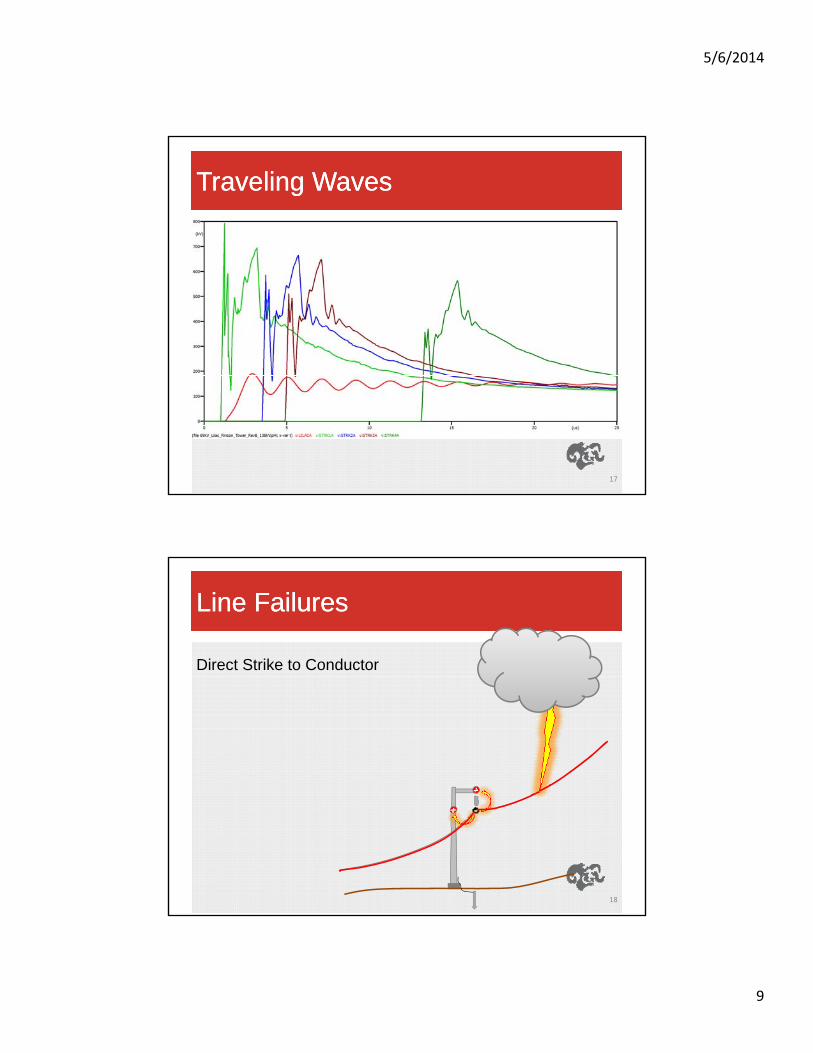
Traveling WavesTraveling Waves
• Voltage waves reflect from discontinuities e.g. transformers, open breakers, etc. and the reflections are additive with each other and the original wave. This can create large voltage spikes
16
This can create large voltage spikes.
• Lightning frequencies are in the MHz range. Switching frequencies are in the single digit kHz range.
• For modeling, typically we need the characteristic/surge impedance Zc and propagation velocity n. Typical propagation velocities are 90-100% of the speed of light.
5/6/2014
9
Traveling WavesTraveling Waves
17
Line FailuresLine Failures
Direct Strike to Conductor
+
18
+ ‐

5/6/2014
10
Line FailuresLine Failures
Shielding Failure
Direct Strike to Conductor
+
19
+ ‐
Line FailuresLine Failures
Direct Strike to
Shield Wire ithShield Wire with
Back-Flashover
‐
20
+ ‐

5/6/2014
11
Line FailuresLine Failures
Induced Flashover
+‐
21
Line FailuresLine Failures
Shield Wire Damage
22
5/6/2014
12
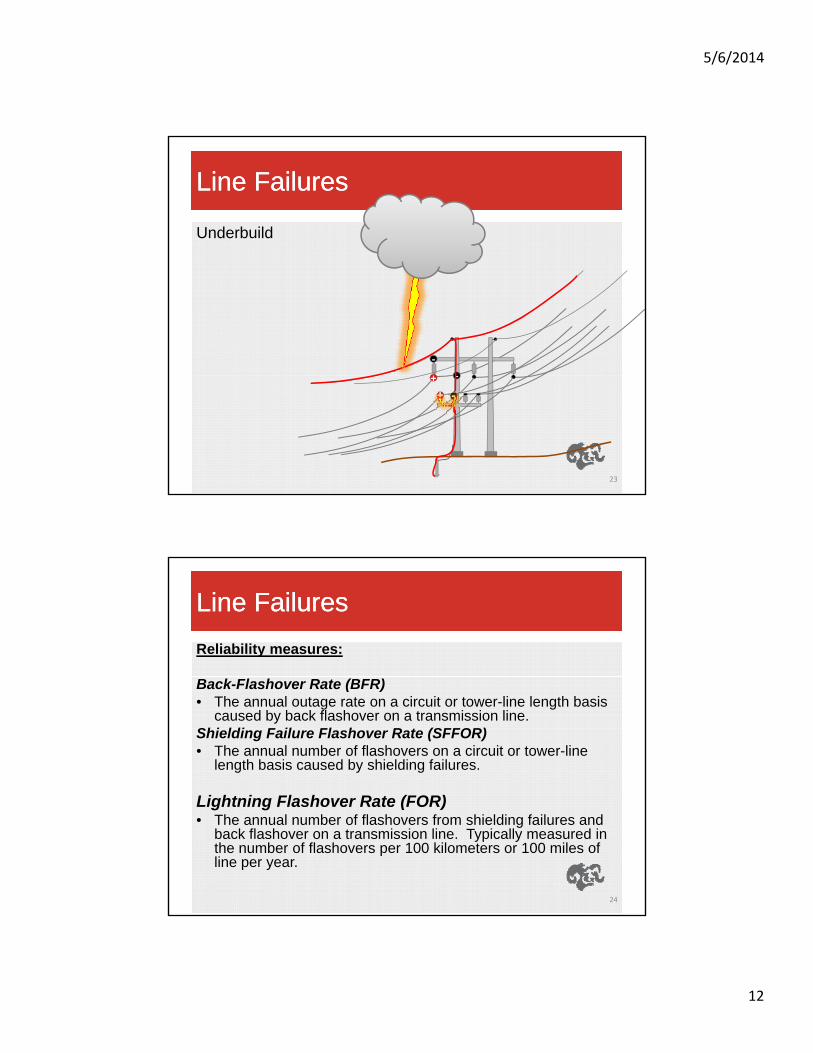
Line FailuresLine Failures
Underbuild
+
‐
23
+ ‐
‐+
Line FailuresLine Failures
Reliability measures:
Back-Flashover Rate (BFR)• The annual outage rate on a circuit or tower-line length basis
caused by back flashover on a transmission line.Shielding Failure Flashover Rate (SFFOR)• The annual number of flashovers on a circuit or tower-line
length basis caused by shielding failures.
Li ht i Fl h R t (FOR)Lightning Flashover Rate (FOR)• The annual number of flashovers from shielding failures and
back flashover on a transmission line. Typically measured in the number of flashovers per 100 kilometers or 100 miles of line per year.
24
5/6/2014
13
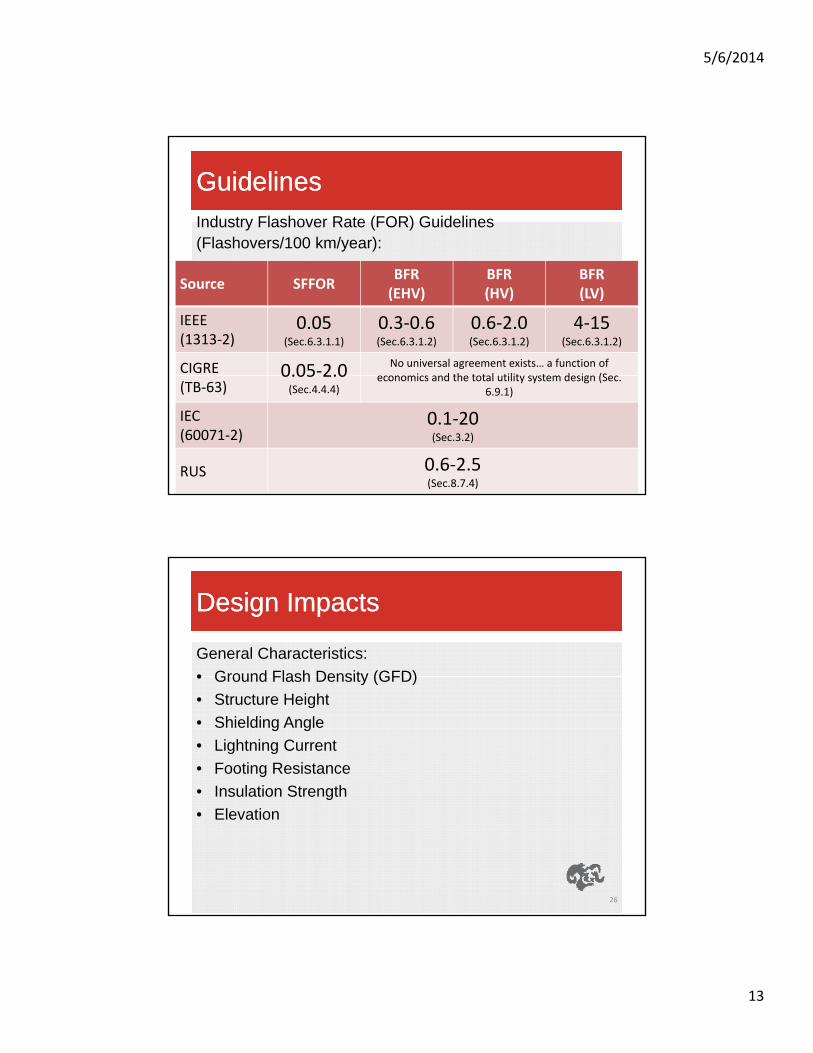
GuidelinesGuidelinesIndustry Flashover Rate (FOR) Guidelines(Flashovers/100 km/year):
Source SFFORBFR(EHV)
BFR(HV)
BFR(LV)
IEEE(1313‐2)
0.05(Sec.6.3.1.1)
0.3‐0.6(Sec.6.3.1.2)
0.6‐2.0(Sec.6.3.1.2)
4‐15(Sec.6.3.1.2)
CIGRE 0.05‐2.0 No universal agreement exists… a function of economics and the total utility system design (Sec
25
(TB‐63)0.05 2.0(Sec.4.4.4)
economics and the total utility system design (Sec. 6.9.1)
IEC(60071‐2)
0.1‐20(Sec.3.2)
RUS 0.6‐2.5(Sec.8.7.4)
Design ImpactsDesign Impacts
General Characteristics:
• Ground Flash Density (GFD)• Ground Flash Density (GFD)
• Structure Height
• Shielding Angle
• Lightning Current
• Footing Resistance
• Insulation Strength
26
Insulation Strength
• Elevation
5/6/2014
14
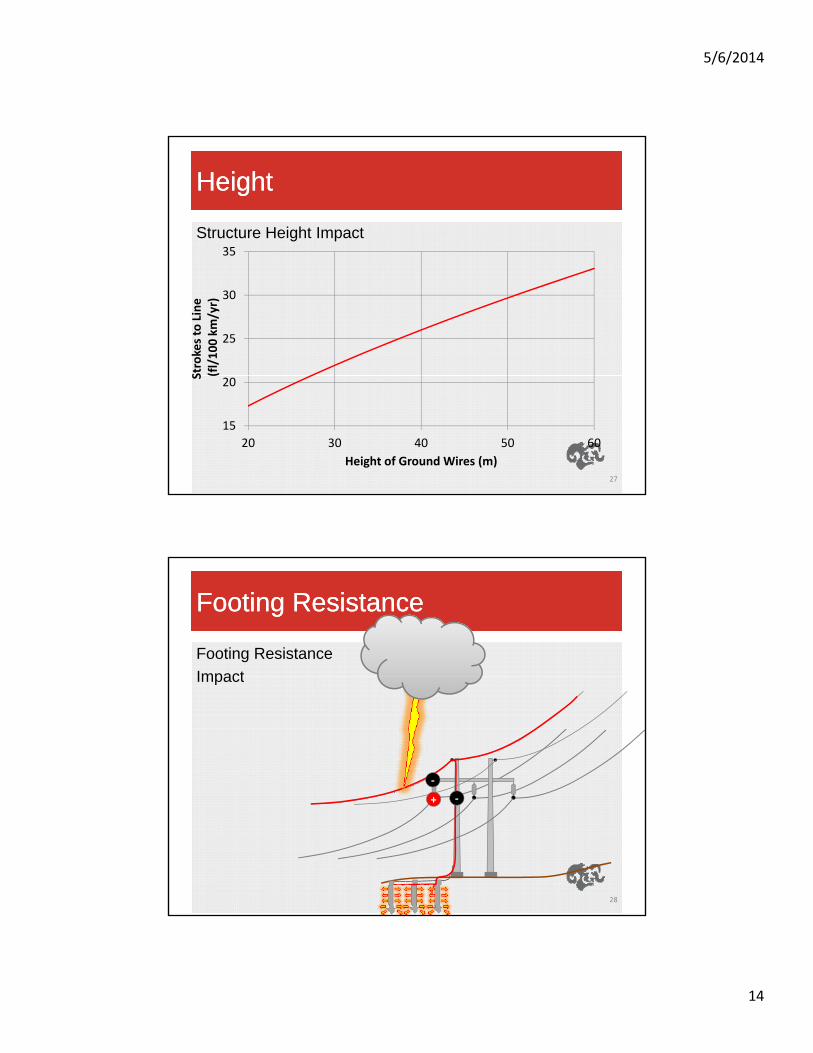
HeightHeight
35
Structure Height Impact
25
30
Strokes to Line
(fl/100 km/yr)
27
15
20
20 30 40 50 60
S (
Height of Ground Wires (m)
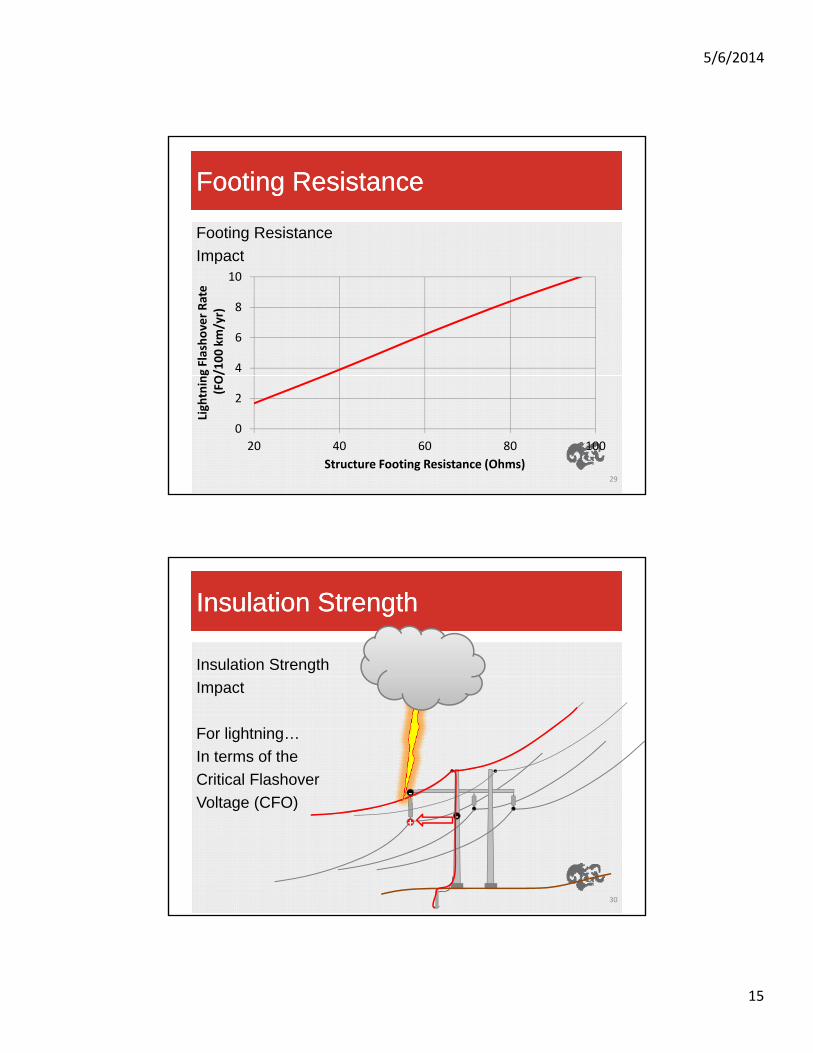
Footing ResistanceFooting Resistance
Footing Resistance
ImpactImpact
‐
28
+ ‐
5/6/2014
15
Footing ResistanceFooting Resistance
Footing Resistance
ImpactImpact
4
6
8
10
g Flashover Rate
/100 km/yr)
29
0
2
20 40 60 80 100
Lightnin
(FO
Structure Footing Resistance (Ohms)
Insulation StrengthInsulation Strength
Insulation Strength
‐
Impact
For lightning…
In terms of the
Critical Flashover
V l (CFO)
30
+‐
Voltage (CFO)

5/6/2014
16
Insulation StrengthInsulation Strength
Insulation Strength
ImpactImpact
3
4
5
Flashover Rate
100 km/yr)
31
1
2
650 700 750 800
Lightning
(FO/
Critical Flashover Voltage ‐ CFO (kV)
ElevationElevation
Elevation
Impact
32
5/6/2014
17
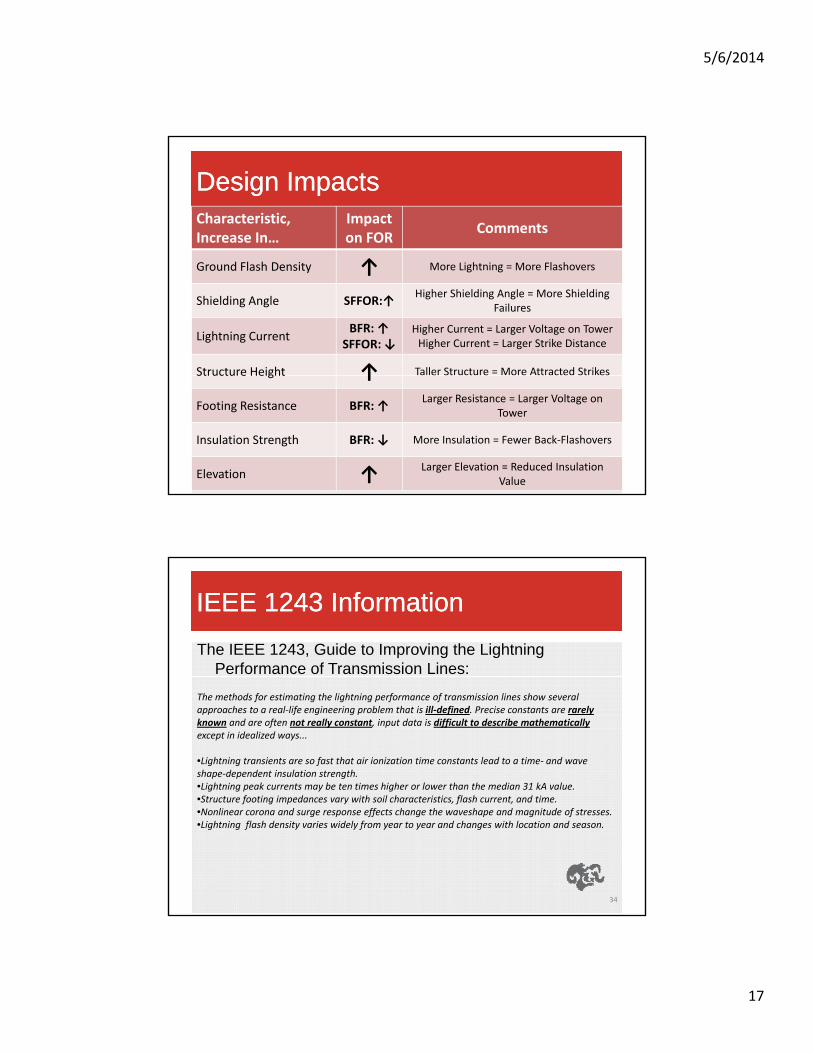
Design ImpactsDesign ImpactsCharacteristic,Increase In…
Impact on FOR
Comments
Ground Flash Density ↑ More Lightning = More Flashovers
Shielding Angle SFFOR:↑Higher Shielding Angle = More Shielding
Failures
Lightning CurrentBFR:↑
SFFOR: ↓Higher Current = Larger Voltage on TowerHigher Current = Larger Strike Distance
Structure Height ↑ Taller Structure = More Attracted Strikes
33
Structure Height ↑
Footing Resistance BFR: ↑Larger Resistance = Larger Voltage on
Tower
Insulation Strength BFR: ↓ More Insulation = Fewer Back‐Flashovers
Elevation ↑ Larger Elevation = Reduced InsulationValue
IEEE 1243 InformationIEEE 1243 Information
The IEEE 1243, Guide to Improving the Lightning Performance of Transmission Lines:
The methods for estimating the lightning performance of transmission lines show several approaches to a real‐life engineering problem that is ill‐defined. Precise constants are rarely known and are often not really constant, input data is difficult to describe mathematicallyexcept in idealized ways...
•Lightning transients are so fast that air ionization time constants lead to a time‐ and wave shape‐dependent insulation strength. •Lightning peak currents may be ten times higher or lower than the median 31 kA value.St t f ti i d ith il h t i ti fl h t d ti
34
•Structure footing impedances vary with soil characteristics, flash current, and time.•Nonlinear corona and surge response effects change the waveshape and magnitude of stresses.•Lightning flash density varies widely from year to year and changes with location and season.
5/6/2014
18
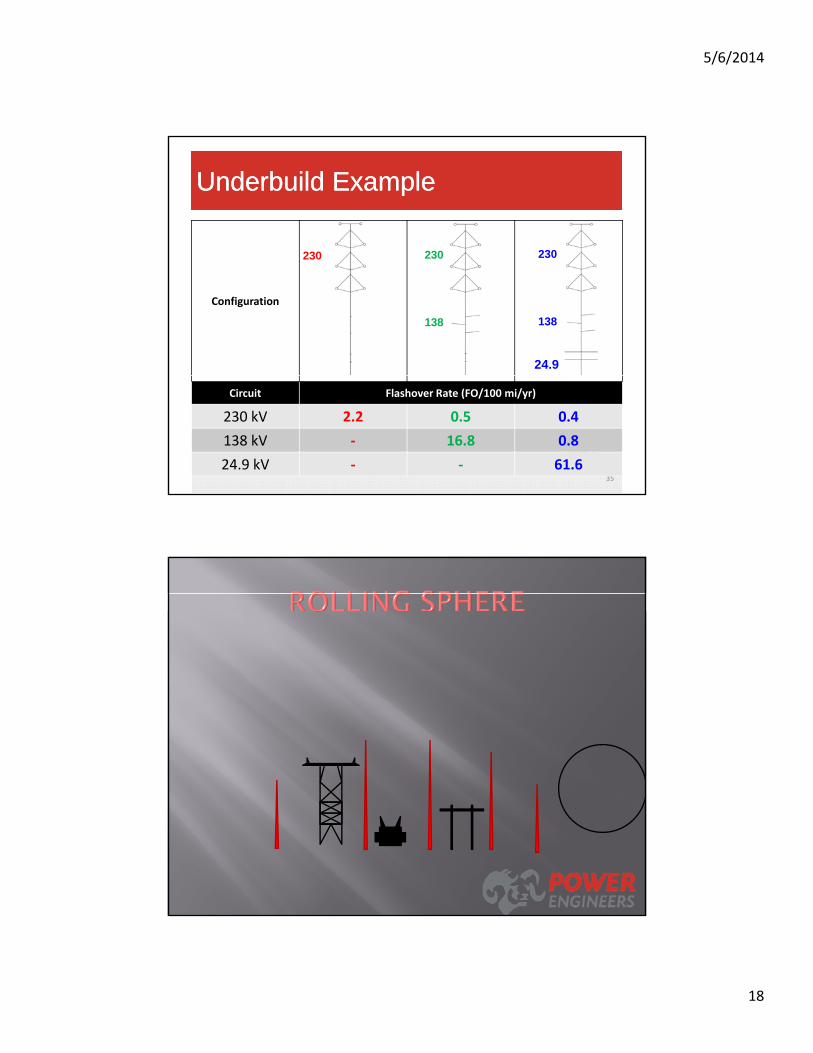
UnderbuildUnderbuild ExampleExample
230 230230
Configuration
138
230
24.9
138
230230
35
Circuit Flashover Rate (FO/100 mi/yr)
230 kV 2.2 0.5 0.4
138 kV ‐ 16.8 0.8
24.9 kV ‐ ‐ 61.6
5/6/2014
19
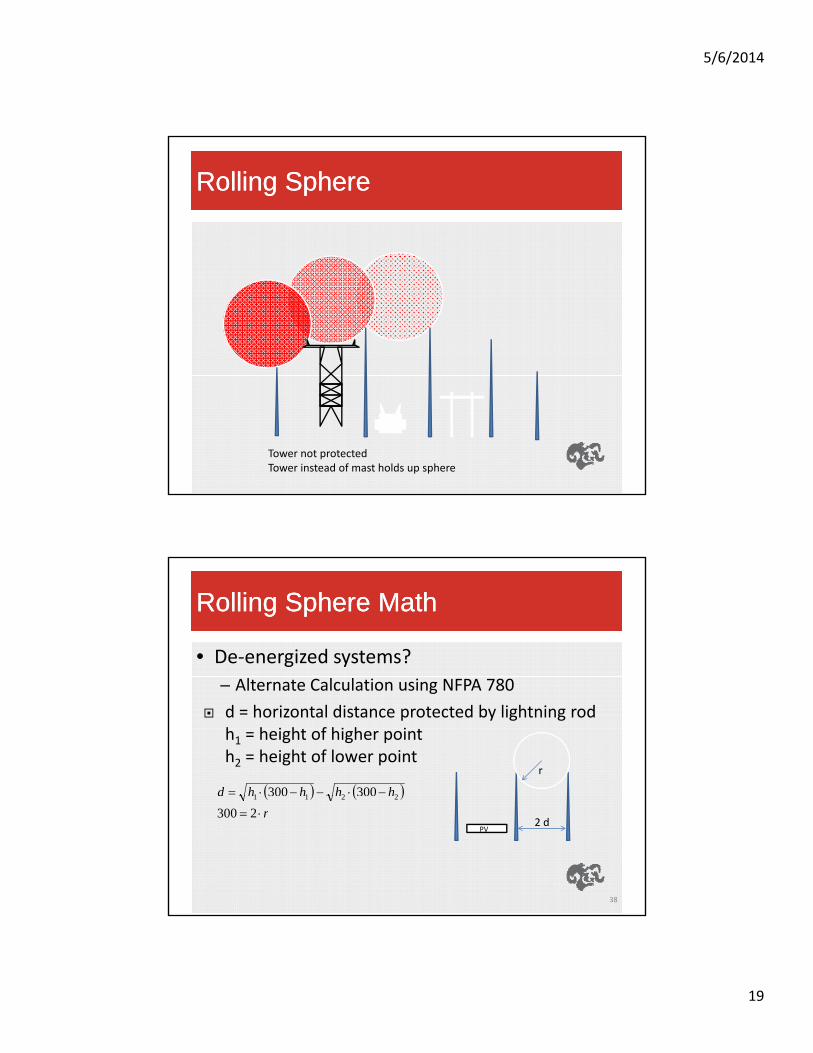
Rolling SphereRolling Sphere
Tower not protectedTower instead of mast holds up sphere
Rolling Sphere MathRolling Sphere Math
• De‐energized systems?
hhhhd 300300 2211
r
– Alternate Calculation using NFPA 780
d = horizontal distance protected by lightning rodh1 = height of higher pointh2 = height of lower point
38
r 2300
2211
2 dPV

5/6/2014
20
How Do We Analyze the System?How Do We Analyze the System?
• Rolling SphereTo protect substations– To protect substations
– Binary
– IEEE Standard 998: IEEE Guide for Direct Lightning Stroke Shielding of Substations
• Use for substation lightning analysis
– NFPA 780: Standard for the Installation of Lightning
39
Protection System• Use for protection of structures, watercrafts, de‐energized electric systems
– Modeling software available: WinIGS
How Do We Analyze the SystemHow Do We Analyze the System
• Flashover Rate Calculations
– To protect transmission and distribution lines
• Determine insulation levels
– Not binary, gives indication of how well equipment is protected‐deterministic values used
– Software available
40
• Sigma SLP
• STRI
– Sigma vs. Calculations

5/6/2014
21
How Do We Analyze the SystemHow Do We Analyze the System
• Equipment BIL, CB Flashover– We can determine values for voltages and
currents by creating a deterministic model and comparing to equipment ratings
– Software Available• Alternative Transients Program (ATP)
• PSCAD
41
• PSCAD
• Other transient program
How do we protect our system?How do we protect our system?
• Overhead shield wires (OHSWs) are l d th tplaced on the towers
• Arresters can reduce voltage peaks.
• Higher CFO for the line insulators.
42

5/6/2014
22
ArrestersArresters
What are they?
43
ArrestersArresters
• Lightning or Surge Arresters are Non-Linear resistors.
• Previously composed of SiC with an air gap There are• Previously composed of SiC with an air gap. There are still some SiC air gap arresters in use and being manufactured.
• Modern arresters contain MOVs-typically ZnO
• Placed in parallel with the insulator so one side is grounded and the other is connected to the conductor.
• Conduct low amounts of current continuously, micro to milliamps range.
44
5/6/2014
23
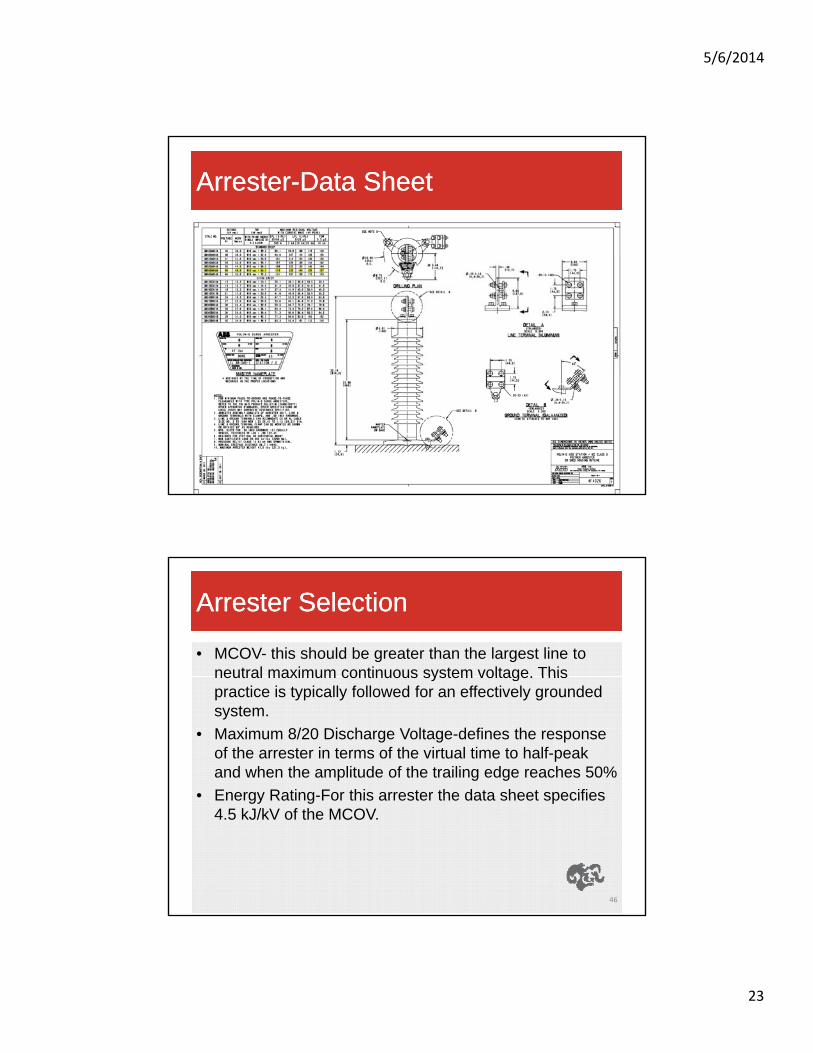
ArresterArrester--Data SheetData Sheet
45
Arrester SelectionArrester Selection
• MCOV- this should be greater than the largest line to neutral maximum continuous system voltage. Thisneutral maximum continuous system voltage. This practice is typically followed for an effectively grounded system.
• Maximum 8/20 Discharge Voltage-defines the response of the arrester in terms of the virtual time to half-peak and when the amplitude of the trailing edge reaches 50%
• Energy Rating-For this arrester the data sheet specifies• Energy Rating-For this arrester the data sheet specifies 4.5 kJ/kV of the MCOV.
46
5/6/2014
24
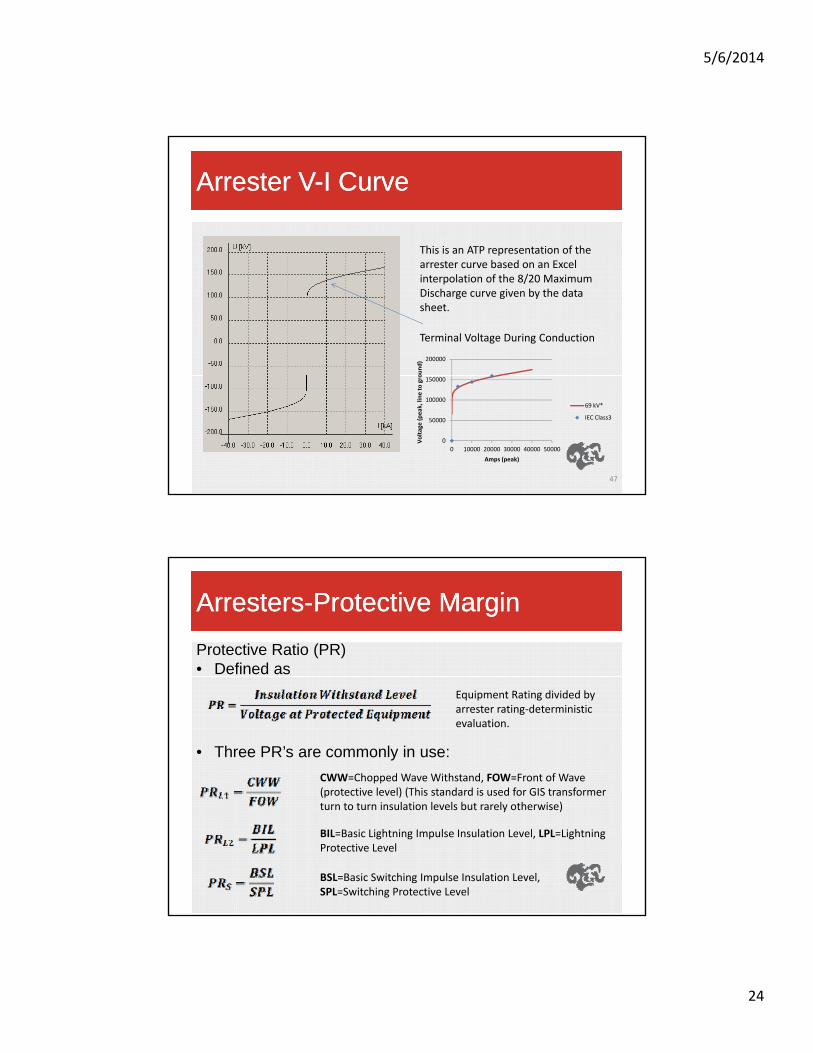
Arrester VArrester V--I CurveI Curve
This is an ATP representation of the
Terminal Voltage During Conduction
arrester curve based on an Excel interpolation of the 8/20 Maximum Discharge curve given by the data sheet.
200000
ound)
47
0
50000
100000
150000
0 10000 20000 30000 40000 50000
Voltage (peak, line to gro
Amps (peak)
69 kV*
IEC Class3
ArrestersArresters--Protective MarginProtective Margin
Protective Ratio (PR)• Defined as
• Three PR’s are commonly in use:
CWW=Chopped Wave Withstand, FOW=Front of Wave (protective level) (This standard is used for GIS transformer
Equipment Rating divided by arrester rating‐deterministic evaluation.
(p ) (turn to turn insulation levels but rarely otherwise)
BIL=Basic Lightning Impulse Insulation Level, LPL=Lightning Protective Level
BSL=Basic Switching Impulse Insulation Level, SPL=Switching Protective Level
5/6/2014
25
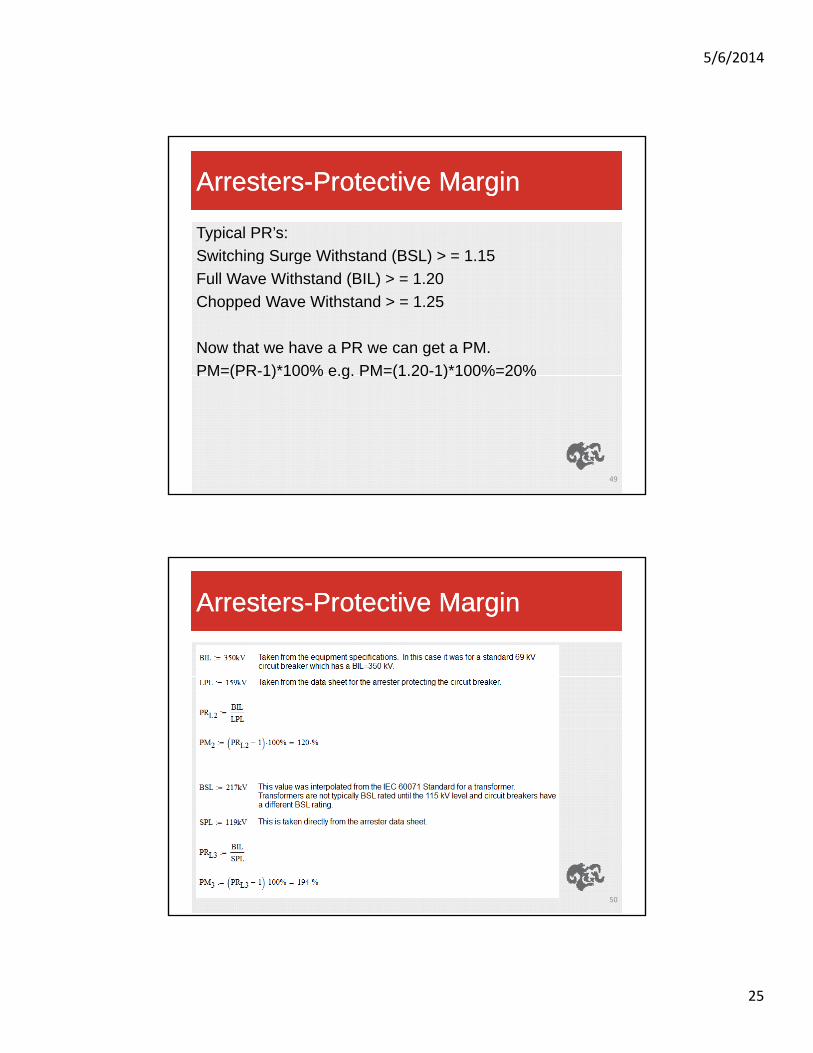
ArrestersArresters--Protective MarginProtective Margin
Typical PR’s:
Switching Surge Withstand (BSL) > = 1 15Switching Surge Withstand (BSL) > = 1.15
Full Wave Withstand (BIL) > = 1.20
Chopped Wave Withstand > = 1.25
Now that we have a PR we can get a PM.
PM=(PR-1)*100% e.g. PM=(1.20-1)*100%=20%PM (PR 1) 100% e.g. PM (1.20 1) 100% 20%
49
ArrestersArresters--Protective MarginProtective Margin
50
5/6/2014
26
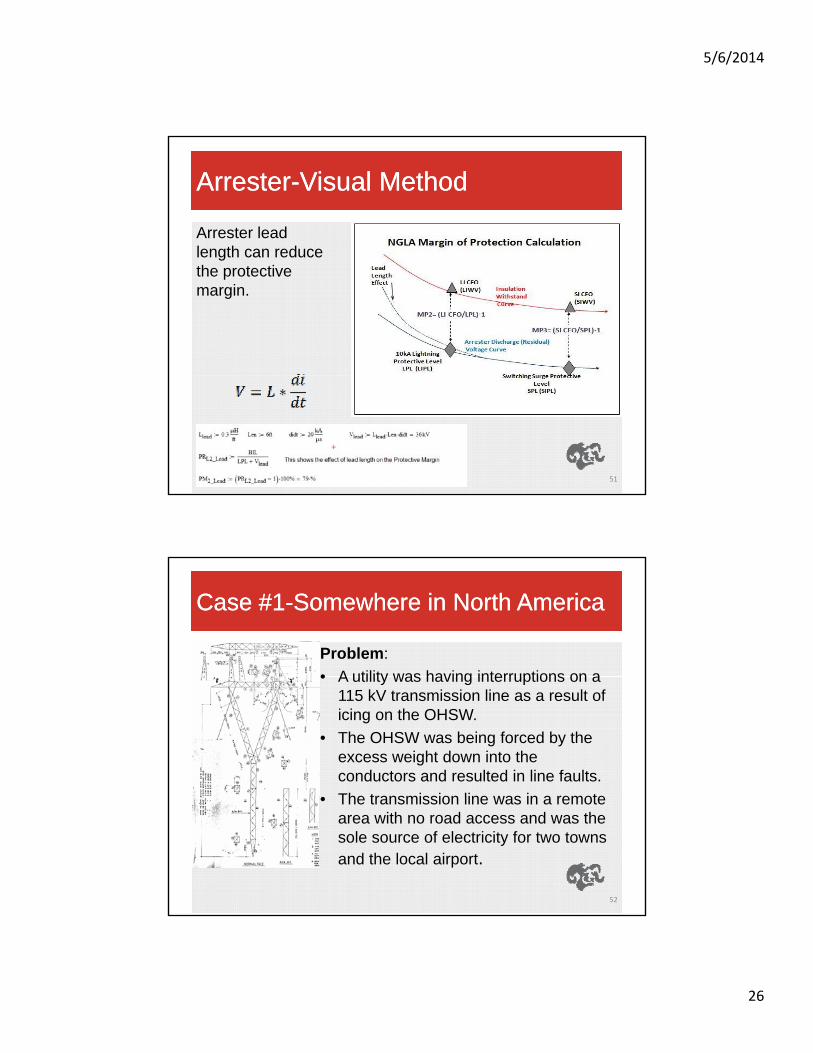
ArresterArrester--Visual MethodVisual Method
Arrester lead length can reducelength can reduce the protective margin.
51
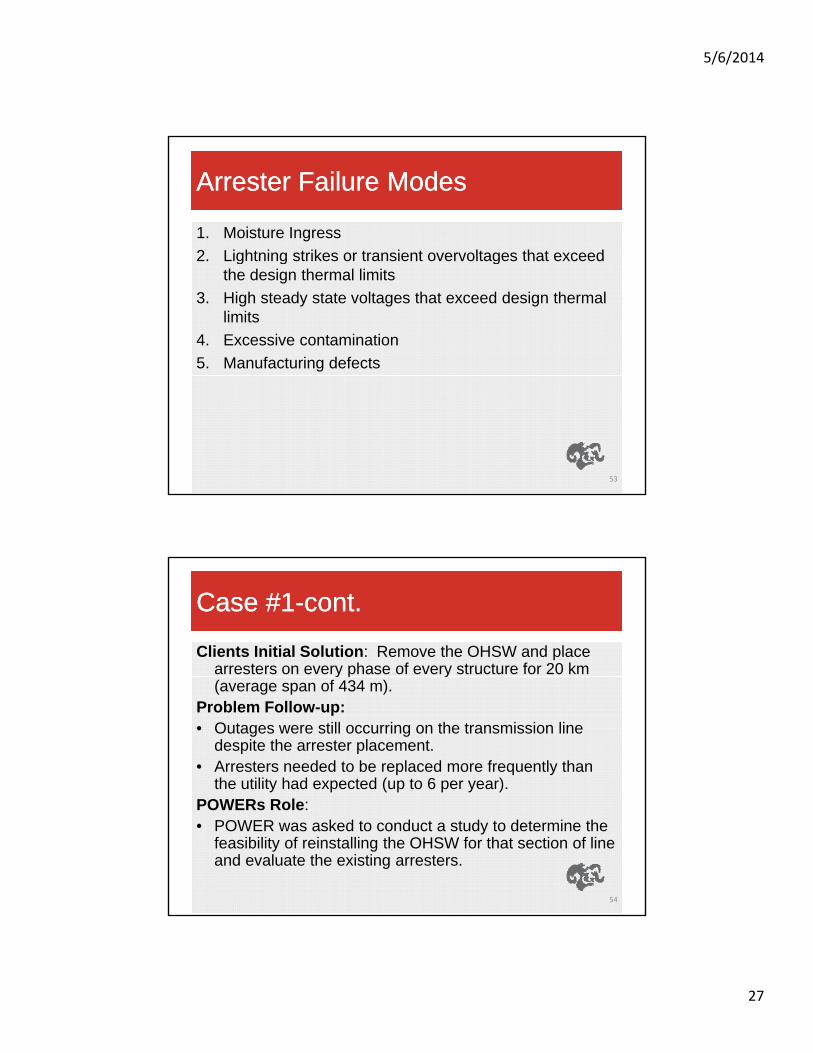
Case #1Case #1--Somewhere in North AmericaSomewhere in North America
Problem:
• A utility was having interruptions on a• A utility was having interruptions on a 115 kV transmission line as a result of icing on the OHSW.
• The OHSW was being forced by the excess weight down into the conductors and resulted in line faults.
The transmission line was in a remote• The transmission line was in a remote area with no road access and was the sole source of electricity for two towns and the local airport.
52
5/6/2014
27
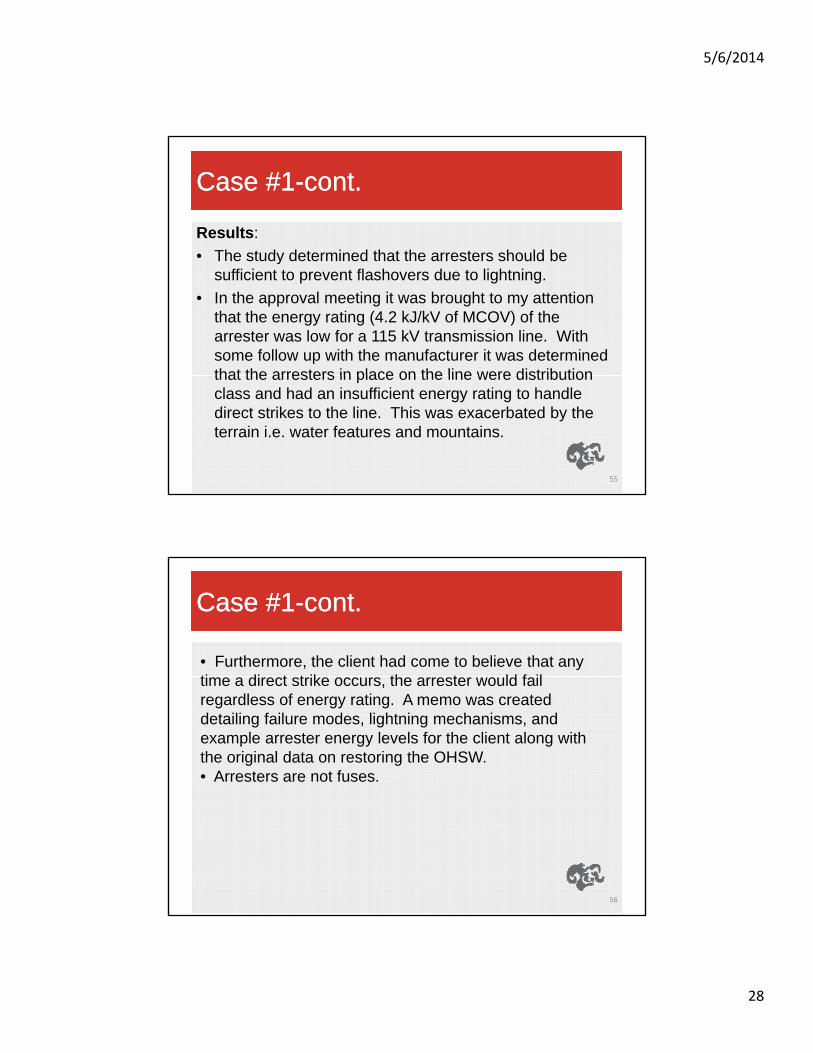
Arrester Failure ModesArrester Failure Modes
1. Moisture Ingress
2 Lightning strikes or transient overvoltages that exceed2. Lightning strikes or transient overvoltages that exceed the design thermal limits
3. High steady state voltages that exceed design thermal limits
4. Excessive contamination
5. Manufacturing defects
53
Case #1Case #1--cont.cont.
Clients Initial Solution: Remove the OHSW and place arresters on every phase of every structure for 20 km y p y(average span of 434 m).
Problem Follow-up:• Outages were still occurring on the transmission line
despite the arrester placement. • Arresters needed to be replaced more frequently than
the utility had expected (up to 6 per year). POWERs Role: • POWER was asked to conduct a study to determine the
feasibility of reinstalling the OHSW for that section of line and evaluate the existing arresters.
54
5/6/2014
28
Case #1Case #1--cont.cont.
Results:
• The study determined that the arresters should be• The study determined that the arresters should be sufficient to prevent flashovers due to lightning.
• In the approval meeting it was brought to my attention that the energy rating (4.2 kJ/kV of MCOV) of the arrester was low for a 115 kV transmission line. With some follow up with the manufacturer it was determined that the arresters in place on the line were distributionthat the arresters in place on the line were distribution class and had an insufficient energy rating to handle direct strikes to the line. This was exacerbated by the terrain i.e. water features and mountains.
55
Case #1Case #1--cont.cont.
• Furthermore, the client had come to believe that any ti di t t ik th t ld f iltime a direct strike occurs, the arrester would fail regardless of energy rating. A memo was created detailing failure modes, lightning mechanisms, and example arrester energy levels for the client along with the original data on restoring the OHSW.• Arresters are not fuses.
56

5/6/2014
29
Existing Arrester PerformanceExisting Arrester Performance
•Maximum energy absorption for existing arrester 4.2 kJ/kV * 115 kV = 483 kJ
57
Proposed Arrester PerformanceProposed Arrester Performance
•Maximum energy absorption for proposed arrester 9.0 kJ/kV * 115 kV = 1035 kJ
58
5/6/2014
30
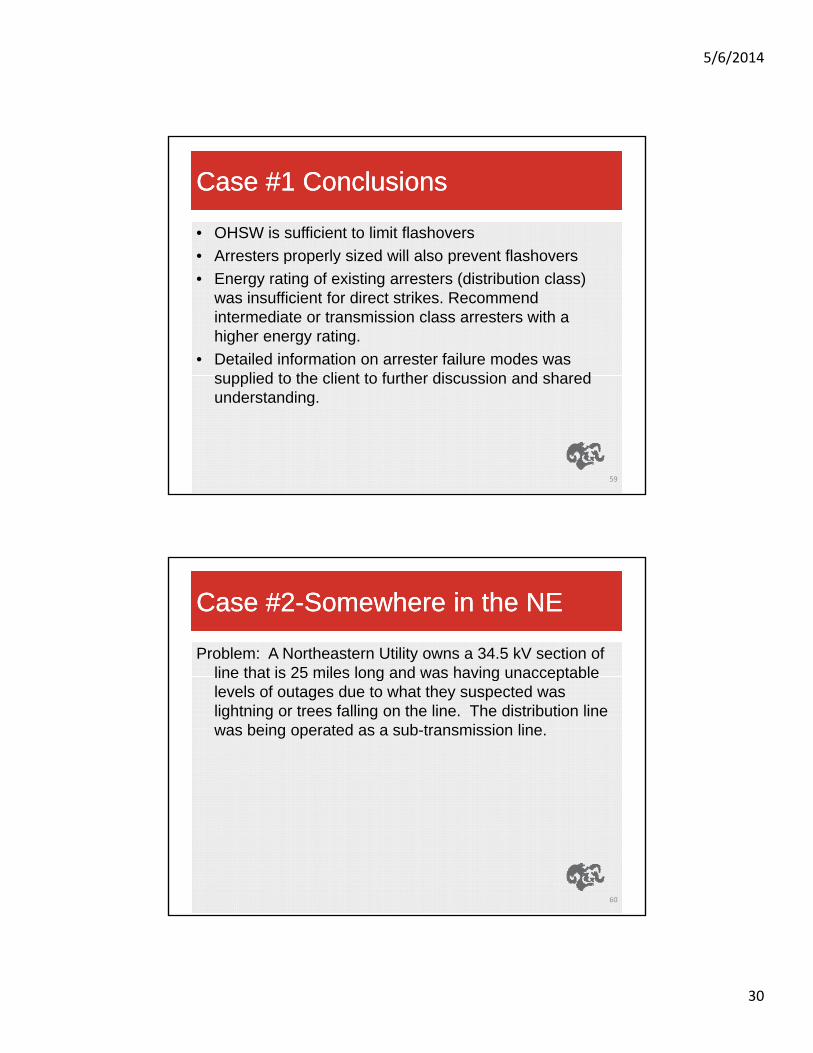
Case #1 ConclusionsCase #1 Conclusions
• OHSW is sufficient to limit flashovers
• Arresters properly sized will also prevent flashovers• Arresters properly sized will also prevent flashovers
• Energy rating of existing arresters (distribution class) was insufficient for direct strikes. Recommend intermediate or transmission class arresters with a higher energy rating.
• Detailed information on arrester failure modes was supplied to the client to further discussion and sharedsupplied to the client to further discussion and shared understanding.
59
Case #2Case #2--Somewhere in the NESomewhere in the NE
Problem: A Northeastern Utility owns a 34.5 kV section of line that is 25 miles long and was having unacceptableline that is 25 miles long and was having unacceptable levels of outages due to what they suspected was lightning or trees falling on the line. The distribution line was being operated as a sub-transmission line.
60
5/6/2014
31
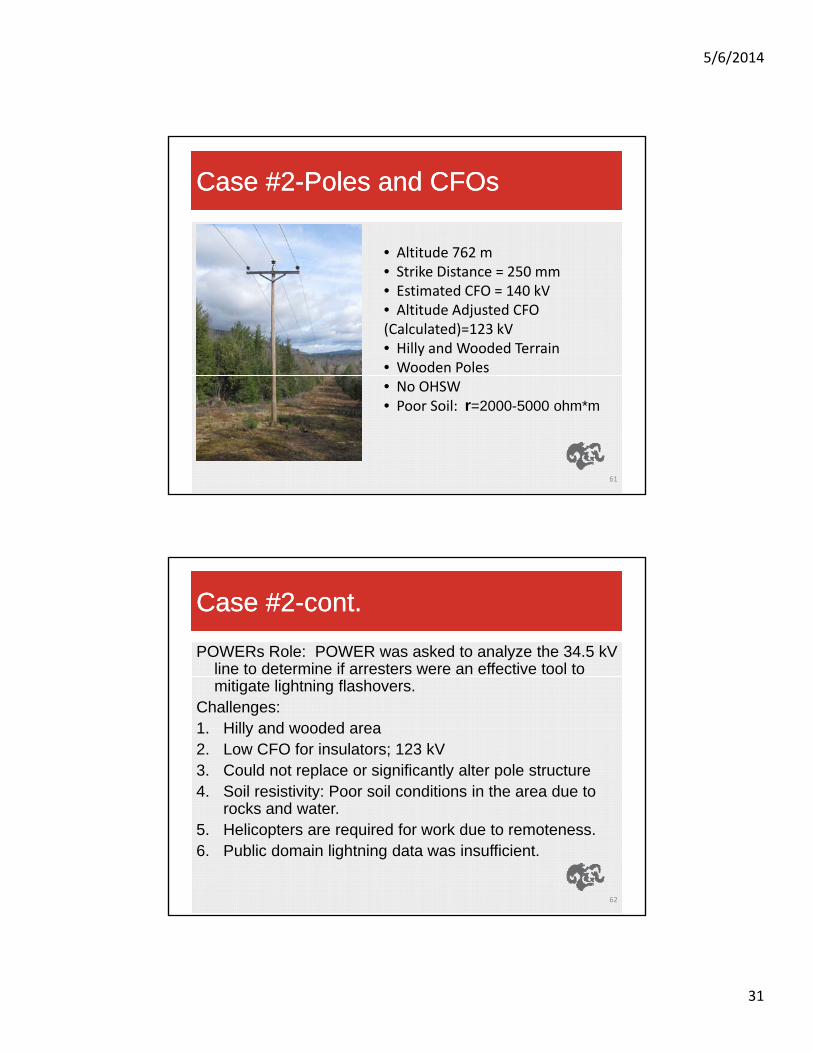
Case #2Case #2--Poles and CFOsPoles and CFOs
• Altitude 762 mAltitude 762 m• Strike Distance = 250 mm• Estimated CFO = 140 kV• Altitude Adjusted CFO (Calculated)=123 kV• Hilly and Wooded Terrain• Wooden Poles• No OHSW• Poor Soil: r=2000-5000 ohm*m
61
Case #2Case #2--cont.cont.
POWERs Role: POWER was asked to analyze the 34.5 kV line to determine if arresters were an effective tool to mitigate lightning flashovers.
Challenges:1. Hilly and wooded area2. Low CFO for insulators; 123 kV3. Could not replace or significantly alter pole structure4. Soil resistivity: Poor soil conditions in the area due to4. Soil resistivity: Poor soil conditions in the area due to
rocks and water.5. Helicopters are required for work due to remoteness.6. Public domain lightning data was insufficient.
62
5/6/2014
32
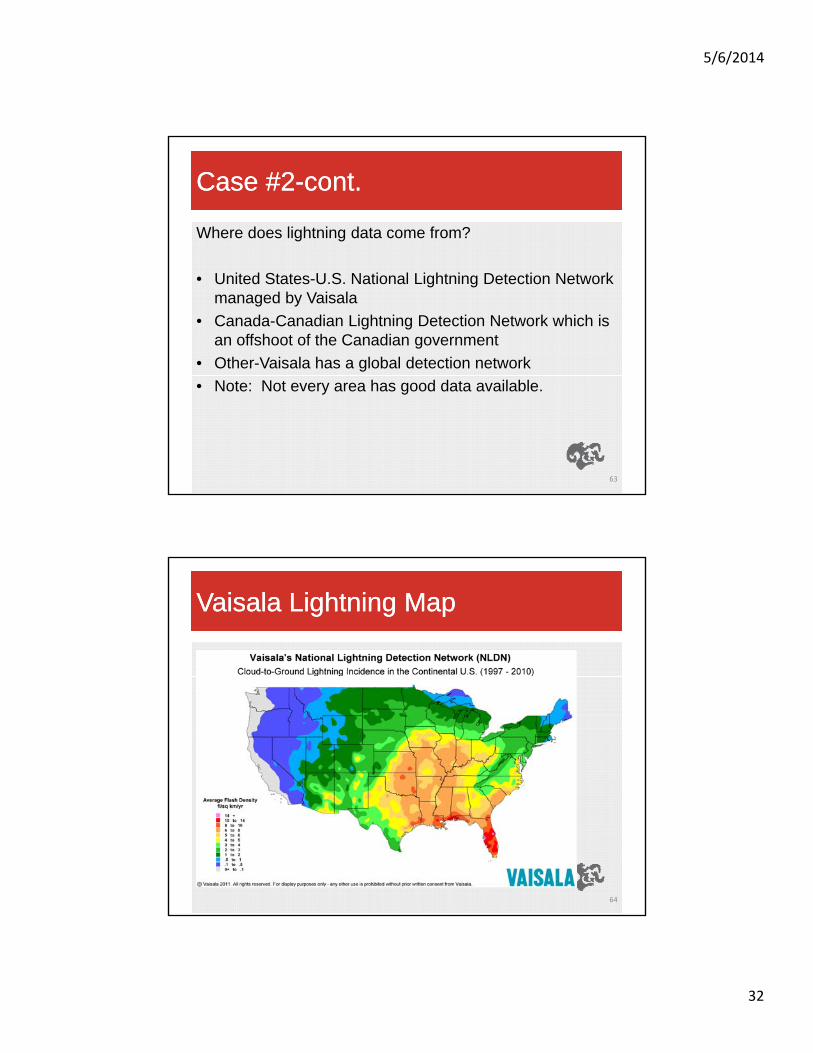
Case #2Case #2--cont.cont.
Where does lightning data come from?
• United States-U.S. National Lightning Detection Network managed by Vaisala
• Canada-Canadian Lightning Detection Network which is an offshoot of the Canadian government
• Other-Vaisala has a global detection network
• Note: Not every area has good data available.
63
VaisalaVaisala Lightning MapLightning Map
64

5/6/2014
33
Case #2Case #2--cont.cont.
What kind of data can you get?
65
Case #2Case #2--cont.cont.
What can you do with the data?
• Each block is 1 square kilometer• Numbers represent total strikes over 5 years
66
5/6/2014
34
Case #2Case #2--cont.cont.
67
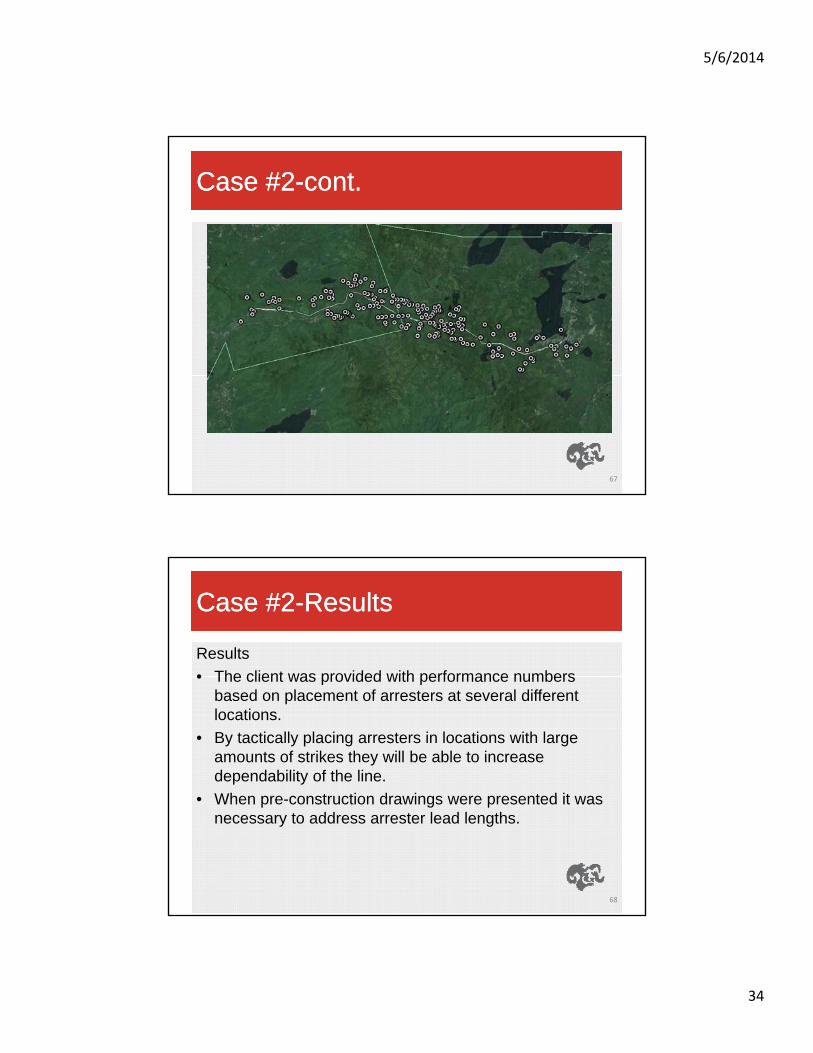
Case #2Case #2--ResultsResults
Results
• The client was provided with performance numbers• The client was provided with performance numbers based on placement of arresters at several different locations.
• By tactically placing arresters in locations with large amounts of strikes they will be able to increase dependability of the line.
When pre construction drawings were presented it was• When pre-construction drawings were presented it was necessary to address arrester lead lengths.
68
5/6/2014
35
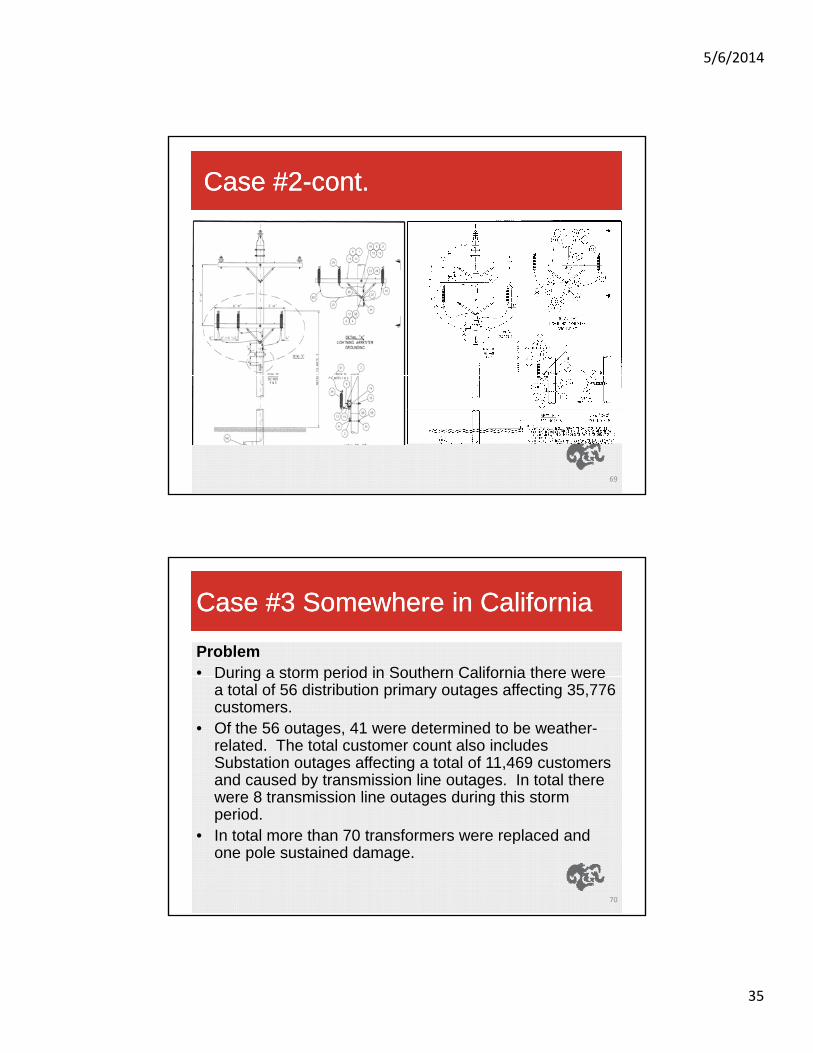
Case #2Case #2--cont.cont.
69
Case #3 Somewhere in CaliforniaCase #3 Somewhere in California
Problem• During a storm period in Southern California there wereDuring a storm period in Southern California there were
a total of 56 distribution primary outages affecting 35,776 customers.
• Of the 56 outages, 41 were determined to be weather-related. The total customer count also includes Substation outages affecting a total of 11,469 customers and caused by transmission line outages. In total there were 8 transmission line outages during this stormwere 8 transmission line outages during this storm period.
• In total more than 70 transformers were replaced and one pole sustained damage.
70
5/6/2014
36
CaliforniaCalifornia--cont.cont.
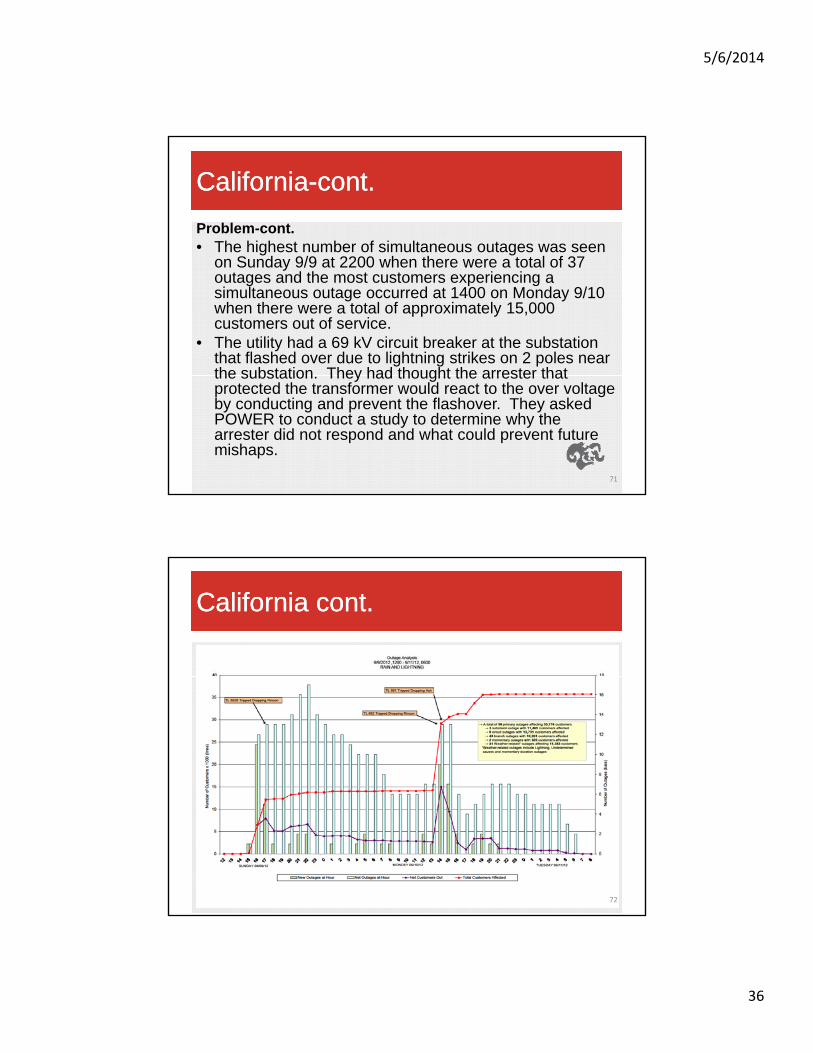
Problem-cont.• The highest number of simultaneous outages was seen
S d 9/9 2200 h h l f 3on Sunday 9/9 at 2200 when there were a total of 37 outages and the most customers experiencing a simultaneous outage occurred at 1400 on Monday 9/10 when there were a total of approximately 15,000 customers out of service.
• The utility had a 69 kV circuit breaker at the substation that flashed over due to lightning strikes on 2 poles near the substation They had thought the arrester thatthe substation. They had thought the arrester that protected the transformer would react to the over voltage by conducting and prevent the flashover. They asked POWER to conduct a study to determine why the arrester did not respond and what could prevent future mishaps.
71
California cont.California cont.
72
5/6/2014
37
California cont.California cont.
POWERs Role: • Conduct a lightning transient study to determine the• Conduct a lightning transient study to determine the
voltage magnitudes due to lightning strikes entering the Substation. The model will include TL682, TL688, TL6932, and any shunt connected compensation equipment in the Substation.
• Voltages along the line and at the Substation will be monitored and the stroke magnitude required to producemonitored and the stroke magnitude required to produce voltages in excess of the system BILs determined.
73
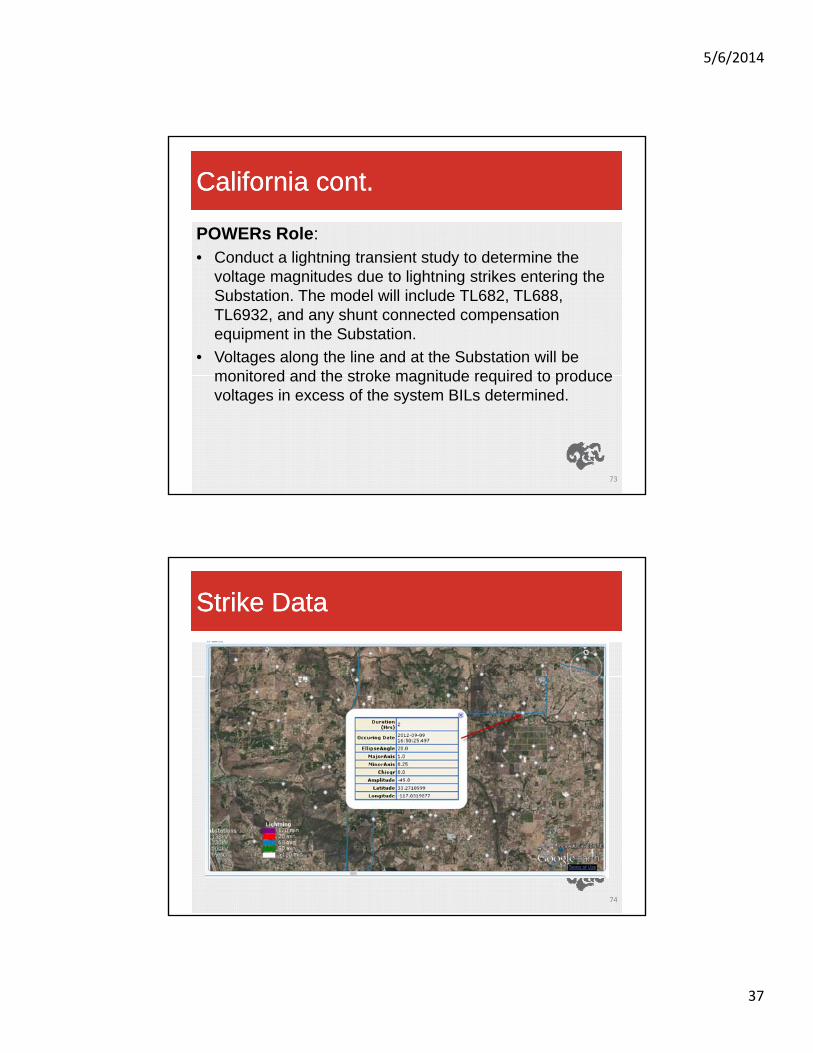
Strike DataStrike Data
74

5/6/2014
38
Strike DataStrike Data
75
MTBF calc and descriptionMTBF calc and description
Flashover and MTBF
This is a simpled 0.813684km Distance to the flashover location in km (STRK2 location). This is a
very small distance. As the distance increases the MTBF goesdown indicating a greater exposure.
BFR 5.0flashovers
100km yr Recommended value for a 69 kV line voltage.
n 1 This is the number of transmission lines. We are only consideringTL682. More lines means greater exposure.
MTBF1
d BFR n This is equation 33 from the IEEE Std 1313.2 rearranged to solve for
MTBF
This is a simple calculation fro the IEEE 1313.2‐1999 standard for Mean Time Between Failures (MTBF) of substations without line side or adjacent pole arresters. An acceptable value is 50‐
76
MTBF 24.58yr This is the time, in years, between catastrophic failures for one lineat the Lilac substation with a healthy insulation level on the line andassuming a shield wire was in place to protect the line.
acceptable value is 50200 years for air insulated systems.

5/6/2014
39
ConclusionsConclusions
• As a result of the inductance of the bus the conduction of the arrester was delayed and the protective marginthe arrester was delayed and the protective margin reduced enough that the voltage at the breaker exceeded the BIL and flashed over.
• It was recommended that arresters be placed either at the line entrance busswork or on the line side of the breaker to clamp surges below the minimum BIL.
• MCOV was selected based on client application practice• MCOV was selected based on client application practice and to provide sufficient protective margin.
• Line insulation level of 138 kV was determined to be a small contributor to the flashover.
77
Overall ConclusionsOverall Conclusions
• Arrester placement can increase reliability of lines versus lightning by reducing flashovers.lightning by reducing flashovers.
• Arrester selection is primarily based on MCOV, TOV withstand, and energy rating.
• Arrester lead lengths should always be minimized.
• Lightning data can be purchased and used to strategically place arresters or analyze performance.
• Lightning is a probabilistic event that can be described by statistics for self healing insulation. Use as deterministic for equipment rating.
• Sufficient protective margins can help prevent equipment damage.
78
5/6/2014
40
ReferencesReferences
1. IEEE Std. C62.22-2009 IEEE Guide for the Application of ppMetal-Oxide Surge Arresters for Alternating-Current Systems
2. IEEE Std. C62.11 IEEE Standard for Metal-Oxide Surge Arresters for AC Power Circuits (>1 kV)
3. IEEE Std. 1410-2010 IEEE Guide for Improving the Lightning Performance of Electric Power Overhead Distribution Lines
4 IEEE Std 1243 1997 IEEE Guide for Improving the4. IEEE Std. 1243-1997 IEEE Guide for Improving the Lightning Performance of Transmission Lines
5. Insulation Coordination for Power Systems, Andrew R. Hileman.
6. www.arresterworks.com
79
QuestionsQuestions
?Stacey PageElectrical EngineerSCADA and Analytical [email protected]‐758‐6029 ext. 2608
80