objectives identify rational functions analyze graphs of rational functions’ given a function,...
TRANSCRIPT


Objectives
Identify rational functionsAnalyze graphs of rational functions’Given a function, draw the graphExplain characteristics of the graphGiven a variety of graphs, select the rational function graph and defend your choice

Introduction
• The following are great websites to explore rational functions:
http://id.mind.net/~zona/mmts/functionInstitute/rationalFunctions/rationalFunctions.html
http://hh4.hollandhall.org/kluitwieler/Pages/RationalFunctions/Welcome.htm

I. Definition
• A rational function can be written in the form:
• p(x) and q(x) are polynomials where q(x)≠0
f(x) = p(x)q(x)

Examples of rational functions
2 7x
2 5 6
2
x x
x
1
x
72
5
x
x2 5
2 7
x
x
3x

Which of the following functions are rational?
Yes! No! Yes!

These rational functions make all kinds of “funny
looking” graphs…

Continuous or Discontinuous?

Graphs are discontinuous because they have breaks in the graph.
• These breaks called “points of discontinuity” are either holes or vertical asymptotes.
• What causes these points of discontinuity?
• First we must look at the domain of the function.

II. Domain
• The domain of a rational functions of x includes all real numbers except x-values that make the denominator zero.
Think…
What can you plug in for x? Or... What can you NOT plug in for x?
II. Domain
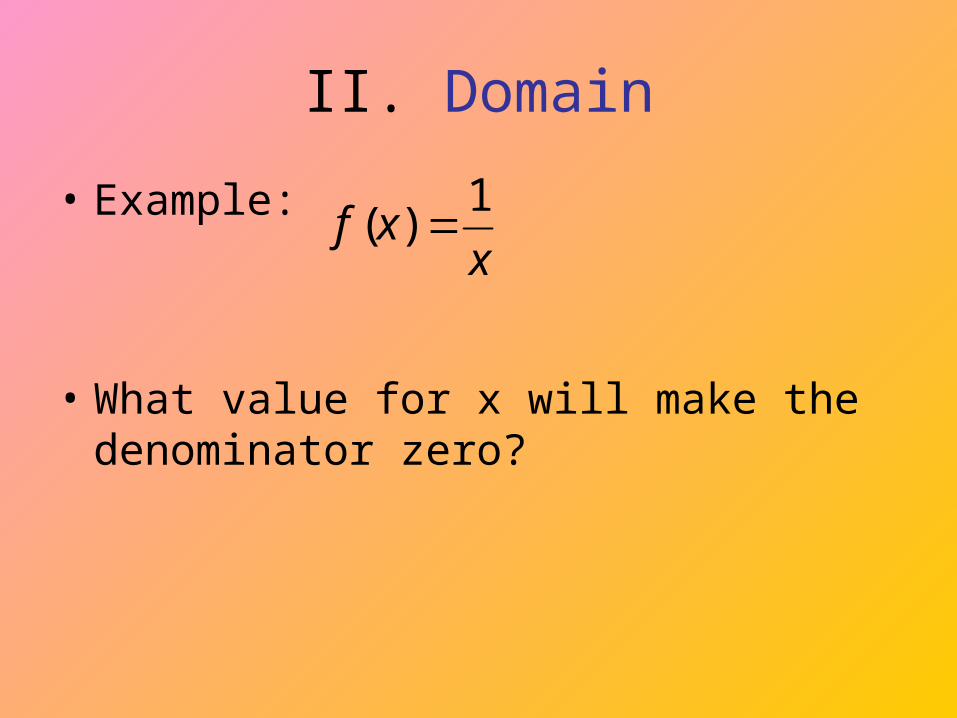
• Example:
• What value for x will make the denominator zero?
xxf
1)(

II. Domain
• Example:
• 0 will make the denominator zero.
• Domain of f(x) is:
{all real numbers except x=0.}
xxf
1)(

2
2
4 45( )
2 15
x xf x
x x
In order to find what makes the denominator zero, you will need to factor.
( 5)( 9)( )
( 5)( 3)
x xf x
x x
Since -5 and 3 will make the denominator zero, these graphs will have points of discontinuity at x = -5 and x = 3.

But how do you know if it is a hole or vertical asymptote?
3 5( )
( 4)
xf x
x x
2
3
12y
x x
2
2( )
3 4
xg x
x
Find the points of discontinuity:

It will produce a hole in the line if it cancels…
• Example:
Because 4 will make the denominator = 0, then there is a point of discontinuitypoint of discontinuity at x = 4. However, since the (x-4)’s cancel, then it is a holehole.
( 4)3
4
xx
x
( 4)3
4
xx
x

Since the (x-4)’s cancel out, we are really left with a line that looks like the line y = x + 3, but with a hole in it at x = 4.
( 4)3
4
xxyx
Graph won’t appear to have a hole at x = 4.
Notice how to enter it into calculator…
hole
III. Vertical Asymptote
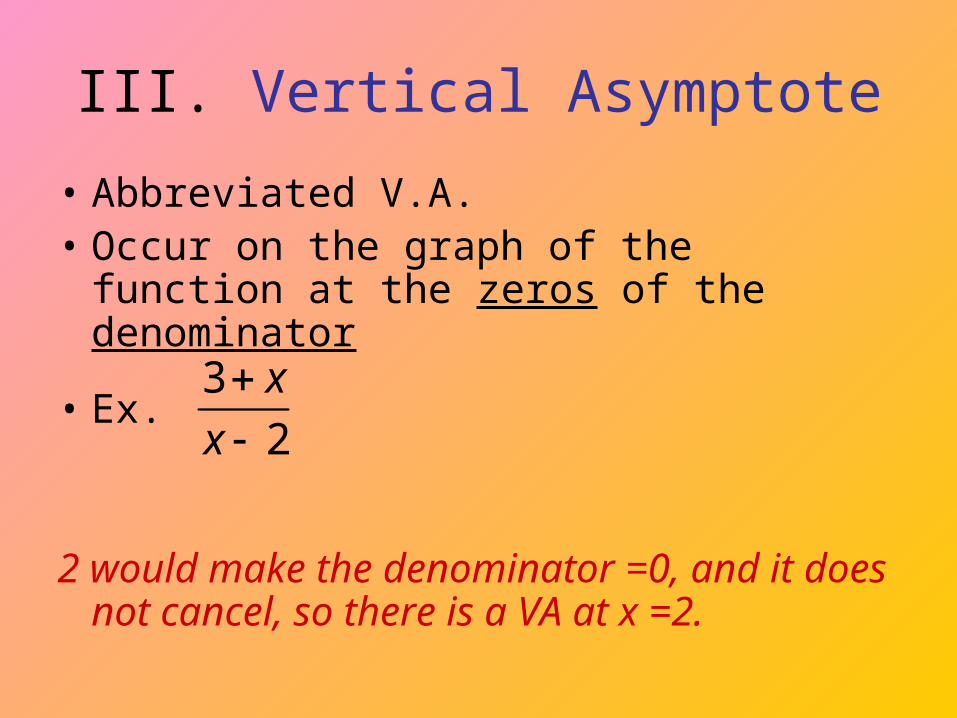
• Abbreviated V.A.• Occur on the graph of the function at the
zeros of the denominator
• Ex.
2 would make the denominator =0, and it does not cancel, so there is a VA at x =2.
3
2
x
x

III. Vertical Asymptote
• Graph

7
( 1)( 5)
xy
x x
2 3( )
3
x xf x
x
( 6)( 9)( )
( 9)( 9)( 6)
x xh x
x x x
State whether the points of discontinuity are holes or asymptotes. a.

IV. Horizontal Asymptote
• Abbreviated H.A.
• There are 3 different cases to determine horizontal asymptotes:

Horizontal Asymptotes
1. If the degree of p(x) is less than the degree of q(x), the graph has the x-axis (y=0) as a horizontal asymptote.

Horizontal Asymptotes• Case 1
13
2)(
2 x
xxf
Notice that the graph crosses the H.A. H.A.s only deal with END BEHAVIOR.

Horizontal Asymptotes
2. If the degree of p(x) equals degree of q(x), the graph has the line y=a/b, where a is the leading coefficient of p(x) and b is the leading coefficient of q(x).
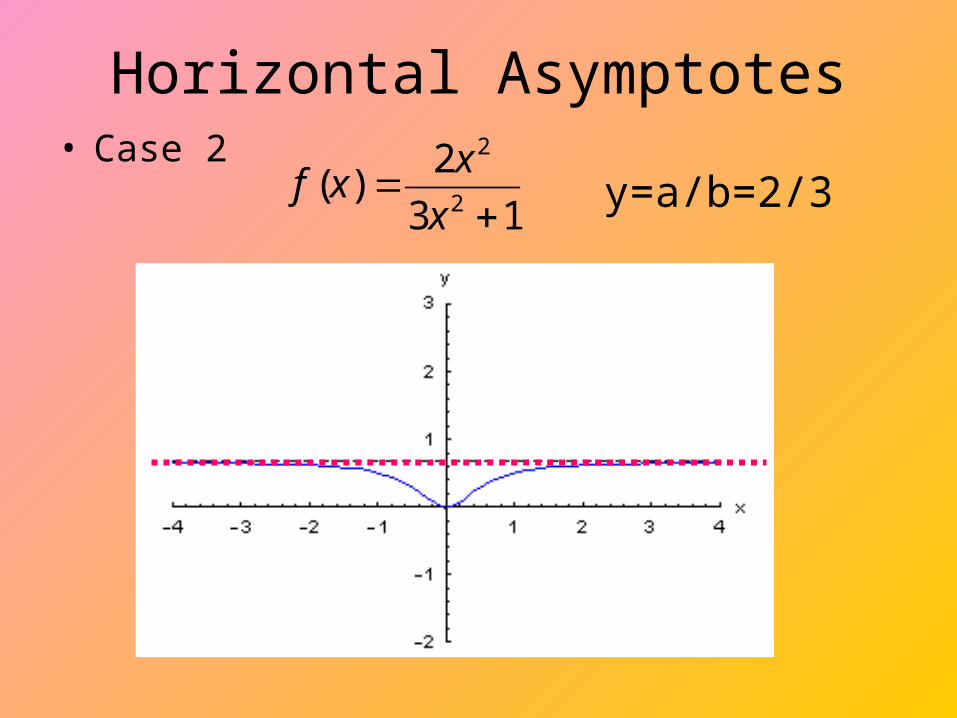
Horizontal Asymptotes• Case 2
13
2)(
2
2
x
xxf y=a/b=2/3

Horizontal Asymptotes
3. If the degree of p(x) is greater than the degree of q(x), the graph has no horizontal asymptote.

Horizontal Asymptotes• Case 3
13
2)(
2
3
x
xxf No H.A.

4 3( )
2 1
xg x
x
23 6
2
x xy
x
3
4
3 4( )
6
xh x
x

V. x-intercepts
• Occur where p(x) equals zero (set the numerator = to zero)
If p(x) is a constant (or imaginary), there is no x-intercept
13
22)(
2
3
x
xxf
22 2( )
3 1
xf x
x
2( )
3 1f x
x

VI. y-intercepts
• Find by substituting zero in for x
• Ex.
13
22)(
2
3
x
xxf
21
2
1)0(3
2)0(2)0(
f
(0,2) is the y-intercept
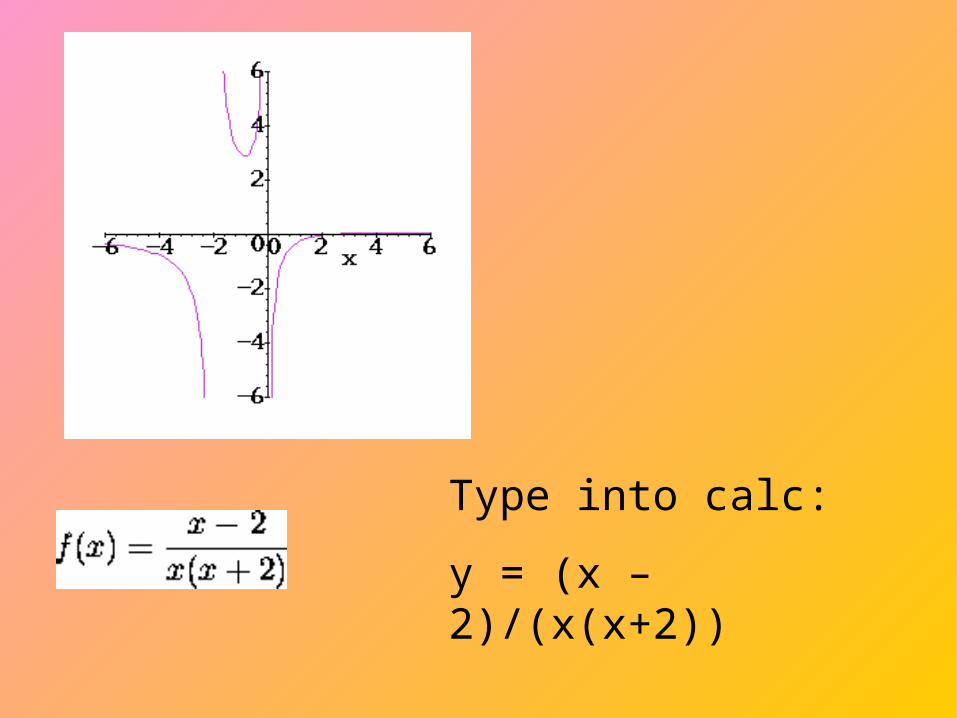
Type into calc:
y = (x – 2)/(x(x+2))

Guidelines for Graphing Rational Functions
1. Find and plot the y-intercept
2. Find the zeros of p(x) and plot x-intercepts
3. Find zeros of q(x). Sketch vertical asymptotes
4. Find and sketch the horizontal asymptotes
5. Plot a few points around intercepts and asymptotes
6. Use smooth curves to complete the graph

Example 1
• y-intercept 2
3)(
x
xf3
0-2- 3 2
=(0,-3/2)

Example 1
• x-intercept – num. is 3, there are no x-int.2
3)(
x
xf

Example 1
• Vertical asymptotes – x-2=0 so x=22
3)(
x
xf

Example 1• Horizontal asymptotes is y=0
2
3)(
x
xf

Example 1
• Additional Points x -4 1 3 5
f(x) -0.5 -3 3 1
2
3)(
x
xf
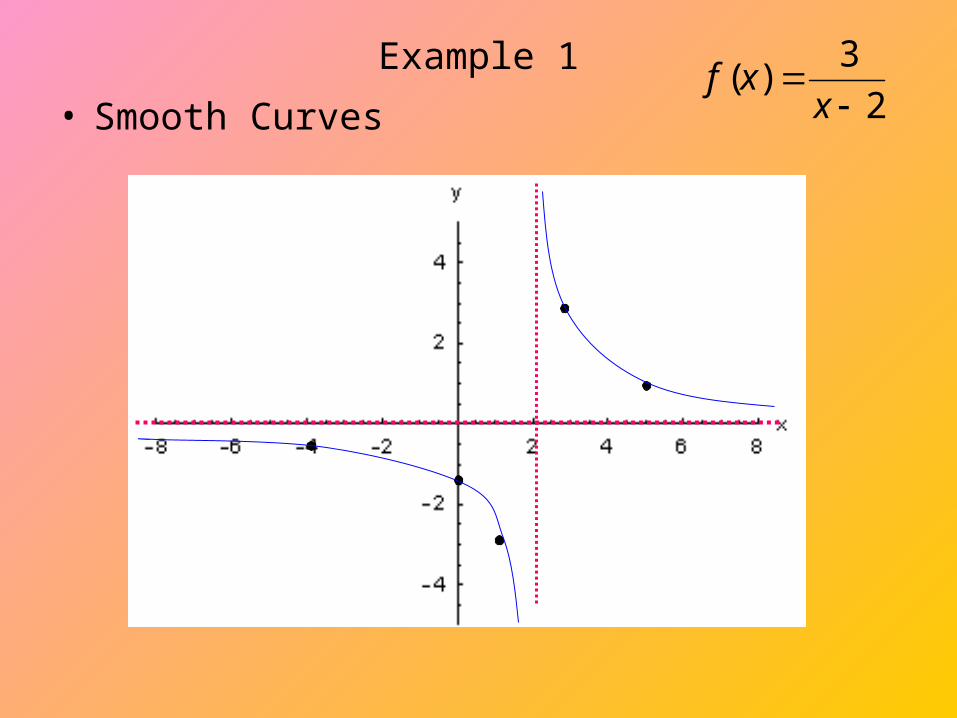
Example 1
• Smooth Curves 2
3)(
x
xf
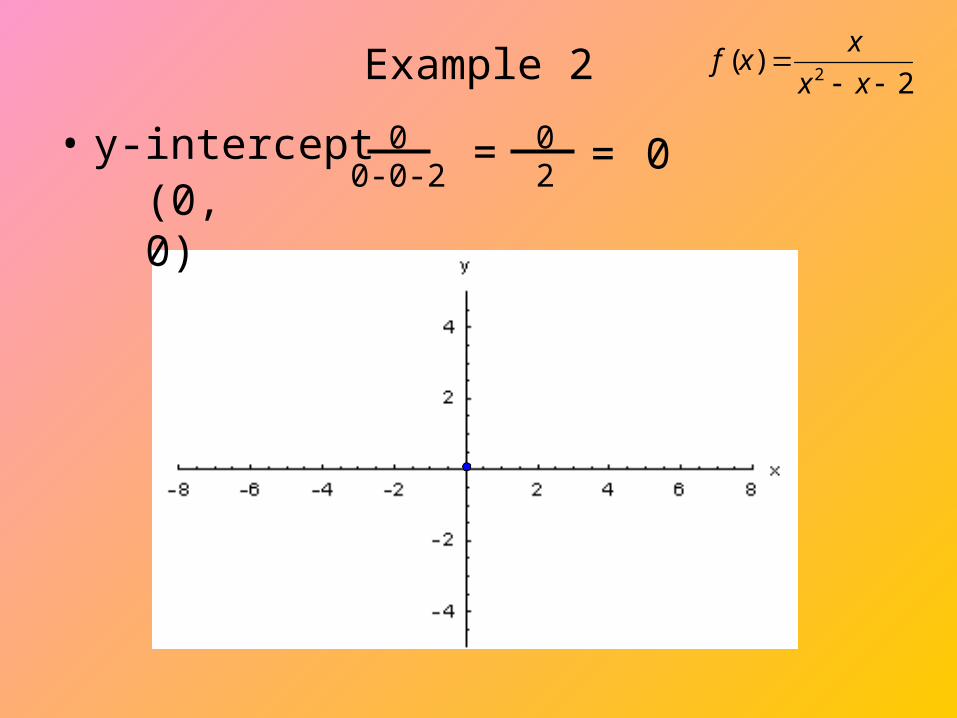
Example 2
• y-intercept
2)(
2
xx
xxf
000-0-2
= 02
=(0,0)

Example 2
• x-intercept Numerator is zero when x=0
2)(
2
xx
xxf
(0,0)

Example 2
• Vertical asymptotes
2)(
2
xx
xxf
x2-x-2 = (x + 1)(x - 2)x=-1x=2
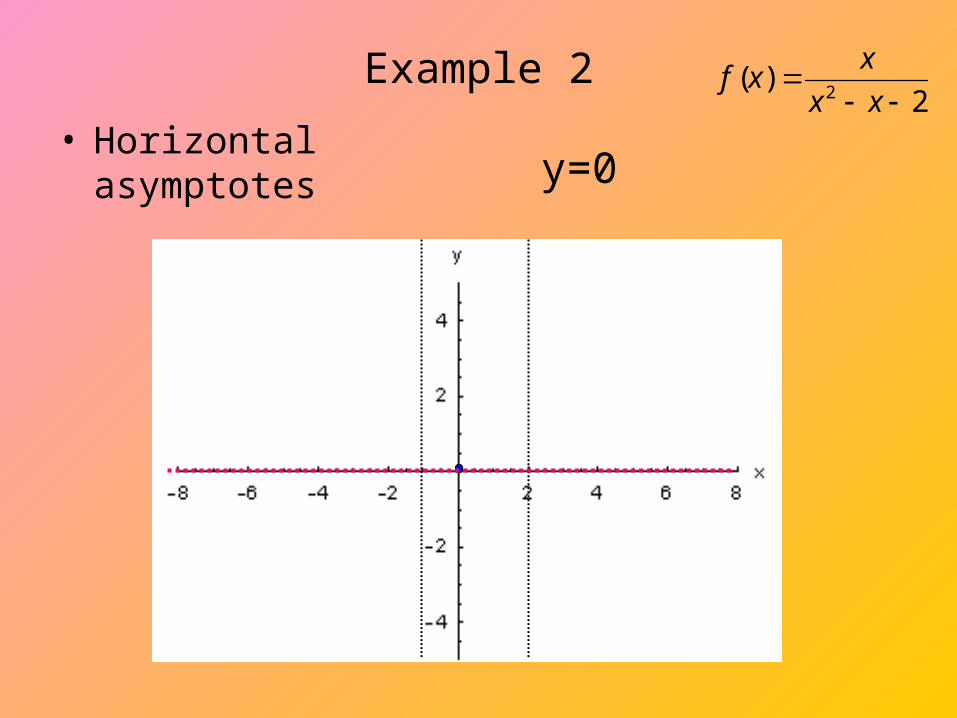
Example 2
• Horizontal asymptotes2
)(2
xx
xxf
y=0

Example 2• Additional Points
x -3 -0.5 1 3
f(x)
2)(
2
xx
xxf
-0.3 0.4 -0.5 0.75
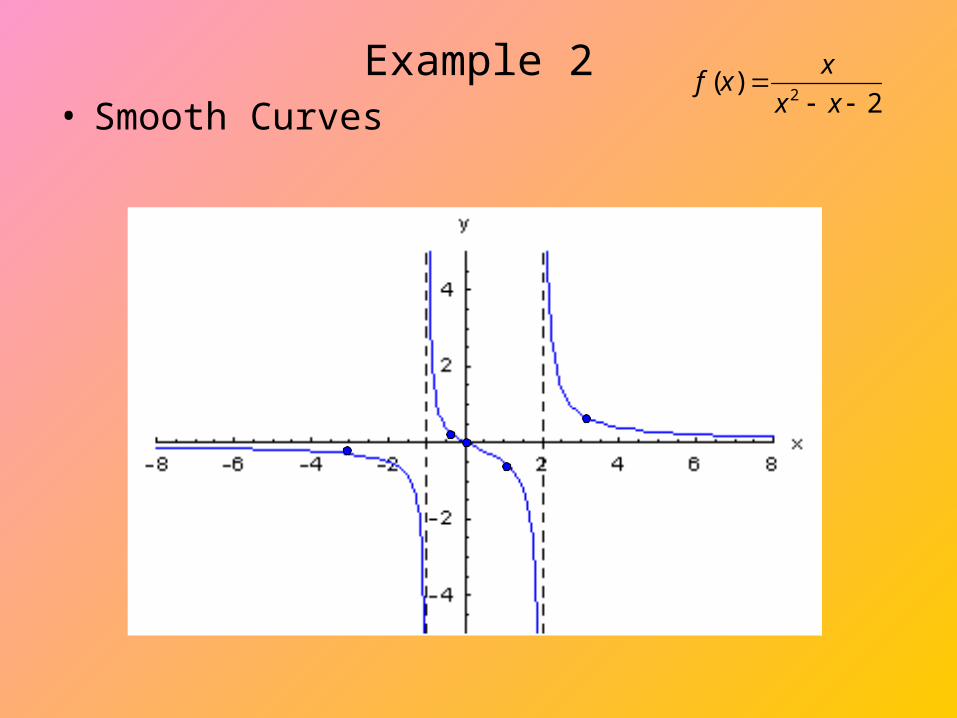
Example 2• Smooth Curves 2
)(2
xx
xxf

x-intercepts - To make the numerator 0, x must be zero. (0, 0) is the x-intercept.
y-intercepts - (0, 0) is also the y-intercept.
vertical asymptotes ("bad" x-values) - Factor the bottom into (x - 3)(x +3). Setting this equal to zero we get two vertical asymptotes: x = 3 and x = -3. So far, our graph has a point at (0, 0) and two vertical dashed lines.
horizontal asymptotes (end behavior) - The denominator has the highest degree term. Therefore, the denominator dominates (grows bigger faster than the top). Therefore, the y-values approach zero as x grows. Therefore y = 0 is the horizontal asymptote.

FOR MORE…GO TO…http://www.wiu.edu/users/mfjro1/wiu/tea/Functions/handouts/graphrat-howto.htm#near