object orie’d data analysis, last time sizer analysis –statistical inference for histograms...
TRANSCRIPT
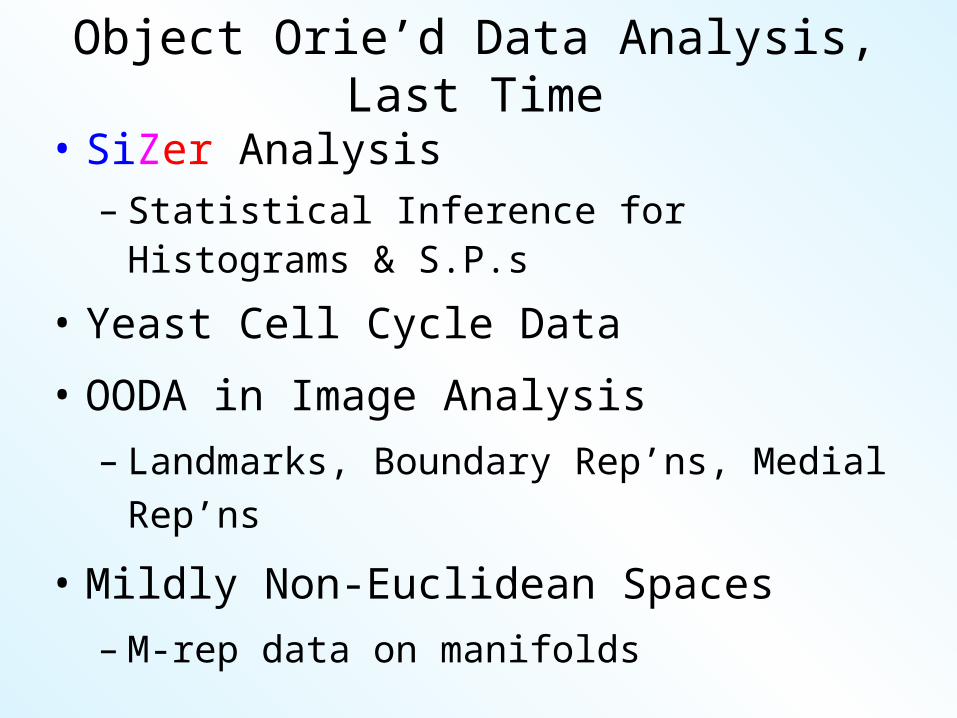
Object Orie’d Data Analysis, Last Time
• SiZer Analysis– Statistical Inference for Histograms &
S.P.s
• Yeast Cell Cycle Data
• OODA in Image Analysis– Landmarks, Boundary Rep’ns, Medial
Rep’ns
• Mildly Non-Euclidean Spaces– M-rep data on manifolds

Mildly Non-Euclidean Spaces
Statistical Analysis of M-rep DataRecall: Many direct products of:• Locations• Radii• Angles I.e. points on smooth manifold
Data in non-Euclidean SpaceBut only mildly non-Euclidean
Mildly Non-Euclidean Spaces
Statistical Analysis of M-rep DataRecall: Many direct products of:• Locations• Radii• Angles Mathematical Summarization:Lie Groups and/or symmetric spaces
Mildly Non-Euclidean Spaces
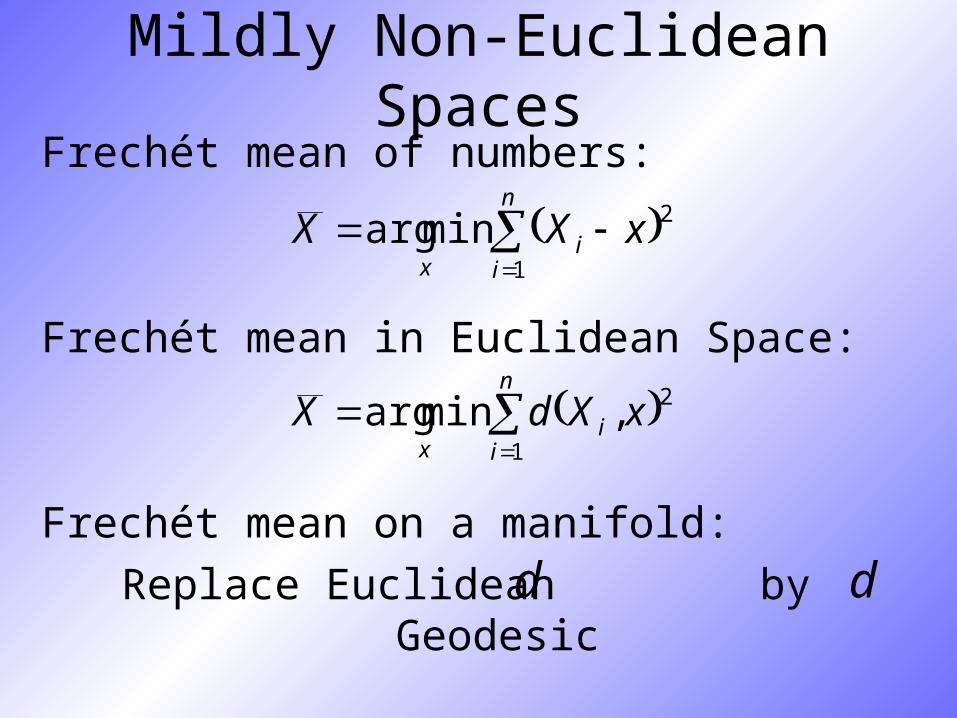
Frechét mean of numbers:
Frechét mean in Euclidean Space:
Frechét mean on a manifold:Replace Euclidean by Geodesic
n
ii
xxXX
1
2minarg
d
n
ii
xxXdX
1
2,minarg
d
Mildly Non-Euclidean Spaces
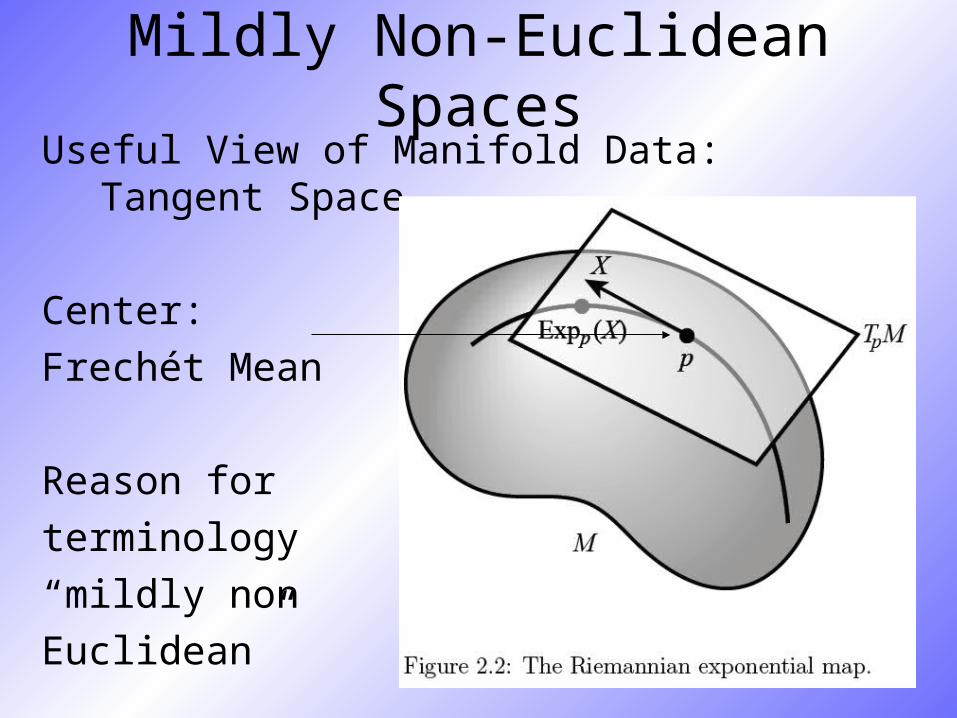
Useful View of Manifold Data: Tangent Space
Center:Frechét Mean
Reason forterminology“mildly nonEuclidean”
Mildly Non-Euclidean Spaces
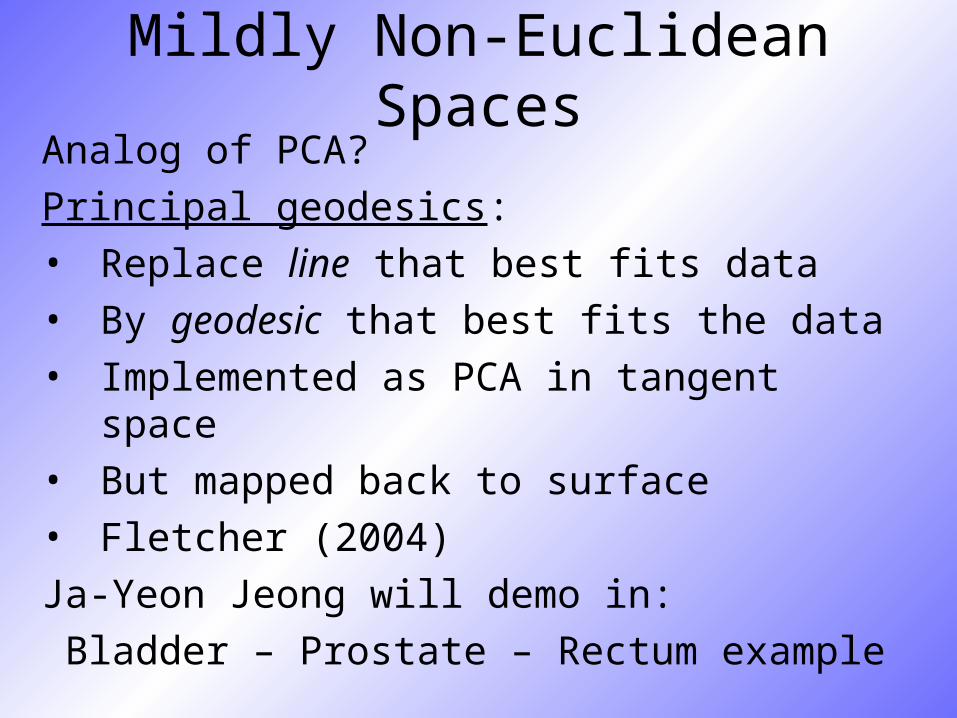
Analog of PCA?Principal geodesics:• Replace line that best fits data• By geodesic that best fits the data• Implemented as PCA in tangent space• But mapped back to surface• Fletcher (2004)Ja-Yeon Jeong will demo in: Bladder – Prostate – Rectum example
Mildly Non-Euclidean Spaces
Interesting Open Problems:
• Fully geodesic PGA?– E.g. data “just north of equator” on
sphere
• Gaussian Distribution on Manifold?
• Analog of Covariance?
• Simulation on Manifold?
Mildly Non-Euclidean Spaces
Aside: There is a mathematical statistics literature on “data on manifolds”
• Ruymgaart (1989)
• Hendriks, Janssen & Ruymgaart (1992)
• Lee & Ruymgaart (1996)
• Kim (1998)
• Bhattacharya & Patrangenaru (2003)
…
Strongly Non-Euclidean Spaces
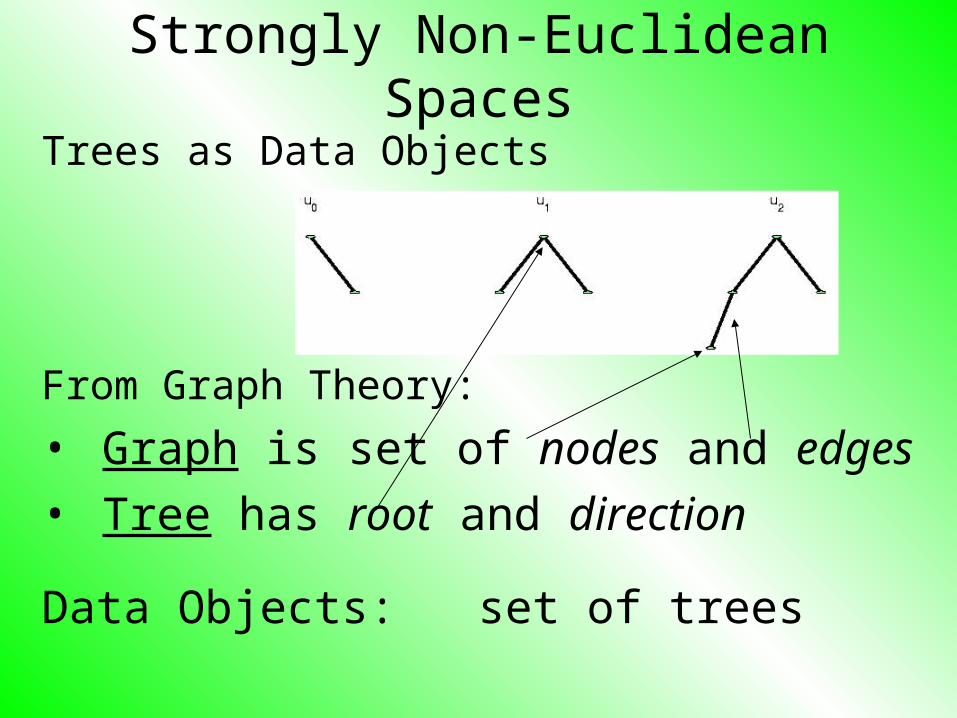
Trees as Data Objects
From Graph Theory:
• Graph is set of nodes and edges• Tree has root and direction
Data Objects: set of trees

Strongly Non-Euclidean Spaces
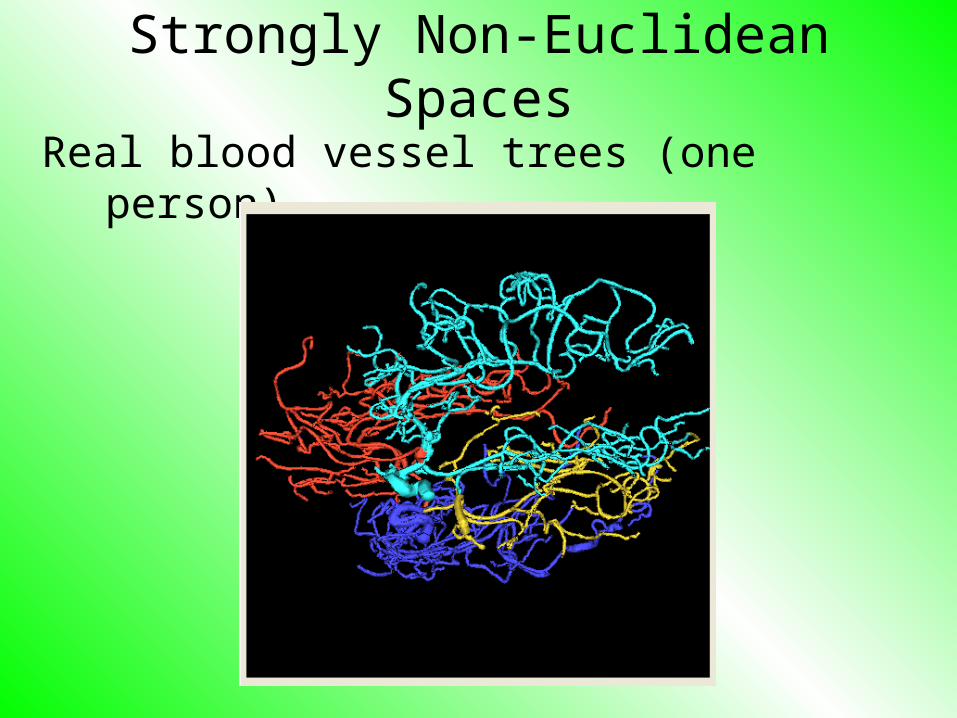
Motivating Example:
• Blood Vessel Trees in Brains
• From Dr. Elizabeth Bullitt
• Segmented from MRIs
• Very complex structure
• Want to study population of trees
• Data Objects are trees

Strongly Non-Euclidean Spaces
Real blood vessel trees (one person)

Strongly Non-Euclidean Spaces
Real blood vessel trees (one person)

Strongly Non-Euclidean Spaces
Real blood vessel trees (one person)
Strongly Non-Euclidean Spaces
Real blood vessel trees (one person)

Strongly Non-Euclidean Spaces
Real blood vessel trees (one person)

Strongly Non-Euclidean Spaces
Statistics on Population of Tree-Structured Data Objects?
• Mean???• Analog of PCA???
Strongly non-Euclidean, since:• Space of trees not a linear space• Not even approximately linear
(no tangent plane)
Strongly Non-Euclidean Spaces
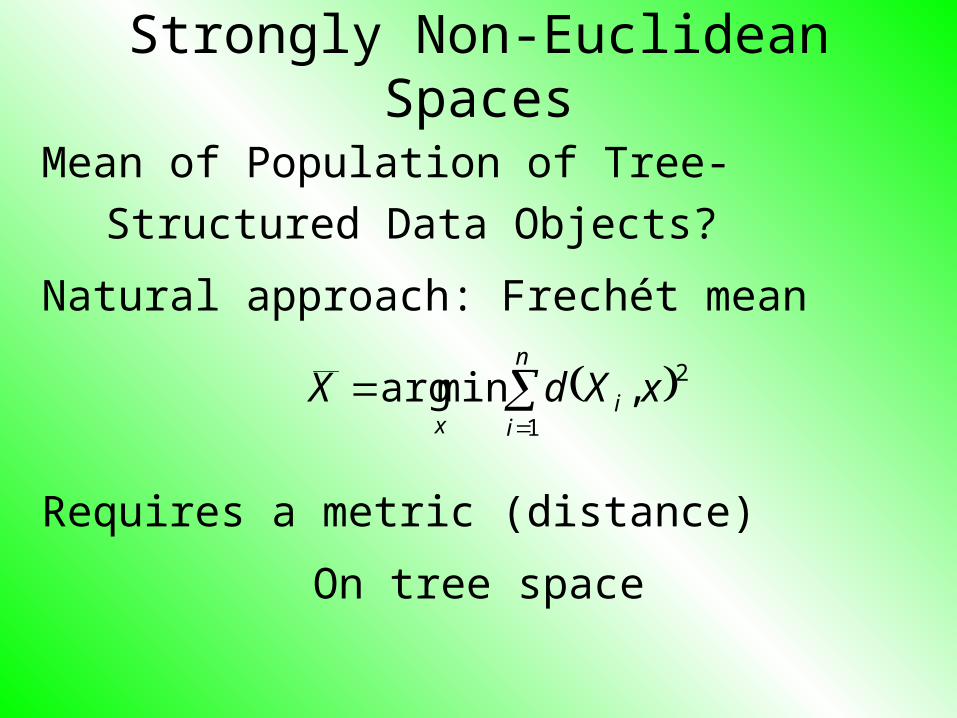
Mean of Population of Tree-Structured Data Objects?
Natural approach: Frechét mean
Requires a metric (distance)
On tree space
n
ii
xxXdX
1
2,minarg
Strongly Non-Euclidean Spaces
Appropriate metrics on tree space:
Wang and Marron (2004)
• Depends on:– Tree structure
– And nodal attributes
• Won’t go further here
• But gives appropriate Frechét mean

Strongly Non-Euclidean Spaces
PCA on Tree Space?
Key Ideas:
• Replace 1-d subspace
that best approximates data
• By 1-d representation
that best approximates data
Wang and Marron (2004) define notion of
Treeline (in stucture space)
Strongly Non-Euclidean Spaces
PCA on Tree Space?
Also useful to consider 1-d representations
In the space of nodal attributes.
Simple Example: Blood vessel trees
• Just 4 nodes & simplified to sticks
• For computational tractability
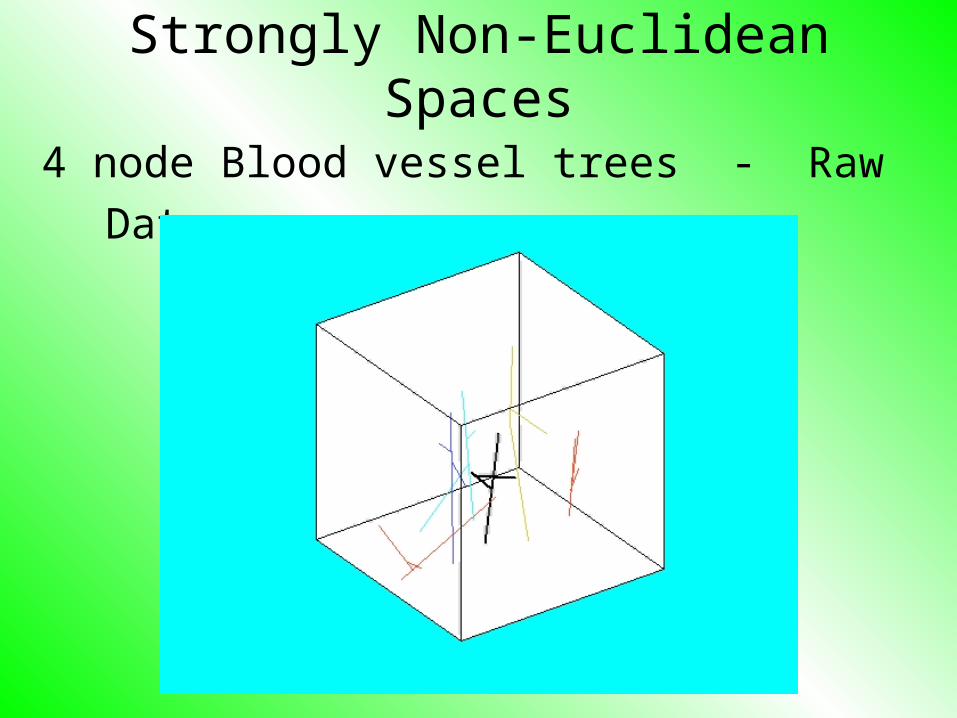
Strongly Non-Euclidean Spaces
4 node Blood vessel trees - Raw Data
Strongly Non-Euclidean Spaces
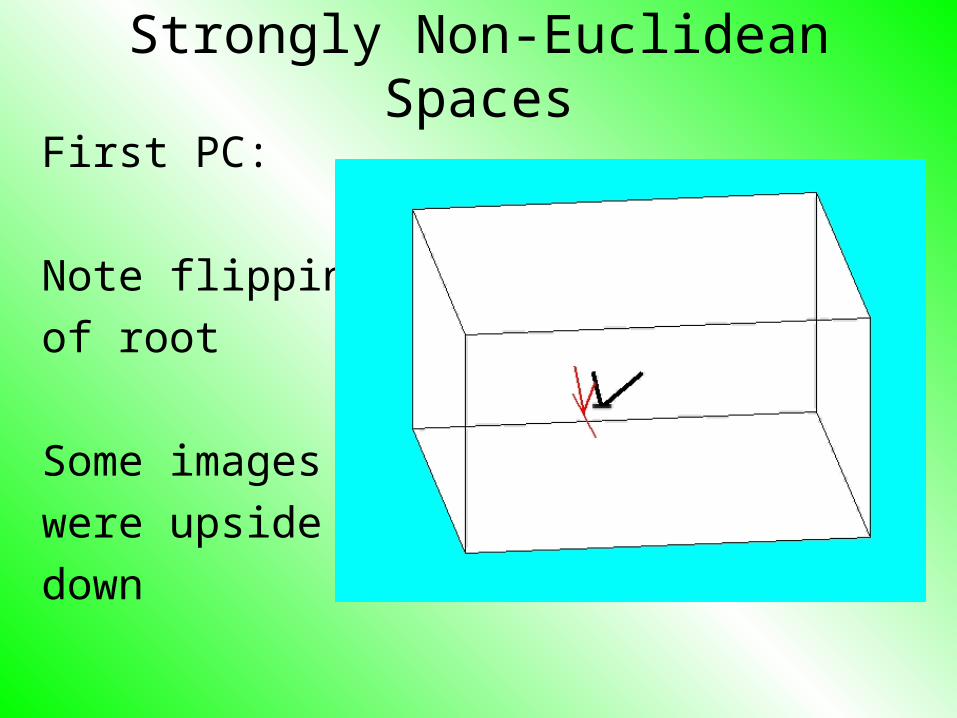
First PC:
Note flippingof root
Some imageswere upsidedown
Strongly Non-Euclidean Spaces
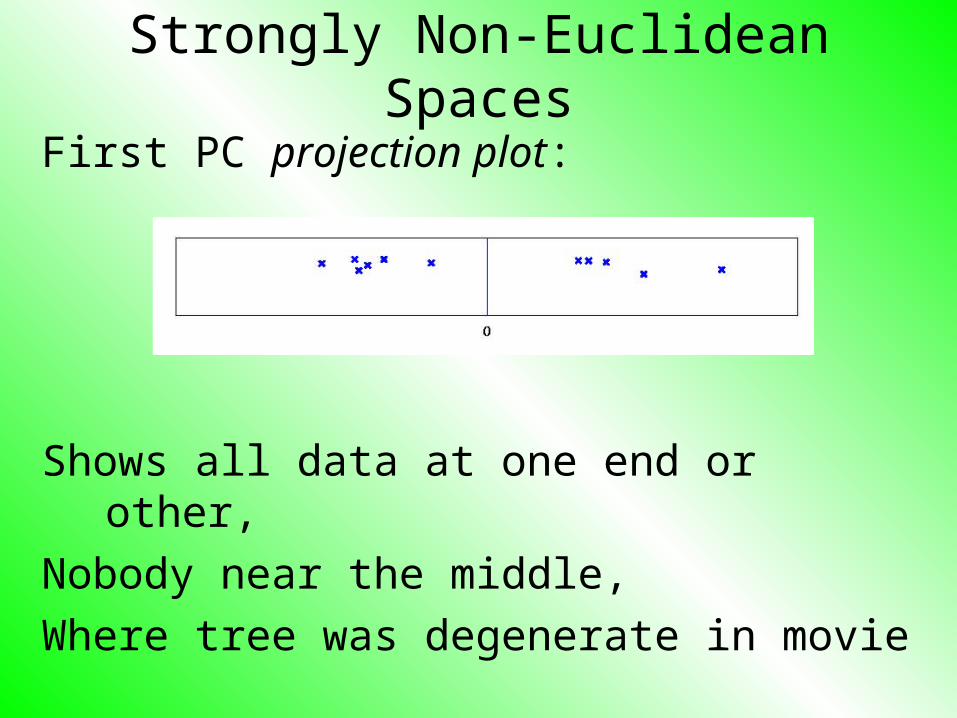
First PC projection plot:
Shows all data at one end or other,Nobody near the middle,Where tree was degenerate in movie
Strongly Non-Euclidean Spaces
Proposed applications in M-rep world: • Multifigural objects
with some figures missing• Multi-object images
with some objects missing• …
Toy Example: hands with missing fingers
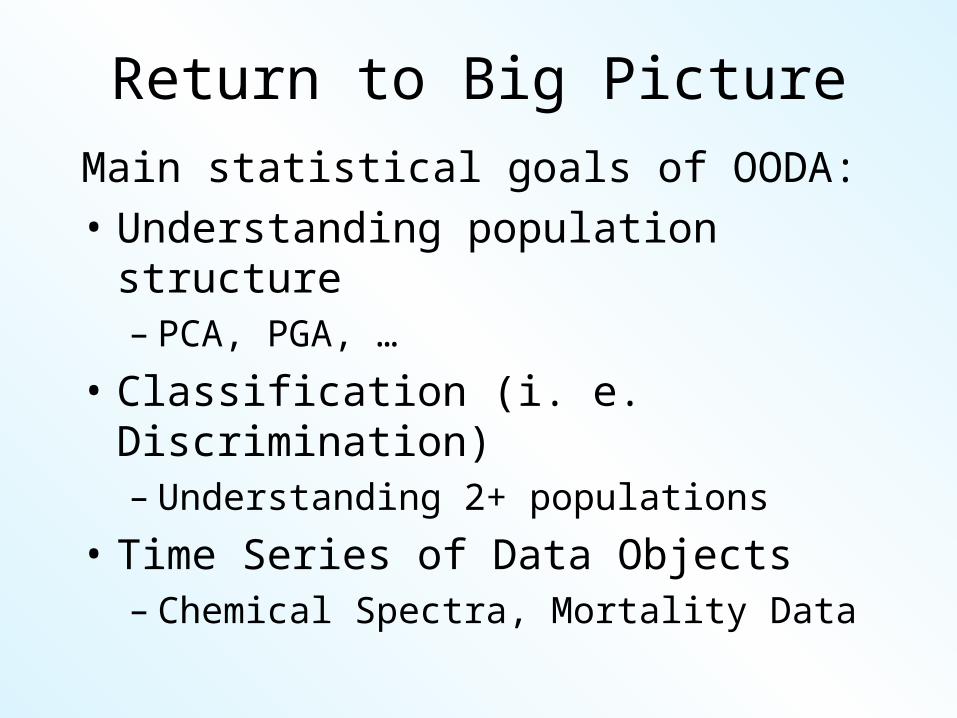
Return to Big PictureMain statistical goals of OODA:• Understanding population
structure– PCA, PGA, …
• Classification (i. e. Discrimination)– Understanding 2+ populations
• Time Series of Data Objects– Chemical Spectra, Mortality Data
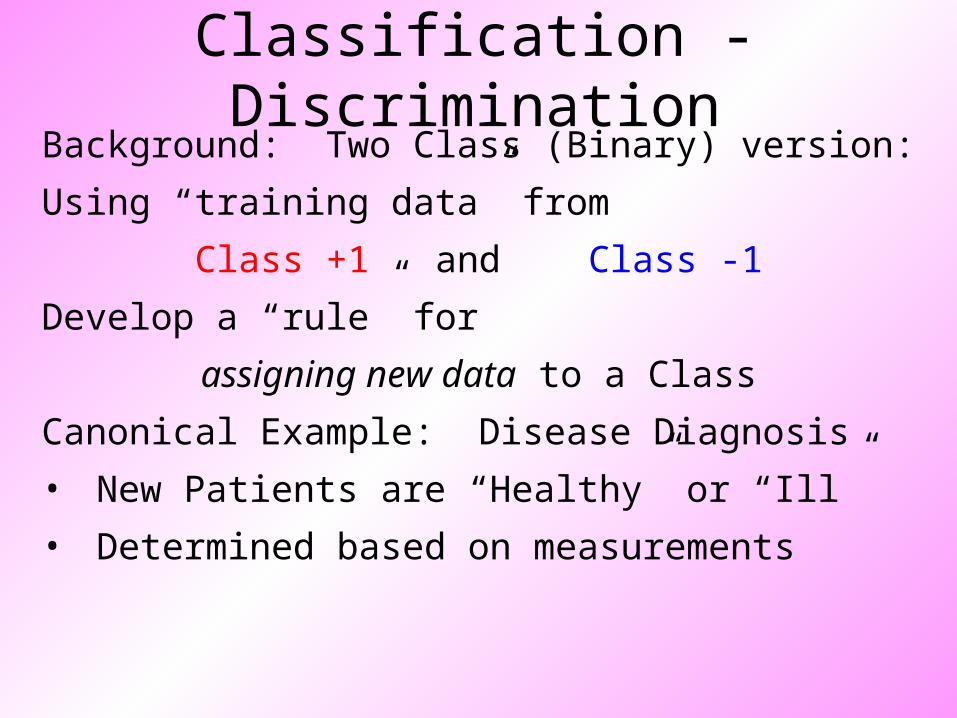
Classification - Discrimination
Background: Two Class (Binary) version:
Using “training data” from
Class +1 and Class -1
Develop a “rule” for
assigning new data to a Class
Canonical Example: Disease Diagnosis
• New Patients are “Healthy” or “Ill”
• Determined based on measurements
Classification - Discrimination
Next time: go into
Classification vs. Clustering
Supervised vs. Un-Supervised Learning
As now done on 10/25/05

Classification - Discrimination
Terminology:
For statisticians, these are synonyms
For biologists, classification means:
• Constructing taxonomies
• And sorting organisms into them
(maybe this is why discrimination
was used, until politically incorrect…)
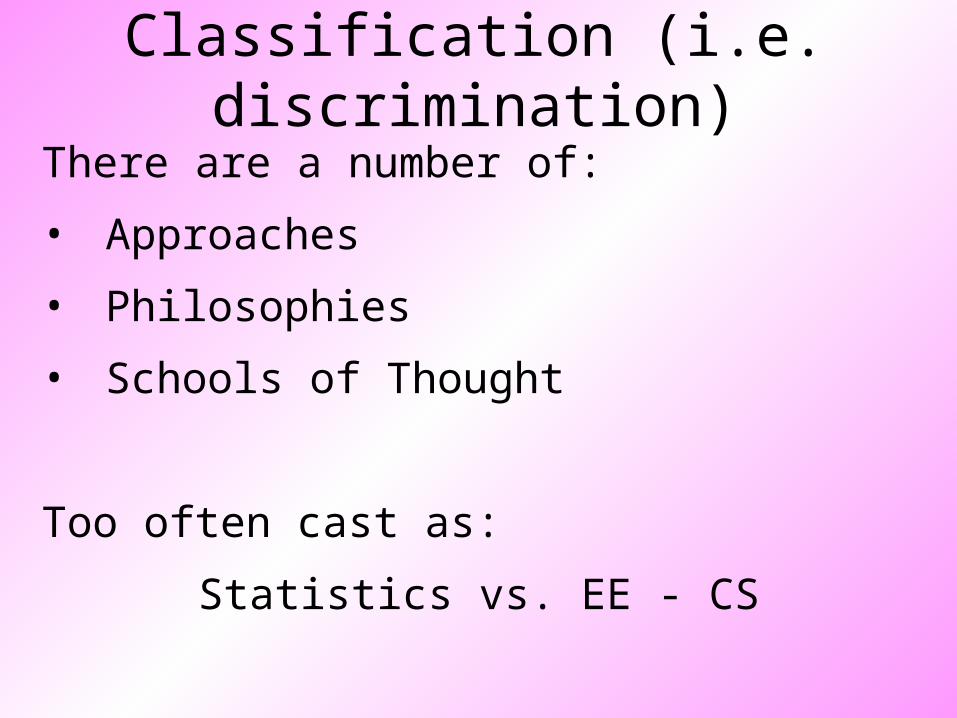
Classification (i.e. discrimination)
There are a number of:
• Approaches
• Philosophies
• Schools of Thought
Too often cast as:
Statistics vs. EE - CS
Classification (i.e. discrimination)
EE – CS variations:
• Pattern Recognition
• Artificial Intelligence
• Neural Networks
• Data Mining
• Machine Learning
Classification (i.e. discrimination)
Differing Viewpoints:
Statistics
• Model Classes with Probability Distribut’ns
• Use to study class diff’s & find rules
EE – CS
• Data are just Sets of Numbers
• Rules distinguish between these
Current thought: combine these
Classification (i.e. discrimination)
Important Overview Reference:
Duda, Hart and Stork (2001)
• Too much about neural nets???
• Pizer disagrees…
• Update of Duda & Hart (1973)
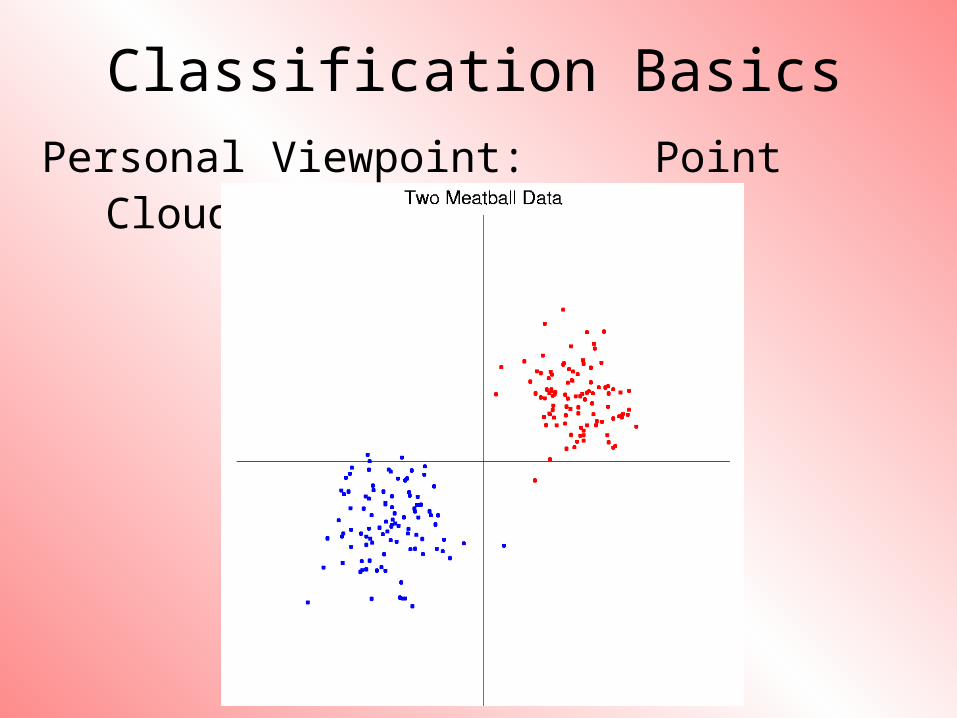
Classification BasicsPersonal Viewpoint: Point Clouds
Classification Basics
Simple and Natural Approach:
Mean Difference
a.k.a.
Centroid Method
Find “skewer through two meatballs”
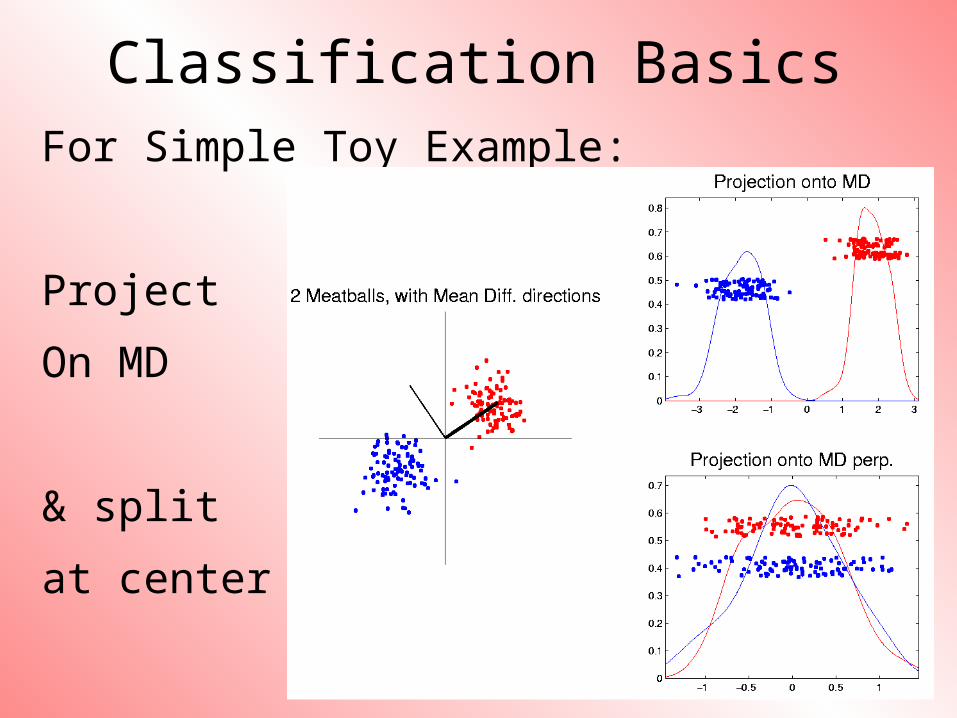
Classification BasicsFor Simple Toy Example:
Project
On MD
& split
at center
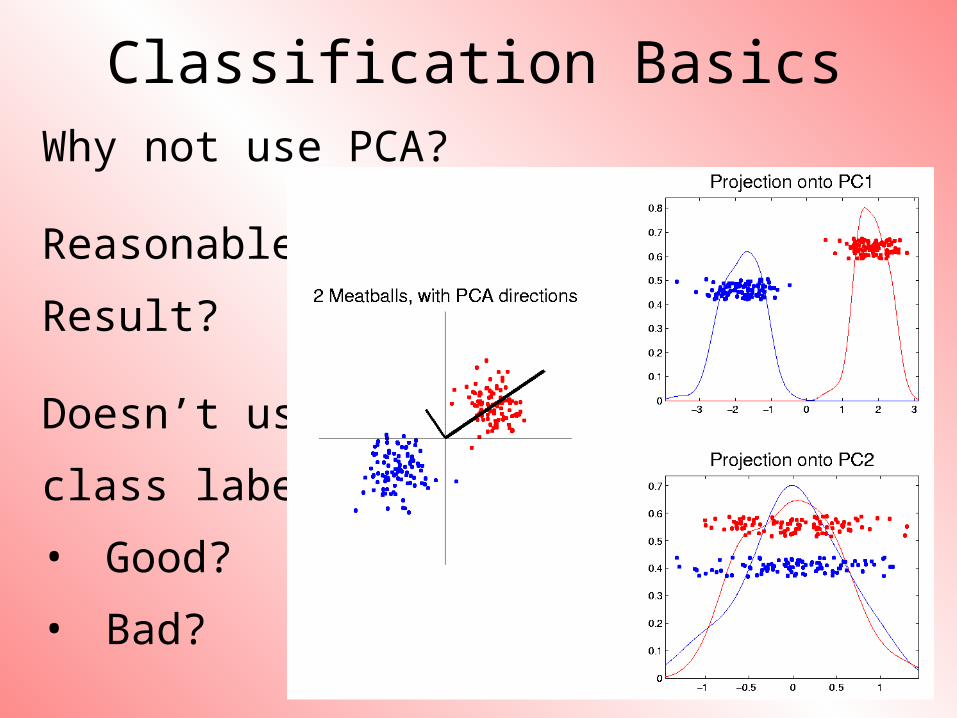
Classification BasicsWhy not use PCA?
Reasonable
Result?
Doesn’t use
class labels…
• Good?
• Bad?
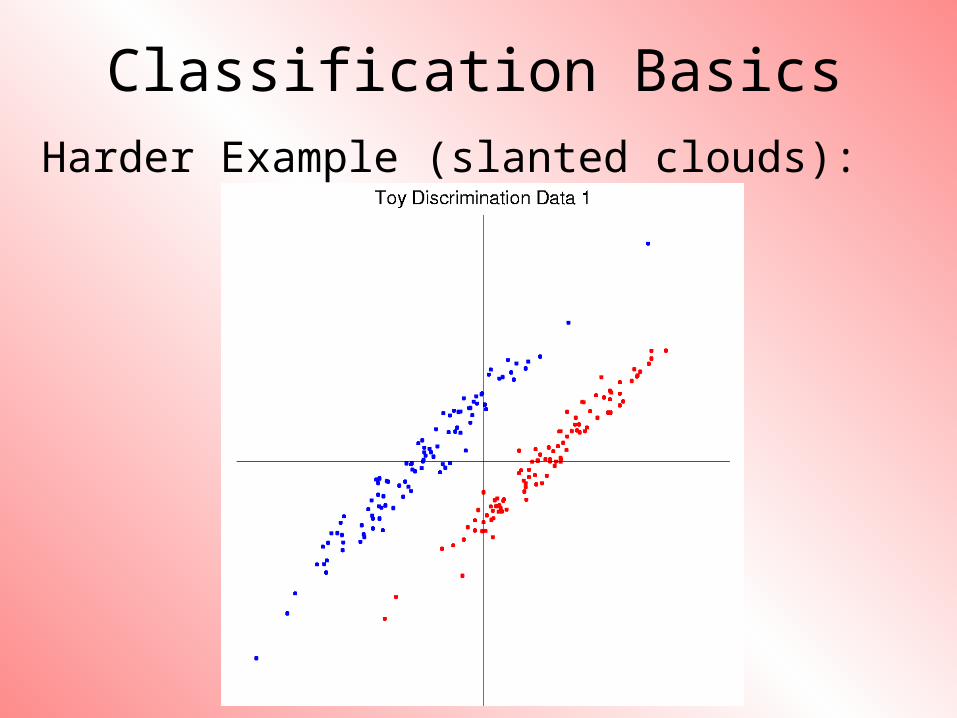
Classification BasicsHarder Example (slanted clouds):
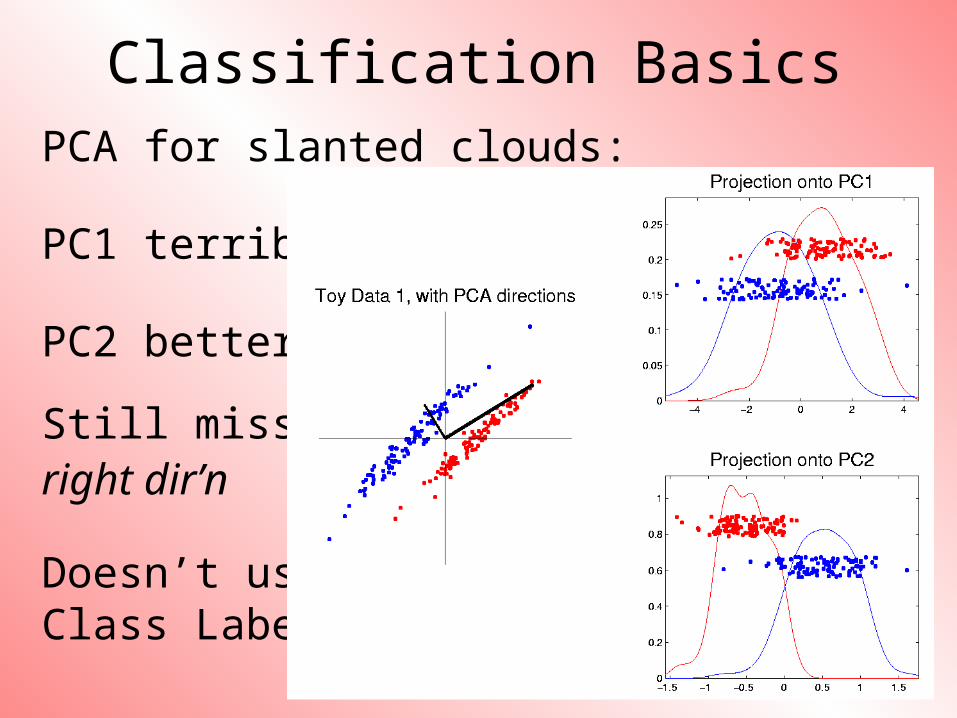
Classification BasicsPCA for slanted clouds:
PC1 terrible
PC2 better?
Still missesright dir’n
Doesn’t useClass Labels
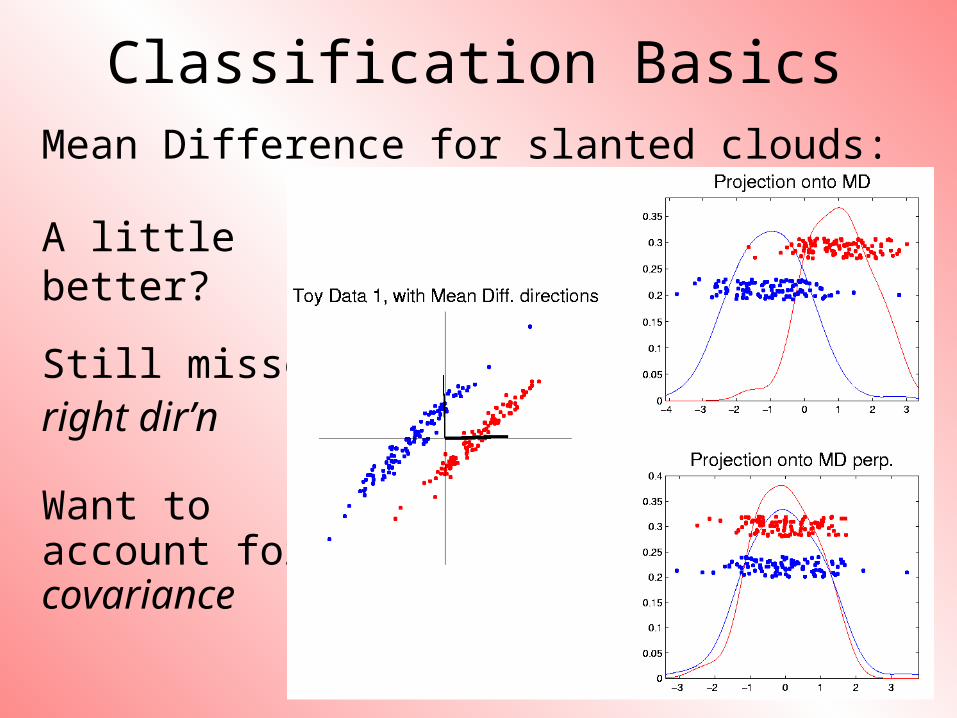
Classification BasicsMean Difference for slanted clouds:
A little better?
Still missesright dir’n
Want toaccount forcovariance

Classification BasicsMean Difference & Covariance,Simplest Approach:
Rescale (standardize) coordinate axesi. e. replace (full) data matrix:
Then do Mean DifferenceCalled “Naïve Bayes Approach”
ddndd
n
ddnd
n
sxsx
sxsx
X
s
s
xx
xx
X
//
//
/10
0/1
1
111111
1
111
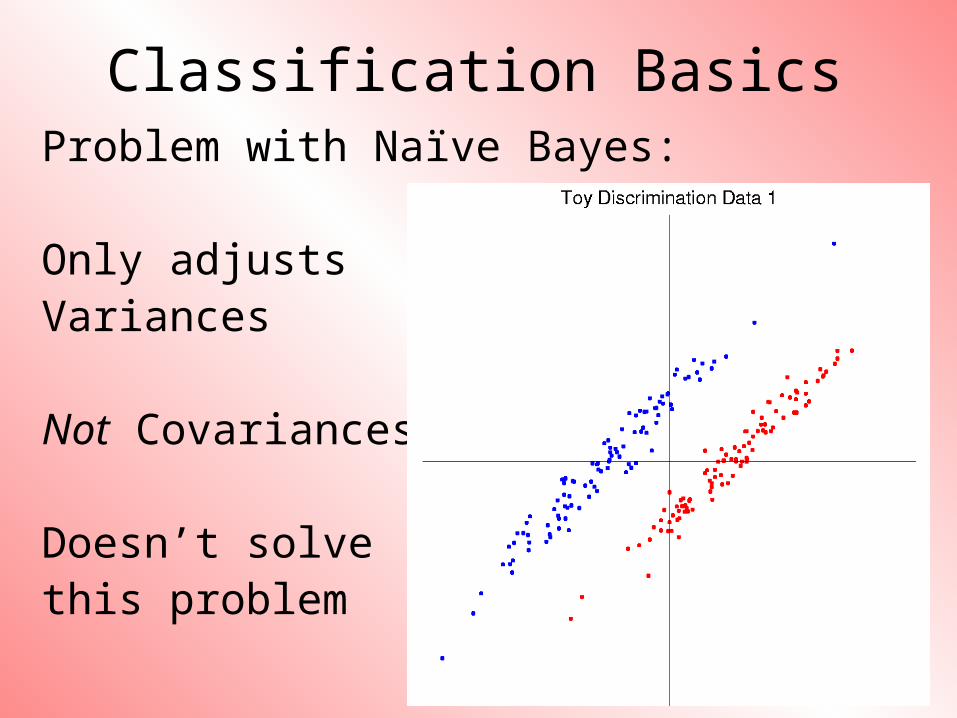
Classification BasicsProblem with Naïve Bayes:
Only adjusts Variances
Not Covariances
Doesn’t solvethis problem
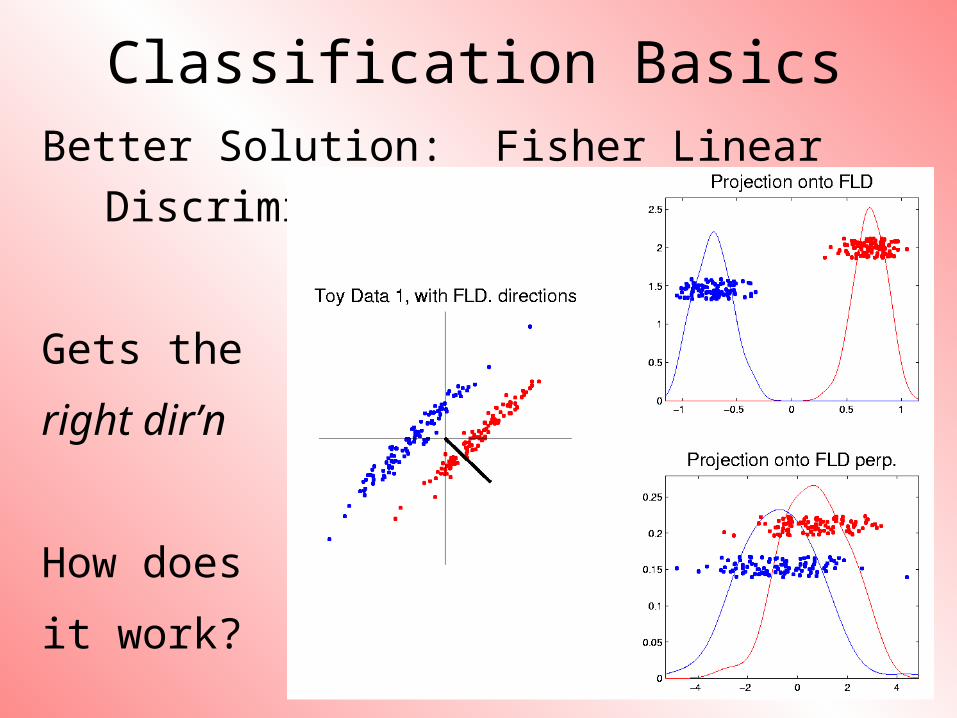
Classification BasicsBetter Solution: Fisher Linear
Discrimination
Gets the
right dir’n
How does
it work?
Fisher Linear Discrimination
Other common terminology (for FLD):
Linear Discriminant Analysis (LDA)
Fisher Linear Discrimination
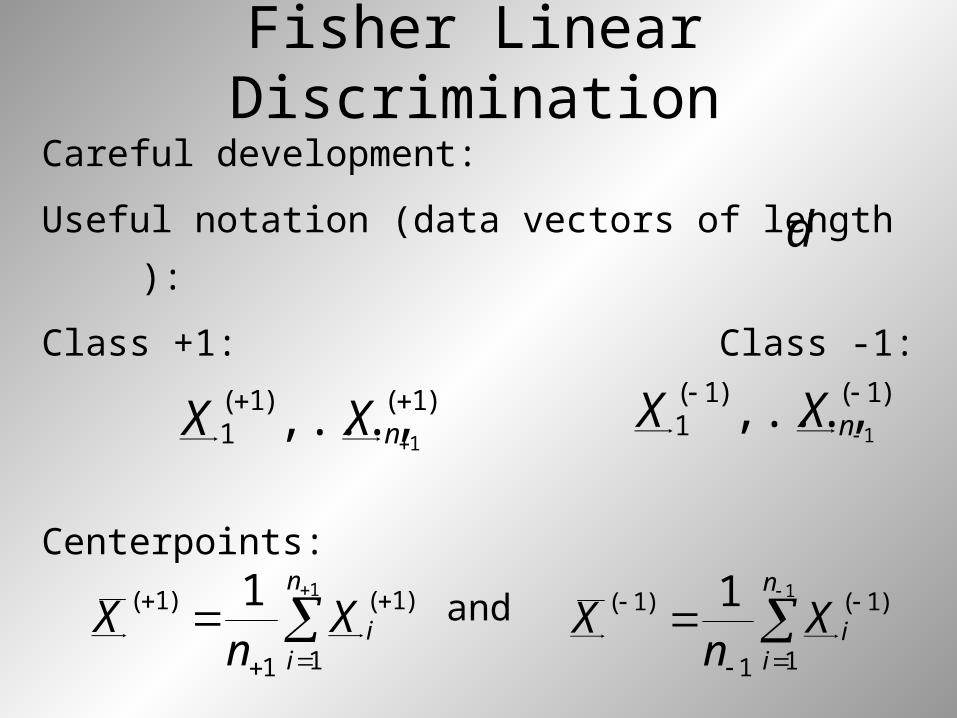
Careful development:
Useful notation (data vectors of length ):
Class +1: Class -1:
Centerpoints:
and
d
)1()1(1 1
,..., nXX
)1()1(1 1
,..., nXX
1
1
)1(
1
)1( 1 n
iiX
nX
1
1
)1(
1
)1( 1 n
iiX
nX
Fisher Linear Discrimination
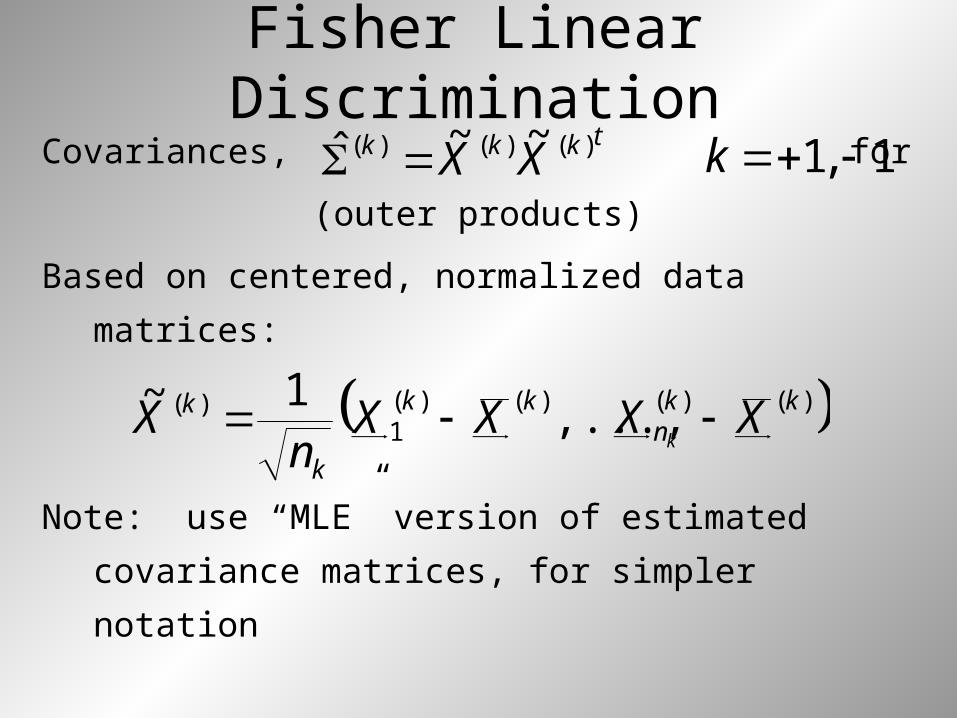
Covariances, for
(outer products)
Based on centered, normalized data
matrices:
Note: use “MLE” version of estimated
covariance matrices, for simpler notation
1,1 ktkkk XX )()()( ~~ˆ
)()()()(1
)( ,...,1~ kk
nkk
k
k XXXXn
Xk
Fisher Linear Discrimination
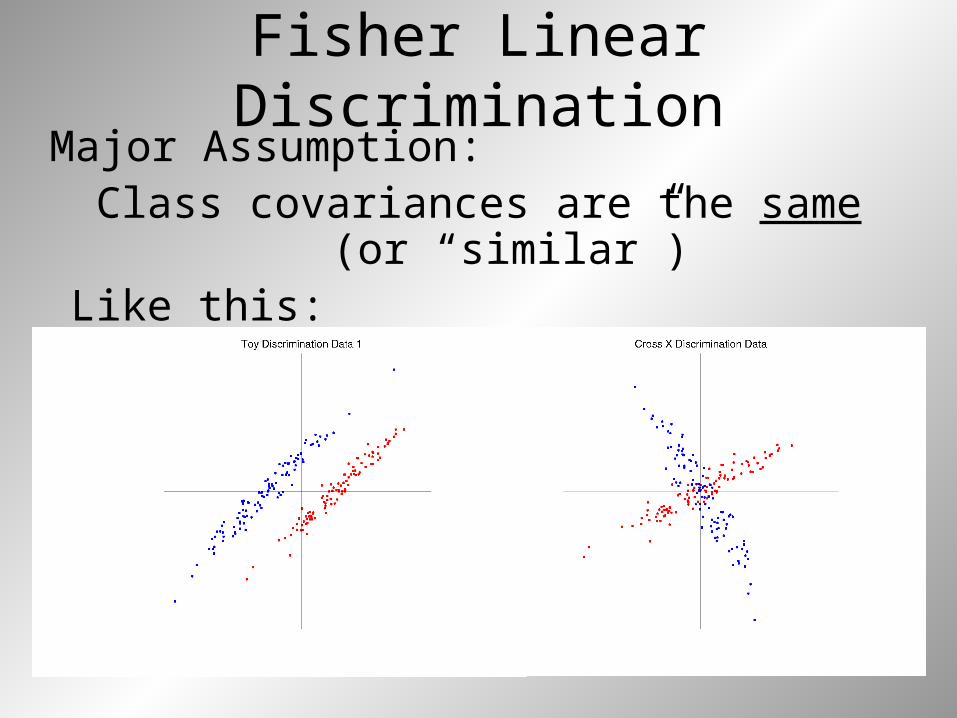
Major Assumption:Class covariances are the same (or
“similar”)Like this: Not this:
Fisher Linear Discrimination
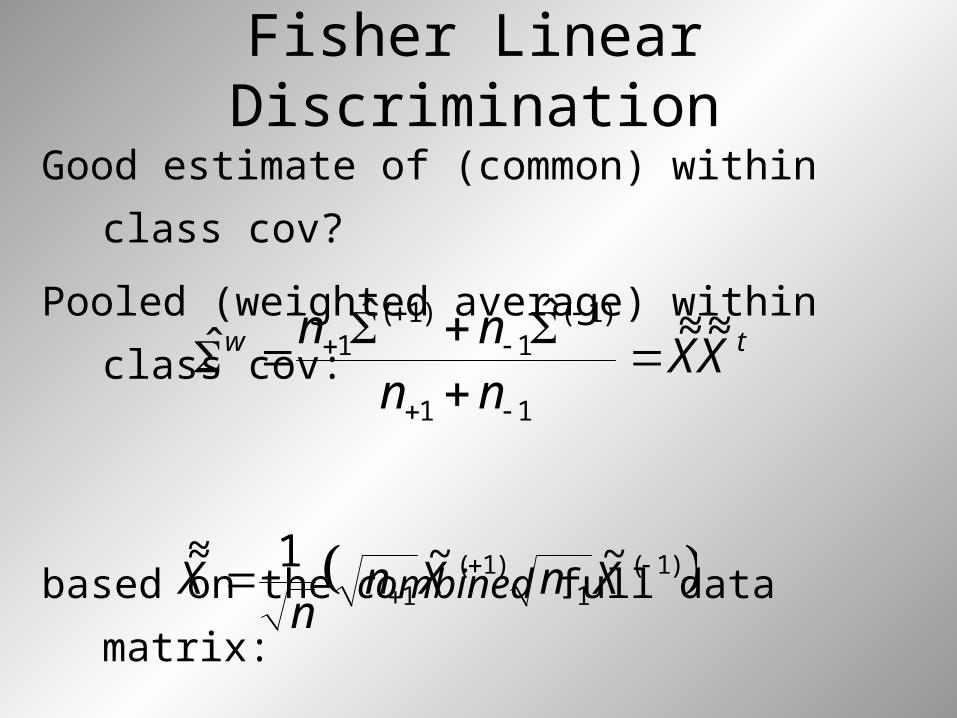
Good estimate of (common) within class
cov?
Pooled (weighted average) within class
cov:
based on the combined full data matrix:
tw XXnnnn ~~~~ˆˆ
ˆ11
)1(1
)1(1
)1(1
)1(1
~~1~~
XnXn
nX
Fisher Linear Discrimination
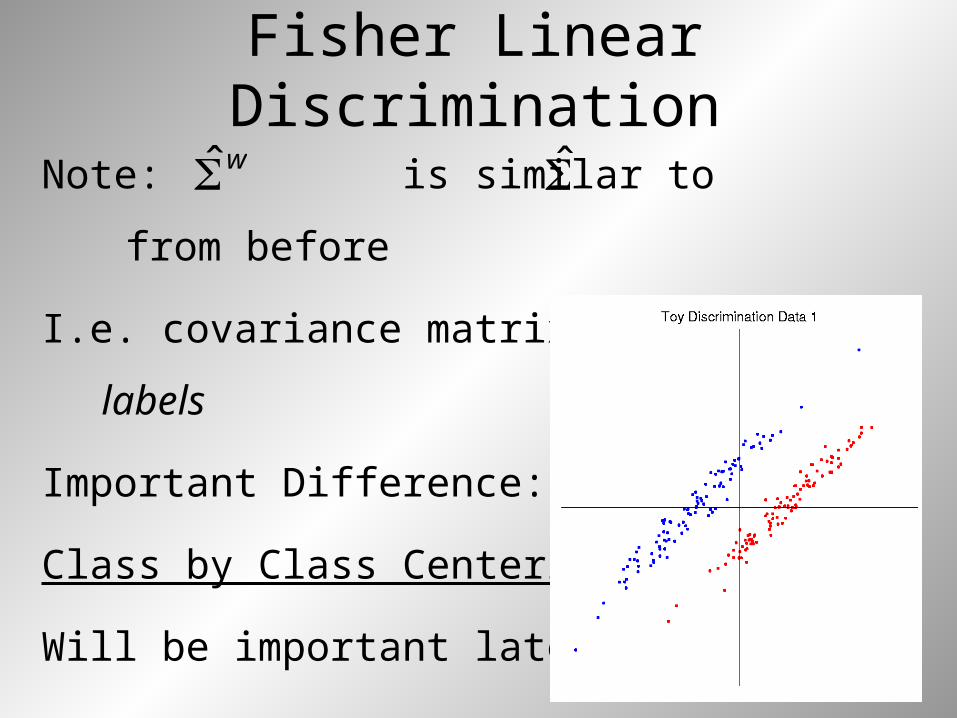
Note: is similar to from before
I.e. covariance matrix ignoring class
labels
Important Difference:
Class by Class Centering
Will be important later
w
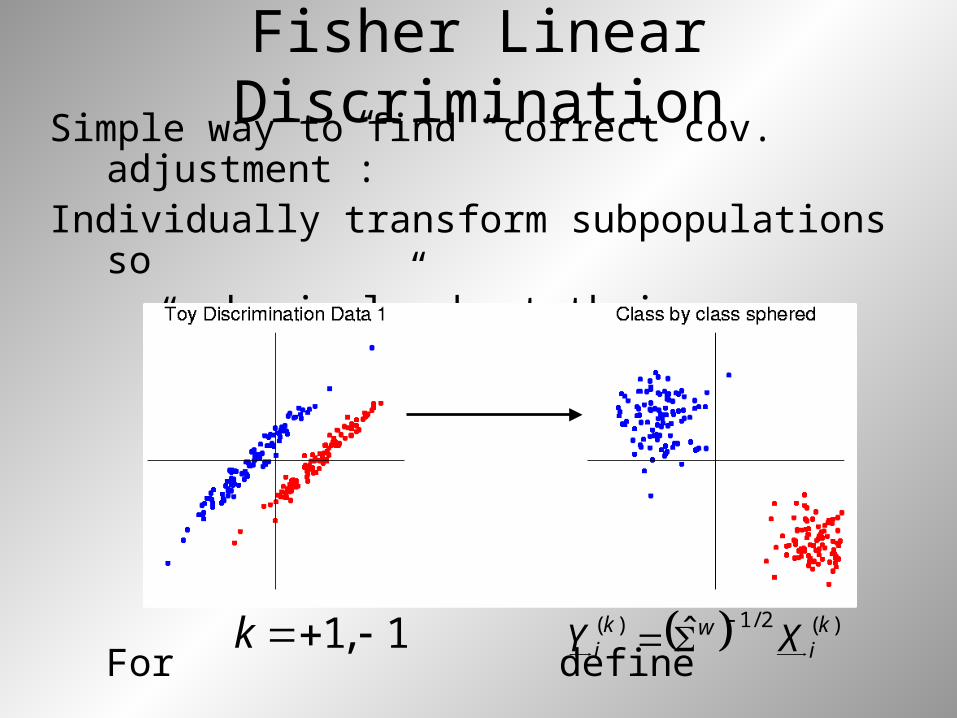
Fisher Linear DiscriminationSimple way to find “correct cov.
adjustment”:Individually transform subpopulations so
“spherical” about their means
For define )(2/1)( ˆ k
iwk
i XY
1,1 k
Fisher Linear Discrimination
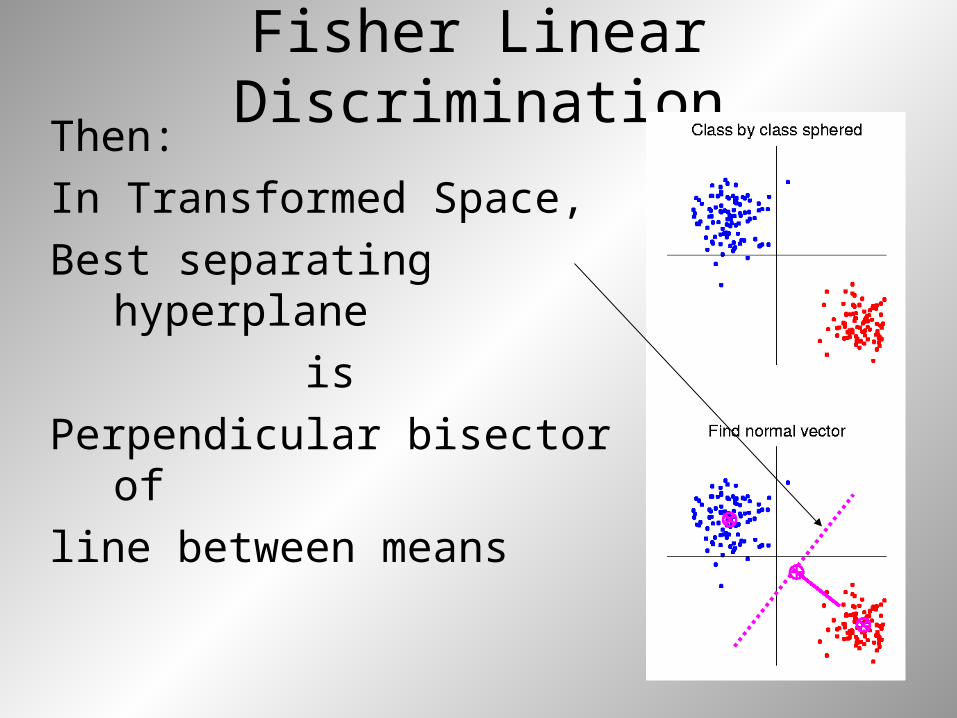
Then:In Transformed Space,Best separating hyperplane
isPerpendicular bisector of line between means

Fisher Linear DiscriminationIn Transformed Space,
Separating Hyperplane has:
Transformed Normal
Vector:
Transformed Intercept:
Equation:
)1(2/1)1(2/1 ˆˆ XXn ww
TFLD
)1()1(2/1ˆ XXw
)1(2/1)1(2/1 ˆ21ˆ
21
XX ww
TFLD
)2()1(2/1
21
21ˆ XXw
TFLDTFLDTFLD nnyy ,,:

Fisher Linear Discrimination
Thus discrimination rule is:Given a new data vector ,
Choose Class +1 when:
i.e. (transforming back to original space)
where:
0X
TFLDTFLDTFLDw nnX ,,ˆ 02/1
TFLDw
TFLD
wTFLD
w nnX2/12/12/10 ˆ,ˆˆ,
FLDFLDFLD nnX ,,0
)1()1(12/1 ˆˆ XXnn w
TFLDw
FLD
)1()1(2/1
21
21ˆ XX
TFLD
w
FLD
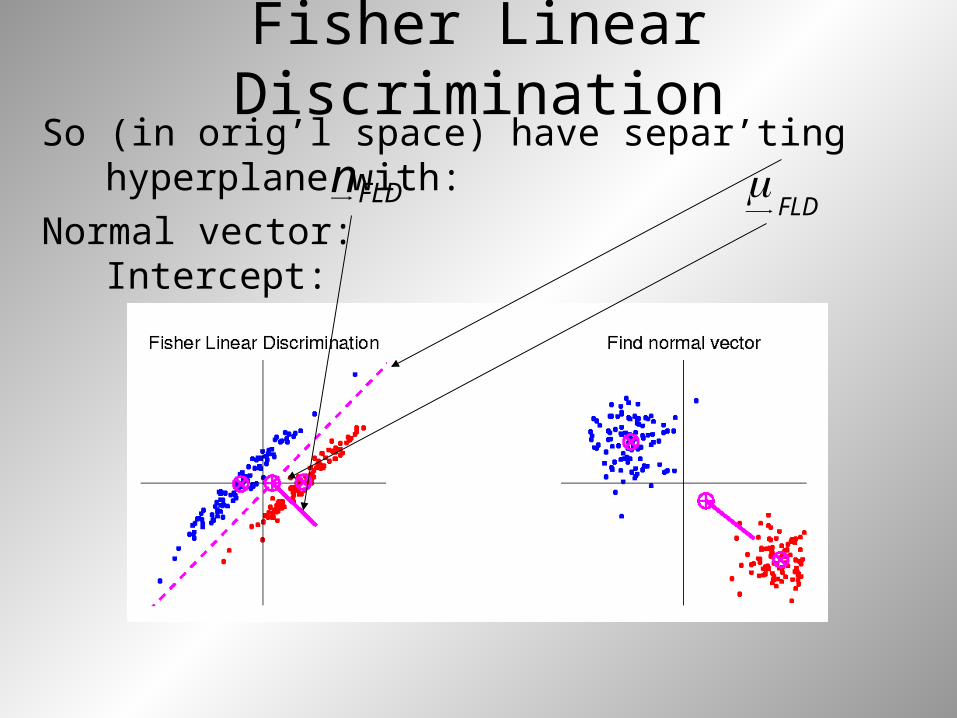
Fisher Linear Discrimination
So (in orig’l space) have separ’ting hyperplane with:
Normal vector: Intercept: FLDn
FLD

Fisher Linear Discrimination
Relationship to Mahalanobis distance
Idea: For , a natural distance measure is:
• “unit free”, i.e. “standardized”
• essentially mod out covariance structure
• Euclidean dist. applied to &
• Same as key transformation for FLD
• I.e. FLD is
mean difference in Mahalanobis space
,~, 21 NXX
2/1
211
2121, XXXXXXd tM
12/1 X 2
2/1 X
Classical Discrimination
Above derivation of FLD was:
• Nonstandard
• Not in any textbooks(?)
• Nonparametric (don’t need Gaussian
data)
• I.e. Used no probability distributions
• More Machine Learning than Statistics
Classical Discrimination
FLD Likelihood View
Assume:
Class distributions are multivariate
for
• strong distributional assumption
+ common covariance
wkN ,)( 1,1 k
Classical DiscriminationFLD Likelihood View (cont.)
At a location , the likelihood ratio, for
choosing between Class +1 and Class -1, is:
where is the Gaussian density
with covariance
0x
)1(0)1(0)1()1(0 /,,,
xxxLR www
w
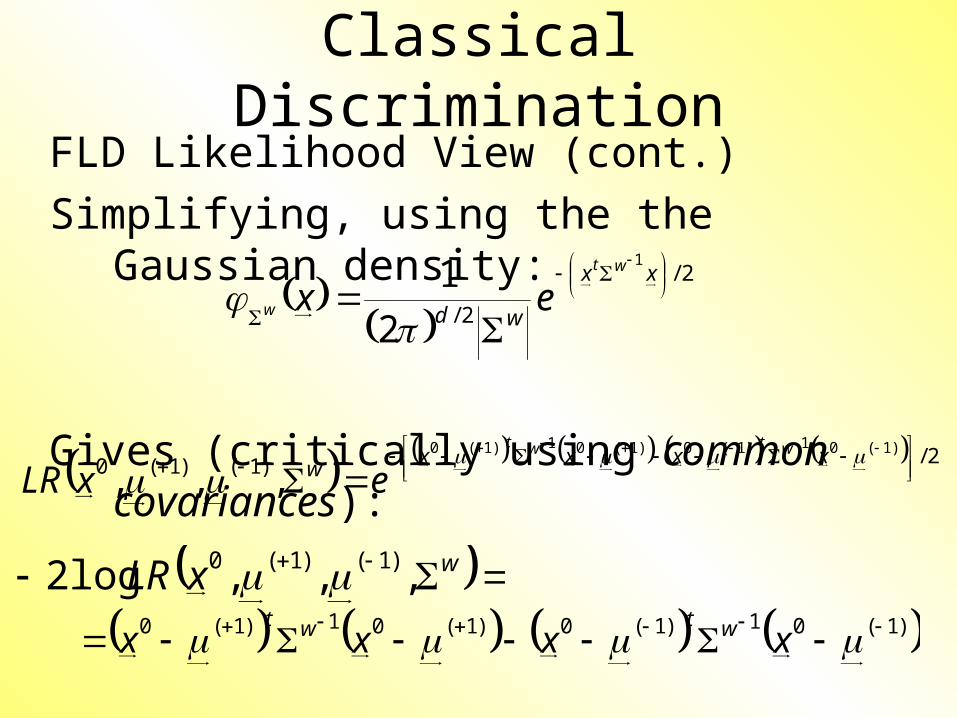
Classical DiscriminationFLD Likelihood View (cont.)Simplifying, using the the Gaussian
density:
Gives (critically using common covariances):
2/
2/
1
2
1
xx
wd
wt
w ex
2/)1()1(0)1(01)1(0)1(01)1(0
,,,
xxxx
wwtwt
exLR
wxLR ,,,log2 )1()1(0 )1(01)1(0)1(01)1(0 xxxx wtwt
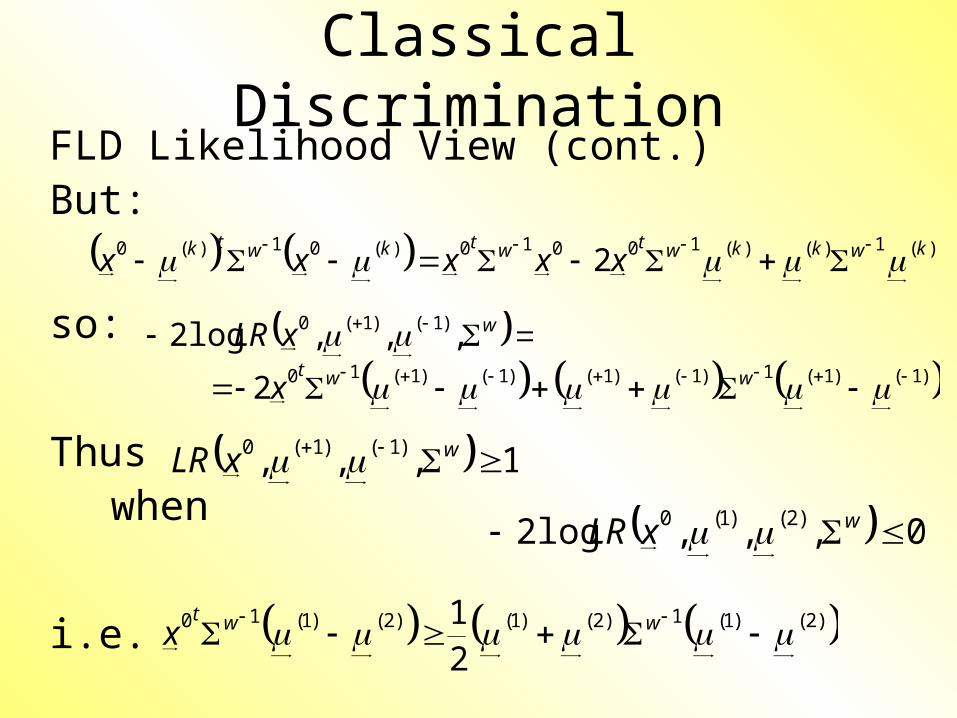
Classical DiscriminationFLD Likelihood View (cont.)But:
so:
Thus when
i.e.
)(1)()(10010)(01)(0 2 kwkkwtwtkwtk xxxxx
wxLR ,,,log2 )1()1(0 )1()1(1)1()1()1()1(102
wwtx
1,,, )1()1(0 wxLR
0,,,log2 )2()1(0 wxLR
)2()1(1)2()1()2()1(10
2
1 wwt
x

Classical DiscriminationFLD Likelihood View (cont.)Replacing , and
by maximum likelihood estimates:, and
Gives the likelihood ratio discrimination rule:Choose Class +1, when
Same as above, so: FLD can be viewed asLikelihood Ratio Rule
)1( )1( w
w)1( X)1(X
)1()1(1)1()1()1()1(10 ˆ21ˆ
XXXXXXx wwt
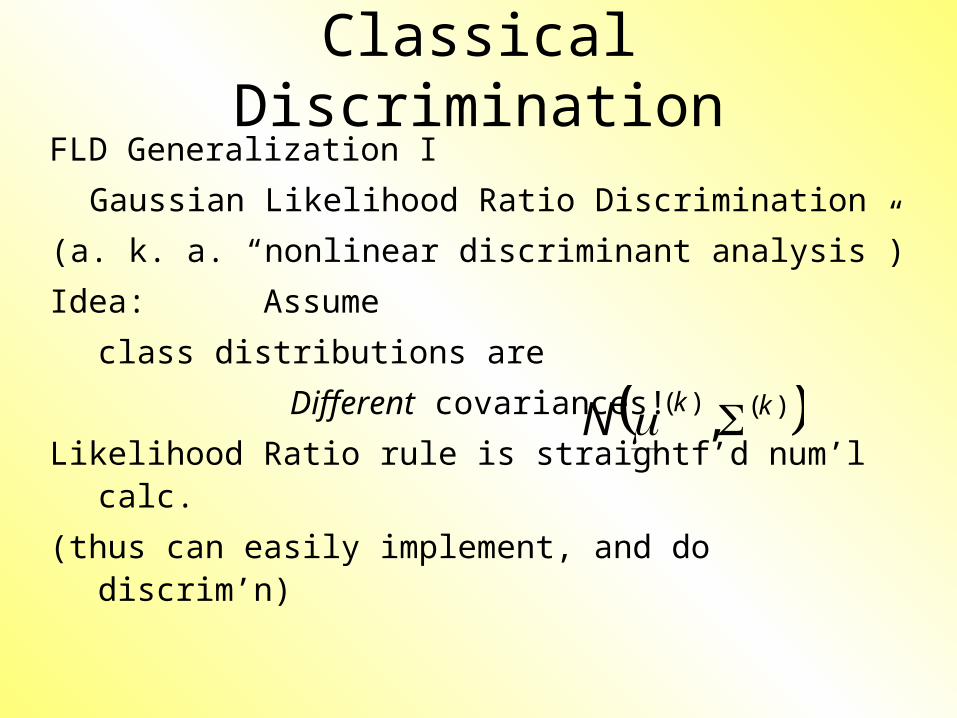
Classical DiscriminationFLD Generalization I
Gaussian Likelihood Ratio Discrimination
(a. k. a. “nonlinear discriminant analysis”)
Idea: Assume
class distributions are
Different covariances!
Likelihood Ratio rule is straightf’d num’l calc.
(thus can easily implement, and do discrim’n)
)()( , kkN
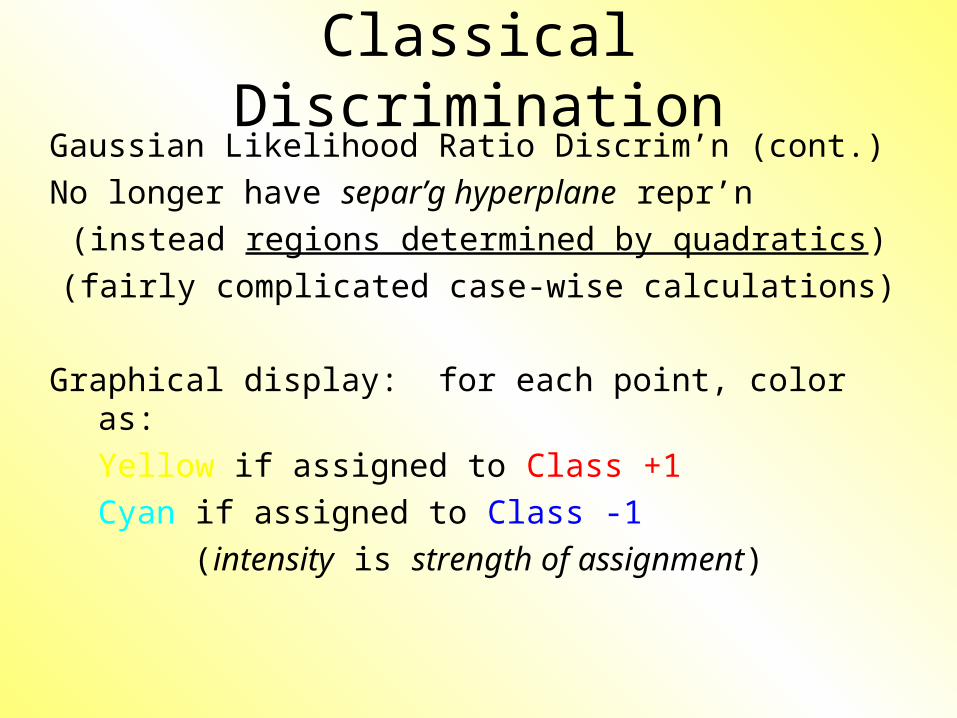
Classical DiscriminationGaussian Likelihood Ratio Discrim’n (cont.)No longer have separ’g hyperplane repr’n
(instead regions determined by quadratics)
(fairly complicated case-wise calculations)
Graphical display: for each point, color as:Yellow if assigned to Class +1Cyan if assigned to Class -1
(intensity is strength of assignment)

Classical DiscriminationFLD for Tilted Point Clouds – Works well
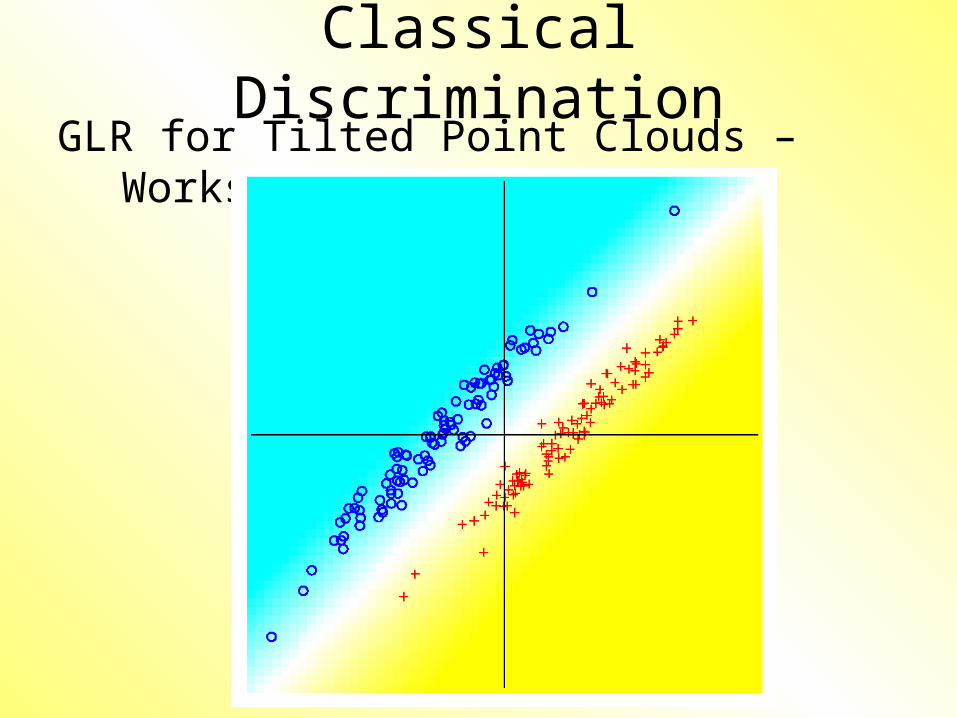
Classical DiscriminationGLR for Tilted Point Clouds – Works well
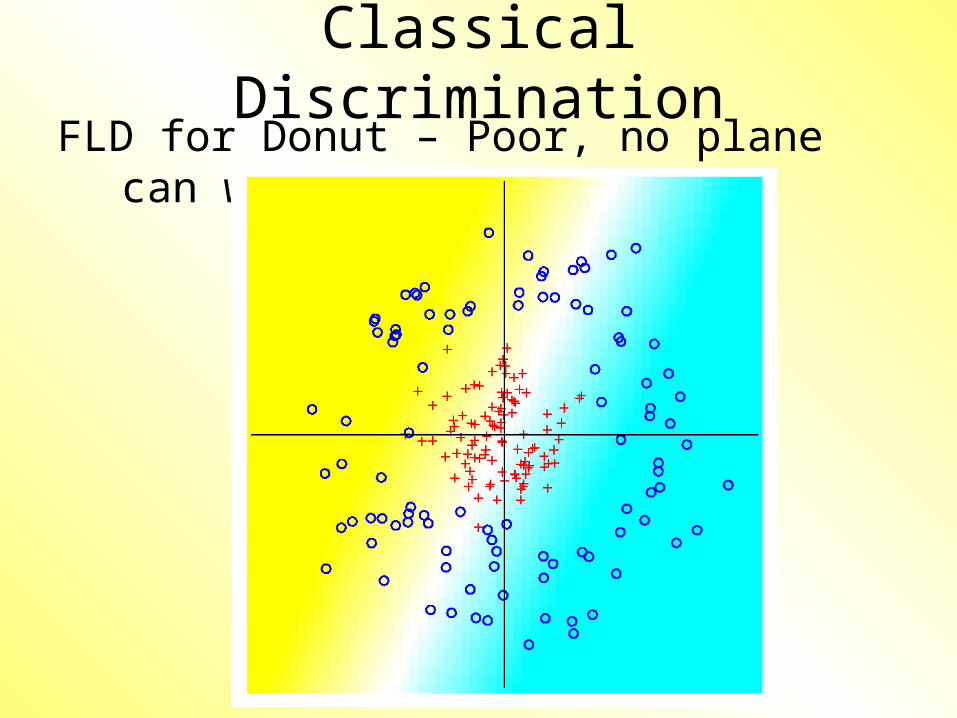
Classical DiscriminationFLD for Donut – Poor, no plane can
work
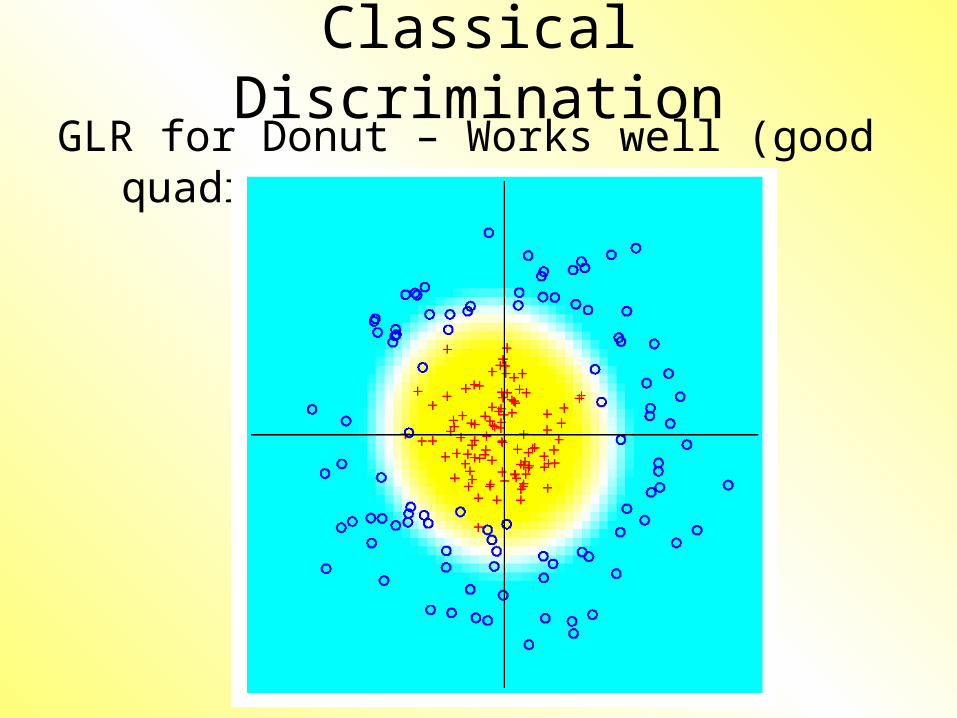
Classical DiscriminationGLR for Donut – Works well (good
quadratic)
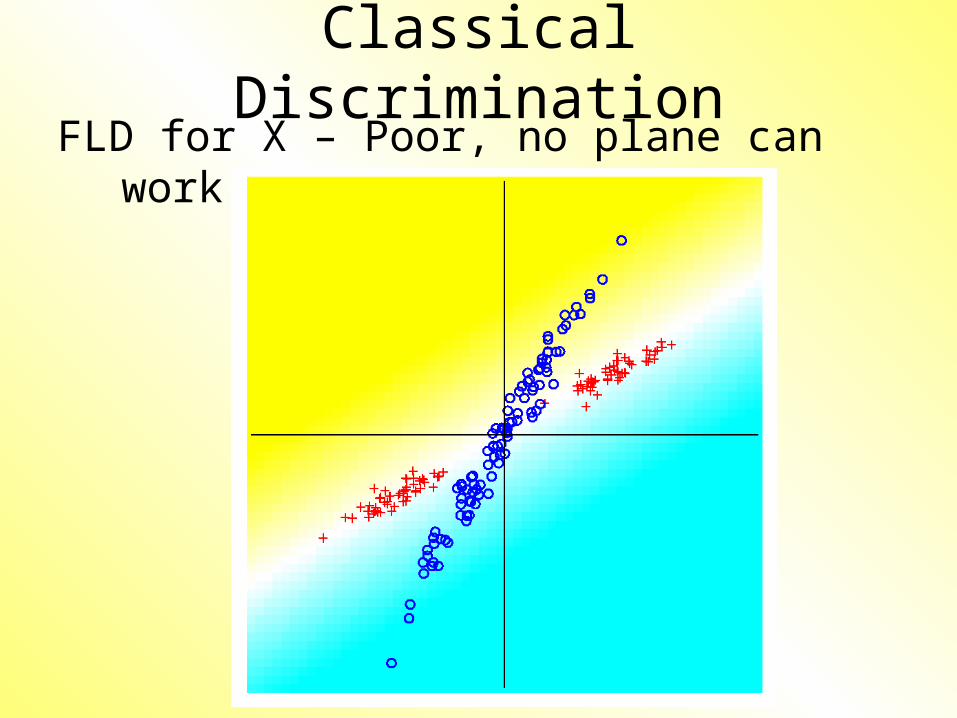
Classical DiscriminationFLD for X – Poor, no plane can work
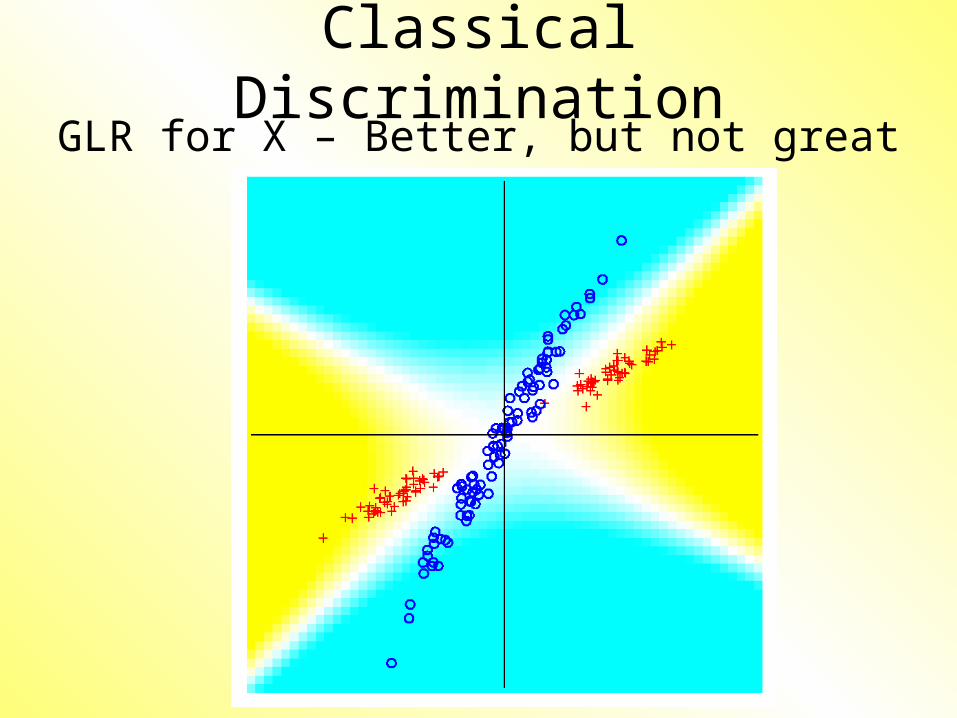
Classical DiscriminationGLR for X – Better, but not great