object-based change detection in wind storm-damaged...
TRANSCRIPT

Object-based change detection in wind storm-damaged forest usinghigh-resolution multispectral images
N. Chehataa,b*, C. Ornya,c, S. Boukira, D. Guyonc, and J.P. Wigneronc
aEA 4592 G&E, ENSEGID-IPB, University of Bordeaux, Pessac Cedex, France; bIRD, LISAH UMR144, Tunis, Tunisia; cINRA, UMR 1391 ISPA, Villenave d’Ornon, France
(Received 2 April 2013; accepted 4 February 2014)
Natural disasters are generally brutal and may affect large areas, which then need to berapidly mapped to assess the impacts of such events on ecosystems and to preventrelated risks. Ground investigations may be complex, whereas remote-sensing techni-ques enable a fast regional-scale assessment of damage and offer a cost-effectiveoption for large and inaccessible areas. Here, an efficient, quasi-automatic object-based method for change mapping using high-spatial-resolution (HR) (5–10 m) satel-lite imagery is proposed. Our contribution comprises two main novelties with respectto similar works in forestry. First, an automatic feature selection process optimizes theimage segmentation and classification steps via an original calibration-like procedure.Second, an automatic bitemporal classification enables the separation of damaged andintact areas thanks to a new descriptor based on the level of fragmentation of theobtained regions. The mean shift algorithm is used in both the segmentation andclassification processes. The method was assessed in a maritime pine forest usingbitemporal HR Formosat-2 multispectral images acquired pre- and post-WindstormKlaus, which occurred in January 2009 in southwestern France. The binary overallclassification accuracy reached 87.8% and outperformed a pixel-based K-means clas-sification with no feature selection. A thematic analysis of the results highlights thecorrelation between the ages of trees and their sensitivity to wind.
1. Introduction
In a climate change context, wind storms have become more and more frequent. Windfalldamages have to be quickly mapped to prevent fire risks and to update the national forestinventory. Although ground investigations are complex due to the obstacles created byfallen trees, remote-sensing techniques enable rapid monitoring of large and inaccessibleareas. This study aims to provide a binary map discriminating damaged and non-damagedareas using high-spatial-resolution (HR) (5–10 m) satellite imagery. Bitemporal 8 mmultispectral Formosat-2 images, acquired pre- and post-Windstorm Klaus, whichoccurred on 24 January 2009 in southwestern France, were used for the map.
In the literature, previous studies in forestry have produced low-resolution maps (i.e.minimal mapping unit � 1 ha), usingmedium- or high-spatial resolution sensors and focusedessentially on defoliation (Franklin et al. 1995), clear-cut detection (Fraser, Abuelgasim, andLatifovic 2005; Desclée, Bogaert, and Defourny 2006; Huang et al. 2008; Liu et al. 2008;Conchedda, Durieux, and Mayaux 2008), or deforestation (Hayes and Cohen 2007;McRoberts andWalters 2012; Vibrans et al. 2013). Fewer studies have addressed more abruptand smaller-scale structural changes, such as windfall damage (Meyer, Geldreich, and Yesou
*Corresponding author. Email: [email protected]
International Journal of Remote Sensing, 2014Vol. 35, No. 13, 4758–4777, http://dx.doi.org/10.1080/01431161.2014.930199
© 2014 Taylor & Francis

2001; Liu et al. 2008; Kennedy et al. 2009; Wang and Xu 2010; Jonikavičius and Mozgeris2013). Moreover, the above works have generally utilized pixel-based approaches based onmedium-spatial resolution sensors, such as Landsat TM or MODIS.
Bitemporal change detection methods can be based on either post-classificationapproaches that compare two classifications obtained separately using remotely senseddata from two dates (McRoberts and Walters 2012; Liu et al. 2008), or the direct classifica-tion of two sets of remotely sensed data that have been merged into a single dataset (Hayesand Cohen 2007). Post-classification approaches are robust to radiometric differencesbetween images and provide accurate ‘from–to’ change information (Im and Jensen 2005)but suffer from segmentation and classification error propagation. Most post-classificationapproaches are pixel-based. Joint-classification approaches provide more information withwhich to classify small changes. They can rely on machine-learning algorithms using atraining set (Im and Jensen 2005), expert knowledge (Fraser, Abuelgasim, and Latifovic2005), or, alternatively, thresholding, which involves a parametric statistical test (Desclée,Bogaert, and Defourny 2006). In this work, the proposed method is based on bitemporaljoint classification of forest damage (damaged vs. non-damaged).
Storm damage assessment using multispectral images can be separated into twoapproaches: (1) storm damage modelling based on image descriptors and (2) storm damagemapping using image classification methods. In the first approach, the relationships betweenimage descriptors and forest variables are assessed – for example, the relationship betweenNDVI variation and the proportion of damaged area per pixel (Wang et al. 2010) or betweenimage texture and the percentage of crown loss (King et al. 2005). However, the correlationsobtained are insufficient for accurate damage mapping (Olthof, King, and Lautenschlager2004; King et al. 2005). The second approach includes time-consuming traditional visualinterpretation of imagery (Clandillon, Yesou, and Meyer 2003) and few automated methods.Some authors (Olthof, King, and Lautenschlager 2004; Meyer, Geldreich, and Yesou 2001)have proceeded with a traditional pixel-based supervised classification using differencingimages and vegetation indices, whereas Schwarz, Steinmeier, and Waser (2001) used asupervised object-oriented classification considering four spectral bands. The proposedmethod is based on a binary joint classification of forest storm damage.
Given the increasing spatial resolution of new satellites, various methods have beendeveloped to exploit contextual spatial information. Some approaches use regional per-pixeldescriptors before a pixel-wise classification (King et al. 2005; Fraser, Abuelgasim, andLatifovic 2005; Im and Jensen 2005; Franklin et al. 1995). Recently, the use of object-basedimage analysis (OBIA) has increased in the remote-sensing community (Benz et al. 2004;Blaschke 2010). In forestry, object-based classifications are used for structure mapping(Mallinis et al. 2008; Lamonaca, Corona, and Barbati 2008; Johansen et al. 2007; Mäkeläand Pekkarinen 2001; Pasher and King 2009) and for change detection (Desclée, Bogaert,and Defourny 2006; Schwarz, Steinmeier, and Waser 2001; Conchedda, Durieux, andMayaux 2008; Wulder et al. 2008; Chehata et al. 2011). The OBIA approach is based ona segmentation process that combines spatial and spectral information to group pixels intohomogeneous regions before their classification using new object descriptors. These objectdescriptors can be geometrical and textural (Fraser, Abuelgasim, and Latifovic 2005) ortemporal (Desclée, Bogaert, and Defourny 2006; Chehata et al. 2011). Bitemporal object-based analysis has the advantage of reducing misregistration and shadowing effects com-pared with a pixel-based approach (Johansen et al. 2010).
Various segmentation algorithms are used in the forestry literature, the most commonbeing a region-growing algorithm that minimizes intra-region variance (Kim, Madden,and Warner 2008; Desclée, Bogaert, and Defourny 2006) generally using Definiens
International Journal of Remote Sensing 4759
Imaging 2004 software (Benz et al. 2004). Mäkelä and Pekkarinen (2001) used theNarendra and Goldberg segmentation algorithm to group pixels according to a hetero-geneity measure based on local gradients. Liu et al. (2008) used a supervised Markovrandom field for segmentation and classification with good results for detection of areas ofsevere and large forest change. The mean shift (MS) algorithm has also exhibitedsatisfactory results for remote-sensing image segmentation applications such as individualtree crown delineation from aerial images (Wang, Soh, and Shultz 2006) or agriculturalland delineation (Ozdarici and Akyurek 2012). To our knowledge, the MS algorithm hasnot been used for forest cover mapping. It will be detailed in Section 3.2.
The proposed method is an object-based, bitemporal classification that maps stormdamage at a fine spatial scale. It is nearly automatic, requiring limited training data torapidly map damage over a wide area.
2. Study area and data
The Nezer forest covers approximately 60 km2 and is located near the Atlantic coast insouthwest France, within a large European maritime pine (Pinus pinaster Ait.) forest. Theforest is made up of rectangular stands of pine trees of similar age and height. Stand agevaries from seedling to 55 years, density from 150 to 3000 trees ha−1, and tree height from0 to 25 m, as reported in Garestier et al. (2009). The maximum crown diameter reachesapproximately 8 m for the oldest stands (Guyon et al. 2005).
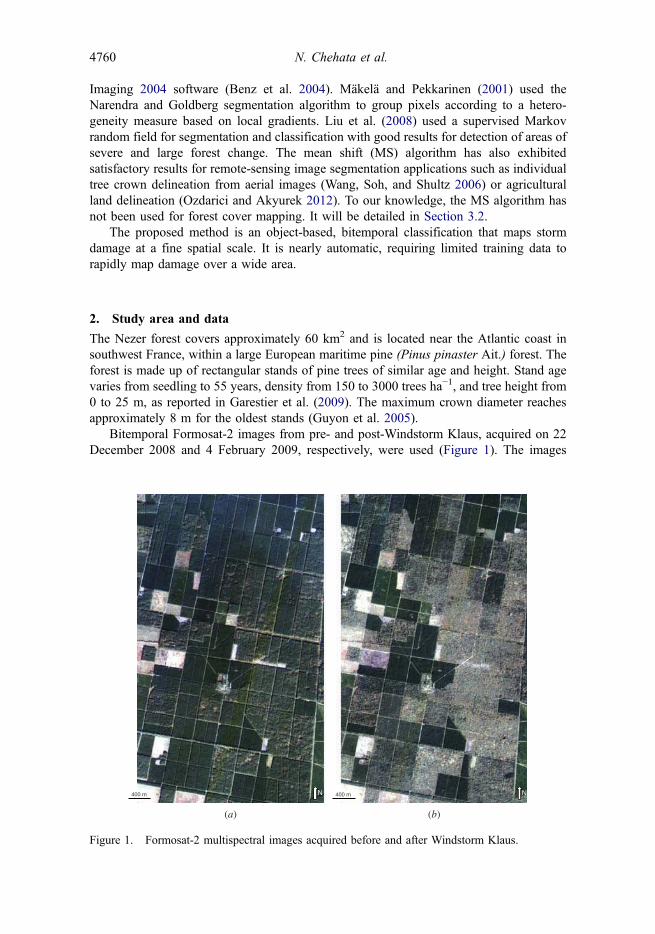
Bitemporal Formosat-2 images from pre- and post-Windstorm Klaus, acquired on 22December 2008 and 4 February 2009, respectively, were used (Figure 1). The images
(a) (b)
Figure 1. Formosat-2 multispectral images acquired before and after Windstorm Klaus.
4760 N. Chehata et al.
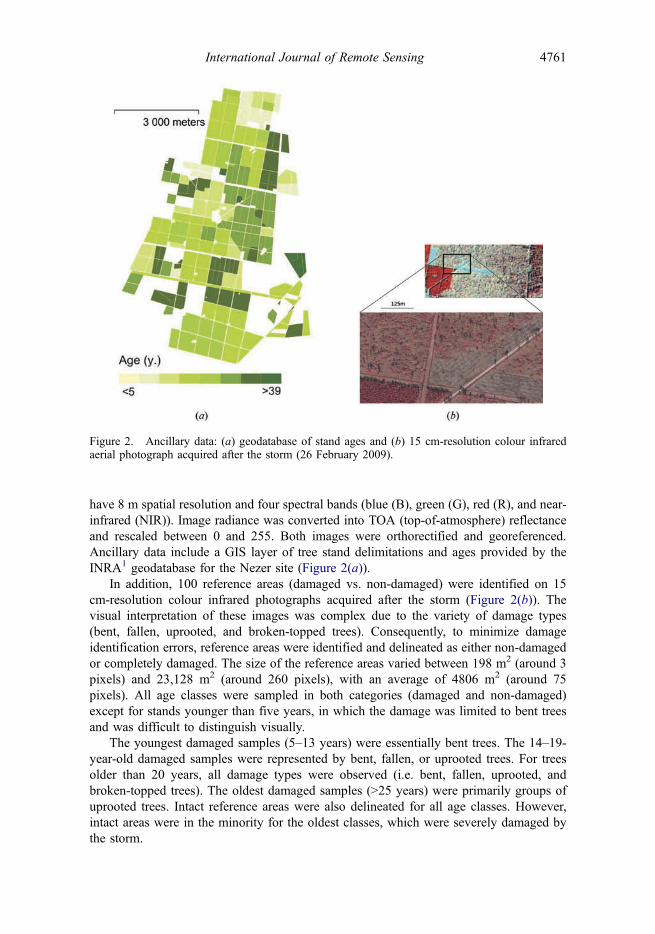
have 8 m spatial resolution and four spectral bands (blue (B), green (G), red (R), and near-infrared (NIR)). Image radiance was converted into TOA (top-of-atmosphere) reflectanceand rescaled between 0 and 255. Both images were orthorectified and georeferenced.Ancillary data include a GIS layer of tree stand delimitations and ages provided by theINRA1 geodatabase for the Nezer site (Figure 2(a)).
In addition, 100 reference areas (damaged vs. non-damaged) were identified on 15cm-resolution colour infrared photographs acquired after the storm (Figure 2(b)). Thevisual interpretation of these images was complex due to the variety of damage types(bent, fallen, uprooted, and broken-topped trees). Consequently, to minimize damageidentification errors, reference areas were identified and delineated as either non-damagedor completely damaged. The size of the reference areas varied between 198 m2 (around 3pixels) and 23,128 m2 (around 260 pixels), with an average of 4806 m2 (around 75pixels). All age classes were sampled in both categories (damaged and non-damaged)except for stands younger than five years, in which the damage was limited to bent treesand was difficult to distinguish visually.
The youngest damaged samples (5–13 years) were essentially bent trees. The 14–19-year-old damaged samples were represented by bent, fallen, or uprooted trees. For treesolder than 20 years, all damage types were observed (i.e. bent, fallen, uprooted, andbroken-topped trees). The oldest damaged samples (>25 years) were primarily groups ofuprooted trees. Intact reference areas were also delineated for all age classes. However,intact areas were in the minority for the oldest classes, which were severely damaged bythe storm.
Figure 2. Ancillary data: (a) geodatabase of stand ages and (b) 15 cm-resolution colour infraredaerial photograph acquired after the storm (26 February 2009).
International Journal of Remote Sensing 4761
3. Methodology
The proposed method is an object-based, bitemporal classification of storm damage. In thefollowing section, selected image features are presented. MS segmentation, which is at thecore of our algorithm, will be detailed. Then, the automatic feature selection process willbe explained and finally the automatic object-based bitemporal classification method willbe presented.
3.1. Proposed input features
Input features can be grouped into three main categories: spectral, textural, and temporal(Table 1). For spectral features, the Formosat-2 spectral bands (B, G, R, NIR) were used aswell as two vegetation indices, the normalized difference and soil adjusted vegetationindices (NDVI and SAVI, respectively). First-order statistics, such as the mean and varianceof the reflectance, were used as textural features. Among the more commonly used texturefeatures are the Haralick features (derived from a grey level co-occurrence matrix)(Haralick, Shanmugam, and Dinstein 1973), and some of these are considered particularlyrelevant for forest applications of image analysis (Ruiz, Fdez-sarria, and Recio 2004;Kayitakire, Hamel, and Defourny 2006; St-Louis et al. 2006; Trias-Sanz, Stamon, andLouchet 2008; Tuominen and Pekkarinen 2005). The neighbourhood radius and displace-ment vector length were both experimentally set to 1 pixel, which corresponds to amaximum crown diameter of 8 m. The displacement vector orientation was horizontal.Finally, three common temporal features were considered: mean correlation, difference, andratio between the pair of images. Temporal and textural features were processed for eachspectral band. A total of 84 features were used: 6 spectral features in addition to 10 texturaland 3 temporal, all of the latter computed separately for each of the 6 spectral features.
3.2. MS segmentation
The MS algorithm is a non-parametric, feature-space analysis technique that has shownexcellent results in colour image clustering and object delineation (Fukunaga and Hostetler1975; Comaniciu and Meer 2002). It is based on a density mode searching and clusteringtechnique. The feature space is considered the empirical probability density function (PDF)of the input features. The algorithm proposes a filtering step that associates each pixel in theimage with the closest local mode in the density distribution of the feature space. The MSprocedure locates these modes without estimating the global density. Then, the fusion of theregions associated with nearby modes leads to image segmentation. The implementation ofthe method proposed by Comaniciu and Meer (2002) searches for local modes in the jointfeature and spatial domain of n + 2 dimensions, where n is the number of features added to
Table 1. Spectral, textural, and temporal input features.
Spectral Textural Temporal
Blue Mean DifferenceGreen Variance RatioRed 8 Haralick features Mean correlationNIR Mean, contrast, entropyNDVI Angular second MomentSAVI Inverse difference moment, sum average, sum entropy, sum variance
4762 N. Chehata et al.
the two dimensions of the spatial domain. An iterative procedure of mode seeking consistsof shifting the n + 2 dimensional window to a local mode.
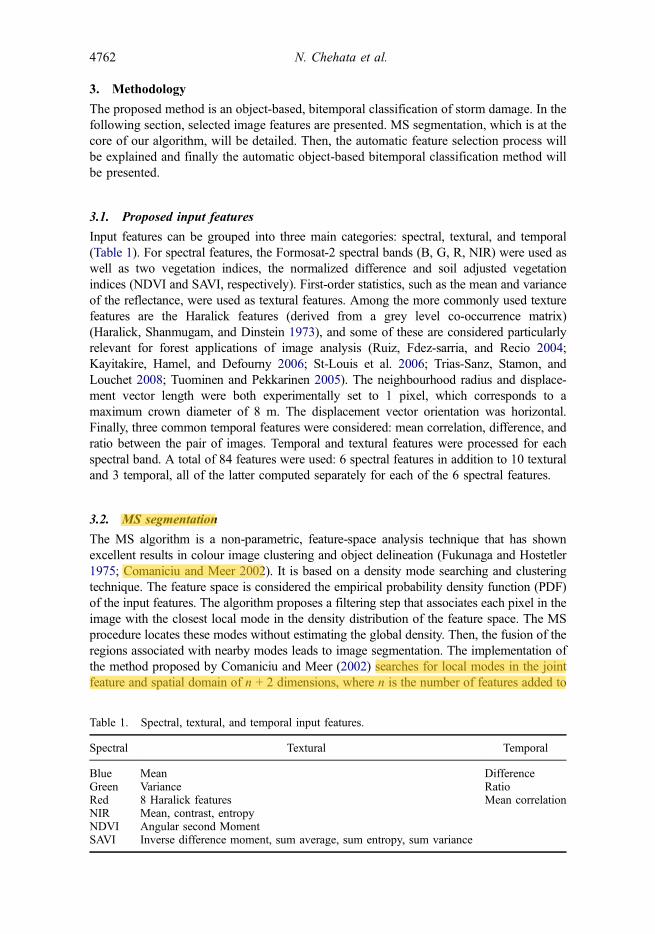
The search window involves two user-defined inputs that can be deduced from thedesired object sizes or physical properties. A radiometric range (hr) corresponds to theunique spectral radius in the n-dimensional search window and a spatial bandwidth (hs)that corresponds to the spatial radius of the window. To extract the objects of interest (i.e.tree stands), hr should be (1) higher than the maximum radiometric difference betweenintra-region pixel pairs and (2) lower than the radiometric difference between regionpixels and surrounding pixels outside the region. In practice, hr is optimized by theautomatic feature selection process (see Section 3.3). All features were individuallyrescaled between 0 and 255, and radiometric range hr varied from 2 to 60. The value ofhs should be close to the size of the objects of interest. In fact, the n + 2-dimensionalmoving window for mode searching should remain spatially within the object of interestsuch that all of its pixels are associated with a local mode within the window. Figure 3illustrates the impact of both parameters on the segmentation results.
The spatial radius hs of the MS segmentation was set using prior thematic knowledgeof the desired object size. Using hs = 3, the spatial window can reasonably be considereda regular forest pattern (Orny et al. 2010). Finally, in the proposed method, the MSprocedure is used in both segmentation and classification steps using the joint spatio-spectral domain and solely the spectral domain, respectively (see Section 3.4).
3.3. Automatic feature selection for segmentation
In the literature, segmentation is usually processed on all available before- and after-imagebands (B, G, R, NIR) (Mäkelä and Pekkarinen 2001; Mallinis et al. 2008) or on derived
hr
hs(hs,hr) = (5,5) (hs,hr) = (5,15)
(hs,hr) = (15,5) (hs,hr) = (15,15) (hs,hr) = (15,30)
(hs,hr) = (30,30)(hs,hr) = (30,15)(hs,hr) = (30,5)
(hs,hr) = (5,30)
Figure 3. Mean shift segmentations of a four-channel image (B, G, R, NIR) using differentparameters (hs,hr). When hr increases, only highly contrasted and homogeneous regions remain(e.g. the intact young stand on the left, the blue farming area, and the medium-aged stand on theright). If hs increases, only larger regions remain: shadow areas and standing tree groups disappearwithin the central, strongly damaged area.
International Journal of Remote Sensing 4763
bands such as NDVI, SAVI, or transformed bands (PCA) with no feature selection (Wangand Xu 2010). Supervised feature selection for classification can be based on the model-ling results of physical variables. In King et al. (2005), the image texture features bestcorrelated to the percentage of crown loss were used for damage classification. In Trias-Sanz, Stamon, and Louchet (2008), a quantitative measure between segmented regionboundaries and a reference GIS layer enabled the selection of the best features fromamong radiometric and texture features.
3.3.1. Feature selection using test frames
In this study, to determine the most relevant features for segmentation, input featureselection was carried out through an original generic calibration-like procedure using atest frame. Generally, a test frame is an ensemble of reference images that are used tocalibrate cameras. In this study, this process was used to select the best features forsegmentation and also aimed at automatically optimizing the segmentation parameters.
Classes describing different forest development stages and structures were defined.The number of classes was denoted as Nc. For the Nezer site, the age GIS reference layerand photointerpretation were used. The test frames were then constructed with Nc smallnon-overlapping image samples corresponding to Nc classes, yielding as many test framesas input features. The test frames were then segmented by the MS algorithm using oneinput feature (single test frame) and multiple rescaled features (multiband test frame)while simultaneously testing various segmentation parameterizations. All features wereindividually rescaled between 0 and 255. The feature segmentation performance (SP) isdefined as
SP ¼ 1
nc
Xi
maxj A Rið Þ˙A Rsj
� �� �A Rið Þ ;Ri˙Rsj � 0; (1)
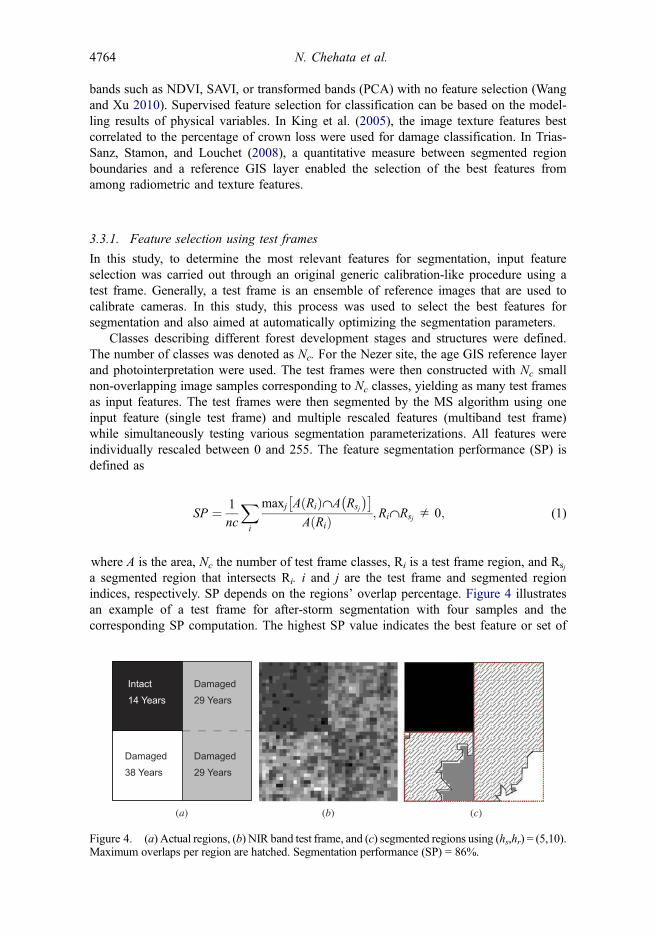
where A is the area, Nc the number of test frame classes, Ri is a test frame region, and Rsja segmented region that intersects Ri. i and j are the test frame and segmented regionindices, respectively. SP depends on the regions’ overlap percentage. Figure 4 illustratesan example of a test frame for after-storm segmentation with four samples and thecorresponding SP computation. The highest SP value indicates the best feature or set of
(a) (b) (c)
Figure 4. (a) Actual regions, (b) NIR band test frame, and (c) segmented regions using (hs,hr) = (5,10).Maximum overlaps per region are hatched. Segmentation performance (SP) = 86%.
4764 N. Chehata et al.

features. In this study, test frames were constructed for each feature with four referenceregions of 20 × 20 pixels (Figure 6).
Automatic feature selection is applied in three steps: (1) segmentation into structurallyhomogeneous before-storm regions, (2) segmentation of the after-storm image into tem-porally and structurally homogeneous regions, and (3) binary change classification. Asshown in Figure 6, reference test frames were adapted to each step using (1) actual ageclasses, (2) classes combining actual age and change type, and (3) actual change classes,respectively. For step (1), temporal features were not used, and for binary classification(step 3), only temporal features averaged over-segmented after-storm regions were used.
SP and the optimal hr were then processed automatically based on the reference testframes to select the best features for each step.
3.4. Unsupervised object-based bitemporal classification
The global unsupervised object-based bitemporal change detection scheme is depicted inFigure 5. We assume that the degree of change depends not only on the type and intensityof the damage but also on the initial stand structure. Consequently, the before- and after-storm images are segmented independently using the MS algorithm. The before-stormsegments correspond to homogeneous structural regions (i.e. those belonging to the sameage class). The after-storm segments reflect the degree of change. The selected featuresare processed as explained in Section 3.3. The joint classification is based on the MSalgorithm and is detailed in the current section.
3.4.1. MS spectral classification
The after-storm segmented regions are characterized by object mean temporal descriptors(i.e. by temporal features that are averaged per region). The automatic feature selectionprocess (see Section 3.3) provides the input features that optimize the MS spectralclassifier. They are then clustered automatically into change classes using this optimizedMS spectral classifier. Unlike MS segmentation (Comaniciu and Meer 2002), this mod-ified version is independent of pixel positions and involves only the spectral domain,which allows the clustering of similarly damaged regions that are spatially distant into thesame change class. The MS classifier has a single parameter, hr, which is the radiometricrange of the MS mode-seeking window. The lower the value of hr, the lower a cluster’sintra-variance.
MS spectral classification leads automatically to many change clusters. We did notseek to interpret the significance of these change classes, which would have requiredcollecting specific reference data just after the storm. Our objective in the present studywas to produce a damage map with a minimum of field data and an unsupervisedclassification process. Consequently, in this study, our work was limited to the productionof a binary change map even when the MS spectral classification provided multiplechange classes. A minimal radiometric range of hr = 2 was used to detect subtle changes(Figure 6). In this context of fine change detection, the number of change clusters can behigh, and the spectral distinction between intact and lightly damaged regions may becomplex. Thus, the automatic grouping of change clusters into damaged vs. non-damagedclasses is challenging. To address this issue, an innovative spatio-temporal feature, thefragmentation rate, is proposed.
International Journal of Remote Sensing 4765

Figure 5. Bitemporal object-based change detection scheme illustrated over a 3 × 3, 3 km2 area.
4766 N. Chehata et al.

3.4.2. A new spatio-temporal descriptor
To automatically group the change clusters into damaged vs. non-damaged classes in arobust way, the clusters were characterized by a new spatio-temporal feature: the frag-mentation rate (FR). This idea is based on the fact that, generally, for a change detectionapplication, landscape complexity increases with time. The diversification and fragmenta-tion of a landscape lead to more heterogeneous regions in the image. The presence ofheterogeneity (more or less important) in an initially homogeneous area can be interpretedas a change. Fragmentation would be more important in the case of disastrous changessuch as storms, floods, or earthquakes than for progressive changes such as urbanization.In this study, damaged areas are heterogeneous and therefore appear over-segmented inthe after-storm image. Conversely, intact areas correspond to larger regions that havesimilar delimitations in both images. FR characterizes the before-storm regions andreflects their over-segmentation in the after-storm image. It is computed as a comparisonbetween the before- and corresponding after-storm regions, as follows:
FR Rtð Þ ¼ 1�maxj A Rtð Þ˙A Rj
tþdt
� �h i
A Rtð Þ ;Rt˙Rjtþdt � 0; (2)
where A is the region of interest, Rt is the before-storm region, and Rjtþdt the after-storm
regions that are included (partly or entirely) in the before-storm one where j is the after-storm segmented regions index. The more the region R is fragmented, the nearer FR is to1. Conversely, intact regions should have a low FR close to 0.
Figure 6. Automatic feature selection process.
International Journal of Remote Sensing 4767

The average FR is then computed for the after-storm change clusters. The changecluster FR is then defined as
FR CCð Þ ¼ 1
N
Xp2CC
j FR Rt pð Þð Þ½ �; (3)
where CC is the after-storm change cluster and N the number of corresponding pixels (prepresents a pixel). The FR per change cluster is the averaged FR of corresponding before-storm regions. The change clusters are finally divided into damaged vs. non-damagedclasses, based on their FR and using the unsupervised Otsu threshold (Otsu 1979) whichminimizes intra-class variance.
4. Results and discussion
4.1. Feature selection
The segmentation and classification steps for the selected features using mono- andmultiband test frames are presented in this section.
4.1.1. Feature selection for segmentation
Table 2 presents the segmentation performance SP (Equation (1)) and MS parametrizationfor segmentation steps (1) and (2) presented in Section 3.3.1.
One may observe that the best features for segmenting before- and after-storm imagesare related to the red bands. In fact, as shown by Guyon, Courrier, and Berbigier (2001)for the same Nezer forest site, the pine crown cover fraction, related to tree density andcrown size, explains a large part of the variability of red reflectance whereas NIRreflectance depends more strongly on the green biomass of pine trees and undergrowthvegetation. These properties of the red band are important in describing the foreststructure before the storm (i.e. the forest variables determining the cover fraction ofstanding trees) and in detecting their changes after the storm (i.e. the broken, uprooted,or fallen trees that reduce the crown cover fraction without an immediate change in greenbiomass).
The best feature for the after-storm segmentation is temporal. The information on theinitial stand structure (which depends on tree age) from before the storm helps todetermine the degree of change after the storm.
Table 2. Optimal features and radiometric ranges, hr, for after- andbefore-storm segmentations using a four-region test frame. SP is seg-mentation performance.
After-storm segmentation Before-storm segmentation
Feature hr SP (%) Feature hr SP (%)
Red ratio 17 87.2 Red 2 80.7Red 3 78.1 NDVI 3 77.3Green ratio 16 75.5 Green 5 68.7
4768 N. Chehata et al.

From Table 2, one may also observe that the maximal SP value is higher whensegmenting the after-storm image (87.2%) than the before-storm (80.7%). In fact, theafter-storm regions are better discriminated because they combine age class and type ofchange information, whereas before-storm regions differ only by age classes, which arenot easily discriminated.
The optimal features for both segmentations are essentially spectral or temporal butnot textural. This is most likely due to, on one hand, the spatial resolution of Formosat-2(8 m), which provides insufficient textural information in a forest context, and on theother hand, the Haralick parameters not being optimized.
One may observe that the best SP values were obtained using only one feature.Multi-feature segmentation appears to be less relevant in this study, which can beexplained by two factors. First, the chosen implementation of MS (Comaniciu andMeer 2002) involves one unique radiometric range, hr for multiple features. Anadaptive MS radiometric range for each feature would enhance the results, as thatapproach would be more appropriate for remote-sensing images where the reflectancedistribution varies for each spectral band. Second, forest canopies are very complex,and changes in their reflectance between the before- and after-storm images arecorrelated to other changes beyond structural changes following storm damage. Forinstance, some changes may be detected due to forest phenology or differences inshadows. Using only one feature may limit these detections, considered as misclassi-fications for the damage class.
4.1.2. Feature selection for classification
The feature selection for the binary classification into damaged vs. non-damaged classesis shown in Table 3. Mono- and multiband two-region test frames were used (seeSection 3.3.1). Only temporal features were tested (see Section 3.1). The best-perform-ing feature was the green band difference, with a high SP value of over 92.6%. This wastherefore used as an input for the MS classifier to establish the change classes (seeSection 4.4). As with feature selection for segmentation, multiple features did notprovide better results.
4.2. MS segmentation
Figure 7 depicts the segmentation results before and after the storm using the correspond-ing best features. One can visually distinguish the intact and damaged areas. Intact areasare larger and have similar delimitations in both segmentations, whereas the damagedareas are more heterogeneous, leading to over-segmented regions.
Table 3. Optimal features for binary classification using a two-region test frame with hr = 2.
Feature SP (%)
Green difference 92.6NIR difference 70.5Red difference 64.5
International Journal of Remote Sensing 4769

4.3. FR
Figure 8 illustrates the FR of before-storm segments in grey levels. The lighter the regions, themore damaged they are. This result visually matches the tree stand agemap, where older standsappear to have more extensive damage than younger stands. In fact, among numerous factors,tree height most strongly influences the sensitivity of a tree to the wind (Cucchi et al. 2005).The young stands are dense with small trees, which makes them more robust to the wind. Incontrast, older stands are less dense and more heterogeneous due to silvicultural practices andare composed of taller trees that are more vulnerable and likely to be damaged by storms.
4.4. MS binary classification
TheMS classifier is based exclusively on the spectral domain. After-storm segmented regionsare classified into change clusters. Figure 9(a) shows approximately 30 change clusters
(a) (b)
Figure 8. Comparison between fragmentation rate and tree stand ages.
(a) (b)
Figure 7. Segmentation of before- and after-storm images using the best features (i.e. red band andred band ratio, respectively).
4770 N. Chehata et al.
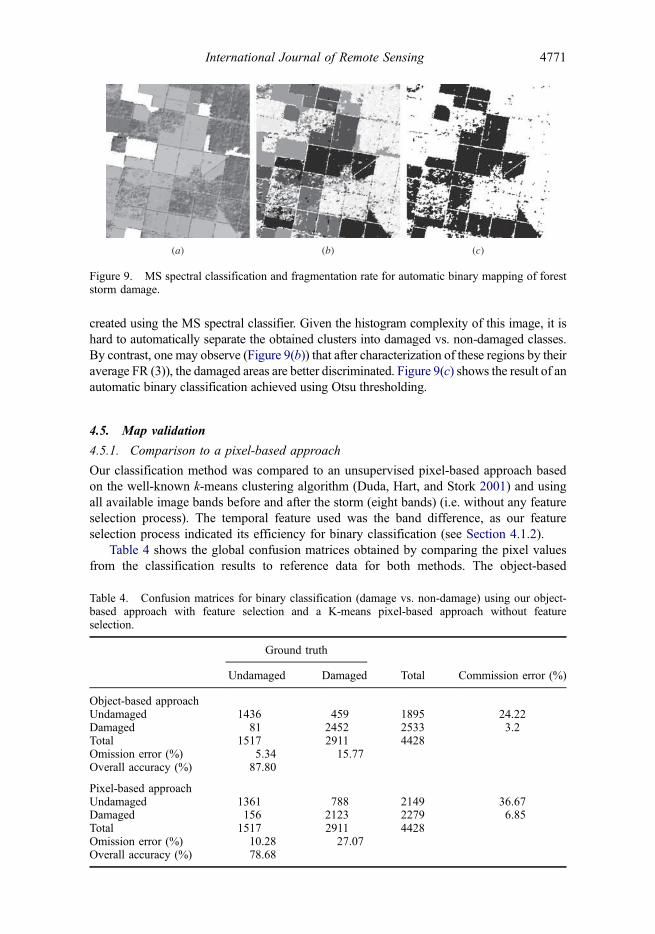
created using the MS spectral classifier. Given the histogram complexity of this image, it ishard to automatically separate the obtained clusters into damaged vs. non-damaged classes.By contrast, one may observe (Figure 9(b)) that after characterization of these regions by theiraverage FR (3)), the damaged areas are better discriminated. Figure 9(c) shows the result of anautomatic binary classification achieved using Otsu thresholding.
4.5. Map validation
4.5.1. Comparison to a pixel-based approach
Our classification method was compared to an unsupervised pixel-based approach basedon the well-known k-means clustering algorithm (Duda, Hart, and Stork 2001) and usingall available image bands before and after the storm (eight bands) (i.e. without any featureselection process). The temporal feature used was the band difference, as our featureselection process indicated its efficiency for binary classification (see Section 4.1.2).
Table 4 shows the global confusion matrices obtained by comparing the pixel valuesfrom the classification results to reference data for both methods. The object-based
(a) (b) (c)
Figure 9. MS spectral classification and fragmentation rate for automatic binary mapping of foreststorm damage.
Table 4. Confusion matrices for binary classification (damage vs. non-damage) using our object-based approach with feature selection and a K-means pixel-based approach without featureselection.
Ground truth
Undamaged Damaged Total Commission error (%)
Object-based approachUndamaged 1436 459 1895 24.22Damaged 81 2452 2533 3.2Total 1517 2911 4428Omission error (%) 5.34 15.77Overall accuracy (%) 87.80
Pixel-based approachUndamaged 1361 788 2149 36.67Damaged 156 2123 2279 6.85Total 1517 2911 4428Omission error (%) 10.28 27.07Overall accuracy (%) 78.68
International Journal of Remote Sensing 4771
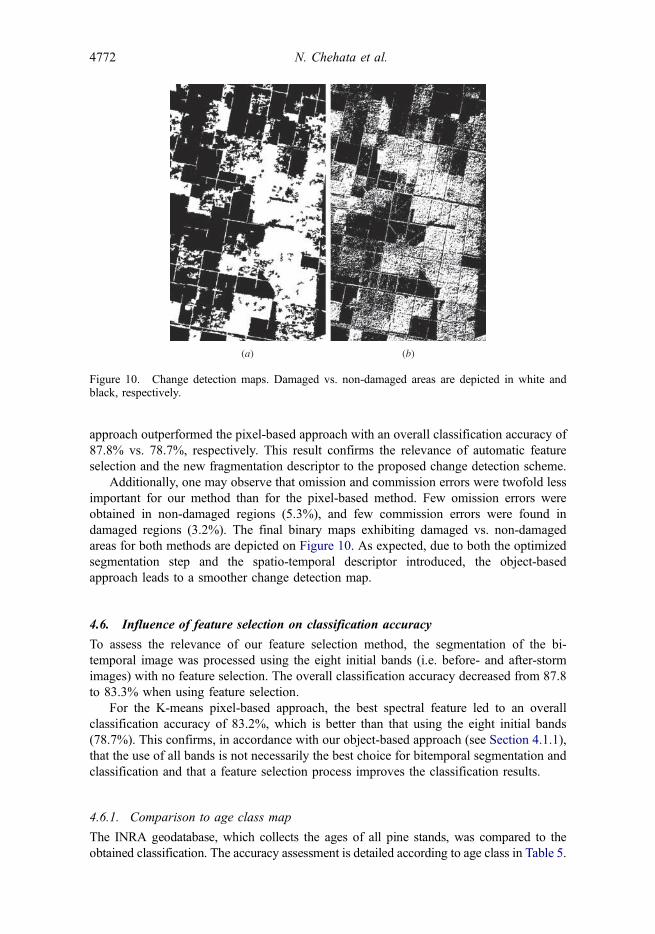
approach outperformed the pixel-based approach with an overall classification accuracy of87.8% vs. 78.7%, respectively. This result confirms the relevance of automatic featureselection and the new fragmentation descriptor to the proposed change detection scheme.
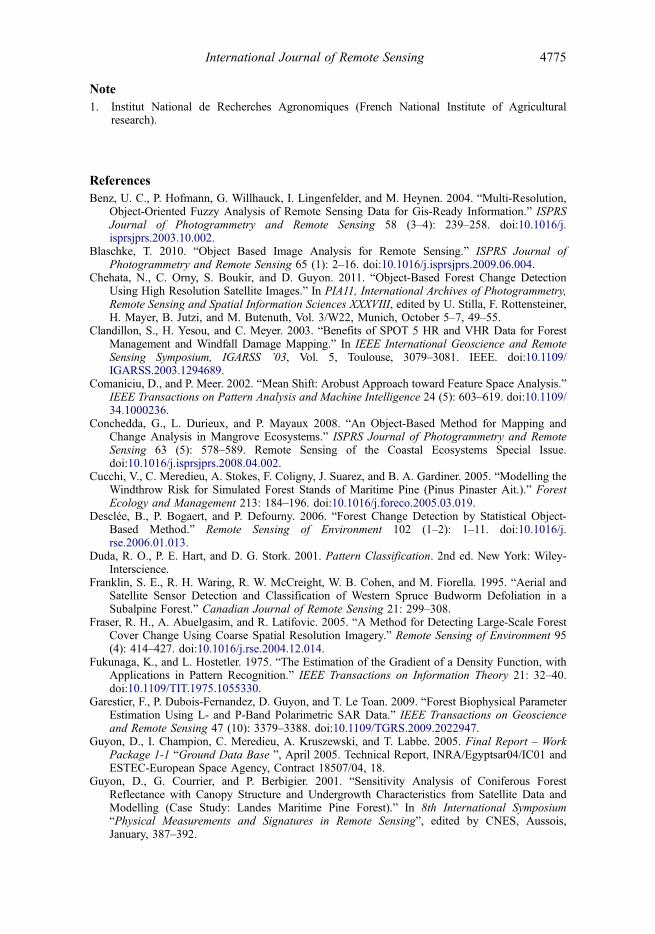
Additionally, one may observe that omission and commission errors were twofold lessimportant for our method than for the pixel-based method. Few omission errors wereobtained in non-damaged regions (5.3%), and few commission errors were found indamaged regions (3.2%). The final binary maps exhibiting damaged vs. non-damagedareas for both methods are depicted on Figure 10. As expected, due to both the optimizedsegmentation step and the spatio-temporal descriptor introduced, the object-basedapproach leads to a smoother change detection map.
4.6. Influence of feature selection on classification accuracy
To assess the relevance of our feature selection method, the segmentation of the bi-temporal image was processed using the eight initial bands (i.e. before- and after-stormimages) with no feature selection. The overall classification accuracy decreased from 87.8to 83.3% when using feature selection.
For the K-means pixel-based approach, the best spectral feature led to an overallclassification accuracy of 83.2%, which is better than that using the eight initial bands(78.7%). This confirms, in accordance with our object-based approach (see Section 4.1.1),that the use of all bands is not necessarily the best choice for bitemporal segmentation andclassification and that a feature selection process improves the classification results.
4.6.1. Comparison to age class map
The INRA geodatabase, which collects the ages of all pine stands, was compared to theobtained classification. The accuracy assessment is detailed according to age class in Table 5.
(a) (b)
Figure 10. Change detection maps. Damaged vs. non-damaged areas are depicted in white andblack, respectively.
4772 N. Chehata et al.

The percentage of pixels classified as damaged (damage rate) was computed withineach age class and the results are shown in Figure 11, which also depicts the behaviour ofthe overall classification accuracy with respect to each age class. This figure shows thatclassification accuracy increases significantly with stand age. In fact, tree sensitivity towind increases with tree height, which depends on tree age (Cucchi et al. 2005). Thiseffect is confirmed by the Formosat-2-derived damage rate, which was higher for olderstands and reached 70% for stands over 25 years old. This is a good indicator of thequality of the results obtained.
Table 5 shows that the classification accuracy of stands aged from 14 to 39 years (fourintermediate classes) is high and ranges between 93.3 and 99.4%. However, the twoyoungest classes and the oldest stand class have lower detection rates (60, 41.4, and71.5%, respectively) resulting from high omission and commission errors (>30%).Confusion occurred between damaged areas and non-damaged older areas, which wereoriginally heterogeneous and sparse. In fact, both areas have similar spectral propertiesand textural structure. In addition, subtle change areas with minor tree damage (bent trees)were hard to detect in dense young stands. In addition, very small intact or damaged areascannot be detected due to the limited spatial resolution of Formosat-2 images. Finally, inour method, shadows are not explicitly taken into account in segmentation or in
Table 5. Confusion matrix according to age class.
Omission error (%) Commission error (%)
Age classNumber of
pixels Non-damage Damage Non-damage DamageOverall accuracy per
age class (%)
5 − 9 115 0 100 40.0 100 60.010 − 13 510 0 99.0 59.0 100 41.414 − 20 1406 0.76 12.0 11.9 0.76 93.321 − 25 424 6.25 0 0 10.1 96.026 − 30 694 9.30 0 0 0.61 99.431 − 39 1086 26.3 0 0 5.53 95.2>39 193 11.1 30.3 76.8 1.61 71.5
Figure 11. Overall classification accuracy and damage rate as a function of age class.
International Journal of Remote Sensing 4773

classification, potentially leading to misclassifications. With only one image dataset, wewere unable to estimate the influence of shadows or viewing angle on the outcome of thechange detection. These issues should be further developed in future work.
5. Conclusion
We have presented in this paper an object-based bitemporal change detection method thatis well suited to emergency mapping. It has the appealing property of requiring only a fewsamples to construct the test frames, leading to a low requirement for supervisioncompared with more traditional supervised methods. Moreover, our method involvesonly two user-defined parameters and does not need to meet any statistical assumptions,thanks to the powerful MS clustering algorithm at the core of our change detectionscheme.
Our contribution comprises two main novelties with respect to similar works inforestry. First, an automatic feature selection process, applied to both the segmentationand classification steps, is introduced. Its originality lies in the use of test frames (single-or multibands) of adequate forest samples. This innovative feature selection process,inspired by camera calibration procedures, allows a rapid evaluation of hundreds offeatures and combined features. It is applicable to the optimization of any other segmenta-tion algorithm.
The second original feature of our approach is a relevant spatio-temporal descriptor:the FR, which enables a simple automatic binary threshold (damage vs. non-damage) forthe various change clusters obtained by the MS classifier. The FR can be applied to otherchange detection applications assuming that natural processes, either progressive (urba-nization) or disastrous (floods, earthquakes, etc.), tend to fragment the landscape.
Our change detection scheme was applied in forestry, in the context of storm damagemapping. Severe damage was accurately detected, and our method yields a good overallaccuracy of 87.8
In future work, the radiometric range, hr should be adapted to each feature in the MSalgorithm to cover the spectral distribution variability and therefore take advantage of thecombination of multiple features. In addition, our MS-based change detection schemeallows the detection of gradual changes. Appropriate reference data should be collected tovalidate such applications. In addition, our method will be applied to very high-resolutionsatellite images, such as those of QuickBird, IKONOS, or Pleiade, to evaluate itsperformance for subtle change detection (e.g. bent trees) and other applications.
AcknowledgementsThe Orfeo programme facilitated the future use of the VHR Pleiades images. Access to the imageswas granted by the CNES Kalideos Programme (http://Kalideos.cnes.fr). The images were analysedusing the OTB toolbox (www.orfeo-toolbox.org). The authors also acknowledge Olivier Hagolle(CNES/Cesbio, Toulouse), and Christophe Moisy (INRA, EPHYSE, Bordeaux) for imagepreprocessing.
FundingThe present study was carried out within the Orfeo programme funded by CNES (Centre Nationald’Etudes Spatiales). The authors also acknowledge INRA for the funding of the orthophotographswithin Crédit tempête 2009.
4774 N. Chehata et al.
Note1. Institut National de Recherches Agronomiques (French National Institute of Agricultural
research).
ReferencesBenz, U. C., P. Hofmann, G. Willhauck, I. Lingenfelder, and M. Heynen. 2004. “Multi-Resolution,
Object-Oriented Fuzzy Analysis of Remote Sensing Data for Gis-Ready Information.” ISPRSJournal of Photogrammetry and Remote Sensing 58 (3–4): 239–258. doi:10.1016/j.isprsjprs.2003.10.002.
Blaschke, T. 2010. “Object Based Image Analysis for Remote Sensing.” ISPRS Journal ofPhotogrammetry and Remote Sensing 65 (1): 2–16. doi:10.1016/j.isprsjprs.2009.06.004.
Chehata, N., C. Orny, S. Boukir, and D. Guyon. 2011. “Object-Based Forest Change DetectionUsing High Resolution Satellite Images.” In PIA11, International Archives of Photogrammetry,Remote Sensing and Spatial Information Sciences XXXVIII, edited by U. Stilla, F. Rottensteiner,H. Mayer, B. Jutzi, and M. Butenuth, Vol. 3/W22, Munich, October 5–7, 49–55.
Clandillon, S., H. Yesou, and C. Meyer. 2003. “Benefits of SPOT 5 HR and VHR Data for ForestManagement and Windfall Damage Mapping.” In IEEE International Geoscience and RemoteSensing Symposium, IGARSS ’03, Vol. 5, Toulouse, 3079–3081. IEEE. doi:10.1109/IGARSS.2003.1294689.
Comaniciu, D., and P. Meer. 2002. “Mean Shift: Arobust Approach toward Feature Space Analysis.”IEEE Transactions on Pattern Analysis and Machine Intelligence 24 (5): 603–619. doi:10.1109/34.1000236.
Conchedda, G., L. Durieux, and P. Mayaux 2008. “An Object-Based Method for Mapping andChange Analysis in Mangrove Ecosystems.” ISPRS Journal of Photogrammetry and RemoteSensing 63 (5): 578–589. Remote Sensing of the Coastal Ecosystems Special Issue.doi:10.1016/j.isprsjprs.2008.04.002.
Cucchi, V., C. Meredieu, A. Stokes, F. Coligny, J. Suarez, and B. A. Gardiner. 2005. “Modelling theWindthrow Risk for Simulated Forest Stands of Maritime Pine (Pinus Pinaster Ait.).” ForestEcology and Management 213: 184–196. doi:10.1016/j.foreco.2005.03.019.
Desclée, B., P. Bogaert, and P. Defourny. 2006. “Forest Change Detection by Statistical Object-Based Method.” Remote Sensing of Environment 102 (1–2): 1–11. doi:10.1016/j.rse.2006.01.013.
Duda, R. O., P. E. Hart, and D. G. Stork. 2001. Pattern Classification. 2nd ed. New York: Wiley-Interscience.
Franklin, S. E., R. H. Waring, R. W. McCreight, W. B. Cohen, and M. Fiorella. 1995. “Aerial andSatellite Sensor Detection and Classification of Western Spruce Budworm Defoliation in aSubalpine Forest.” Canadian Journal of Remote Sensing 21: 299–308.
Fraser, R. H., A. Abuelgasim, and R. Latifovic. 2005. “A Method for Detecting Large-Scale ForestCover Change Using Coarse Spatial Resolution Imagery.” Remote Sensing of Environment 95(4): 414–427. doi:10.1016/j.rse.2004.12.014.
Fukunaga, K., and L. Hostetler. 1975. “The Estimation of the Gradient of a Density Function, withApplications in Pattern Recognition.” IEEE Transactions on Information Theory 21: 32–40.doi:10.1109/TIT.1975.1055330.
Garestier, F., P. Dubois-Fernandez, D. Guyon, and T. Le Toan. 2009. “Forest Biophysical ParameterEstimation Using L- and P-Band Polarimetric SAR Data.” IEEE Transactions on Geoscienceand Remote Sensing 47 (10): 3379–3388. doi:10.1109/TGRS.2009.2022947.
Guyon, D., I. Champion, C. Meredieu, A. Kruszewski, and T. Labbe. 2005. Final Report – WorkPackage 1-1 “Ground Data Base ”, April 2005. Technical Report, INRA/Egyptsar04/IC01 andESTEC-European Space Agency, Contract 18507/04, 18.
Guyon, D., G. Courrier, and P. Berbigier. 2001. “Sensitivity Analysis of Coniferous ForestReflectance with Canopy Structure and Undergrowth Characteristics from Satellite Data andModelling (Case Study: Landes Maritime Pine Forest).” In 8th International Symposium“Physical Measurements and Signatures in Remote Sensing”, edited by CNES, Aussois,January, 387–392.
International Journal of Remote Sensing 4775

Haralick, R. M., K. Shanmugam, and I. Dinstein. 1973. “Textural Features for ImageClassification.” IEEE Transactions on Systems, Man, and Cybernetics 3: 610–621.doi:10.1109/TSMC.1973.4309314.
Hayes, D. J., and W. B. Cohen. 2007. “Spatial, Spectral and Temporal Patterns of Tropical ForestCover Change as Observed with Multiple Scales of Optical Satellite Data.” Remote Sensing ofEnvironment 106 (1): 1–16. doi:10.1016/j.rse.2006.07.002.
Huang, C., K. Song, S. Kim, J. R. G. Townshend, P. Davis, J. G. Masek, and S. N. Goward. 2008.“Use of a Dark Object Concept and Support Vector Machines to Automate Forest CoverChange Analysis.” Remote Sensing of Environment 112 (3): 970–985. doi:10.1016/j.rse.2007.07.023.
Im, J., and J. R. Jensen. 2005. “A Change Detection Model Based on Neighborhood CorrelationImage Analysis and Decision Tree Classification.” Remote Sensing of Environment 99 (3): 326–340. doi:10.1016/j.rse.2005.09.008.
Johansen, K., L. A. Arroyo, S. Phinn, C. Witte, R. J. Kauth, and G. S. Thomas. 2010. “Comparisonof Geo-Object Based and Pixel-Based Change Detection of Riparian Environments Using HighSpatial Resolution Multi-Spectral Imagery.” Photogrammetric Engineering and Remote Sensing76 (2): 123–136. doi:10.14358/PERS.76.2.123.
Johansen, K., N. C. Coops, S. E. Gergel, and Y. Stange. 2007. “Application of High SpatialResolution Satellite Imagery for Riparian and Forest Ecosystem Classification.” RemoteSensing of Environment 110 (1): 29–44. doi:10.1016/j.rse.2007.02.014.
Jonikavičius, D., and G. Mozgeris. 2013. “Rapid Assessment of Wind Storm-Caused Forest DamageUsing Satellite Images and Stand-Wise Forest Inventory Data.” iforest 6: 150–155. doi:10.3832/ifor0715-006.
Kayitakire, F., C. Hamel, and P. Defourny. 2006. “Retrieving Forest Structure Variables Based onImage Texture Analysis and IKONOS-2 Imagery.” Remote Sensing of Environment 102: 390–401. doi:10.1016/j.rse.2006.02.022.
Kennedy, R. E., P. A. Townsend, J. E. Gross, W. B. Cohen, P. Bolstad, Y. Q. Wang, and P. Adams.2009. “Remote Sensing Change Detection Tools for Natural Resource Managers: UnderstandingConcepts and Tradeoffs in the Design of Landscape Monitoring Projects.” Remote Sensing ofEnvironment 113 (7): 1382–1396. doi:10.1016/j.rse.2008.07.018.
Kim, M., M. Madden, and T. Warner. 2008. “Estimation of Optimal Image Object Size for theSegmentation of Forest Stands with Multispectral IKONOS Imagery.” In Object-Based ImageAnalysis, edited by T. Blaschke, S. Lang, and G. J. Hay, 291–307. Lecture Notes in Geoinfor-mation and Cartography. Berlin: Springer.
King, D. J., I. Olthof, P. K. E. Pellikka, E. D. Seed, and C. Butson. 2005. “Modelling and MappingDamage to Forests from an Ice Storm Using Remote Sensing and Environmental Data.” NaturalHazards 35: 321–342. doi:10.1007/s11069-004-1795-4.
Lamonaca, A., P. Corona, and A. Barbati. 2008. “Exploring Forest Structural Complexity by Multi-Scale Segmentation of VHR Imagery.” Remote Sensing of Environment 112 (6): 2839–2849.doi:10.1016/j.rse.2008.01.017.
Liu, D., K. Song, J. R. G. Townshend, and P. Gong. 2008. “Using Local Transition ProbabilityModels in Markov Random Fields for Forest Change Detection.” Remote Sensing ofEnvironment 112 (5): 2222–2231. Earth Observations for Terrestrial Biodiversity andEcosystems Special Issue. doi:10.1016/j.rse.2007.10.002.
Mäkelä, H., and A. Pekkarinen. 2001. “Estimation of Timber Volume at the Sample Plot Level byMeans of Image Segmentation and Landsat TM Imagery.” Remote Sensing of Environment 77:66–75. doi:10.1016/S0034-4257(01)00194-8.
Mallinis, G., N. Koutsias, M. Tsakiri-Strati, and M. Karteris. 2008. “Object-Based ClassificationUsing Quickbird Imagery for Delineating Forest Vegetation Polygons in a Mediterranean TestSite.” ISPRS Journal of Photogrammetry and Remote Sensing 63 (2): 237–250. doi:10.1016/j.isprsjprs.2007.08.007.
McRoberts, R. E., and B. F. Walters. 2012. “Statistical Inference for Remote Sensing-BasedEstimates of Net Deforestation.” Remote Sensing of Environment 124: 394–401. doi:10.1016/j.rse.2012.05.011.
Meyer, C., P. Geldreich, and H. Yesou. 2001. “Apports des Données Simulées SPOT5 Pour l’Évaluation Des Dégâts De Tempête Dans La Forêt. Cas De La Foret De Haguenau (Alsace,France).” In Bulletin de la Société Française de Photogrammétrie et de Télédétection, No. 164–165 (2001-4/2002-1): 162–173.
4776 N. Chehata et al.

Olthof, I., D. J. King, and R. A. Lautenschlager. 2004. “Mapping Deciduous Forest Ice StormDamage Using Landsat and Environmental Data.” Remote Sensing of Environment 89: 484–496. doi:10.1016/j.rse.2003.11.010.
Orny, C., N. Chehata, S. Boukir, and D. Guyon. 2010. Characterization of Maritime Pine ForestStructure Changes with VHR Satellite Imagery: Application to the 24th January 2009 WindfallDamages Cartography. Technical Report. Toulouse: CNES.
Otsu, N. 1979. “A Threshold Selection Method from Gray-Level Histograms.” IEEE Transactionson Systems, Man and Cybernetics 9: 62–66. doi:10.1109/TSMC.1979.4310076.
Ozdarici, O. A., and Z. Akyurek. 2012. “A Segment-Based Approach to Classify Agricultural Landsby Using Multi-Temporal Optical and Microwave Data.” International Journal of RemoteSensing 33 (22): 7184–7204. doi:10.1080/01431161.2012.700423.
Pasher, J., and D. J. King. 2009. “Mapping Dead Wood Distribution in a Temperate HardwoodForest Using High Resolution Airborne Imagery.” Forest Ecology and Management 258: 1536–1548. doi:10.1016/j.foreco.2009.07.009.
Ruiz, L. A., A. Fdez-sarria, and J. A. Recio. 2004. “Texture Feature Extraction for Classification ofRemote Sensing Data Using Wavelet Decomposition: A Comparative Study.” InternationalArchives of Photogrammetry and Remote Sensing XXXV: 1682–1750.
Schwarz, M., C. Steinmeier, and L. Waser. 2001. “Detection of Storm Losses in Alpine Forest Areasby Different Methodic Approaches Using High Resolution Satellite Data.” In Proceedings of the21st EARSeL Symposium: Observing Our Environment from Space: New Solutions for a NewMillenium, 251–257.
St-Louis, V., A. M. Pidgeon, V. C. Radeloff, T. J. Hawbaker, and M. K. Clayton. 2006.“Highresolution Image Texture as a Predictor of Bird Species Richness.” Remote Sensing ofEnvironment 105: 299–312. doi:10.1016/j.rse.2006.07.003.
Trias-Sanz, R., G. Stamon, and J. Louchet. 2008. “Using Colour, Texture, and HierarchialSegmentation for High-Resolution Remote Sensing.” ISPRS Journal of Photogrammetry andRemote Sensing 63: 156–168. doi:10.1016/j.isprsjprs.2007.08.005.
Tuominen, S., and A. Pekkarinen. 2005. “Performance of Different Spectral and Textural AerialPhotograph Features in Multi-Source Forest Inventory.” Remote Sensing of Environment 94:256–268. doi:10.1016/j.rse.2004.10.001.
Vibrans, A. C., R. E. McRoberts, P. Moser, and A. L. Nicoletti. 2013. “Using Satellite Image-BasedMaps and Ground Inventory Data to Estimate the Area of the Remaining Atlantic Forest in theBrazilian State of Santa Catarina.” Remote Sensing of Environment 130: 87–95. doi:10.1016/j.rse.2012.10.023.
Wang, W., J. J. Qu, X. Hao, Y. Liu, and J. A. Stanturf. 2010. “Post-Hurricane Forest DamageAssessment Using Satellite Remote Sensing.” Agricultural and Forest Meteorology 150: 122–132. doi:10.1016/j.agrformet.2009.09.009.
Wang, Y., Y. S. Soh, and H. Shultz. 2006. “Individual Tree Crown Segmentation in Aerial ForestryImages by Mean Shift Clustering and Graph-Based Cluster Merging.” International Journal ofComputer Science and Network Security 6 (11): 40–45.
Wang, F., and Y. J. Xu. 2010. “Comparison of Remote Sensing Change Detection Techniques forAssessing Hurricane Damage to Forests.” Environmental Monitoring and Assessment 162: 311–326. doi:10.1007/s10661-009-0798-8.
Wulder, M. A., J. C. White, N. C. Coops, and C. R. Butson. 2008. “Multi-Temporal Analysis ofHigh Spatial Resolution Imagery for Disturbance Monitoring.” Remote Sensing of Environment112 (6): 2729–2740. doi:10.1016/j.rse.2008.01.010.
International Journal of Remote Sensing 4777

Copyright of International Journal of Remote Sensing is the property of Taylor & Francis Ltdand its content may not be copied or emailed to multiple sites or posted to a listserv withoutthe copyright holder's express written permission. However, users may print, download, oremail articles for individual use.