obj: given activity sheet and notes swbat explain conduction, convection and radiation with 70%...
TRANSCRIPT

OBJ: Given activity sheet and notes SWBAT explain conduction, convection and radiation with 70% accuracy.
DN: Hand-in Layers of the Atmosphere College Style Lab and ALQ scantron; HW check- Is CO2 Increasing Earth’s Temperature Sheet
ACT: 1] Introduction to Conduction Convection and Radiation2] Heating & Cooling of Land (Soil) and Water Lab Prep
3] Read, text, p.42-45, Complete Heat Transfer Booklet
HW: Complete Heat Transfer Booklet; Work on Meteorology Activity Sheets; Weather Exam, Wed. Oct 29.

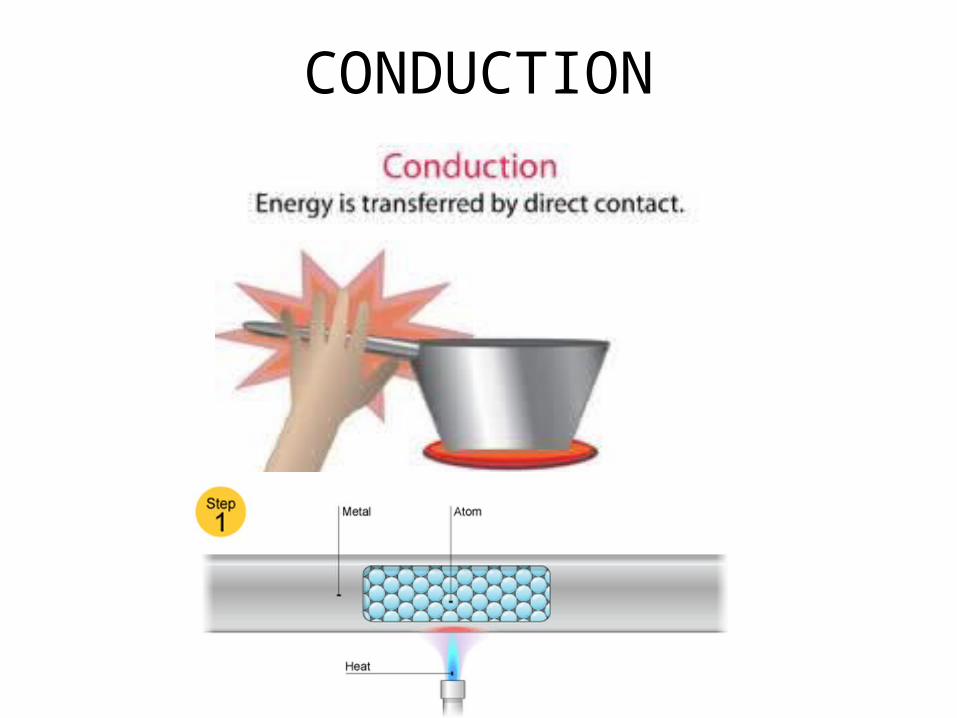
Types of Heat Transfer• Conduction: Heat transfer through solids by atom
to atom collision; example: pot on stove, hold metal bar over campfire.
• Convection: Heat transfer through fluids (liquids, gases) due to differences in density (convection cell)– Warm: less dense, rises (hot air balloon)– Cold: more dense, sinks– Example: atmospheric circulation (winds,
breezes),Ocean circulation, Earth Interior (mantle) circulation.
• Radiation: Heat transfer through space. Example: tanning by sun’s radiation, heat (infrared rays) from fireplace, campfire, stove.

Heat Transfer: movement of energy from place to place.
CONDUCTION

CONVECTION

RADIATION

TODAY, COPY THESE NOTES . . .
WATER SOIL
HeatLamp

FRIDAY YOU GET:
You are given a blank data table to collect your data and blank graph paper to plot your data. The graph will be a double line graph (1st line = water; 2nd line = soil) with one axis temperature and the other axis time. You are given 20 minutes to collect your heating and cooling data for soil (land) and water.
You will be given 5 minutes to discuss and set up your soil versus water experiment. We will start at Time = 0, record the temperature. Then I will start the stopwatch on the smartboard and every minute I will announce the time. You will record your temperature & time data. At 20 minutes, the experiment is over. Plot your results and start the lab write up.
READY?

FRIDAY’S LAB

DATA TABLETEMPERATURE (LIGHT ON) - HEATING TEMPERATURE (LIGHT OFF) - COOLING
TIME (min) SAND WATER TIME (min) SAND WATER
0 ºC ºC
1 ºC ºC 11 ºC ºC
2 12
3 13
4 14
5 15
6 16
7 17
8 18
9 19
10 20
TODAY, COPY THESE NOTES . . .

DATA TABLE
FRIDAY YOU GET:

TIME (minute)
TE
MP
ER
AT
UR
E (
ºC)
TODAY, COPY THESE NOTES . . .
WATER
SO
IL
0 1 2 3 4 5 6 7 8 9 10 11 12 13 14 15 16 17 18 19 20

FRIDAY YOU GET:

Lesson Notes
• Land (sand): heats up and cools _______• Water (ocean): heats up and cools ______• Dark: heats up fast (absorbs heat energy)• Light: cools (reflects heat energy)• Smooth surfaces: cools (reflects heat
energy)• Rough surfaces: heats up (absorbs heat
energy)

Sea & Land Breezes
