oak ridge national laboratory performance …/67531/metadc681410/m2/1/high... · oak ridge national...
TRANSCRIPT

d ORNLKM-13245
OAK RIDGE NATIONAL LABORATORY
. L O C K H E E D I Y A R t l M *
MANAGED AND OPERATED BY LOCKHEED MAAnN ENERGY RESEARCH CORPORATlON FOA THE UMTED STATES DEPAATMENTOFENERGY
ORNL-27 (3.9g)
Performance of the CEDS Accident Dosimetry System at the 1995
Los Alamos National Laboratory Nuclear Accident Dosimetry
Intercom parison
K. L. McMahan L. J. Schwanke

C .
I This report has been reproduced directly from the best available copy.
Available to DOE and DOE contractors from the Office of Scientific and Technical Information. P.0.Box 62, Oak Ridge, TN 37831; prices available from (423) 576-8401, FTS 6268401.
Available to the public from the National Technical Information Service, U.S. Department of Commerce, 5285 Port Royal Rd.. Springfield, VA 221 61 ,
This report was prepared a an account of work sponsored by an agency of the United States Government. Neither the United States Government nor any agency thereof, nor any of their employees, makes any warranty, express or implied, or assumes any legal liability or responsibility for the accuracy, completeness. or usefulness of any information, apparatus, product, or process disclosed, or represents that its use would not infringe privately owned rights. Reference herein to any specific commercial product, process, or service by trade name, trademark, manufacturer, or othelwise. does not necessarily constitute or imply its endorsement, recommendation, or favoring by the United States Government or any agency thereof. The view and opinions of authors expressed herein do not necessarily state or reflect those of the UnitedStatesGovernment or any agency thereof.
ORNLRM-13245
Office of Radiation Protection
PERFORMANCE OF THE CEDS ACCIDENT DOSIMETRY SYSTEM AT THE 1995 LOS ALAMOS NATIONAL LABORATORY
NUCLEAR ACCIDENT DOSIMETRY INTERCOMPARISON
K. L. McMahan L. J. Schwanke
* Manuscript Completed-November 1996
Date Published-December 1996
Prepared by the Oak Ridge National Laboratory Oak Ridge, Tennessee.37831-6285
managed by LOCKHEED MARTIN ENERGY RESEARCH COW.
for the US. DEPARTMENT OF ENERGY
under contract number DE-ACO5-96OR22464

TABLE OF CON'IXNTS
PaRe
LISTOFTABLES ............................................................. v
1 . INTRODUCTION ............................................................ 1
2 . TLD SYSTEM DESCRIPTION ................................................ 2 2.1 TLDHARDWARE ................................................... 2
2.1.1 Harshaw Model 8805 Beta-Gamma Personnel Dosimeter ............. 3 2.1.2 Harshaw Model 8806 Neutron Dosimeter .......................... 3 2.1.3 PNAD and FNAD Dosimeters .................................... 4 2.1.4 Harshaw Model 8800 Hot-Gas TLD Reader ........................ 4 2.1.5 Neutral-Density Filters ......................................... 5 2.1.6 Phantoms ................................................... 5 2.1.7 TLD Readout Procedures ........................................ 5
2.2 DOSE CALCULATION METHODS ..................................... 6 2.2.1 Dose Calculation Equations for the 8805 and 8806 Dosimeters ......... 6 2.2.2 Fading Corrections ............................................ 8 2.2.3 Supralinearity Corrections ...................................... 8
3 . TLD SYSTEM PERFORMANCE .............................................. 8 3.1 DOSIMETERPERFORMANCE ........................................ 8
3.1.1 PNADPerformance ........................................... 8 3.1.2 FNAD Performance ............................................ 9 3.1.3 Offset. Free-in-Air and Opposite Side Results ..................... 12
3.2 OPERATIONAL LESSONS .......................................... 13 3.2.1 Signal Reduction Techniques ........................... ...... 13 3.2.2 PMT Noise Behavior ......................................... 14 3.2.3 Reference Light Range ............. .. .......................... 16 3.2.4QCCards ................................................... 16 3.2.5 Activated Dosimeter Components ............................... 17
3.3 DOSE INTERPRETATION LESSONS .................................. 18 3.3.1 Lithium Fluoride Supralinearity ................................. 18 3.3.2 Incorrect Factor in Dose Calculation Equations ..................... 19 3.3.3 Single-Point Calibration ....................................... 19 3.3.4 Gamma Dose Calculation ..................................... 20 3.3.5 Miscellaneous Dose Calculation Findings ......................... 20
3.4 SUMMARY OF TLD SYSTEM PERFORMANCE ........................ 21 3.5 DISCUSSION AND CONCLUSIONS ................................... 22
iii
.. ......... . . . . . . . . . . . r :' .. <. . .-. ._ i . . . . . . .< ) ...,.. f:: . . . , ":'. 5 . . I. r x
, . . . . 1 i:
TABLE OF CONTENTS (continued)
4 . INDIUM FOIL ANALYSIS .................................................. 23 4.1 DESCRIPTION ..................................................... 23 4.2 ANALYSIS PROCEDURES ............................................ 23
4.2.1 G-M Detectors .............................................. 24 4.2.2 Ion Chambers ............................................... 24
4.3 RESULTS ............................................................ 25 4.4 PERFORMANCE .................................................... 25 4.5 CONCLUSIONS ................ 1 .................................... 27
5 . BIOLOGICAL SAMPLE PERFORMANCE ..................................... 27 5.1 DESCRlpTION ..................................................... 27 5.2 ANALYSIS PROCEDURES ........................................... 28
5.2.1 Hair Sample Analysis ......................................... 28 . 5.2.2 DoseCalculation ............................................ 29
5.3 RESULTS ......................................................... 30 5.4 CONCLUSIONS .................................................... 31
6 . REFEENCES ............................................................. 33
APPENDIX A Relative Responses for Dosimeters Mounted in Non-Standard Geometries ... 35 DISTRIBUTION ............................................................. 41
iv
...... . . ...-. . . . . -~ . . . . . .... . . . - .?.--.- c . .

Portions of this document may be illegible in electronic image products. are produced from the best available o n g i d document.
LIST OF TABLES
Table
1
2
3
4
5
Performance of HBG and NEU dosimeters on the PNAD phantom ............... 10
Performance of HBG and NEU dosimeters on the FNAD phantom ............... 11
Relative response from dosimeters off-set from phantom ....................... 12
Summary of indium foil measurement data .................................. 26
Results of induced 32P activity in hair samples from the Godiva tests .............. 3 1
V
PERFORMANCE OF THE CEDS ACCIDENT DOSIMETRY SYSTEM AT THE 1995 LOS ALAMOS NATIONAL LABORATORY
NUCLEAR ACCIDENT DOSIMETRY INTERCOMPARISON
K. L. McMahan and L. J. Schwanke'
1. INTRODUCTION
In July 1995, the Los Alamos National Laboratory (LANL) hosted an accident dosimetry intercomparison. This was the first intercomparison of its kind in the United States in 10 years. Previous intercomparisons had been conducted through the Dosimetry Applications Research Group at the Oak Ridge National Laboratory (ORNL). When reactor safety concerns idled all reactors on the Oak Ridge Reservation in 1988, the Health Physics Research Reactor (HPRR), which had been
*, used for 22 previous intercomparisons dating from 1965, was shut down for an indefinite period. Subsequent decisions by the Department of Energy (DOE) to dismantle and store the HPRR reactor core prompted the LANL group, under the sponsorship of the DOE Office of Worker Safety and Hazards Management, to begin characterization of two critical assemblies for dosimetry purposes. As a result, NAD-23 (carrying on the naming convention begun in Oak Ridge) was conceived and many DOE facilities were invited to participate in the intercomparison. Ten facilities accepted the invitation. This report is a summary of the performance of one of the participants, the Centralized External Dosimetry System (CEDS); The CEDS is a cooperative personnel dosimetry arrangement between three DOE sites in Oak Ridge, Tennessee. Representatives of the two major dosimeter processing centers (one at ORNL, the other at the Y-12 Plant) attended NAD-23 and jointly participated in the intercomparison.
A more thorough description of NAD-23 has been compiled by LANL.' The two assemblies characterized and used in the intercomparison were Godiva IV and SHEBA II, located in LANL's TA-5 1. The two were used in a total of seven different configurations to provide participants with a variety of spectra and delivered absorbed doses. The Godiva reactor core is constructed of highly enriched uranium and can be operated to provide a 50-ps burst delivering a neutron dose of up to 200 rads at 3 m. The neutron spectrum from the bare reactor is very similar to that from the HPRR. Three of the HPRR's shields were shipped to LANL and employed in the study: a 20-cm concrete shield, a 12-cm polymethyl methacrylate ( P W ) shield, and a 13-cm steel shield. The shields are described fully in other publications? The solution high-energy burst assembly (SHEBA) uses a liquid fuel and a noncritically-safe geometry to achieve a condition of criticality. The more moderated neutron spectrum provides the capability to simulate accidents involving process liquids. This assembly was used in three different modes: one low- and one high-power run, and one in which the period of the reaction was long and unpredictable. LANL provided reference neutron dosimetry for all irradiations. Gamma dose was not tested in the exercise.
*Y-12 Plant, Lockheed Martin Energy Systems, Inc., Oak Ridge, Tennessee.

2
Between the ten participating programs, seven dosimeter types were tested (some programs collaborated on the testing and reporting of results). Six dosimeters were composed of various combinations of activation foils. The CEDS program was unique in testing a thermoluminescent dosimeter (TLD) system. In addition to the TLDs, the Lockheed Martin security credential was exposed in several of the tests. This credential contains an indium foil used as a method for quick- sorting potentially exposed individuals. Finally, a few samples of human hair were irradiated and later analyzed for sulfur activation from the 32S(n,p)32P reaction. The results from all of the CEDS dosimeters and materials are included in this report. None of the components had been tested in an intercomparison of this type and magnitude, and the procedures for processing the various components were new and untested. The CEDS personnel analyzing the materials had not participated in any of the previous intercomparisons.
Many successes and failures are reported herein. Generally, the TL dosimeters performed poorly and always over-reported the delivered dose. The TLD processing procedures contain errors that would lead to large biases in the reported absorbed dose, and omit several key steps in the TLD reading process. The supralinear behavior of lithium fluoride (LiF) has not been characterized for this particular dosimeter and application (i.e., in high-dose mixed neutrodgamma fields). The use of TLD materials may also be precluded given the limitations of the LiF material itself, the TLD reading system, and the upper dose level to which accident dosimetry systems are required to perform as set forth in DOE regulations. The indium foil results confirm the expected inability of that material to predict the magnitude of the wearer’s dose reliably, although it is quite suitable as a quick-sort material. Biological sample (hair) results were above the minimum detectable activity (MDA) for only one of the tests. Several questions as to the best methods for sample handling and processing remain. Standard operating procedures for calculating dose from biological samples do not currently exist, but were derived from previous preparatory work. Doses calculated from this data, although more promising than the TLD results, indicate that additional work in this area is needed as well.
2. TLD SYSTEM DESCRIPTION
2.1 TLDHARDWARE
The CEDS accident dosimetry system is tasked with meeting the requirements of the Code of Federal Regulations, Title 10, Part 835 (10 CFR 835), “Occupational Radiation Protection.” This regulation incorporates no performance criteria on the accident dosimetry system, simply stating that certain types of dosimeters will be issued to personnel, and that the capability for certain types of biological analyses must be in place. Per 10 CFR 835.1304, accident dosimetry systems must include both fixed nuclear accident dosimeters (F’NADs) and personnel nuclear accident dosimeters (PNADs). The TLD-based portion of the CEDS accident dosimetry system consists of the following major components, each of which is described in succeeding paragraphs:

3
0
0
0
0
0
0
a Harshaw Model 8805 beta-gamma personnel dosimeter, a Harshaw Model 8806 neutron dosimeter, a Harshaw Model 8800 hot-gas TLD reader, neutral-density filters rated for 10% and 1% transmission, a 20 x 20 x 10 cm Lucitem phantom for fixed nuclear accident dosimetry, and a 40 x 40 x 15 cm LuciteTM phantom for simulating the albedo of a human body.
2.1.1 Harshaw Model 8805 Beta-Gamma Personnel Dosimeter
The Harshaw Model 8805 beta-gamma personnel dosimeter (locally abbreviated as an “HBG” dosimeter) is the standard personnel dosimeter issued to employees, subcontractors, and visitors for routine personnel dosimetry. The dosimeter consists of an aluminum card that contains four LiFMg,Ti (LiF) TL elements, and front and back holder pieces.
The aluminum card is composed of two aluminum sheets held together by six small steel rivets. Between the two aluminum sheets are two sheets of a specially treated Teflonm material (the treatment enables the TeflonTM to be transparent to the light emitted from the LiF elements). The LiF elements are inserted between the Teflonm sheets and arranged in the card in an identifiable order. The element positions are numbered 1 through 4 and will be abbreviated El through E4 in the remainder of this report. El, E2, and E3 are 7LiF; E4 is 6LiF. El, E2, and E4 have a thickness of 0.381 mm (0.015 in.); the thickness of E3 is 0.091 mm (0.0036 in.).
The front piece of the 8805 holder has four different filters to aid in dose determination for routine personnel dosimetry. The filter over El is a hemispherical Teflonm button with a (radial) density thickness of lo00 mg/cm2. E2 is filtered by a 0.102 mm (91 mg/cm2) copper filter and a total density thickness (including the 2.3 mm of ABS plastic) of 333 mg/cm2. E3, used primarily for beta dosimetry, is located behind a nominally 5 mg/cm2 aluminized Mylarm filter. Finally, E4 is seated beneath the ABS plastic of the holder with a total density thickness of 300 mg/cm2.
The back piece of the holder has no filters. On the outside are two loops through which a strap with a metal clip is passed so the dosimeter may be attached to clothing. For fixed nuclear accident dosimeters (see phantom descriptions below), the loops have been removed, positioning the dosimeter card slightly closer to the phantom surface to maximize the albedo response.
2.1.2 Harshaw Model 8806 Neutron Dosimeter
The Harshaw Model 8806 neutron personnel dosimeter (locally known as an NEU dosimeter) is issued to selected employees, subcontractors and visitors for routine neutron personnel dosimetry. Similar in physical appearance to the 8805 dosimeter above, the neutron dosimeter consists of an aluminum card that contains four LiFMg,Ti (LiF) TL elements, and front and back holder pieces. El and E4 are 6LiF; E2 and E3 are 7LiF. All four elements have a thickness of 0.015 in.
,

4
The 8806 holder has a single cadmium filter positioned over the front (incident) of El and E2. There are no filters other than the plastic of the holder over E3 and E4. This arrangement gives two pairs of elements, with each similarly filtered pair having one 6LiF and one 7LiF element. This design facilitates gamma subtraction. The back piece of the holder has two molded “loops” through which a belt can be threaded. Monitored personnel are instructed to wear the dosimeter on the belt to ensure optimum and repeatable albedo response. As with the 8805 holders, the loops are removed from those dosimeters that are placed on the fixed nuclear accident dosimetry phantom.
2.1.3 PNAD and FNAD Dosimeters
PNADs and FNADs are required by 10 CFR 835 for reporting dose following unplanned nuclear excursions. CEDS has designated the Harshaw 8805 dosimeter to be the primary PNAD. If a neutron dosimeter had been issued to an individual who was exposed in an accident, dose information from that dosimeter would provide another data point in the dose assessment process.
The FNAD consists of an 8805 and 8806 dosimeter pair affixed to a 20 x 20 x 10 cm PMMA block phantom? The loops on the back of both of the holders have been removed and replaced by ’hook-and-loop fasteners in order to reduce the distance between the phantom surface and the dosimeter cqd, thus increasing the solid angle for albedo neutrons.
2.1.4 Harshaw Model 8800 Hot-Gas TLD Reader
The Harshaw Model 8800 hot-gas TLD reader is an automated TLD processing machine- The unit heats, reads, and stores data for Harshaw’s 8801-series TLD cards (which include the 8805 and 8806 dosimeters described above). The heating mechanism independently heats four streams of nitrogen gas according to a user-definable protocol, and directs the hot gas onto a TLD card positioned above the four gas jets. Above the cqd, an array of four low-noise photomultiplier tubes (PMTs) collects light emitted from the TLs> elements. An optional “cleaning drawer,” which contains an insert plate with four clear lenses, may be installed between the TLD card path and the PMT assembly. The insert plate can be partially withdrawn and the lenses cleaned without powering off the high voltage to the PM tubes. This feature allows users to keep the light collection path cleaner with a minimum of effort.
The reader is controlled through the TLD-REMS software interface. This multipurpose package controls reader operation, calibration and quality control (QC). A partial list of functions of interest in accident-level dosimetry includes the following: (1) the measurement of PMT noise (dark current) and reference light at user-selectable intervals, (2) the capability to reread or halt processing above a given dose level, and (3) an internal database by which pre-exposed QC cards are identified during processing. For the above functions, the user may define upper andor lower limits outside of which the reader will halt and alarm.
‘
In reading accident dosimeters, it is possible to exceed some of the manufacturer’s recommended operating conditions. Generally these are outside the scope of TLD-REMS control.

5
These conditions will be identified and discussed in the appropriate contexts below. For the intercomparison, LANL made one of their 8800 readers available to participants.
2.1.5 Neutral-Density Filters
Neutral-density (ND) filters are glass lenses specially designed to transmit a fixed fraction of light in a given portion of the spectrum. Harshaw supplies ND filters that transmit LiF TL light with factors of 0.1 (lo%), 0.01 (1%) and 0.001 (0.1%). The lenses are incorporated into a four-lens array that replaces the clear lens insert plate on the 8800 cleaning drawer. Lockheed Martin Energy Research Corp. and Lockheed Martin Energy Systems, Inc., purchased and used the 10% and 1 % filters; these were the available options at the time of purchase. A 0.1% filter has since been manufactured.
' 2.1.6 Phantoms
Two phantoms were used in the intercomparison. The first was the standard 40 x 40 x 15 cm PMMA phantom recommended for neutron dosimetry. PNAD dosimeters were attached to this phantom for the intercomparison. The number of dosimeters on a phantom was kept low to reduce crosstalk between dosimeters.
The second phantom used was a 20 x 20 x 10 cm PMMA phantom, which is the standard for CEDS FNADs? The smaller size and weight make it more practical for mounting in criticality control areas, while still providing sufficient mass without significantly reducing the albedo.
Ancillary data were collected to investigate the reduction in albedo response for several non- standard configurations. One and two 1-in.-thick foam blocks were inserted between the dosimeters and the 40 x 40 x 15 cm phantom to simulate the reduction in albedo if the PNAD is not tightly fixed to the torso. Dosimeters were also irradiated in free air to provide worst-case, no-albedo data. Finally, dosimeters were placed on the back of both of the phantoms, simulating the response from a person or a fixed area phantom that was oriented facing away from the event.
2.1.7 TLD Readout Procedures
For the purpose of this exercise, CEDS personnel decided to attempt to follow CEDS TLD readout procedures as closely as possible unless it became obvious that the procedure either simply would not work or would yield unacceptable results. The significant procedures were:
0 CEDS 2-1-75, Rev. 8 Processing Dosimeters
0 CEDS 3-1-505, Rev. 4 Fixed Nuclear Accident Dosimetry 0 CEDS 3-1-500, Rev. 4 Personnel Nuclear Accident Dosimetry

6
CEDS Procedure 2- 1-75 gives instructions for reading dosimeters. collected from personnel for routine, protection-level dosimetry. No special instructions are included for handling and readout of suspected high-dose dosimeters.
CEDS Procedures 3-1-500 and 3-1-505 briefly address the calibration of the 8800 prior to reading accident-level dosimeters. They instruct the user to either install an ND filter set or lower the high voltage. If the former option is chosen, they instruct that the 10% filter set be used for doses suspected to be between 50 and 500 rad, and the 1% filter set be used above that. For the latter option, pre-selected PMT voltages are given. No guidelines are included for the readout process itself. Following the readout, the procedure for executing the PNADXPC code are given. This code could not be used for the LANL test because the PNADXPC program could not be installed on the available laptop computer. Instead, a spreadsheet was set up for dose calculation.
' 2.2 DOSE CALCULATION METHODS
.CEDS Procedures 3-1-500 and CEDS 3-1-505 contain identical equations for calculating the neutron-absorbed dose for HBG and neutron dosimeters. The equations for the dosimeter types are the same for both PNAD and FNAD dosimeters. The dose reporting system for TLDs requires the incident neutron spectrum to be known or inferable from knowledge of the source and nearby shieldinglscattering surfaces, and must be selected from a menu of approximately 120 spectra. A computer program, PNADXPC, was developed to aid in the calculation, tracking and reporting of personnel doses. This program could be used for fixed dosimeters as well, since the correction factors are the same. The sections below contain details of the dose calculation process.
2.2.1 Dose Calculation Equations for the 8805 and 8806 Dosimeters \
CEDS Procedures 3-1-500 and CEDS 3-1-505 give the following as the accident dose calculation equation for the 8805 dosimeter:
r 1
where
Dn = neutron-absorbed dose in rads,
Bi = dosimeter reading of element i in nC,
ECC, = element correction factor for element i,
RCF, = reader calibration factor for element i,
7
B3 x ECC, - RCF, RCF,
B4xECC4 D,, =
scp =
x SCp x SFp ,
SFP
factor converting D20-moderated 252Cf TL response to neutron-absorbed dose, for the plastic-covered elements. This factor is established in calibration laboratory measurements; the procedure assigns a value of 0.102 (but see Section 3.3.2),
factor converting D20-moderated 252Cf TL response to the TL response from the spectrum of interest, for the plastic-covered elements. This value was originally calculated, and is selected from a table of spectra.
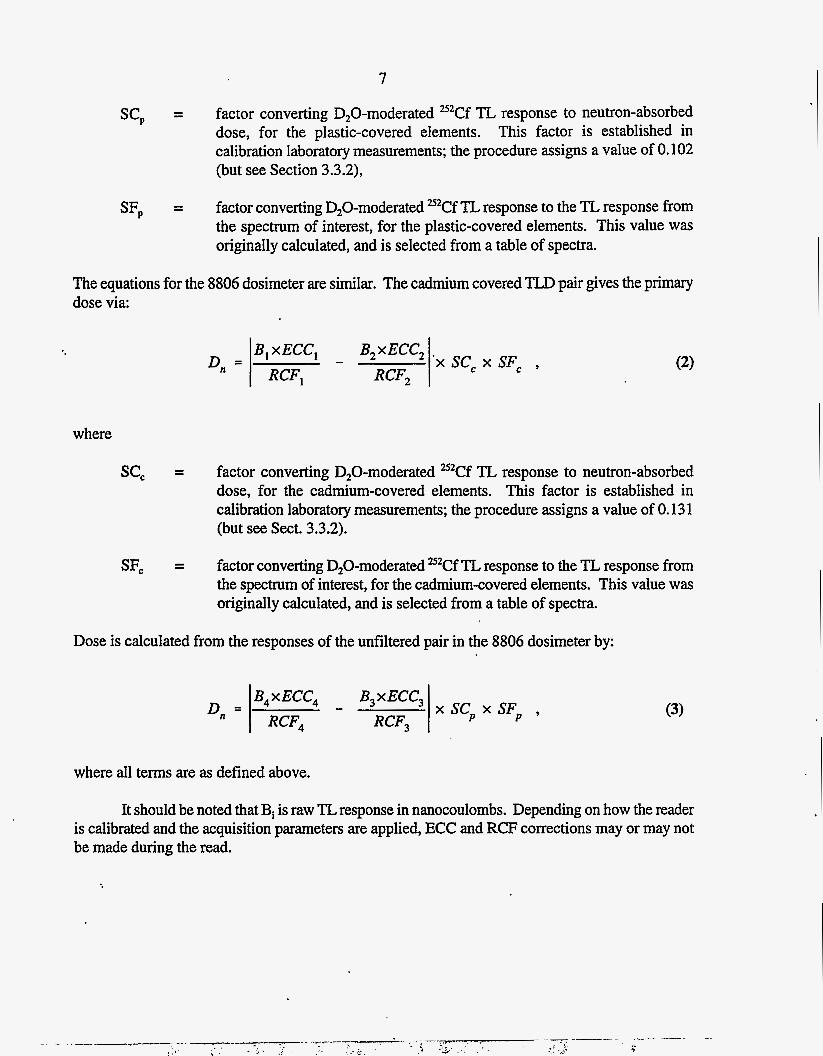
The equations for the 8806 dosimeter are similar. The cadmium covered TLD pair gives the primary dose via:
where
SCC
SFC
D,, = B2 x ECC, - B, x ECC,
RCF, RCF, x SC, x SFc ,
factor converting D,O-moderated 252Cf TL response to neutron-absorbed dose, for the cadmium-covered elements. This factor is established in calibration laboratory measurements; the procedure assigns a value of 0.13 1 (but see Sect. 3.3.2).
factor converting D20-moderated 252Cf TL response to the TL response from the spectrum of interest, for the cadmium-covered elements. This value was originally calculated, and is selected from a table of spectra.
Dose is calculated from the responses of the unfiltered pair in the 8806 dosimeter by:
where all terms are as defined above.
(3)
It should be noted that Bi is raw TL response in nanocoulombs. Depending on how the reader is calibrated and the acquisition parameters are applied, ECC and RCF corrections may or may not be made during the read.

8
2.2.2 Fading Corrections
. For the intercomparison, conditions were generally controlled so that fading corrections were not necessary. Calibration and QC cards had been exposed in Oak Ridge the week prior to the intercomparison and transported to LANL. Thus, the fading on these cards was similar to what CEDS procedures normally require for routine personnel dosimetry. Readout of the accident dosimeters was generally completed between a few hours and 24 h post-exposure. The procedures do not address fading corrections for these dosimeters, so none were made in order to report “per procedure.” However, informal, unpublished studies by CEDS personnel show that, at lower dose levels, short-term fading c-an lead to over-reporting the dose by 18% during the first day and up to 10% on the day following irradiation.
2.2.3 Supralinearity Corrections
The non-linear behavior of LiF for very high gamma doses is well documented in the published literature: However, the linearity of the dose-response curve for neutron irradiation may reasonably be different (as different trapping and luminescence centers may be involved) and are not as well studied. ORNL researchers published some data for supralinearity following =*Cf irradiations and concluded that the material’s response remained linear for neutron irradiation? The current CEDS procedures, based on this data and recommendation, make no correction for supralinearity regardless of the dose. However, there are several questions that should be answered before finally accepting this practice. These are discussed in more detail in Section 3.3.1 of this report.
3. TLD SYSTEM PERFORMANCE
3.1 DOSIMETER PERFORMANCE
The data obtained from NAD-23 will be analyzed in several ways in this section. Reported absorbed doses are compared to the reference doses for both PNADs and FNADs. The off-phantom (Styrofoam offset aid free-in-air) and opposite-side data are presented to show the magnitude of the decrease in signal, as well as changes in element ratios. Additional detail is contained in Appendix A.
3.1.1 PNAD Performance
The primary objective of NAD-23 was to assess absorbed dose to personnel. In the CEDS accident dosimetry system, this is done via the PNAD without reference to or dependence on results from FNAD processing. In each of the seven tests, there were two PNAD dosimeters Hixed directly to the front surface of the phantom. The performance of each of the dosimeters is given in Table 1. The column labeled “HBG dose” is the neutron-absorbed dose reported from the 8805 dosimeter using Eq. (1) above. The column labeled “NEU dose-cadmium” is the neutron absorbed dose
- : ’ J ,
9
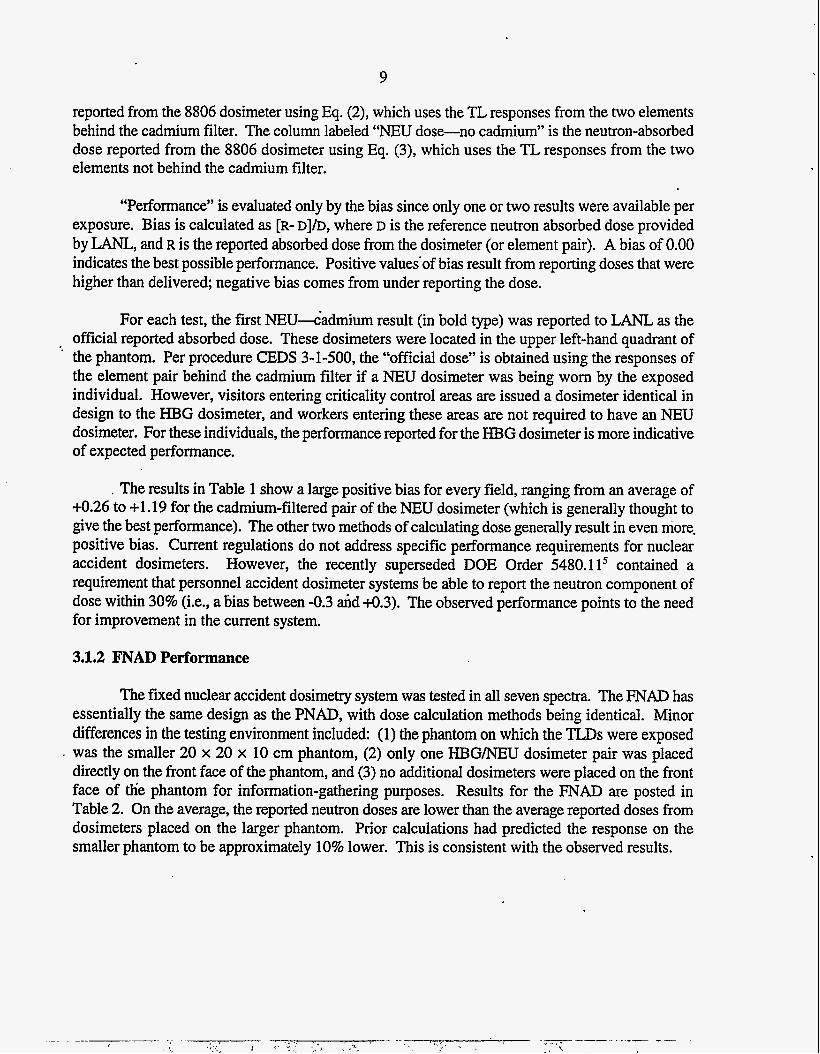
reported from the 8806 dosimeter using Eq. (2), which uses the TL responses from the two elements behind the cadmium filter. The column labeled “NEU dose-no cadmium” is the neutron-absorbed dose reported from the 8806 dosimeter using Eq. (3), which uses the TL responses from the two elements not behind the cadmium filter.
“Performance” is evaluated only by the bias since only one or two results were available per exposure. Bias is calculated as [R- D]/D, where D is the reference neutron absorbed dose provided by LANL, and R is the reported absorbed dose from the dosimeter (or element pair). A bias of 0.00 indicates the best possible performance. Positive values’of bias result from reporting doses that were higher than delivered; negative bias comes from under reporting the dose.
For each test, the first NEU-c*admium result (in bold type) was reported to LANL as the official reported absorbed dose. These dosimeters were located in the upper left-hand quadrant of
‘ the phantom. Per procedure CEDS 3-1-500, the “official dose” is obtained using the responses of the element pair behind the cadmium filter if a NEU dosimeter was being worn by the exposed individual. However, visitors entering criticality control areas are issued a dosimeter identical in design to the HBG dosimeter, and workers entering these areas are not required to have an NEU dosimeter. For these individuals, the performance reported for the HBG dosimeter is more indicative of expected performance.
. The results in Table 1 show a large positive bias for every field, ranging from an average of 4.26 to +1.19 for the cadmium-filtered pair of the NEU dosimeter (which is generally thought to give the best performance). The other two methods of calculating dose generally result in even more- positive bias. Current regulations do not address specific performance requirements for nuclear accident dosimeters. However, the recently superseded DOE Order 5480.1 l5 contained a requirement that personnel accident dosimeter systems be able to report the neutron component of dose within 30% (Le., a bias between -0.3 and 4.3). The observed performance points to the need for improvement in the current system.
3.1.2 FNAD Performance
The fixed nuclear accident dosimetry system was tested in all seven spectra. The FNAD has essentially the same design as the PNAD, with dose calculation methods being identical. Minor differences in the testing environment included (1) the phantom on which the TLDs were exposed
. was the smaller 20 x 20 x 10 cm phantom, (2) only one HBG/NEU dosimeter pair was placed directly on the front face of the phantom, and (3) no additional dosimeters were placed on the front face of the phantom for information-gathering purposes. Results for the FNAD are posted in Table 2. On the average, the reported neutron doses are lower than the average reported doses from dosimeters placed on the larger phantom. Prior calculations had predicted the response on the smaller phantom to be approximately 10% lower. This is consistent with the observed results.

10
Table 1. Performance of HBG and NEU dosimeters on the PNAD phantom ~~
Reactorhest
Godiva IV
Bare
Steel shield
Concrete shield
PMMA shield
SHEBA II
Low power
High power
Long period
Reference, neutron dose
(rad)
200
59
34
26
11
108
I .
94
Reported neutron dose (rad)
HBG dose (bias)
378 (4.89) 400 (+1.00)
73 (4.24) 77 (4.31)
87 (+1.56) 92 (+1.71)
83 (+2.19) 78 (+2.00)
14.6 (-14.33) 14.6 (4.33)
164 (4.52) ,173 (+0.60)
146 (4.55) 138 (+0.47)
NEU dose- cadkum
I (bias)
380 (4.90) 367 (+0.84)
75 (4.27) 74 (+0.25)
6s (+i.ooj 72 (+1.12)
55 (+1.12) 57 (+1.19)
15.0 (N.36) 15.1 (4.37)
182 (+0.69) 184 (4.70)
138 (+0.47) 145 (4.54)
NEU dose- no cadmium
(bias)
437 (+1.19) 376 (4.88)
71 (4.20) 80 (4 .36)
78 (+1.29) 89 (+i.62)
78 (+2.00) .84 (+2.23)
13.5 (+0.23) 14.3 (+0.30)
172 (4.59) 166 (+0.54)
140 (+0.49) 131 (4.39)

11
Table 2. Performance of HBG and NEU dosimeters on the FNAD phantom
Reactorhest
Godiva IV
Bare
Steel shield
Concrete shield
PMMAshield . . .
SHEBA II
Low power
High power
Long period
Reference neutron dose
(rad)
200
59
34
26
11
108
94
Reported neutron dose (rad)
HBG dose (bias)
320 (+0.60)
67 (+0.14)
90 (+1.65)
75 (+1.88)
13.9 (+0.26)
172 (+0.59)
120 (+0.28)
NEU dose- cadmium
(bias)
354 (+0.77)
69 (0.17)
65 (+0.91)
52 (+1.00)
14.8 (+0.35)
152 (+0.41)
119 (+0.27)
NEU dose- no cadmium
(bias)
402 (+1.01)
74 (+0.25)
78 (+1.29)
77 (+1.96)
14.3 (+0.30)
161 (+0.49)
114 (+0.21)

12
Geometry
1 Styrofoam block
2 Styrofoam blocks
Free-in-air
Opposite side
3.1.3 Offset, Free-in-Air and Opposite Side Results
HBGb NEU-cadmium” NEU-no cadmiumd
0.90 f 0.09 0.80 f 0.07 0.82 f 0.09
0.80 f 0.06 0.72 f 0.06 0.76 f 0.06
0.29 2 0.09 0.19 f 0.06 0.29 f 0.10
0.15 f 0.05 0.15 f 0.04 0.14 -c 0.04
As expected, dosimeters placed at fixed distances from the phantom, suspended “free-hair” or attached to the side opposite the incident flux, reported lower doses than those that had been Hixed securely to the front surface. Table 3 summarizes the average reduction in reported dose for each of these geometries.
Table 3. Relative response” from dosimeters off-set from phantom
%BG data is reported from 8805 dosimeter results using Eq. (1). C NEU-cadmium data is reported from 8806 dosimeter results using Eq. (2).
%EU-no cadmium data is reported from 8806 dosimeter results using Eq. (3).
Generally, dosimeters exposed with one interposed Styrofoam block reported doses that were 80-90% of the doses reported by the dosimeters placed directly on the phantom; those mounted on two Styrofoam blocks reported 70-80%. Doses reported by the dosimeters suspended free-in-air were 2040% of the surface-mounted dosimeters. There was a general trend for dosimeters that had been exposed to softer spectra to report a higher fraction of the on-phantom dose for these geometries. Doses reported from the cadmium-shielded pair of the 8806 dosimeter tended to be 5-1096 lower than those reported from the unshielded elements.
Dosimeters exposed on the side opposite the incident flux on the 40 x 40 x 15 cm phantom reported doses that were 10-20% of the doses reported by dosimeters located on the front. Dosimeters exposed to harder spectra tended to report a higher fraction of the front side dose. An unexpected result was observed in that the doses reported by cadmium-filtered elements were virtually the same as those reported by those with no filter. This is curious since the cadmium “filter” is on the back side of the element in this geometry, essentially shielding the element from air-backscattered neutrons behind the phantom. It is not necessarily obvious that the ratios of the

13
calculated correction factors would be valid in this situation (i.e., that the backscattered spectrum plus any contribution from neutrons transported through the PMMA block would yield a cadmium-no cadmium ratio similar to the one expected for perpendicular, front-side irradiation for all of the different spectra for which data were taken).
3.2 OPERATIONAL LESSONS
The LANL intercomparison afforded the first real opportunity to test CEDS Procedures 3-1-500 and 3-1-505 under realistic simulated accident conditions. Many procedural deficiencies (including errors, omissions, and lack of sufficient detail) were identified that need to be addressed programmatically. In some cases the equipment m,ay be ‘pushed beyond the manufacturer’s recommended operating conditions, resulting in unreliable data. This section summarizes the lessons learned and offers solutions where possible.
3.2.1 Signal Reduction Techniques
Lithium fluoride (6LiF) that has been exposed to neutrons typically produces more light per millirad than when it is exposed to an equal dose from gamma rays. Factors of 50 to 100 times higher response are not uncommon for lightly moderated fission spectra. The PMTs in the 8800 TLD reader are designed to detect extremely small quantities of light so that dose measurements in the tens of millirem (gamma) range can be made reliably. The DOELAP testing program tests photon doses up to 500 rads, about 5 orders of magnitude higher than protection level doses, and the reader electronics have been designed to handle this. However, accident-level neutron dosimeters must be capable of making measurements 7 orders of magnitude higher and, given the‘ higher sensitivity to neutrons, the TL light output can be over 9 orders of magnitude greater. This amount of light is beyond the design range of the reader’s electronics! There are several potential modes of failure: (1) the amplified current may be too high, resulting in a clipped signal, (2) the integrated current (which is collected at one point on the W circuit board) could be too large, resulting in loss of data, or (3) either of the above may be large enough that the number of digits to be passed to and stored in TLD-REMS is greater than the maximum size for that database parameter (15 digits in coded format, which is 16,000~ the value to be stored).
Steps must be taken to either reduce the light flux on the ?MT or to decrease the signal amplification. Failure to do so could result in loss of data or, worse, damage to the PMT or electronics. To achieve the desired reduction in signal, two options are procedurally available to the operator. The operator may install an ND filter set or lower the bias voltage on the PMT. For the former option, there are two ND filter sets to choose from (see the description in Section 2.1.5, “Neutral-Density Filters”). For the latter, the operator must decide how far to lower the voltage.
If the chosen filter set or bias voltage does not reduce the light flux enough, operating parameters may still be exceeded. In this case, the signal could be clipped, resulting in a loss of usable data. However, if light transmission is reduced too much, the signal from which dose is to be calculated could be too weak to produce reliable dose estimates. Therefore, if TLDs are to be

14
used to estimate the neutron dose, it is necessary to have a good idea of the range of signals to be expected prior to processing.
There are several items in this area for which the procedure is deficient:
(3)
(4)
No guidance is given for choosing between using the ND filters and lowering the HV.
The selection of the appropriate ND filter set is based on a probable dose (determined by others), not on signal. Since it is already assumed that the spectrum is known (else dose could not be calculated), it is possible to project the anticipated signal. This calculation could be used to better select the appropriate filter set. During the LANL tests, though, it was more practical to simply use the 1% set for all of the measurements.
Installation instructions for the ND filters are not given. It is important that the HV be powered off while exchanging the filter plates. Failure to do so could result in damage to the PMT.
The option for lowering the HV is addressed only in a brief note. The note is applicable to 8806 neutron cards (since the voltages for elements 1 .and 4 are lowered more than those for elements 2 and 3), but this is not stated. Some recommended voltages are given, but it would be preferable to have voltage curves for each PMT on file and for the operator to be instructed how to use them to achieve the desired reduction.
No guidance is given on what to do if several dosimeters are received, each with a different anticipated dose level requiring different amounts of signal reduction.
The procedure does not address the need to keep the reader in the configuration in which dosimeters were processed. It will, no doubt, be desired to further characterize the reader@) after the emergency dosimeters are processed. Operators should be iptructed to leave the readers in the configuration in which they were used. This implies that each reader should only be used in one configuration. If more than two readers will be needed to process all the dosimeters, the backup processing laboratory should be called into service.
3.2.2 PMT Noise Behavior
PMT noise, also known as dark current, is the electronic signal that .is collected when no dosimeter is present. This parameter is checked daily for all PMT assemblies with the electronics QC function, and is monitored every ten cards during routine dosimeter processing. Under normal operating conditions, the PMT noise is a negligible fraction of the total signal and does not greatly impact the calculated dose.
.
15
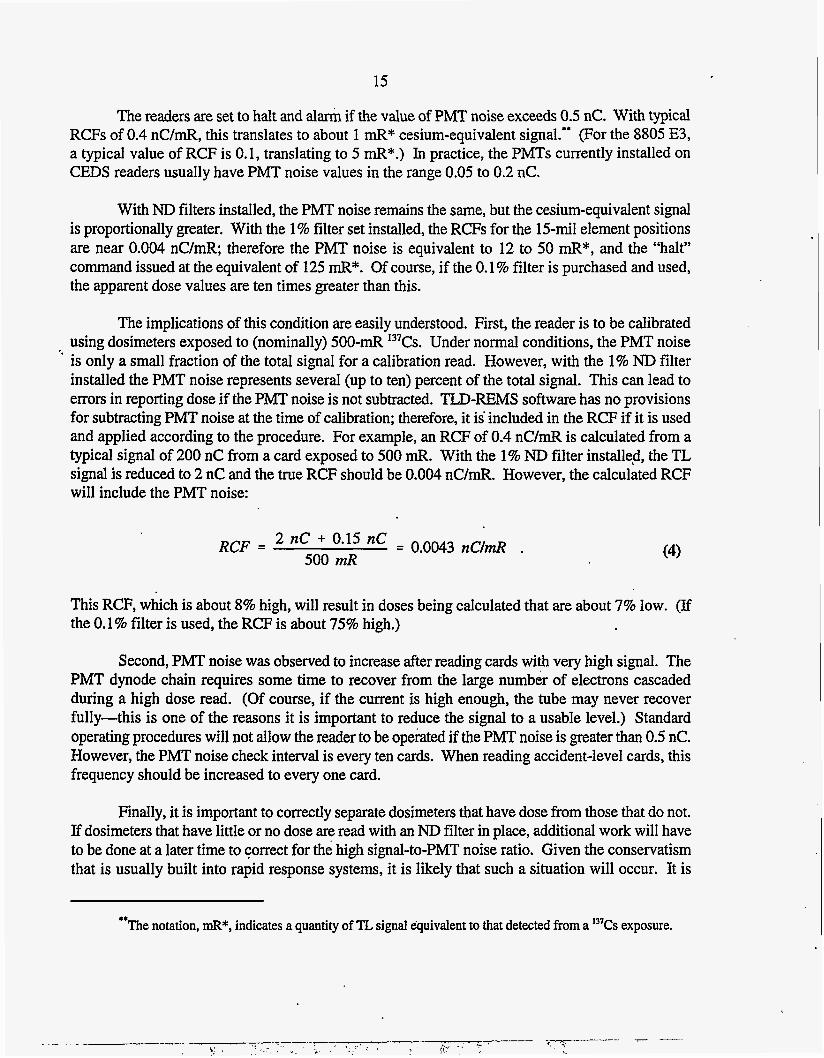
The readers are set to halt and alarh if the value of PMT noise exceeds 0.5 nC. With typical RCFs of 0.4 nC/mR, this translates to about 1 mR* cesium-equivalent signal." (For the 8805 E3, a typical value of RCF is 0.1, translating to 5 mR*.) In practice, the PMTs currently installed on CEDS readers usually have PMT noise values in the range 0.05 to 0.2 nC.
With ND filters installed, the PMT noise remains the same, but the cesium-equivalent signal is proportionally greater. With the 1 % filter set installed, the RCFs for the 15-mil element positions are near 0.004 nC/mR; therefore the PMT noise is equivalent to 12 to 50 mR*, and the "halt" command issued at the equivalent of 125 mR*. Of course, if the 0.1 % filter is purchased and used, the apparent dose values are ten times greater than this.
The implications of this condition are easily understood. First, the reader is to be calibrated using dosimeters exposed to (nominally) 500-mR 137Cs. Under normal conditions, the PMT noise
' is only a small fraction of the total signal for a calibration read. However, with the 1% ND filter installed the PMT noise represents several (up to ten) percent of the total signal. This can lead to errors in reporting dose if the PMT noise is not subtracted. TLD-REMS software has no provisions for subtracting PMT noise at the time of calibration; therefore, it is included in the RCF if it is used and applied according to the procedure. For example, an RCF of 0.4 nC/mR is calculated from a typical signal of 200 nC from a card exposed to 500 mR. With the 1% ND filter installed, the TL signal is reduced to 2 nC and the true RCF should be 0.004 nC/mR. However, the calculated RCF will include the PMT noise:
This RCF, which is about 8% high, will result in doses being calculated that are about 7% low. (If the 0.1 % filter is used, the RCF is about 75% high.)
Second, PMT noise was observed to increase after reading cards with very high signal. The PMT dynode chain requires some time to recover from the large number of electrons cascaded during a high dose read. (Of course, if the current is high enough, the tube may never recover fully-this is one of the reasons it is important to reduce the signal to a usable level.) Standard operating procedures will not allow the reader to be operated if the PMT noise is greater than 0.5 nC. However, the PMT noise check interval is every ten cards. When reading accident-level cards, this frequency should be increased to every one card.
Finally, it is important to correctly separate dosimeters that have dose from those that do not. If dosimeters that have little or no dose are read with an ND filter in place, additional work will have to be done at a later time to correct for the high signal-to-PMT noise ratio. Given the conservatism that is usually built into rapid response systems, it is likely that such a situation will occur. It is
I
.* The notation, mR*, indicates a quantity of "I, signal e'quivalent to that detected from a '"Cs exposure.

likely that professional judgement would have to be used to calculate the doses in this instance. The procedure could be expanded to include this as a follow-up item. , ,
3.2.3 Reference Light Range
Reference lights are small quantities of I4C incorporated into a scintillating matrix. The material is loaded into a TLD-card-like array and installed permanently in the TLD reader. I The reference lights provide a constant, repeatable source of light, and are used to check the operation of the reader at user-selectable intervals. During routine processing, reference light readings are acquired every ten cards. Upper and lower boundaries are preset parameters in TLD-REMS; the reader will halt and alarm if the reference light reading falls outside this acceptable range. The “acceptable range” is procedurally defined as ~ 1 0 % of the average value.
When reading accident-level dosimeters with either the ND filters installed or the HV lowered, the signal from the reference lights is reduced by a corresponding amount. The procedure does not address this condition. The signal from a given reference light is typically in the range of several hundred nanocoulombs. With the 1% ND filter installed, the signal is reduced to a few nanocoulombs. Several points need to be addressedmd incorporated into the procedure.
.First, bbviously, the reference light range in TLD-REMS must be lowered to account for the expected reduction in signal. (This assumes, of course, that the user will desire to collect reference light data during the reading of accident dosimeters.) The procedure should give instructions for doing this: how many, if any, reference light readings should be taken to establish an average,. reminders to change the parameters in both the “acquisition setup” and “electronics QC parameters” modules, etc.
Second, the upper- and lower-range values in TLD-REMS are limited to the nearest whole number of nanocoulombs. For the 1 % filter, then, the range will be quite wide on a percentage basis. For example, typical reference light values for Readers 22,44, and 55 are 400 nC, giving nominal operating ranges with no ND filter between 360 and 440 nC. With the 1% filter installed, the range would be 3.6 to 4.4. But since decimal values may not be entered into TL;D-REMS, the range must be set to 3 to 5, which allows 25% variation instead of the normal 10%. For Reader 11’s reference light set, the typical output is 200 nC. With the 1% filter installed, the range would have to be set to 1 to 3 (60%), making the usefulness of the check questionable.
3.2.4 QC Cards
The current procedures require QC cards to be interspersed approximately every 25 cards during a “read for dose.” These QC cards are exposed to 250-mR 137Cs and are required to fade for 5 to 9 d post-exposure. The 8800 readers are able to recognize QC cads, apply RCF and ECC values, and analyze the signal on-line, and will halt and alarm the reader if the reading falls outside preset limits. The limits are established as *lo% of the expected signal (which is slightly higher than 250 mR to allow for background and PMT noise, which is not automatically subtracted).

17
With the 1% ND filters installed, the signal is reduced enough that the normal operating limits for QC cards are not applicable. The signal from a card exposed to 250 mR* with these filters installed is approximately 1 nC. If the PMT noise is nominally 0.15 nC, the internally calculated milliroentgen value likely already exceeds the upper control limit. If, fortuitously, the PMT noise is low (say, 0.05 nC) for a particular reader, the mean has still been effectively shifted upward and it is more likely that a QC chd will fail. The setup procedure either needs to include a method for resetting the QC card limits to allow for this condition, or incorporate a rapid high-dose exposure from the calibration facility.
Additionally, the procedure should be amended to insert QC cards between each field card, instead of placing one every 25 cards, at least for cards expected to have a very high signal. This will give greater confidence that the reader remains within control limits, and will give the PMT additional time to recover between high dose reads.
3.2.5 Activated Dosimeter Components
The operational lessons that have been reported to this point all relate to the readout process. Another topic to be considered is that the dosimeter cards and holders themselves were found to be activated. This was true in all of the LAHL tests. We measured the count rates on two of the shots (the unshielded Godiva burst and the SHEBA high power test), but discontinued this for later tests because of time constraints. In general, the front piece of the 8805 holder was most activated, the card itself was next, the front of the 8806 holder was third and the back holder piece was lowest.
The 8805 holder front piece contains a copper filter, which is undoubtedly the most activated component of that piece. Copper-63 has a 69.1% natural abundance. Its thermal neutron capture cross section, a, , is 4.5 b; the product half-life is 12.8 h. Nickel-63 (T% = 92 years) is also produced from 63Cu via an (n,p) reaction with a threshold of 1 MeV, but the p emitted is very weak (E- = 67 keV) and, therefore, the total detection efficiency is low. The stable "Cu isotope has an abundance of 30.9% and a, = 2.3 b. The contribution from its activation product ,66Cu (T% = 5.1 min), would have been negligible since usually at least an hour had elapsed before the participants handled the dosimeters. For the bare Godiva test, a Geiger-Muller (G-M) pancake probe held on contact with the inside of one of the front pieces read over 12,000 cpm about 2 h after the burst. The outside of this same front piece read 450 cpm (about background). The 242 mg/cm2 of ABS plastic covering the copper filter from the front side of the holder therefore effectively shields the 0.57 MeV (max) p energy from @Cu. In the SHEBA high-power test, the inside of the front holder piece read approximately 4000 cpm (10 h after the exposure), with the outside again reading at background levels.
The activity remaining in the copper foil might be used to advantage in screening Potentially exposed personnel under certain conditions. This area is undeveloped at this time, but may warrant additional attention.

18
The dosimeter cards were activated to a lesser degree than the holder front pieces. The activated element(s) is unknown. On the Godiva test, the 8806 dosimeter cards were slightly higher in activity than the 8805 cards; this difference was not observed for the SHEBA test. Induced activity measured for the bare Godiva burst was about 4000 cpm on the 8805 cards and about 6000 cpm on the 8806 cards. For the SHEBA high-power test, the card activities were just a few hundred counts per minute above background.
The front pieces of the 8806 dosimeters were activated slightly. The only filter on this piece is the cadmium filter. Cadmium is composed of .a half-dozen or so naturally occurring isotopes. The most likely activation products are "'Cd (T, = 54 h) and 'I7Cd (T, = 2.4 h). The net count rates on contact with the inside of the 'front pieces was about 3500 cpm for the Godiva test and about . 600 cpm for SHEBA. The count rates on the outside of the front pieces was for both tests about half of this.
An operational item that is not specifically addressed in the procedure is the handling of contaminated dosimeters. Processing center personnel should be aware that, as a result of activated dosimeter components, some returned dosimeters may be identified as contaminated when in fact they are not. It is recommended that procedures be developed for further screening of the dosimeters at the processing laboratory. .
3.3 DOSE INTIIRPRETATION LESSONS
Many factors likely contributed to the poor performance of the dosimeter in the LANL tests. - The major sources of error are identified and discussed in this section.
3.3.1 Lithium Fluoride Supralinearity
The dose-response characteristics of LiF:Mg,Ti have been reported in a number of publications."~ 7* * Its linear behavior is, of course, one of the properties that make this material so desirable for personnel dosimetry. However, all authors report a supralinear response for gamma irradiation above lb rads. The Harshaw algorithm for the 8805 dosimeter applies a correction for supralinear response from 100 to 1000 rads; correction equations are not given above this dose. Generally the supralinearity is attributed to specific types of lattice defects, and is a property associated with individual peaks. Authors who have published results above the kilorad region have observed a point of saturation of the material (peak 5 ) at approximately 105-rads gamma.
'
Very little published data was found concerning the dose-response characteristics of LiF:Mg,Ti to neutron radiation. It has been observed that the distribution of electrons into various traps following neutron irradiation is different from that following gamma irradiation. However, the effect of this different distribution on the dose response curve is not well-documented. One local study was conducted using a z2Cf source, but in order to deliver doses in the range where supralinear effects might be expected (based on the response curve for gamma irradiation), the irradiation times were long and it is likely that inaccuracies were introduced due to short-term fading effects.

19 ' Subsequent irradiations have been conducted at LANL, but the results are still being analyzed and
will be reported in a separate document.
If found, supralinearity following high-dose neutron irradiation has two potential impacts on the accident dosimetry program. First, since it is expected that LiF will saturate at some point (as will all TL materials since the number of trapping centers is finite), supralinear behavior effectively shifts downward the useful dose range. Since this range is already shifted downward at least two orders of magnitude due to the over response compared to gamma irradiation, it will be important to understand the limitations with respect to neutrons. Second, an equation would be needed in order to correct for the effect. Studies would need to be conducted to determine how dependent the effect is on the incident spectrum, or whether the correction should be made on raw signal (cesium- equivalent mR*).
' 3.3.2 Incorrect Factor in Dose Calculation Equations
The dose calculation equations given in CEDS Procedures 3-1-500 and 3-1-505 [and repeated above as Eqs. (1) through (3)] have factors that should convert the cesium-equivalent mR response to the absorbed dose that would be reported if the source was 252Cf-moderated by 15 cm of D20. These' factors are given the symbols SC, and SC,, for'the. cadmium- and plastic-filtered elements, respectively. Values of SC, = 0.13 1 and SC, = 0.102 are assigned. However, the constants 0.13 1 and 0.102 are appropriate for converting the cesium-equivalent response to dose equivalent, not absorbed dose. The constants must be reduced by a factor of 10.3, which is the ratio of the spectrum- averaged fluence-to-absorbed-dose factor and the spectrum-averaged fluence-to-dose-equivalent factor for the D2O-moderatedz2Cf source. This results in revised values of SC, = 0.0134 and SC, =. 0.0105. The procedures must be revised to reflect these changes, as accident-level doses should be reported in units of absorbed dose.
3.3.3 Single-Point Calibration
A final consideration for this section is the current requirement for calibration at a single point. Reader calibration is routinely accomplished at 500 mR* using a 137Cs source. The protocol for accident dosimetry does not change this requirement because calibration cards exposed at this level are always available at the processing centers. Routine dosimetry procedures require the calibration cards to be held in reserve for a period of 5 to 9 d following irradiation in order to minimize the effects of short-term fading. Fading effects are observed because of the specific annealing and readout techniques used in order to maximize card throughput for routine dosimetry operations.
Consideration should be given to changing this practice for reading dosimeters that have been potentially exposed to accident-level doses, in order to calibrate the reader@) at a dose closer to the expected range of exposure. A coordinated effort would need to be developed with the local calibration facility in order to provide these exposures on a rapid-response basis. Work could be done to either (1) develop an alternate annealing procedure that minimizes the production of low-

20
energy traps, or (2) develop readout techniques that minimize the incorporation of the low- temperature portion of the curve into the integrated signal. In either case, additional corrections would likely need to be made to interface the resulting calibration with the field cards that would still receive the normal heating treatments.
Finally, consideration should also be given to developing post-read techniques for characterizing the reader in thebrange observed for the field cards. It should be a standard practice to keep the reader in the configuration in which the cards were processed, especially if the high voltage is adjusted, so that additional measurements can be made following the initial reporting of dose to emergency coordinators. These follow-up measurements, which typically use dosimeters exposed to a series of doses that bracket the dose(@ of interest, would serve to provide a refined dose estimate for later comparisons.
’ 3.3.4 Gamma Dose Calculation
The current procedures address only the calculation of dose from the neutron portion of the accident field. Gamma dose can be a significant contributor to the total dose in many accident scenarios. The 8805 dosimeter algorithm gives corrections for gamma supralinearity up to a dose of 1000 rads. The DOELAP performance testing program provides gamma irradiations up to 500 rads. However, it is recommended that accident dosimetry systems be able to report gamma dose up to 10,000 rads. The supralinear gamma response of the 8805 dosimeter in this region has not been tested. It is likely, based on published reports for LiF in general, that Harshaw’s linearity correction equation will not hold for doses an order of magnitude higher. It is therefore necessary to obtain a series of irradiations from a suitable facility in order to develop the gamma dose portion of the TLD’s capabilities.
3.3.5 Miscellaneous Dose Calculation Findings
The procedures for accident dosimetry are very general in several areas where an added level of detail could be advantageous. It is recognized that, under true accident conditions, the system needs to be quite flexible so that knowledgeable personnel can make reasonable decisions without undue constraints. However, in the midst of responding to an’accident, the procedures should help operators obtain results without unnecessary confusion.
In the three dose calculation equations given in Section 2.2.1, terms are included for ECC and RCF values in addition to the raw signal (in nanocoulombs) from the reader. The operator should understand that the “raw” data in the file may already be corrected for RCF and/or ECC. The corrections applied by the reader depend on the calibration options that were selected on ‘the acquisition setup screen. For 8805 dosimeters it is standard procedure to correct for “RCF Only,” while for neutron dosimeters the setup is for “RCF and ECC” correction. The instructions should ensure the operator is aware of these conditions. Additionally, if ECCs must be applied “by hand,” operators should be instructed to obtain the most recent ECC value from the CEDS database. In the
~. , .. . .-
21
event that the CEDS database is not accessible, alternate methods of obtaining ECC values may need to be used, and the instructions should address this possibility.
3.4 SUMMARY OF TLD SYSTEM PERFORMANCE
Due to the number of observations made as a result of the LANL intercomparison, the items discussed above are given in abbreviated format here.
1.
2.
3.
4.
- 5.
6.
7.
8.
9.
10.
11.
12.
All TLbased dosimeters (PNAD and FNAD, 8805 and 8806) reported dose with significant positive bias in all test fields.
Dose reported from dosimeters in nonstandard geometry was predictably lower than dose reported in the standard geometries.
Current procedures do not give guidance on when to use ND filters and when to lower high voltage, although both options are available to the operator.
The selection of the appropriate ND filter set to use is based on expected dose. It should be based on expected signal.
Installation instructions for the ND filters are not given.
No consideration is given to how to handle dosimeters returned with a range of probable doses.
Procedure do not stress the importance of “freezing” the reader in the configuration in which it was used to determine dose.
The program has not addressed post-readout actions needed to refine the dose estimate.
PMT noise becomes a significant fraction of the total signal obtained during calibration or QC card readings when the light transmission is reduced to 1 % or less.
Instructions for resetting PMT and reference light frequencies and control limits are not included in the procedures.
The effectiveness of reference light data is reduced with light transmission of 1 % or less due to digit limitations in TLD-REMS. c
Dose delivered to QC cards and the placement frequency should be increased when reading accident field cards.

22
13.
14.
15.
16.
17.
18.
Dosimeter components can be activated during the nuclear excursion. The proper handling of these pieces is not addressed in the procedures.
Lithium fluoride dose-response for neutron fields is not well characterized. Its supralinear response to gamma radiation at doses exceeding 1000 rads should also be studied further.
TLD-600 response is highly dependent on the thermal component of the neutron spectrum. Even in these well-controlled irradiations, the models did not accurately predict absorbed dose.
The values given in the procedures to correct ‘37Cs-equivalent response to 252Cf @,O-moderated) absorbed dose are incorrect.
Lithium fluoride may saturate below dose levels required to be measured for personnel accident dosimetry.
The gamma component of dose is not addressed adequately in the procedure. Additional development work is required in this area.
3.5 DISCUSSION AND CONCLUSIONS .
The LANL accident ‘.dosimetry intercomparison gave participants from CEDS the first opportunity to exercise the TLD-based accident dosimeter under realistic accident conditions.
. Results were highly biased in the positive direction for all test fields. Many pitfalls were identified that must be addressed if it is decided to pursue the TLD-based accident dosimetry system.
Perhaps fhe most discouraging aspect of the results was the poor performance in fields that are relatively well known. The CEDS system is based on the ability to accurately select the appropriate spectrum from a menu of responses expected for published spectra. The factors given in the menu do not incorporate corrections for scatter, angular orientation, distance from the body (albedo) surface, or other thermalizing influences. The LANL tests were also “ideal” in that the irradiation conditions matched the conditions under which the factors were developed as closely as can be conceived. Yet, the calculated results were far from the delivered reference doses.
The major negative factors influencing the performance of the TLD-based accident dosimetry system are undoubtedly the material’s extreme sensitivity .to the thermal component of the neutron spectrum (and the great variability of this component with relatively minor perturbations in the industrial workplace), and’the unknown behavior of the material to high neutron dose, which will require an extensive development effort to characterize (with no guarantee of success since reader systems or the material itself may “saturate”).
The recommendations leading to the decision to use TLD as the accident dosimeter were based on certain assumptions and experiences. The original recommendation was to use both the
n

23
beta-gamma and the neutron dosimeter as the PNAD. The advantages given included cost, convenience, and good performance in previous NAD intercomparison studies at the HPM.*** The primary disadvantage cited was that the TLD yielded no information about the incident spectrum. CEDS subsequently decided to use only the beta-gamma dosimeter as the PNAD? Potential limitations'of the TL material and reader electronics were not considered. The susceptibility of the TLD-based system to errors due to scattering from nearby surfaces was mentioned but has not been formally investigated.
Many items must be addressed in order to determine whether the TLD-based system is able to give a response that is reliable and well-documented. There is no assurance that even in best of circumstances the system will be able to produce neutron doses that can be used with confidence to triage personnel that have been potentially exposed to accident-level doses. It is therefore recommended that several other options for accident dosimetry be.pursued in parallel, and that much
' additional critical scrutiny be given this option before further resources are dedicated to its development. Regardless of the decisions for neutron dosimetry, however, the gamma dosimetry portion of the program will likely remain TLD-based. Additional development is required in this area.
4. INDIUM FOIL ANALYSIS
4.1 DESCRIPTION
The indium foil incorporated in the security credential is intended to serve as a quick-sort device to identify personnel that may have been significantly exposed in a criticality accident?." The induced activity includes several isotopes produced from thermal neutron capture in the naturally occurring isotope, '"In (95% natural abundance). However, only one isotope, 116m11n, survives long enough to be useful for sorting purposes. This isotope has a half-life of 54 min; the others are on the order of seconds to 2 or 3 min. Another product, "5mJn, is produced via an (n, n') reaction and has a 4.5-h half-life.
$
4.2 ANALYSIS PROCEDURES
The three Oak Ridge sites each have separate procedures for evaluating indium foil data, corresponding to the portable instrumentation that each site includes in their emergency response
*** Published documents summarizing accident dosimetry intercomparison results do not provide sufficient detail to analyze the good performance of others' TLD-based systems. Since TLD gives a reproducible and predictable response, it could be that participants "calibrated" their systems to the configuration of interest and derived correction factors that were applied in subsequent intercomparisons; or theTLD-based results could have been corrected using other data collected simultaneously. If either of these is true, the good performance reported in previous intercomparisons is exaggerated and is no indicator of the potential performance under actual accident conditions.

24
kits. The Oak Ridge National Laboratory uses pancake and, more rarely, side-window G-M detectors. The Y-12 Plant uses Keithley 36100 ion chambers. The K-25 site uses a pancake G-M detector. One of each of these instruments was shipped to Los Alamos for use in the intercomparison. An Eberline RO-2 ion chamber was also included for comparison only. The appropriate site’s procedures were followed for measurements taken with each instrument. The Eberline RO-2 ion chamber readings were taken using the same techniques as the Keithley 36 100 ion chamber. The following sections describe the data analysis procedures for each of the detectors using the three different screening techniques.
4.2.1 G-M Detectors
O W RSS Procedure 02-346-02 uses indium foil and body (blood) sodium activation data as simple screening tools. G-M detwtor readings &e “interpreted” using a graph of reading versus
’ time since exposure. The procedure does not state whether the side-window reading is to be taken with the shield open or closed; the technical basis document, however, does state that the cover should be open. Measurements at LANL were made in both geometries. Potentially exposed persons are categorized by “action levels,” which are intended to provide a means for identifying individuds who may have been exposed significantly. Personnel are separated into three groups corresponding to low (c-2 rad), medium and high (>-25 rad) exposures. The “doses” generally were determined using conservative assumptions.
K-25 RCO Field Instruction 95-RCO-027 describes the actions to be taken to identify individuals that may have been exposed significantly following a nuclear accident. Similar to the ORNL procedure, indium foil readings are evaluated using a graph that categorizes the G-M reading into one of three-action levels. The graph is different from O m s , with ‘the action level demarcations being about a factor of three lower than on the ORNL pancake G-M graph.
4.2.2 Ion Chambers
The Y-12 Plant Radiation Safety Emergency Response Team instructions describe tbe technique for screening personnel with Keithley 36 100 ion chamber indium foil activation measurements. Readings for the LANL tests were taken with the cap off, as prescribed in Y112 Plant Emergency Procedure 40- 100. The instructions contain equations for calculating an “estimated” absorbed dose from a Keithley 36100 ion chamber reading. Personnel are then categorized into three groups, corresponding to low ( 4 5 rad), medium (25-100 rad), and high (>lo0 rad) exposure, based upon the estimated dose received.
There are two steps involved when utilizing indium foil readings in the dose calculation process: (1) use of an equation to determine the appropriate decay factor based on the time post accident, and (2) use of a second equation to calculate the dose. Both of these equations were derived by performing a regression analysis on the data provided in graphical form in the Y-12 Radiation Safety Emergency Response Team instructions. The decay correction equation is:

25 . I
fie = f i o b s x [0.980541 +21.915f+4.44997t2 +4280.631t3 -23057.1t4 + 11651 1.8r5] , (5)
where be is the corrected dose rate in mrad/h, Bob>s the observed dose rate (mrad/h) f days since the incident. The dose prediction equation is:
, (6) - 10 10.589492 +0.91318710g(d,) +0.16O481 log(d:) -0.1213 1 log(dZ) + O.O4172210g(d,4) -O.O053710g(d~)] mad) -
.where fi is the corrected dose rate in mrad/h and D is the actual dose in rad.
4.3 RESULTS
c
Security credentials with indium foils were exposed in five of the seven LANL tests. Measurement data are presented in Table 4 for each of the four instruments. (ND indicates “not detectable.”)
4.4 PERFORMANCE
The indium foil measurement data were evaluated using the sites’ respective procedures. All of the LANL tests delivered doses greater than 25 rads. ORNL and K-25 procedures for the G-M type instruments always correctly identified all exposed foils as above the highest action level (>25 rads). Had personnel been wearing those foils in an actual accident, the technique would have properly segregated the more highly exposed persons. The Y-12 technique placed all exposed foils in the highest exposure category (>lo0 rads) even though the delivered absorbed doses for three of the five tests were between 25 and 100 rads. The Y-12 technique would have segregated personnel into the highest exposure category which is a conservative error for the exposed individual’s well- being but may result in unnecessary concern.
Since the delivered absorbed doses were all greater than 25 rads, lower-level classification categories were not tested. For ORNL and K-25 this included the two lowest exposure categories (c2 rads and 2-25 rads), and for Y-12, its lowest exposure category (e25 rads). To simulate the expected performance at lower dose levels, the (ORNL/K-25) G-M data were adjusted linearly to what “would have” been detected if the exposure had been 25 rads in each of the test fields. That is, the count rate data were adjusted downward by:

26
Reactor: shield
Godiva: bare
Godiva: concrete
Godiva: PMMA
S H E B A high power
S H E B A long period
Table 4.- Summary of indium foil measurement data
Exposure dateltime
611 3/95 @ 0559
6/14/95 @ 0613
6/15/95 @ 0542
6/12/95 @ 2339
6/14/95 @ 2315
Read dateltime
6/13/95 @ 0750
0848
0916
0950
1024
1304
6/14/95 @ 0754
6/14/95 @ 0820
6/15/95 @ 0742
0822
6/13/95 @ 0943
6/15/95 @ 0035
0133
0738
Pancake G-M (cpm)
Off scale
330,000
260,000
220,000
160,000
28,000
430,000
370,000
340,000
250,000
1,700
Off scale
400,000
700
Side window G-M (cpm)
120,000
1 10,000
60,000
40,000
30,000
4,500
90,000
90,000
85,000
55,000
360
220,000 , .
800
53
28
17.5
11
7
ND
35.5
25
22.5
13
ND
53.3
0.7
75
34
25
18
11
1.4
45
34
30
18
0.2
70
ND

27
where RZ is the expected count rate for a 25-rad exposure, R,, is the observed count rate, and D is the reference dose in rads. (This is a rough estimate, since dead time was likely a factor in the higher (>16 cpm) data. However, adjusting linearly gives a lower value for the expected count rate than what would actually be observed.) In all cases but one the adjusted indium foil data would have placed the person in the highest priority (>25 rads) category. The exception was for the long-period SHEBA test, where the adjusted foil reading at 8 hours post-shutdown would have placed a person in the middle priority category. The adjusted count rate at 25 rads for the “successfully-classified” foils was found to be up to a factor of six higher than the count rate predicted using the procedure’s graphs.
Results obtained using the Y-12 dose calculation equations produced more conservative doses. The calculated doses for all on-scale readings at all times post-exposure exceeded reference doses by factors ranging from 5 to over 20 for the tested spectra. Only one data point was taken with
’ the cap on; the ratio of the reading with the cap off to that with the cap on was 3.3. This practice would obviously reduce the bias, but would also increase the lower detectable reading by a corresponding amount.
4.5 CONCLUSIONS
All three sites’ screening techniques were successful in identifying exposed indium foils up to four hours post-exposure. There is, of course, a tendency to try to estimate dose from the indium foil data. This practice is discouraged since the data demonstrate that reliable dose estimates are not . ,obtainable within a factor of five for any of the types of instruments tested. The tendency is towards over-estimation of the dose, which may lead to unnecessary concern on the part of the exposed individual and over-aggressive medical attention. These tests do, however, confm the policy at all sites of restricting the use of indium foil data to simple “go, no-go” indicators for the purpose of identifying persons for whom more detailed dose assessments are indicated.
Finally, system limitations (such as the lower reportable dose or upper usable range) as a function of time should be investigated by all programs. A combination of G-M and ion chamber instruments may prove more beneficial than either type kone.
5. BIOLOGICAL SAMPLE PERFORMANCE
5.1 DESCRIPTION
Biological materials are generally agreed to be among the best indicators of absorbed dose immediately following a nuclear accident.” The media usually collected for analysis are blood and hair, which are readily available in usually sufficient quantity for analytical purposes.
The component of blood that is most useful for dose estimation is the element sodium. Blood sodium concentration is very tightly controlled by the body to within about S%. The normal

28
concentration is approximately 145 f 4 mmol/L blood serum, which is equivalent to 1.91-mg NdmL whole blood or 3.33-mg NdmL plasma. Accurate measurement of the volume of the blood sample, then, leads to a very reliable value for the total mass of sodium, which is important to the overall calculation of dose. Sodium-23, a stable isotope of sodium .with a 100% natural abundance, is activated by thermal neutron capture with a cross section of about 1 barn. Post-accident analysis of blood for 24Na y rays, combined with appropriate assumptions for the incident spectrum, can yield fairly reliable dose estimates.12
Sulfur is excreted in human hair at the rate of about 7 mg/day; the average concentration is 45-mg S/g hakg When irradiated with neutrons, 32S (95% abundance) undergoes an (n,p) reaction to form 32P. This reaction has a threshold near 2.5 MeV. Analysis for 32P then gives an indication of the fast neutron fluence above this energy. If the spectrum is known, the fluence above 2.5 MeV can be folded with dose-response curves to estimate absorbed dose.
In the LANL intercomparison, CEDS irradiated only hair samples. The hair samples were exposed in all four of the Godiva bursts, but in none of the SHEBA tests. LANL provided simulated blood solutions for three of the six tests, two with Godiva and one with SHEBA. These were analyzed by scientists from the Savannah River Site [SRS).
5.2 ANALYSIS PROCEDURES
5.2.1 Hair Sample Analysis.
Samples of hair may be counted on any low-background beta counter with little preparation. However, under accident conditions the possibility of external contamination .exists, and the additional beta activity can skew results unless steps are taken to eliminate the contaminant and/or discriminate the 32P activity.’’ Although standard operating procedures for hair analysis have not been developed, much work has been done in this area and instructions are contained in an ORNL report.12 Briefly, hair samples are thoroughly washed to remove any external contamination, cut, dried and weighed, either ashed or dissolved, then mixed with scintillation cocktail and counted on a liquid scintillation counter. Standard activity determination equations (including decay corrections and equations for minimum detectable activity) are given.
Under real accident conditions, these procedures would be executed by radiobioassay personnel. As a learning exercise prior to the LANL visit, CEDS personnel performed a “dry run” at the ORNL Radiobioassay Laboratory (RBL). Many difficulties were encountered, mostly due to inexperience but some due to procedural difficulties. Specifically, the tissue solubilizing agent recommended for dissolving smaller quantities of hair did not perform well, and the muffle furnace used to ash the samples is not routinely used in the laboratory. Consequently, it had to be brought out of a storage location, and personnel were not completely familiar with its operation.
For the intercomparison, samples were shipped back to the ORNL RBL and analyzed by laboratory personnel. . The ashing procedure. was chosen for simplicity. Results of 32P-specific

29
activity (Bq/g hair) were supplied to CEDS personnel. Unfortunately, three to four weeks elapsed between the bursts and the analysis. Three of the four samples reported less than the MDA.
5.2.2 Dose Calculation
A technique has been.reported in the open literature that uses a combination of hair and blood sodium results in the dose calculation procedure." This method has been pursued by individuals at ORNL attempting to develop the accident dosimetry program. l2 However, CEDS operating procedures have not yet been written to incorporate the methodology.
For the intercomparison, it was necessary to analyze the hair sample data without accompanying blood sample results (see the brief discussion in Section 5.3). Relevant sections of ORNUTM-12028 supplied the basis for the dose calculations. Some difficulties and errors were
' encountered, and others are anticipated for actual accident scenarios, generally related to omissions from the text. The steps are outlined here for possible later use.
First, the fluence of neutrons with energies greater than 2.5 MeV is determined. The equation given in ORNUTM-12028 for induced 32P activity is:
Some values and units given in the document are either not defined or are not in the correct form for direct inclusion into the equation. The correct definitions are:
A, =
m =
A =
G ='
60 =
w =
the specific activity of 32P in hair (Bq/g hair),
the sulfur content per gram of hair = 0.045 g S/g hair,
the decay constant for 32P = 3.37 x lo5 min-',
Avogadro's number = 6.023 x ld3 mol",
60 s/min,
the atomic weight of sulfur = 32 g S/mol,
the fluence of neutrons of energy E (cm-2), and
the (n,p) cross section of 3 2 ~ at energy E (cm2).

30
From this equation one must derive the total fluence above 2.5 MeV. The illustration in ORNUlM- 12028, Fig. 16, shows the 32S(n,p)32P cross section as a function of energy. An assumption must be made for quick estimates of dose, namely that the (n,p) cross section is constant above 2.5 MeV. For the fission energies of interest, the cross section function varies irregularly between about 0.08 and 0.4 barns. A rough “weighted” average of the assumed spectrum was estimated to be 0.2 barns for all of the Godiva spectra. With this assumption, the fluence above 2.5 MeV is easily derived from the equation above (Le., CJ = 2 x cm=L).
Next, the total fluence is calculated. Table 17 in ORNUTM-12028 gives precalculated values of the fraction of the total fluence that is above 2.5 MeV for 98 different spectra. Values for the HPRR with the appropriate shield were taken from this table for the Godiva bursts.
Finally, spectrum-averaged fluence-to-absorbed dose factors published in the open literature *‘ for theHPRR’3 were applied in order to calculate dose. This reference contains only a few values,
which may not be useful in a real accident. Other reports’4 contain values of spectrum-weighted D/@ for many other spectra. These references should either be obtained or incorporated into the operating procedures; it may be necessary to perform additional calculations to obtain a full complement of factors.
5.3 .RESULTS
As was already mentioned, hair samples were irradiated in the four Godiva bursts and simulated blood samples in two of the Godiva bursts and one SI-EBA test. Hair samples were shipped back to the ORNL RBL and analyzed 3 4 weeks after the exposures. The long delay in counting the samples allowed the induced 32P activity to decay significantly (TR= 14.3 d). Some of the results were therefore less than the MDA at the actual time of the count, that would likely have been detectable if the assay had been performed immediately following the burst. Unfortunately, for the two Godiva tests for which both hair and simulated blood were irradiated, the hair results were less than the MDA, meaning there were no tests for which the technique combining the hair and blood results could be evaluated. The results in this section,’ then; report only the hair sample analyses and dose calcualtions as described in Section 5.2.
The results are presented in Table 5. Since only one of the results is statistically reportable, it is the only one for which performance can be reasonably stated. Thus, the reference dose of 200 rads for the unshielded Godiva test was over reported by the modified hair analysis by 42%. Clearly, additional work could be done to provide a more accurate estimate of dose from biological samples.

31
Table 5. Results of induced 32P activity in hair samples from the Godiva tests
Datehime of burst
Datehime of count
Hair mass
Background rate
Counting time
Minimum detectable specific activity
Fraction of fluence over 2.5 MeV
Fluence-to-dose correction factor
Measured activity (*la)
Decay-corrected specific activity
Absorbed dose
- Unit -
rads -
Bare
6/13/95 @ 0559
7/11/95 @ 2000
0.373
16.12
20
0.187
0.108
23
6.75 f 1.40
1.27 f 0.26
284 f 59
Concrete ~~
6/14/95 @ 0613
7/11/95 @ 2000
0.257
16.12
20
0.27 1
.0.0368
14.3
0.42 +- 1.28
0.1 1 f 0.33
e422
PMMA
6/15/95 @ 0542
7/11/95 @ 2000
0.272
16.12
20
0.256
0.122
16
1.83 +. 1.31
0.43 k 0.31
e128
Steei
6/22/95 @ 0532
7/11/95 @ 2000
0.394
16.12
20
0.177
0.0386
14.3
1.5 +. 1.30
~ 0.17k0.15
c178
The high minimum detectable doses (MDDs) for the three remaining analyses would be reduced significantly in a real accident scenario, since it is generally agreed that the samples would not decay for 3+ weeks. The MDDs for the bare, concrete-, PMMA-, and steel-shielded Godiva reactor samples (assuming the same mass of hair is analyzed) where the activity is not significantly decayed are 42,111 , 35 and 69 rads, respectively. There are no stated requirements for MDDs for biological indicators; however, the DOE 5480.1 1 requirements on fixed and personnel nuclear accident dosimetry systems extended down to 10 rads. Lower MDDs for the hair samples could be achieved by collecting and analyzing laiger samples for longer counting times.
5.4 CONCLUSIONS
Biological samples irradiated in the LANL intercomparison afforded the opportunity to exercise some ORNL, analysis procedures that had not been tested under simulated accident conditions. In general, additional work on these procedures is needed in all areas, from sample preparation to dose calculation techniques.
*
32
A dry run conducted prior to the LANL tests uncovered some difficulties in chemical dissolution techniques, including the need for some chemicals that are not maintained routinely in the RBL. In the ashing procedure, better familiarity is needed with the operation of the muffle furnace, which is also not used routinely. No procedure for sample counting currently exists; it would be helpful to include 'guidance on counting times to ensure that an acceptable MDD is obtained.
The dose calculation methodology being developed uses a combination of hair and blood sample results to provide crude spectral information. This technique should be developed further and proceduralized. However, as it is conceivable that, under actual accident conditions some results would. be available before others, it is recommended that some dose calculation methodologies be developed that are based on single sample results for early estimates of absorbed dose.
The dose calculation technique combining hair and blood analyses could not be tested in the LANL intercomparison, because for the two tests for which blood and hair were both irradiated, the hair . sample results were less than MDA. In fact, only one hair result was statistically significant. A dose was calculated from this result using very rough assumptions pulled from a variety of references; the estimated dose w,as about 42% higher than the reference absorbed dose.

33
6. REFERENCES
1.
2.
3.
4.
5.
6.
7.
8.
9.
10.
11.
W. H. Casson et al., “Nuclear Accident Dosimetry Studies at Los Alamos National Laboratory,” draft text of a presentation for the Eighth Symposium on Neutron Dosimetry, Paris, France, November 1995. b
C. S. Sims and G. E. Ragan, Health Physics Research Reactor Reference Dosimetry, ORNL6240, Oak Ridge National Laboratory, June 1987. -
G. T. Mei and W. H. Casson, Sr., Centralized External Dosimetry System (CEDS) Nuclear Accident Dosimeter, X-MA-92-3, Lockheed Martin Energy Research Corp. (May 15, 1992).
Y. S. Horowitz, ed., Thermoluminescence and Thermoluminescent Dosimetry, CRC Press, Boca Raton, Florida, 1984.
U.S. Department. of Energy Order 5480.1 1, “Radiation Protection for Occupational Workers,” 1988.
T. RotheGel, Harshawh3icron Radiation Measurement Products, personal communication, March 22,1996.
A. F. McKinlay, “Thermoluminescence Dosimetry,” Medical Physics Handbook 5, Adam Hilger, Ltd, Bristol, England, in collaboration with the Hospital Physicists’ Association.
M. Moscovitch and Y. S. Horowitz, “A Microdosimetric Track Interaction Model Applied to Alpha-Particle-Induced Supralinearity and Linearity in Thermoluminescent LiFMg, Ti,” J. Phys. D: Appl. Phys. 21,804-14 (1988).
G. D. Kerr and G. T. Mei, Technical Basis for Nuclear Accident Dosimetry at the Oak Ridge National Laboratory, ORIWTM-12224, Oak Ridge National Laboratory, August 1993.
D. 8. Hankins, “Dosimetry of Criticality Accidents Using Activations of the Blood and Hair,” Health Phys. 38,529-4 1 (1 980).
Protection Against Neutron Radiation, Report No. 38, National Council on Radiation Protection and Measurements, 197 1.
12. ’ Y. Feng et al., Determination of Neutron Dose from Criticality Accidents with Bioassays for Sodium-24 in Blood and Phosphorous-32 in Hair, ORNIJTM-12028, Oak Ridge National Laboratory, June 1993.
13. C. S. Sims, “Comparison of Neutron Dosimetric Quantities,” Health Phys. 54, 551-5 (1988).
34
14. Compendium of Neutron Spectra and Detector Responses for Radiation Protection Purposes, Technical Reports Series 3 18, International Atomic Energy Agency, Vienna, 1990.
. -
35 b
APPENDIX A:
Relative Responses for Dosimeters Mounted in Non-Standard Geometries

36
-1- _____
1 1 I ttias, Standard deviation, Coefficient of vanation j (respectively)
Relative response of dosimeters mounted on one Styrofoam block.
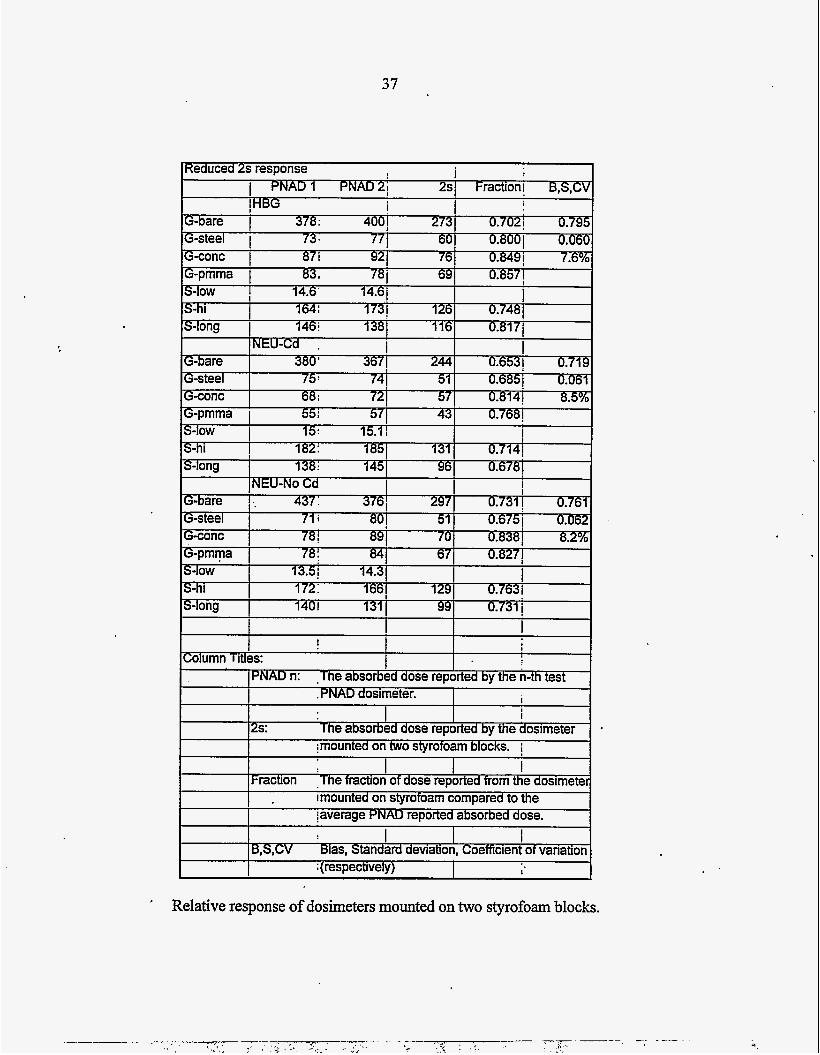
37
' Relative response of dosimeters mounted on two Styrofoam blocks.

38
Relative response of dosimeters mounted free-in-air.

.
I-raction ;The fraction of dose reported from the dosimeter jmounted on the back side compared to the
39
i I PNADl PNAD 2'
Keduced Back response Back 1 Back 2: I-ractioni B,S,CV I
c I I I :(respectively) I I
V .Bias, Standard deviation, Coefficient of variation 1
Relative response of dosimeters mounted on the back side of the phantom.

40
! I
I I I I
Reduced I-NAD response PNAU 1 I PNAD 2. I-NAD: Fraction! B,S,CVi
320 ; 0.823! 0.9241 8-bare . 3781 IG-steel 1 77! 67 i 0.8931- 0.076 I
- , 4001 - 4
I I I : Column Iitles:
PAAD n: i I PNAD d osimeter. ! I
Th e absorbed dose reported by the n-th test
W A D osimeter. I I I
: jThe absorbed dose reported by the I-NAD d I I
osimeter Th e fraction of dose reported from the I-NAD d compared to the average PNAD reported absorbed dose.
I i I I-raction
I I
Bias, Standard deviation, Coefficient of variation (respectively) I
Relative response of F'NAD dosimeters compared to PNAD dosimeters.

41
ORNL/TM-13245
INTERNAL DISTRIBUTION
1. 2. 3. 4. 5. 6. 7. 8. 9.
10. 11. 12.
13-1 7. 18. 19.
41.
42.
43.
44.
45.
46. 47.
48.
49.
A. B. Ahmed J. H. Barker K. M. Bailey R. S. Bogard B. G. Bowers T. J. Denton E. Dixon B. T. Gose R. A. Hamby C. G. Hudson J. B. Hunt D. F. Farver K. L. McMahan G. T. Mei R. L. Mlekodaj
20. 21. 22. 23.
24-28. 29. 30. 31. 32. 33.
34-35. 36-37.
38. 39. 40.
K. J. Nugent R. W. Oliver G. R. Rao D. P. Rowan L. J. Schwanke K. R. Shaw c. s. sims L. M. Snapp M. L. Souleyrette M. Thein Central Research Library Laboratory Records Laboratory Records-RC ORNL Patent Section ORNL Technical Library, Y-12
EXTERNAL DISTRIBUTION . .
A. C. Bassett, U.S. Department of Energy, P.O. Box 2008, Oak Ridge, Tennessee
W. H. Casson, Los Alamos National Laboratory, P.O. Box 1663, MS G761, Los Alamos, New Mexico 87656. K. W. Crase, Westinghouse Savannah River Company, Savannah River Site, Bldg. 735A, m e n , South Carolina 29801. F. M. Cummings, Radiological and Environmental Sciences Laboratory, US. Department of Energy, Idaho Operations Office, 850 Energy Drive, MS-4149, Idaho Falls, Idaho
J. J. Fix, Battelle, Pacific Northwest National Laboratory, P.O. Box 999, MS P7-02, Richland, Washington 99352. G. Holeman, Brookhaven National Laboratory, Bldg. 535A, Upton, New York 1 1973. J. Hoffman, P.O. Box 1663, MS G761, Los Alamos National Laboratory, Los Alamos, New Mexico 87545. J. C. Liu, Stanford Linear Accelerator Center, P.O. Box 4349, MS-84, Stanford, California 94309. H. J. Monroe, U.S. Department of Energy, P.O. Box 2008, Oak Ridge, Tennessee
3783 1-6269. .
83401-1562.
3783 1-6269.

42
50. M. A. Robinson, U.S. Department of Energy, P.O. Box 2008, Oak Ridge, Tennessee
51. R. Tawil, HarshawBicron, 6573 Cochran Road, Suite I, Solon, Ohio 44139. 52. S. Walker, Sandia National Laboratory, Dept. 7713, MS 0651, Albuquerque, New Mexico
53. C. F. Wu, Westinghouse Waste Isolation Division, Waste Isolation Pilot Project, P.O. Box 2078, Carlsbad, New Mexico 88221-2078.
54-55. Office of Scientific and Technology Information, U.S. Department of Energy, P.O. Box 62, Oak Ridge, Tennessee 3783 1.
3783 1-6269.
871 85-065 1.
.