oak ridge natiohbl lbqrbtory tennessee - molten...
TRANSCRIPT
C m I C A L TECHNOLOGY DIVISION U N I T OPERATIONS SECTION
LOW-PRESSURE DISTILLATION QP A PORTIOiV OF THE FUEL C J E K I ~ R SALT FROM THE MOLTEN SALT REACTOR EXPmIm?JT
J. W. Kigh-tower, Jr. L. E. McMeese B. A. flannaford H. B. Cochran, Jr.
AUGUST 1971
This report was prepared as am account of work sponsored by the United Stater Government. Neither the United States nor the United States Atomic Energy Commission, nor any of their employees, nor any of their contractors, subcontractors, of their employees, makes any warranty, express or implied, or assumes any legal liability OK responsibility foe the accuracy, com- pleteness or usefulness of any information, apparatus, produch oe process disclosed, or represents that its use would not infringe prhately owned rights.
OAK RIDGE NATIOHBL LBQRBTORY Oak Ridge, Tennessee
operated by UNIOR CAl3BIDE CORPORATION
U.S. ATOMIC EilTERGY COMMISSION for %he
. . .-..;5 .:.:..A.

L. ....
.. . . ... .<w .... . .,,
iii
CONTENTS
Page
~ S T E t A C T . . . . . . . . . . . . . . . . . . . . . . . . . . . E. INTRODUCTION . . . e e e . e e e . . . . . a e
2. BESCRIPTLON OF EQUIP,mm . . . a . * a e . a . 2.1 Process Equipment e e . a a . . e e e . e . a e . 2.2 Instrumentation . . e e e . a e a . a . e .
2.2.1 Measurement and Control of Temperature a e e a . 2.2 .2 Measurement and Control of Pressure . a * . a
2.2.3 Measurement and Control of Liquid Level . a e . 2.2.4 Wadktion Instrumentation e e . a e e a . e
2.2.5 Instrument Panel a . a . . e e . a . a a
2.3 Condensate Sampler . e a e . e . - e e
2*4 Location of Equipment at the MSRE . a e . e e . a . 3. DESCRIPTION OF DISTILLATION OPERATION a a e . . e . a e
4.1 Sumnmry of Experimental Data . e . a . . a . a . 4.2 Material Balance Calculations - . e . a . - e
k , 3 ~ e s d t s of Relative Volatility Calculations e . a a - 4.4 Possible Explanations of Calculated Results e e e .
4.4.1 Entrainment of moplets of St i lP-Pot Liquid . a
4.4.2 Concentration Polarization a a = e . . e
4.4.3 Contamination samples e . e - . - . 4.hc.h Inaccurate Analyses a e e e e . e a . . e .
7. REFERENCES....... . . . . . . . . . . . . . . . . . . . 8. APPENDIX: ANALYSES OF SAMPLES FROM TU3 MSRE DISTILLATION
EXPmImNT . e a - . . o . . . * . . . a e e e a
i
1
3
3
17 20
20
27
28 33 41 42 4? 45 46
43
48
49
51


b
LOW-PRESSURE DISTILEATION OF A PORTION OF THE FUEL CARRIER SALT' FROM TKF: MOLTEN SALT REACTOR EXFEPIIMENY
J. 8. Hightower, Jr . L. E . VcNeese B. A. Hannaford H. D, Cochran, Jr.
ABSTRACT
An experiment t o demonstrate t h e high-temperature low-pressure d i s t i l l a t i o n of i r r a d i a t e d Molten S a l t Reactor Experiment (NSRX) f u e l c a r r i e r salt has been successfu l ly conpleted. A t o t a l of 12 l i t e r s of ISERE f u e l c a r r i e r sa l t w a s d i s t i l l e d i n 23 h r of t rouble- f ree opera t ion with s t i l l - pot temlser-atures i n t h e range gOO-980"C and condenser pres- sures i n t h e range 0.1-0.8 t o r r . Eleven condensate samples were taken during t h e course of t h e run at i n t e r v a l s of approximately 90 min and were subsequently analyzed f o r L i , ~ e , ~ r , 637cs, 9 5 ~ r , l44ce, 1 4 7 ~ n , 155~u, g l ~ , 9QSr, and 89sr. E f fec t ive r e l a t i v e v o l a t i l i t i e s with respec t t o LiF, f o r Be and Zr were i n good agreement with values measured previously i n t h e labora tory . E f fec t ive r e l a - t i v e v o l a t i l i t i e s fsr t h e s l i g h t l y v o l a t i l e materials lk4Ce, 91Y, g0Sr, and 89Sr were found t o be much higher than values measured in t h e labora tory . The high values w e bel ieved t o be t h e r e s u l t of contamination from o the r K R E sa l t samples, although concentrat ion p o l a r i z a t i o n may have a l s o been a con t r ibu to r . The e f f e c t i v e r e l a t i v e voh- a t i l i t y f o r l37Cs was found t o be only 20$, cr less , of t h e va lue measured i n t h e l abora to ry ; no explanat ion sf t h i s discrepancy i s ava i l ab le .
Although t h e e f f e c t i v e r e l a t i v e v o l a t i l i t i e s f o r t h e lan thanides were found t o be higher than a n t i c i p a t e d , t h e va lues observed would s t i l l a l low adequate recovery of 7LiF from w a s t e salt streams by d i s t i l l a t i o n .
1.
Low-pressure d i s t i l l a t i o n may be requi red i n order t o recover
valuable c a r r i e r sa l t components from waste salt streams coming from
t h e f u e l processing p lan t of a molten-salt breeder r e a c t o r (MSBR) . . .. . . . . . . . . . . . . . . . . . . . ,.,.,. . . . -.&/
Typica l ly , 'LiF would be
more concentrated i n t h e
vaporized and
less v o l a t i l e
recovered, leav ing a l i q u i d hee l
lan thanide f i s s i o n products (as
f l u o r i d e s ) . This heel would then be discarded. The f i n a l stage of a
three-phase experimental program t o s tudy and demonstrate t h e f e a s i b i l i t y
of d i s t i l l a t i o n f o r decontaminating c a r r i e r sa l t components of lan thanide
f i s s i o n products i s descr ibed i n t h i s r e p o r t . The experimental program
included measurements of r e l a t i v e v o l a t i l i t i e s of s eve ra l l an thanide
and a lka l ine-ear th f l u o r i d e s i n mixtures of LiF and BeF2, E '2 t h e opera-
t i o n and t e s t i n g of a l a r g e s i n g l e - s t a g e s t i l l using fue l c a r r i e r salt from
t h e Molten S a l t Reactor Experiment (MSRE) wi th simulated f i s s i o n prod-
u c t ~ ~ " , and, as descr ibed he re , a demonstration of t h e d i s t i l l a t i o n
process using i r r a d i a t e d fue l c a r r i e r sa l t from t h e MSRE.
The opera t ion of t h e d i s t i l l a t i o n equipment with u n i r r a d i a t e d sa l t
had t h e following ob jec t ives :
l a r g e , low-pressure, high-temperature d i s t i l l a t i o n equipment; ( 2 ) in-
v e s t i g a t i n g entrainment rates and separa t ion i n e f f i c i e n c i e s due t o con-
cen t r a t ion g rad ien t s i n t h e s t i l l po t ; ( 3 ) measuring d i s t i l l a t i o n rates
under a v a r i e t y of condi t ions ; and ( 4 ) uncovering unexpected d i f f i c u l t i e s .
The ob jec t ives of t h e demonstration d i s t i l l a t i o n of t h e i r r a d i a t e d YSRE
f u e l c a r r i e r salt were: (1) t o provide MSBR fuel processing technology
with a process t e s t e d wi th fuel salt from an opera t ing r e a c t o r , ( 2 ) t o
provide information (not ava i l ab le from t h e l abora to ry i n v e s t i g a t i o n s )
on r e l a t i v e v o l a t i l i t i e s of f i s s i o n products , and t o g ive a genera l
confirmation of p red ic t ed f i s s i o n product behavior , and ( 3 ) t o uncover
unexpected d i f f i c u l t i e s assoc ia ted wi th r ad ioac t ive opera t ion .
(1) obta in ing opera t ing experience with
.. . ... w<;i.
3
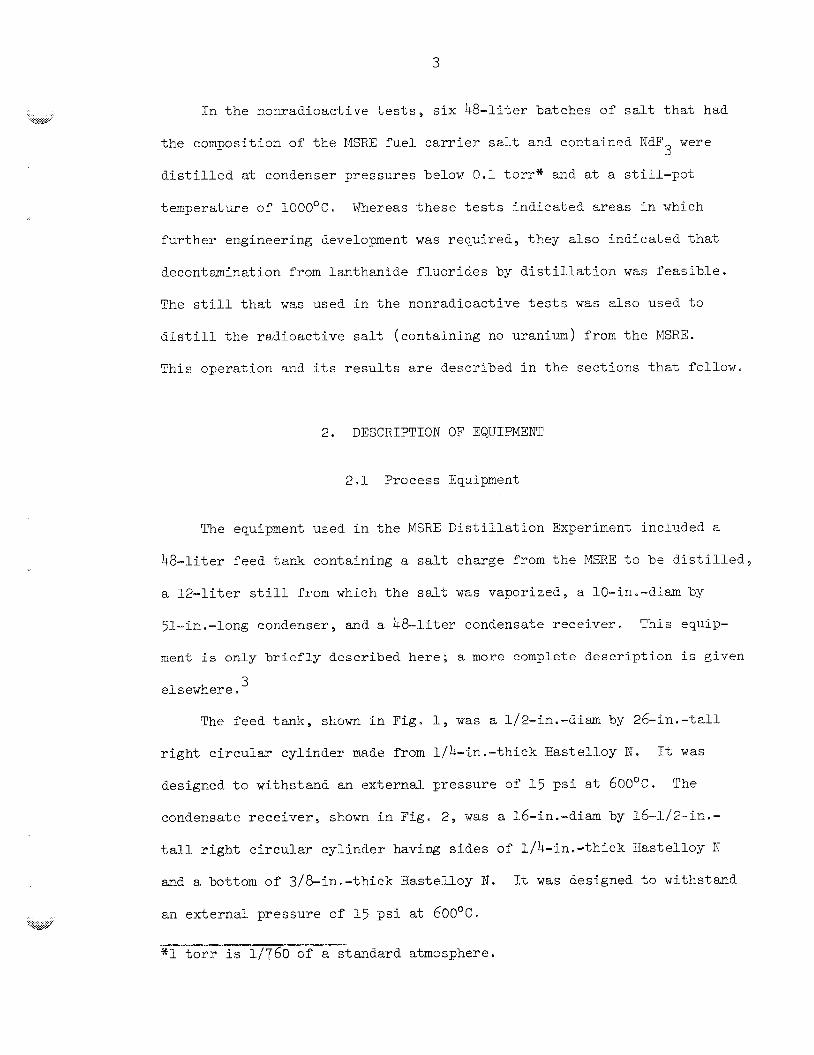
I n t h e nonradioact ive t e s t s , s i x 48-liter batches of sa l t t h a t had
t h e composition of t h e MSRE f u e l c a r r i e r salt and contained MdF were 3 d i s t i l l e d at condenser pressures below 0.1 t o r r " and a t a s t i l l - p o t
temperature of 1 8 0 0 ' ~ . Whereas t h e s e t e s t s i n d i c a t e d areas i n which
f u r t h e r engineering development was r equ i r ed , t hey a l s o i n d i c a t e d t h a t
decontamination from l an than ide f l u o r i d e s by d i s t i l l a t i o n w a s f e a s i b l e .
The s t i l l t h z t w a s used i n t h e nonradioact ive t e s t s w a s a l s o used t o
distill t h e r a d i o a c t i v e salt ( con ta in ing no uranium) from t h e &ERE.
T h i s ope ra t ion and i t s r e s u l t s are descr ibed i n t h e s e c t i o n s t h a t fo l lcw.
2 DESCRIPTION OF EQUPPMEhrE
2 . 1 Process Equipment
The equipment used i n t h e MSRE D i s t i l l a t i o n Experiment included a
48-liter f e e d tank containing a sal t charge from the MSWE t c be d i s t i l l e d ,
a 1 2 - l i t e r s t i l l from which t h e salt w a s vaporized, a lO-in.-diam by
?l-in.-long condenser, and a 48-liter condensate r e c e i v e r .
rnent is only briefly described here; a more complete d e s c r i p t i o n i s given
elsewhere e
This equrip-
3
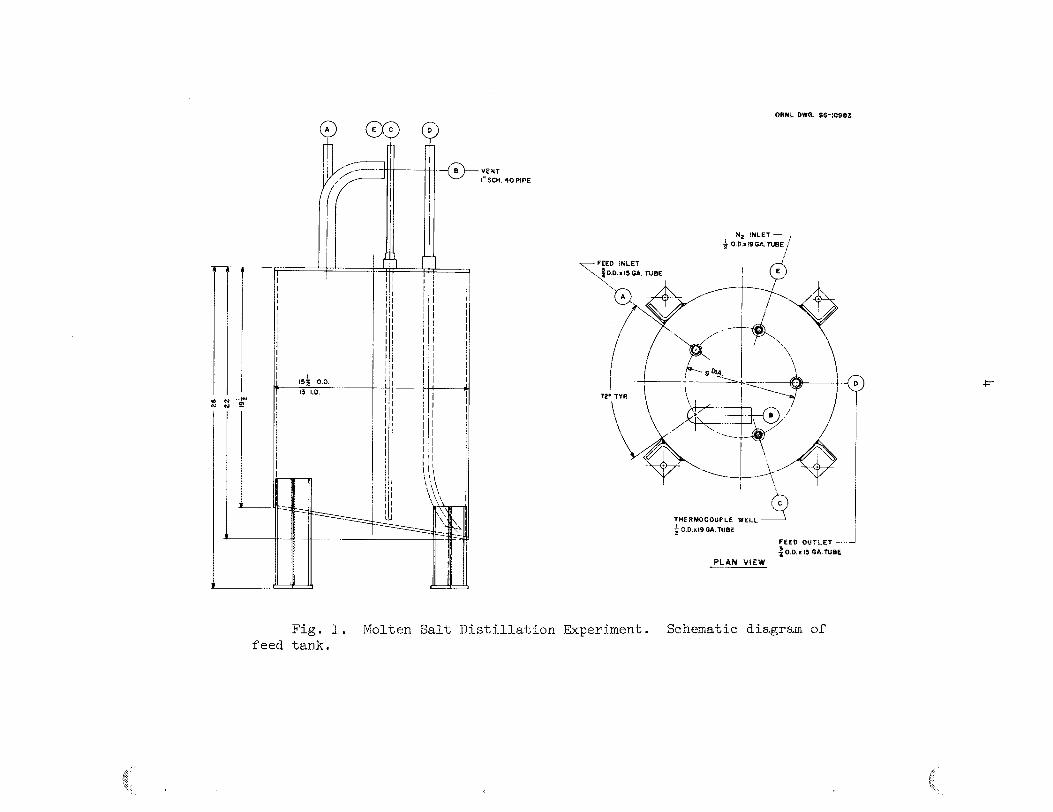
The f eed t ank , shown i n Fig. 1, was a 9/2-in.-diam by 26 - in . - t a l l
r i g h t c i r c u l a r cy l inde r made from l/h-in.-thick Hastel loy
designed t o withstand an e x t e r n a l p re s su re of 1 5 p s i a t 608'C.
condensate r e c e i v e r , shown i n ~ i g . 2, was a 16-in.-diam by 1 6 - ~ / 2 - i n . -
t a l l r i g h t c i r c u l a r c y l i n d e r having s i d e s of 1/4-in.-thick Hastel loy K
and a bottom of 3/8-in.-thick Bas t e l loy N.
an external pres su re of' 15 p s i at 6 O Q " C .
It w a s
The
It w a s designed t o withstand
*l t o r r i s 1/760 of a s tandard atmosphere.
T -g L
0 c
Fig. 1. Molten Salt Distillation Experiment. Schematic diagram of
c
feed tank.

5
Fig. 2. Nolten Salt Distillation Experiment. Schematic diagram of the condensate receiver.
, .;.&& . . . . . . . .
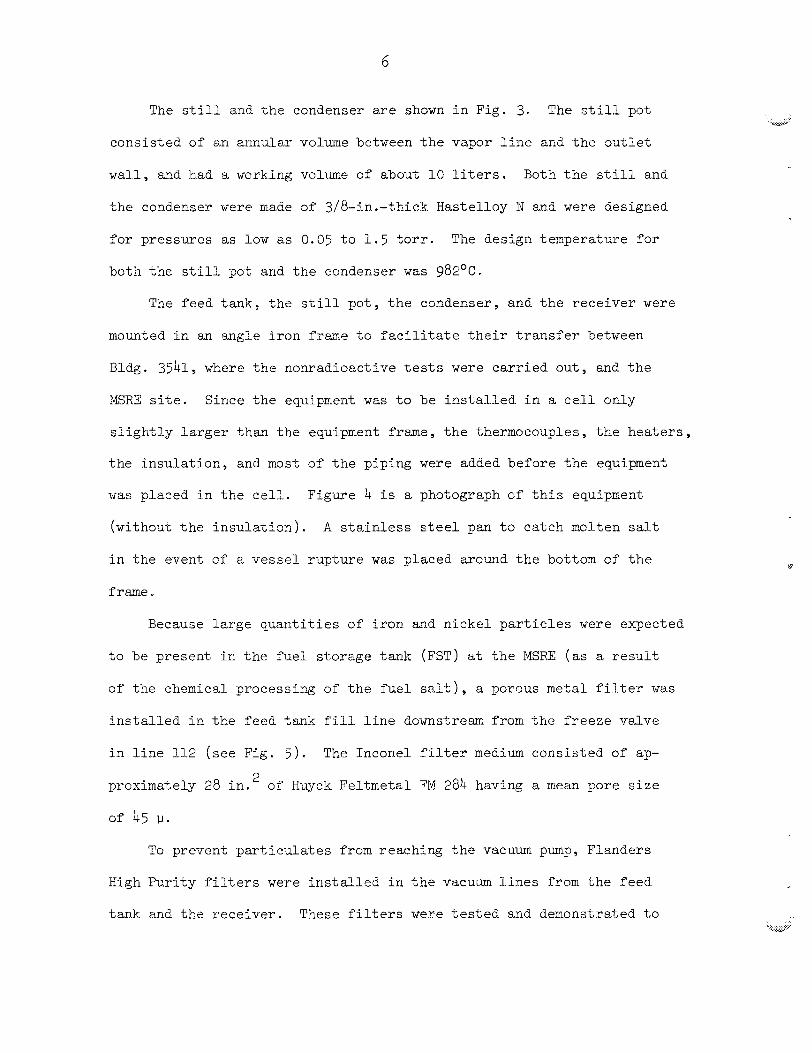
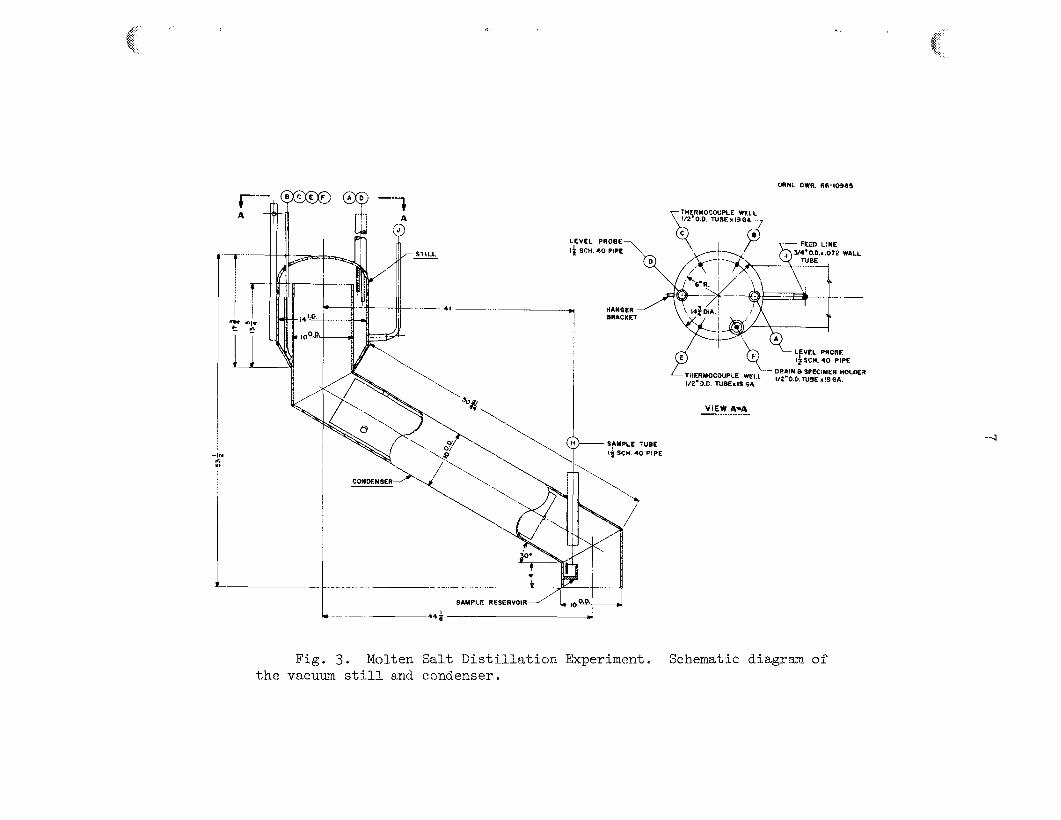
The s t i l l and t h e condenser are shown i n Fig. 3. The s t i l l pot
cons i s t ed of an annular volume between t h e vapor l i n e and t h e o u t l e t
w a l l , and had a working volume of about 18 l i t e r s . Both t h e s t i l l and
t h e condenser were made of 3/8-in.-thick Bastel loy N and were designed
for pressures as low as 0.55 t o 1 . 5 t o r r . The design temperature for
bo th t h e still pot and t h e condenser w a s 982'C.
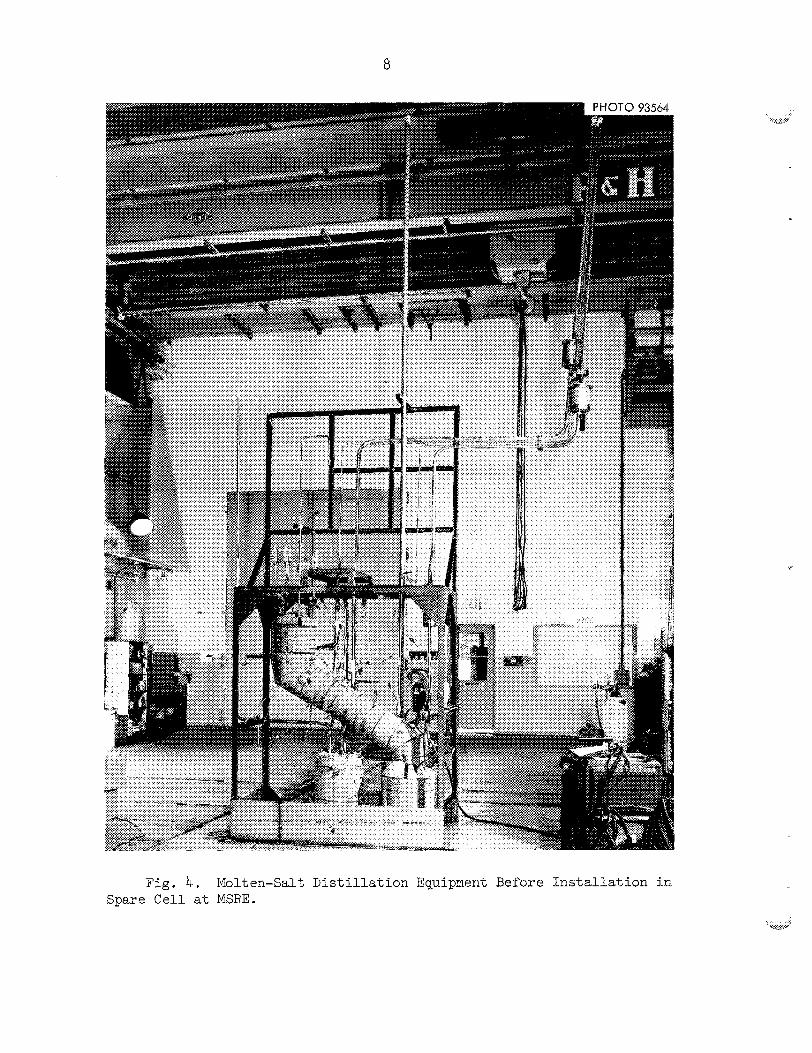
The f eed t ank , t h e still p o t , t h e condenser, and t h e r e c e i v e r were
mounted i n an angle i r o n frame t o f a c i l i t a t e t h e i r t r a n s f e r between
BPdg. 3541, where t h e nonradioact ive t e a t s were c a r r i e d Q U ~ , and t h e
MSRE s i t e . Since t h e equipment w a s t o be i n s t a l l e d i n a c e l l only
s l i g h t l y l a r g e r than t h e equipment frame, t h e thermocouples, t h e h e a t e r s ,
t h e i n s u l a t i o n , and most of t h e piping were added be fo re t h e equipment
w a s p laced i n t h e c e l l .
(without t h e i n s u l a t i o n ) .
i n t h e event of a v e s s e l r u p t u r e w a s placed around t h e bottom of t h e
f ram.
Ffgure 4 i s a photograph cf t h i s equipment
A s t a i n l e s s s t ee l pan t o ca t ch molten sa l t
Because l a r g e q u a n t i t i e s of i r o n and n i c k e l p a r t i c l e s were expected
t o be present i n t h e f u e l s to rage tank (FST) a t t h e MSWE (as a r e s u l t
of t h e chemical processing of t h e f u e l s a l t ) , a porous metal f i l t e r w a s
i n s t a l l e d i n t h e f eed tank fill l i n e downstream from t h e freeze v d v e
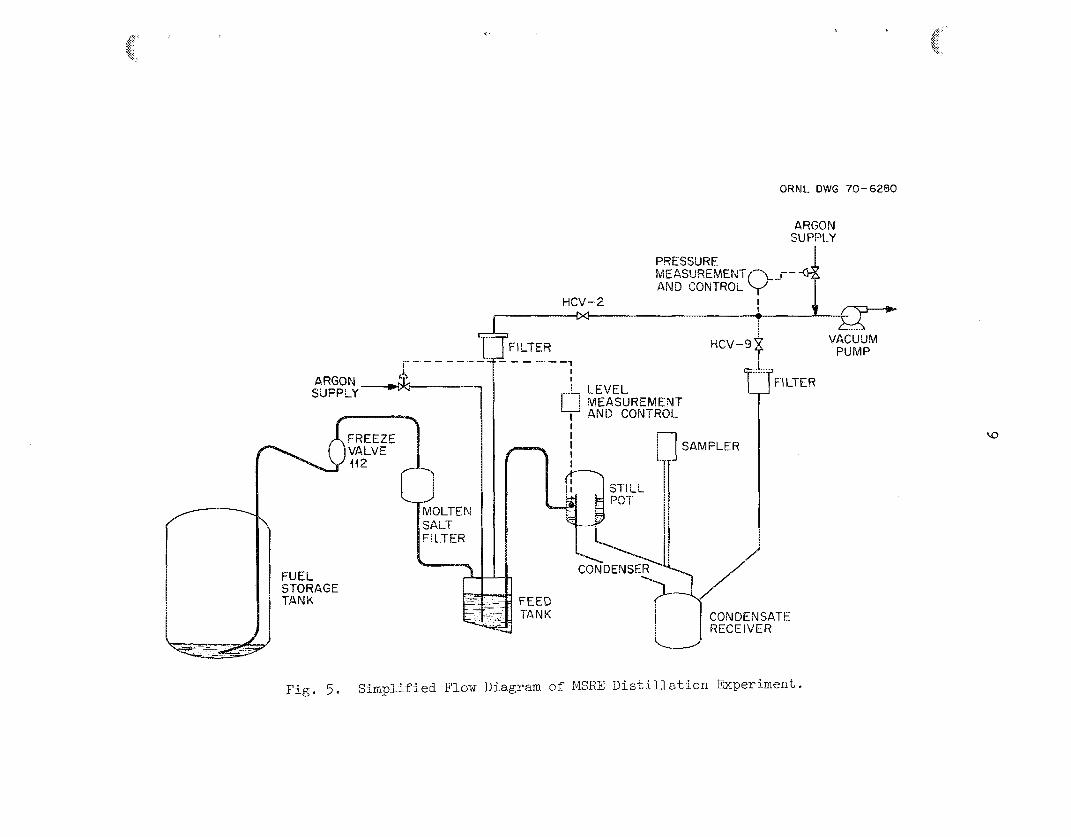
i n l i n e 112 (see Fig. 5 ) . The I n ~ ~ n e l f i l t e r medium cons i s t ed of ap-
proximately 28 in .* of Huyck Fe l tme ta l FM 284 having a mean pore s i z e
of 45 p.
To prevent p a r t i c u l a t e s from reaching t h e vacuum pmp, Flanders
High P u r i t y f i l t e r s were i n s t a l l e d i n t h e v a c w ~ l i n e s from t h e f eed
tank and t h e r e c e i v e r . These f i l t e r s were t e s t e d and denonstrated t o . .. .>.. . . :....,. .. . . . ,, ..!.L.
I
t
VIEW A-A
-4
Fig. 3. Molten Salt Distillation Experiment. Sehemati@ diagrm of the vacuum still and condenser.
8
c
Fig. 4. Molten-Salt Distillation Equipment Before Installation in Spare Cell at MSRE.
-----e-c _ i I
ARGON SUPPLY i LEVEL u L
MEASUREMENT , AND CONTROL
I r-7
FEED TANK CONDENSATE
Fig. 5. Simplified Flow Diagram of MSRE Distillation Experiment.
e f f e c t i v e l y remove 99.997% of 0. 3-LI p a r t i c l e s . The housings Tor t h e s e
f i l t e r s can be seen i n Fig. 4 on two of t h e l a r g e r l i n e s a t t h e r i g h t -
hand s i d e .
All valves and piping t h a t d i d not contact t h e molten salt were made
of s t a i n l e s s s tee l and were housed i n a sea led s t ee l cubic le containing
pressure t r a n s m i t t e r s and two vacuum pmps- one t o evacuate t h e re ference
s i d e of a d i f f e r e n t i a l p ressure t r a n s m i t t e r , and t h e o the r t o evacuate
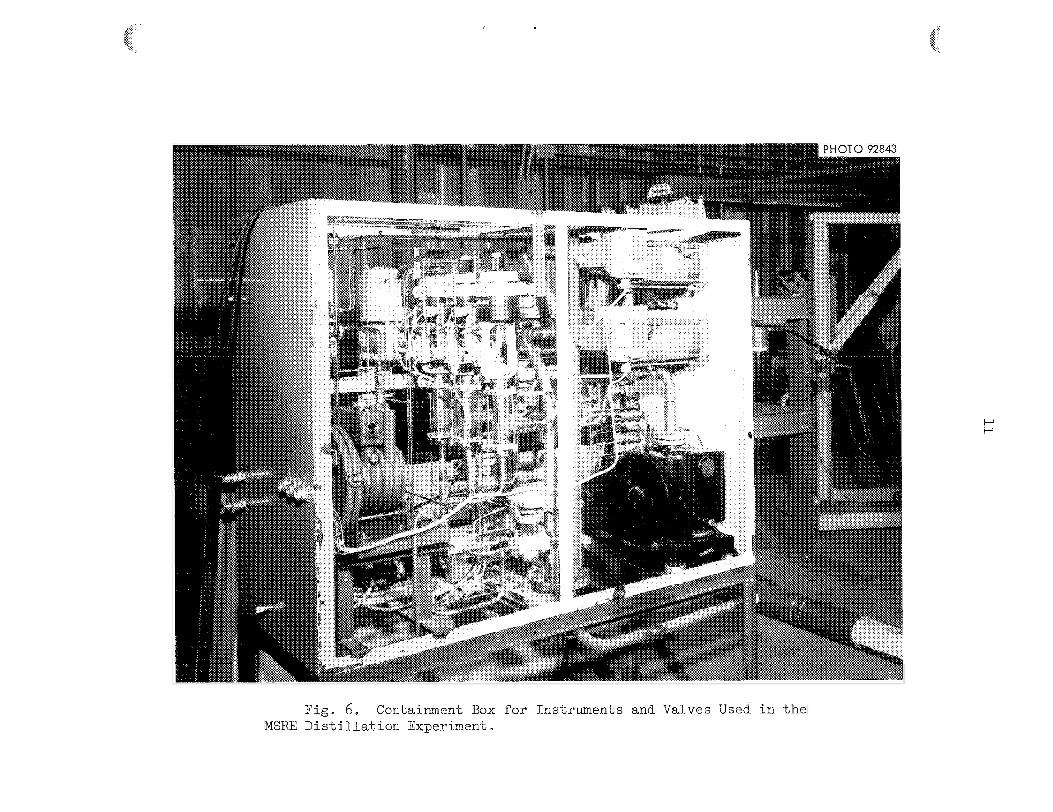
t h e d i s t i l l a t i o n process v e s s e l s . The valve box, with i t s f r o n t and r e a r
cover p l a t e s removed, i s shown i n Fig. 6. This box completed t h e second-
a ry containment around
were bo l t ed and sea led
M 0, t h e l eak rate w a s
never exceeded 0.5 i n .
2
piping and instrumentat ion when i t s lower p l a t e s
i n p lace . With t h e box wder a pressure of 1 5 i n .
0 .1 c fh . Ddring opera t ion , t h e p re s su re i n t h e box
H 0 , and t h e Peak rate was n e g l i g i b l e . 2
2 e 2 I n s t r m e n t a t ion
2.2.1 Measurement and Control of Temperature
Temperatures w e r e measured and con t ro l l ed over two ranges: 5 0 0 - 6 0 6 ~ ~
f o r t h e feed t ank and t h e condensate r e c e i v e r , and 800-1000QC f o r t h e
s t i l l and t h e condenser.
w e r e used f o r t h e high-temperature measurements, whereas less expensive
Chromel-Almel thermocouples were used on t h e feed t anks , condensate re-
ce ive r , and salt t r a n s f e r l i n e s . Each of t h e thermocouples ( t o t a l , 60)
w a s enclosed i n a 1/8-in.-diam s t a i n l e s s s t ee l sheath; i n s u l a t e d Junct ions
were used. Five 12-point recorders were ava i l ab le f o r readout : two f o r
t h e P t QS ~t - 10% R ~ L thermocouples, and t h r e e f o r t h e el-iromel-klumel
thermocouples.
Platinum vs platinum - 10% rhodium thermocouples
:. . . . . .... w.xw
..
..
. ...
. .... ,.. . . . .
.i/
w&
&-
l 2
There were a t o t a l of nine i n d i v i d u a l l y heated zones on t h e f eed
tank, t h e s t i l l , t h e condenser, and t h e r e c e i v e r . The h e a t e r s for each
o f t h e s e zones were independently c o n t r o l l e d by a Pyrovane " ~ n - ~ f f ' ' con-
t r o l l e r ; t h e vo l t age t o t h e h e a t e r s w a s c o n t r o l l e d by Variacs. Heaters
on t h e var ious salt t r a n s f e r and argon Pines were nnanually c o n t r o l l e d
by sron-offsr switches and Variacs
2.2.2 Measurement and Control o f Pressure
Pressure measurements over t h r e e ranges were r equ i r ed : 0 t o 15 p s i a
f ~ r monitoring system pmpdown at t h e start of t h e run , f o r monitoring
system r e p r e s s u r i z a t i o n a t t h e end of t h e run, and f o r c o n t r o l l i n g salt
t r a n s f e r from t h e f u e l s t o r a g e t ank ; 0 t o 10 t o r r f u r suppressing vapori-
za t ion while t h e sa l t w a s h e l d at ope ra t ing temperature i n t h e s t i l l ; and
0 t o 1 t o r r during d i s t i l l a t i o n .
Absolute-pressure t r ansduce r s (Foxboro D/P c e l l s w i th one l e g evacuated)
covering t h e 0- t o 1 5 - p i a range were used t o measure t h e p r e s s u r e i n t h e
f eed t ank and i n t h e stiPP-condenser-receiver complex. An MMS Baratron
p res su re measuring device with ranges of 0-0.083, 0-8.01, 0-0.03, 0-0.1,
0-6.3, 0-1, 0-3, and 0-PO t o r r w a s used t o measure very low p res su res i n
t h e condensate r ece ive r
The system pressure w a s c o n t r o l l e d i n t h e 0.1- t o 10- tom range by
feeding argun t o t h e i n l e t of t h e vacuum p m p . The Baratrsn u n i t produced
t h e s i g n a l r equ i r ed f o r r e g u l a t i n g t h e argon flow.
It w a s necessary t o ensure t h a t an excessive i n t e r n a l p re s su re d i d
not develop i n t h e system s i n c e , at opera t ing temperature, a p re s su re i n
excess of 2 a t m would have been unsafe . This was accomplished by using
.?;,.,.&
an absolute-pressure t r a n s m i t t e r i n t h e condenser off-gas l i n e t o monitor . ..
13
. . I.:.: ....># ... . L.
,;.:.. . . . . . .-j. W ?
t h e system p res su re .
supply w a s shut off automatical ly .
When t h e p res su re exceeded 15 p s i a , t h e argon
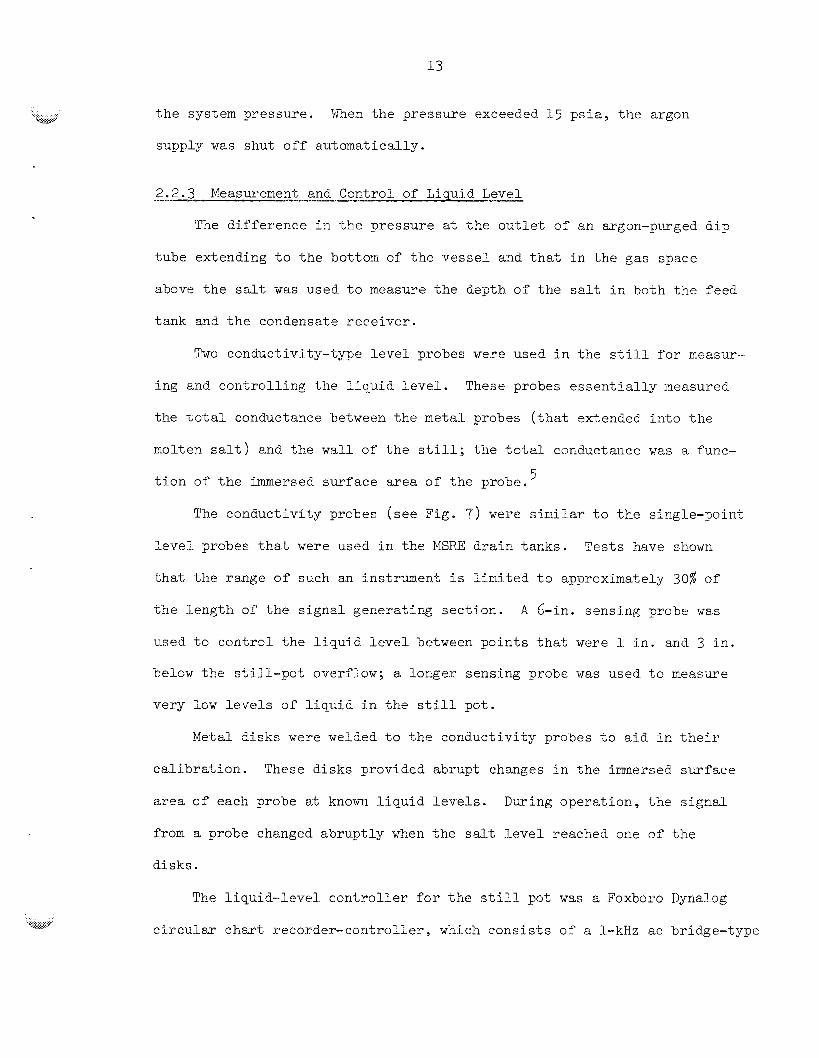
2.2.3 Measurement and Control of Liquid Level
The d i f f e r e n c e i n t h e p re s su re a t t h e o u t l e t of an argon-purged d i p
tube extending to t h e bottom of t h e v e s s e l and t h a t i n t h e gas space
above t h e salt w a s used t o measure t h e depth of t h e salt i n both t h e f eed
t ank and t h e condensate r e c e i v e r .
Two conductivity-type l e v e l probes were used i n t h e s t i l l for measur-
ing and c o n t r o l l i n g t h e l i q u i d l e v e l .
t h e total conductance between t h e metal probes ( t h a t extended i n t o t h e
molten s a l t ) and t h e wall of t h e s t i l l ; t h e t o t a l conductance was a func-
These probes e s s e n t i a l l y measured
t i o n of t h e immersed su r face a r e a of t h e probe.
The conduct ivi ty probes ( s e e Fig. 7) were similar t o t h e s i n g l e - p o i n ~
bevel probes t h a t were used i n t h e MERE d r a i n tanks .
t h a t t h e range o f such an instrument i s l i m i t e d t o approximately 30% of
t h e l e n g t h of t h e s i g n a l generat ing sec t ion . A &in . sensing probe w a s
used t o c o n t r o l t h e l f q u i e l e v e l between p o i n t s t h a t were 1 i n . and 3 i n .
below t h e s t i l l - p o t overflow; a longer sensing probe w a s used t o measure
very low levels o f l i q u i d i n t h e s t L l 1 po t .
Tes t s have shown
Metal d i sks were welCed t o t h e conduct ivi ty probes t o a i d i n t h e i r
c a l i b r a t i o n . These d i s k s provided abrupt changes i n t h e i m e r s e d su r face
area o f each probe at known l i q u i d l e v e l s .
from a probe changed ab rup t ly when t h e s a l t l e v e l reached one of t h e
d i sks .
During ope ra t ion , t h e s i g n a l
The l i q u i d - l e v e l c o n t r o l l e r f o r t he s t i l l pot was a Foxboro Dynalog
c i r c u l a r c h u t r eco rde r -con t ro l l e r , which c o n s i s t s of a 1-kRz a6 bridge-type

14
TOP VBEW
SIGNAL AMPLIFIER AND LEVEL INDICATO
HEA COVER
FOLDED EXCITATION SECTION
/ CONT.4lNMENT VESSEL
/SIGNAL GENERATING SECTION
DISKS TQ AIQ CALIBRATION
Pig. 9. Simplified Schematic of Conductivity-Type Liquid Level Probe for Still Pot in MSRE Distillation Experiment.

measuring device using v a r i a b l e capaci tance for rebalance. The proper
c o n t r o l a c t i o n (see Sec t . 3 ) was accomplished by having a v a r i a b l e dead
zone imposed on t h e set-point adjustment mechanism. With t h e c o n t r o l l e r
se t f o r t h e d e s i r e d average l i q u i d leve l , t h e argon supply valve t o t h e
feed tali w a s opened when t h e l e v e l i n d i c a t o r dropped 3% below t h e set
po in t w a s c lo sed when t h e l e v e l i n d i c a t o r r o s e 3% above t h e s e t p o i n t .
2 .2 .4 Radiat ion Instrumentat ion
Ionization-chamber r a d i a t i o n monitors were mounted on process l i n e s
i n t h r e e l o c a t i o n s : one on t h e f i l t e r i n t h e f eed tank vacum l i n e , one
on t h e f i l t e r i n t h e r e c e i v e r vacuum l i n e , and one on t h e l i qu id -n i t rogen
t r a p i n t h e r e c e i v e r vacum l i n e . The two monitors on t h e f i l t e r s were
sh i e lded from the r a d i a t i o n f i e l d in t h e cell by an 18-in.-thick barytes
concrete block w a l l and i n d i c a t e d t h e l e v e l of r a d i o a c t i v i t y f o r each
f i l t e r . The monitor on t h e l iquid-ni t rogen trap w a s no t sh i e lded from
t h e r a d i a t i o n f i e l d produced by t h e process vessels and thus registerec?
t h e gene ra l l e v e l of r a d i a t i o n i n t h e c e l l .
Two Geiger-!48lPer tubes which were a t t ached t o t h e valve box,
monitored t h e vacuum pumps. They were se t t o sound an alarm when t h e
r a d i a t i o n level reached 1 nR /hr at a po in t about 6 i n . from t h e p u p s .
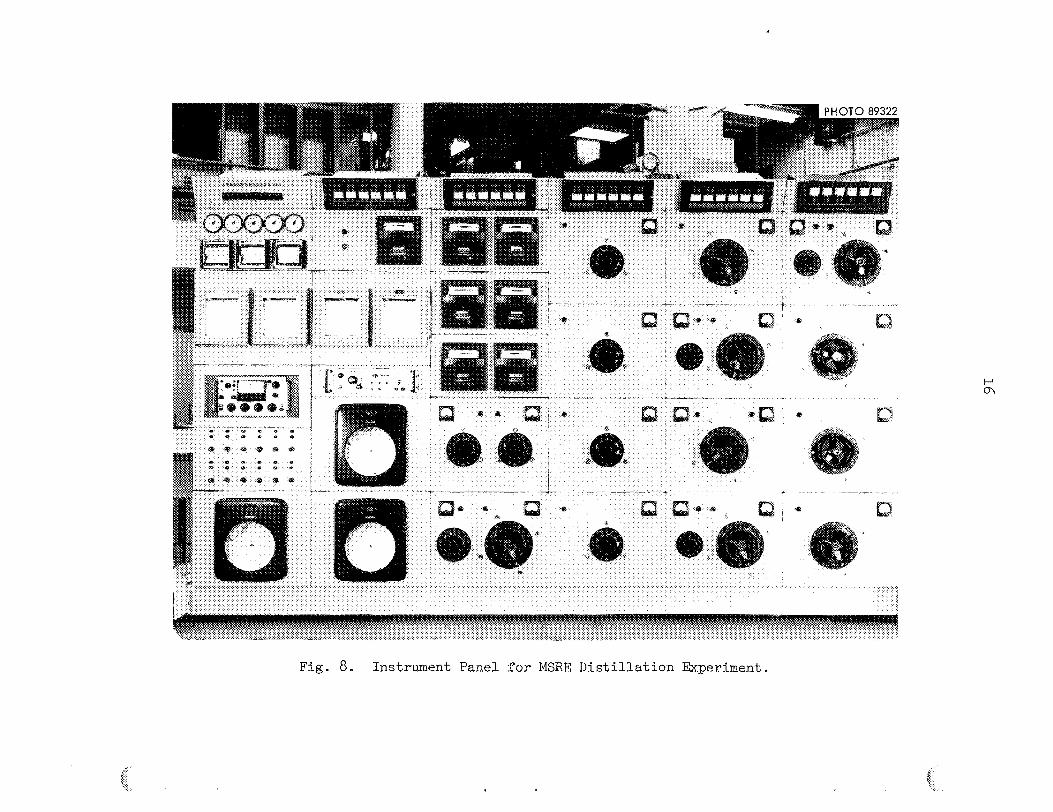
2.2.5 Instrument Panel
The instrument pane l , from which t h e process w a s c o n t r o l l e d , con-
t a i n e d t h e temperature c o n t r o l l e r s , t h e p re s su re and l e v e l r eco rde r s and
c o n t r o l l e r s , t h e va lve ope ra t ion switches, t h e e l e c t r i c a l power supply
c o n t r o l s , t h e temperature and p res su re a l u m s , and fou r o f t h e f i v e
tempera twe r eco rde r s . This panel i s shown i n Fig. 8. The f i f t h
16
".... ,
w
17
temperature recorder and t h e r a d i a t i o n measuring instrumentat ion w e r e
mounted i n o the r cab ine t s .
2 .3 Condensat e Sampler
The condensate sampler w%s t h e most important i tem of equipment f o r
ob ta in ing information from t h e d i s t i l l a t i o n experiment. The s m p l e r w a s
pa t t e rned after t h e equipment t h a t had previously been used t o add
5 t o t h e f u e l d r a i n tanks and t o t ake salt samples from t h e d r a i n tanks .
Modif icat ions o f t h i s design were made t o allow t h e s m p l e r t o be evac-
uated t o a b u t 0.5 t o r r so t h a t condensate samples could be wi thd ram
without d i s tu rb ing t h e operat ion of t h e s t i l l .
233u
Figure 9 shows a cutaway diagram of t h e sampler. The main components
of t h e sampler were:
were s t o r e d ; ( 2 ) t h e t u r n t a b l e i n s i d e t h e containment v e s s e l , which
allowed t h e smple capsules t o be a l igned with t h e handling t o o l and
a l s o with t h e removal t o o l ; (3 ) t h e capsule handling t o o l , with which
empty capsules were a t tached t o t h e cable t o be lowered i n t o t h e sample
r e s e r v o i r ; and ( 4 ) t h e r e e l assembly, with which capsules were lowered
and r a i s e d .
( I ) t h e containment ves se l i n which t h e samples
The following sequence w a s used i n c o l l e c t i n g a condensate sample.
With valve HV-62 (see Fig. 9 ) closed and t h e containment ves se l a t zl%mS-
pheric pressure , t h e sample handling t o o l w a s r a i s e d t o t h e h ighes t
pos i t i on . A s shown i n Fig. 9 , t h e cable was a t t ached about 20 i n . from
t h e t o p of t h e t o o l so t h a t , when t h e cab le w a s r ee l ed t o t h e h ighes t
p o s i t i o n , t h e t o p end of t h e t o o l protruded through valve W-66 and t h e
samples on t h e t u r n t a b l e could pass under t h e lower end of t h e t o o l .

BRML D W G 69-4945
Fig. 9. Cutaway Diagram of Condensate Sampler for MSRE Distillation Experiment.
. ... , ...,........., ~ . ~ . . . . __
. . .. . .... ... ..... .i %*e&
With t h e t o o l a t i t s highest p o s i t i o n , an empty capsule was r o t a t e d
underneath t h e Power end of t h e t o o l . The t o o l was t hen lowered onto
t h e s t e m of t h e capsule and Pocked i n p l ace by an adjustment a t t h e end
of t h e t o o l protruding through Hv-66.
were r a i s e d again, t h e t u r n t a b l e w a s r o t a t e d u n t i l t h e sampling notch
w a s l o c a t e d underneath t h e t o o l , and t h e t o o l w a s lowered below valve
KV-66.
t u rned on, and t h e containment v e s s e l w a s evacuated t o about 0 . 5 t o r r .
When t h e p re s su re i n t h e containment v e s s e l reached 0.5 t o r r , valve IW-62
w a s opened and t h e sample handling t o o l and t h e empty capsule were low-
e red u n t i l t h e sample capsule r e s t e d on t h e bottom of t h e sample r e s e r v o i r
at t h e end of t h e condenser. The t o o l and capsule were then r a i s e d above
valve IN-62, which w a s subsequently c losed. Next, t h e c o n t a i m e n t v e s s e l
w a s p re s su r i zed t o atmospheric p re s su re with argon.
t hen opened, and t h e sample handling t o o l w a s r a i s e d t o i t s h ighes t
p o s i t i o n . F i n a l l y , t h e empty sample holder w a s r o t a t e d underneath t h e
sample handling t o o l , and t h e sample w a s lowered i n t o i t s holder and re-
leased from t h e t o o l . The process w a s repeated by raising t h e sample t o o l
again, r o t a t i n g another s m p l e capsule underneath it, e t c . The
t u r n t a b l e w a s designed t o con ta in 11 sample capsules . Af t e r t h e samples
had been c o l l e c t e d , t hey were s t o r e d i n t h e containment v e s s e l . A t t h e
end sf t h e experiment, t hey were removed f o r a n a l y s i s .
The t o o l and t h e a t t ached capsule
Valve W-66 w a s then closed. A t t h i s t i m e , t h e vacuum pump was
Valve PW-66 w a s
A blower, which d r e w a i r i n t o t h e t o p of t h e l i n e at t h e ree l assem-
b l y to prevent r a d i o a c t i v e p a r t i c l e s f r o m escaping i n t o t h e ope ra t ing
area, w a s provided f o r t h e p a r t s of t h e ope ra t ion r equ i r ing IN-66 t o be
open. The air handled by t h e blower w a s f i l t e r e d and exhausted i n t o t h e
c e l l e
20
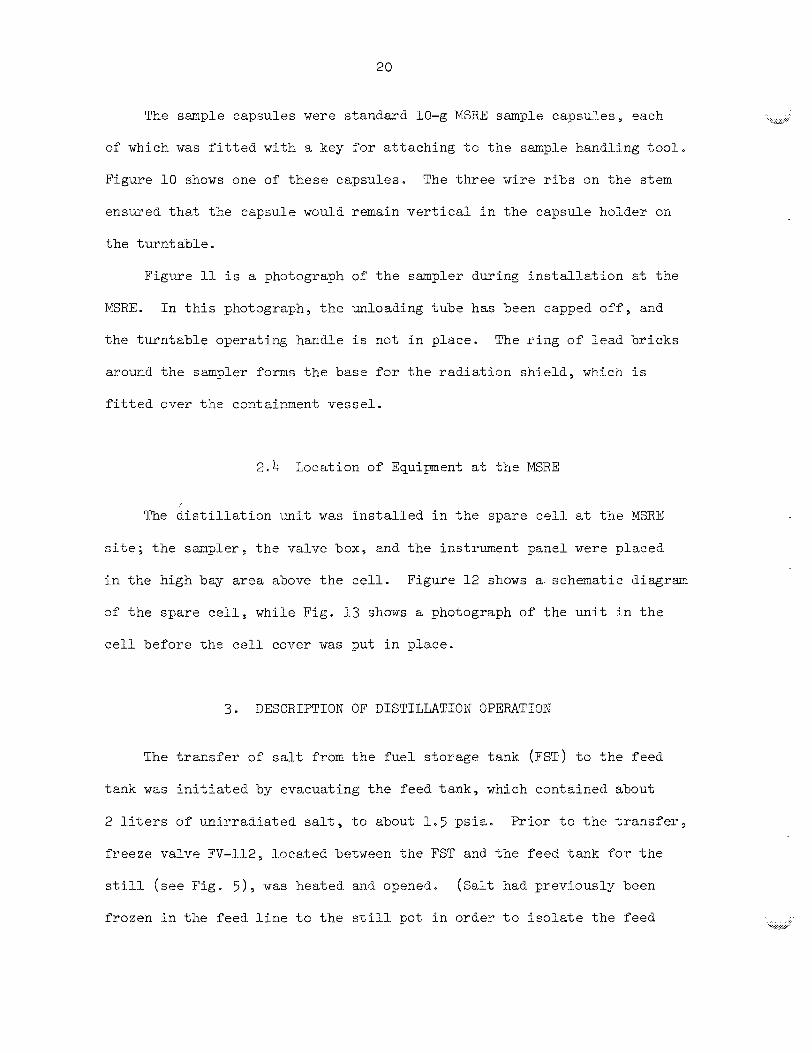
The smple capsules were s tandard 10-g MSRE sample capsuless each
of which w a s f i t t e d with a key f o r a t t ach ing t o t h e sample handling t o o l .
Figure 90 shows one of t h e s e capsules . The t h r e e w i r e r i b s on t h e s t e m
e n s u e d t h a t t h e capsule would remain v e r t i c a l i n t h e capsule holder on
t h e t u r n t a b l e s
Figure 11 i s a photograph of t h e sampler during i n s t a l l a t i o n a t t h e
MSRE. I n t h i s photograph, t h e unloading tube has been capped o f f , and
t h e t u r n t a b l e opera t ing handle i s not i n p lace . The r i n g of l e a d b r i c k s
around t h e sampler foms t h e base f o r t h e r a d i a t i o n s h i e l d , which i s
f i t t e d over t h e containment ves se l .
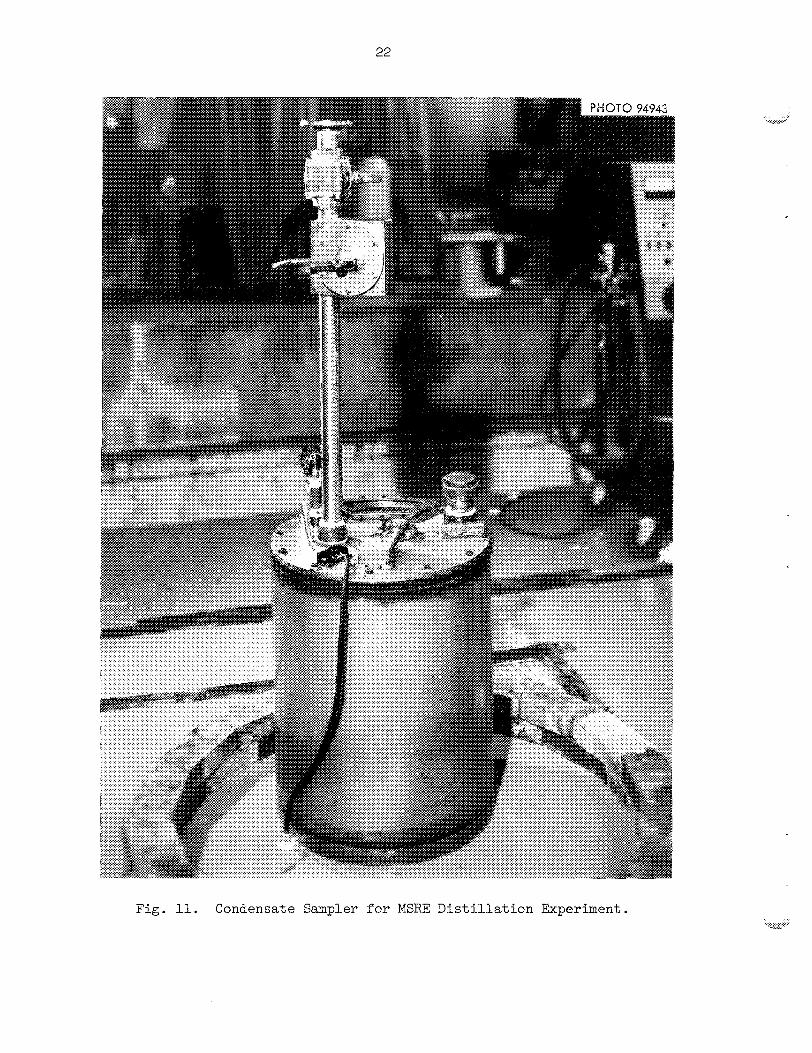
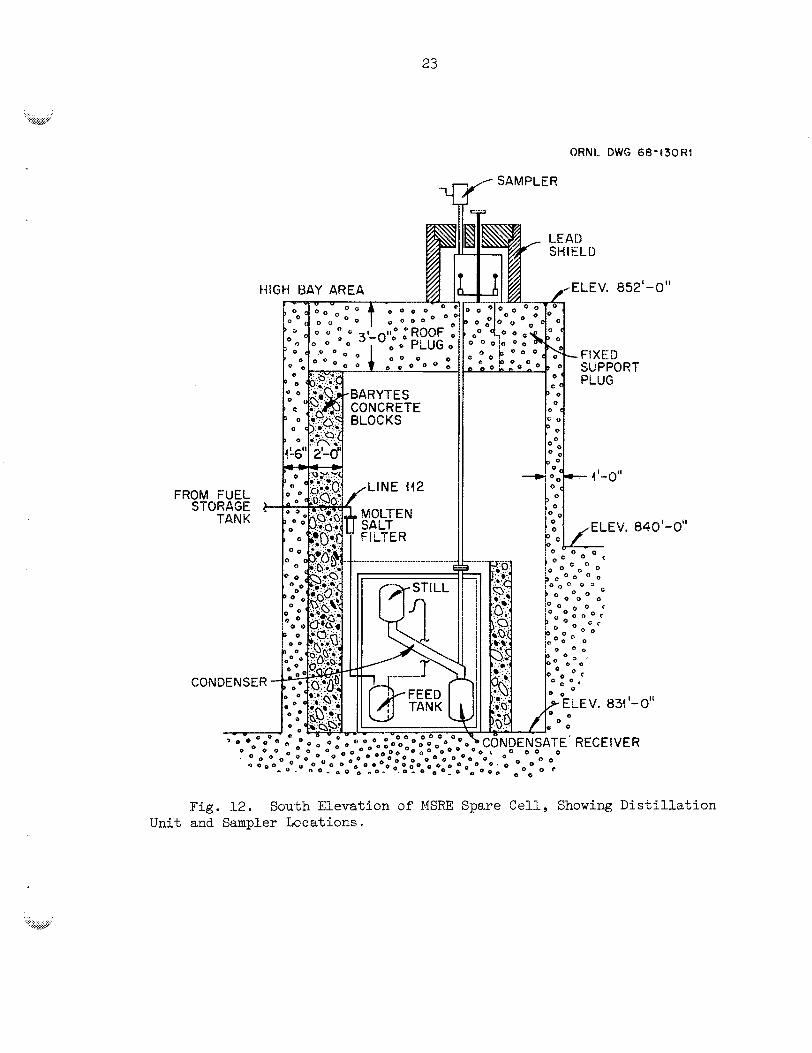
2.4 Location of Equipment a t t h e MSRE
The d i s t i l l a t i o n u n i t w a s i n s t a l l e d i n t h e spa re c e l l a t t h e MSRE
s i t e ; t h e s a p l e y t h e valve boxg and t h e instrument panel were placed
i n t h e high bay area above t h e c e l l . Figure 1 2 shows a schematic diagram
of t h e spare c e l l , while P ig . l 3 shows a photograph of t h e u n i t i n t h e
c e l l before t h e c e l l cover w a s put i n p lace .
3 . D E S C R I P T I O N OF DISTILLATION OPERATIOM
The t r a n s f e r of sa l t from t h e f u e l s torage tank (FST) t o t h e feed
tank w a s i n i t i a t e d by evacuating t h e feed t ank , which contained about
2 l i t e rs o f u n i r r a d i a t e d sa l t , to about 1 . 5 p s i e . Pr ior t o t h e t r a n s f e r ,
f r eeze valve FV-112, l oca t ed between t h e FST and t h e feed tank f o r t h e
s t i l l (see Fig . 5 ) w a s heated and opened. (Salt had previous ly been
f rozen i n t h e feed l i n e t o t h e s t i l l pot i n order t o i s o l a t e t h e feed . .. . . . . ........ ~ =,-

d- P
(D
23
/LINE (42
8 MOLTEN SALT FILTER
I I
Fig. 62. South Elevation of MSN Spare Cell, Showing Distillation Unit and Sampler Locations.
(.i.-. . . . . ..i ........ " '"&w

24
ORNL PHOTO 94840R
Fig. 13. Molten Salt S t i l l Ins ta l led in S p u e Cell at MSRE.
.... . . , . . . . . (..... ;&>
tank from t h e c t h e r process v e s s e l s . )
t r a n s f e r r e d fron t h e FST, t h e p re s su re of t h e f eed tank increased from
about 4 p s i % t o atmospheric p re s su re over a pe r iod of about 2 min; t h i s
i c d i c a t e d t h z t gas w a s being t r a n s f e r r e d from t h e feed t ank through $he
sa l t charging l i n e . More s a l t could n o t be t r a n s f e r r e d from t h e FST even
though t h e bubbler i n t h e FST i nd ica t ed t h s t a d d i t i o n a l selt w a s p re sen t .
Only one f u r t h e r attempt a t sal t t r a n s f e r was made because of t h e p o t e n t i a l
danger of blowing t h e t rapped salt out of t h e f r e e z e va lve ; t h i s would
have made it impossible t o o b t e i n a seal between t h e feed t ank and t h e
f u e l s t o r a g e t ank . After we had e s t a b l i s h e d t h a t EL t i g h t s e a l could be
made, we decided t o proceed with t h e experiment using t h e sa l t a l r eady
t r a n s f e r r e d , even though i t s volwne w a s much l e s s t han t h e a n t i c i p a t e d
volume (48 l i t e r s ) .
A f t e r 12 l i t e r s of sa l t had been
TO start t h e d i s t i l l a t i o n experiment, t h e s t i l l - p o t Feed l i n e was
thawed, a l l process v e s s e l s were evacuated t o 5 t o r r , and t h e s t i l l pot
w a s heated t o gSOQC.
w a s t hen c losed , and argon w a s int roduced i n t o t h e f eed t ank t o i n c r e a s e
the p res su re to about 0.5 a t m ; this forced the s a l t t o f l o w f r o m t h e feed
tank into t h e s t i l l po t . When 7 l i t e r s of sa l t had been t r a n s f e r r e d t o
t h e still p o t , t h e condenser p re s su re w a s reduced t o 0.2 torr t o start
t h e d i s t i l l a t i o n o f s a l t . A t t h i s p o i n t , c o n t r o l o f t h e l i q u i d level i n
t h e s t i l l pot w a s switched t o t h e automatic mode. I n t h i s mode, sa l t w a s
f e d t o t h e s t i l l pot a t a ate s l i g h t l y g r e a t e r t han t h e vapor i za t ion r a t e .
The argon f eed valve t o t h e feed tank remained open ( f o r c i n g more sal t
i n t o t h e s t i l l p o t ) u n t i l t h e l i q u i d l e v e l i n t h e s t i l l rose t~ a given
set p o i n t ; t h e valve then closed and remained closed u n t i l t h e l i q u i d
The valve between t h e f eed tank and t h e vacum pmp
26
l e v e l decreased t o a second set p o i n t . I n t h i s manner, t h e sal t volume
i n t h e s t i l l pot w a s maintained near 7 l i t e r s .
A s t h e sa l t vapor passed through t h e condenser, hezt w a s removed
from it by conduction through t h e condenser walls and t h e i n s u l a t i c n and
by convection t o t h e a i r i n t h e cell. The condenser was divided i n t o
t h r e e heated zones, t h e temperatures of which could be c o n t r o l l e d sepa-
r a t e l y when condensation w a s no t occurr ing. A sharp inc rease i n tempera-
tu re above t h e se t po in t s near t h e condenser entrance, as w e l l as a
gradual temperature r i s e near t h e end of t h e condenser, accompanied t h e
beginning of d i s t i l l a t i o n . Operation of h e a t e r s t o keep t h e tempera tme
of t h e condenser above t h e l i q u i d u s t e n p e r a t m e of t h e condensate w a s not
necessary during vapor condensation. I n t h i s psrt of t h e run , the still-
po t temperature w a s slowly inc reas ing ; and, s i n c e t h e concentrat ions of
v o l a t i l e BeF and ZrF w e r e s t i l l f a i r l y high, t h e vapor i za t ion r a t e w a s
a l s o inc reas ing . An abnoz-malby high temperature a t t h e end of t h e con-
denser i n d i c a t e d t h a t t h e capac i ty o f t h e condenser would be exceeded.
By r a i s i n g t h e Condenser p re s su re to 0.8 t o r r , t h e d i s t i l l a t i o n ra te w a s
reduced s u f f i c i e n t l y t o maintain t h e condenser temperature near 700QC, an
acceptably low temperature.
2 4
When t h e con ten t s o f t h e feed tank ( 7 l i t e r s ) had been dep le t ed , t h e
sal t i n t h e s t i l l f eed l i n e w a s f rozen ; t hen a t o t a l of 4 of t h e 7 l i t e r s
of sa l t i n t h e s t i l l pot w a s d i s t i l l e d by ba tch d i s t i l l z k i s n . A t t h i s
p o i n t , t h e s t i l l - p o t temperature w a s 980QC. As t h e more v o l a t i l e mate-
~ i a l s were vaporized from t h e s t i l l p o t , t h e condenser pressure w a s re-
duced from 0.8 t o r r t o 0 . 1 t o r r i n o rde r t o maintain a f a i r l y high
d i s t i l l a t i o n r a t e a When t h e condenser p re s su re could not be decreased
.. .. ,_... ~ ,... . . :..i w
. . .. . ... ,;,. . . . . :; .@w
f u r t h e r , t h e d i s t i l l a t i o n ope ra t ion w a s terminated by inc reas ing t h e
p re s su re i n a l l t h e process v e s s e l s to atmospheric pressure and t u r n i n g
o f f t h e power t o a l l t h e h e a t e r s .
The semicontinuous d i s t i l l a t i o n phase l a s t e d f o r 9 .3 hr; the average
d i s t i l l a t i o n r a t e during t h i s pe r iod w a s 0.57 l i t e r j h r . The durat ion of
the ba tch d i s t i l l a t i o n pe r iod w a s 13.8 h r ; t h e average d i s t i l l a t i o c r a t e
f o r t h i s pe r iod w a s 0.36 l i t e r / h r . Eleven condensate samples were taken
during t h e run at approximately 90-min i n t e r v a l s .
experiment, r a d i a t i o n readings o f t h e s e smples ranged from 4 R/hr a t
contact ( t h e f i r s t sample) t o 5QQ a t contact ( t h e l as t s m p l e ) .
A t t h e end of t h e
After t h e s t i l l had been allowed t o coo l down, a l l e l e c t r i c a l and
thermocouple l e a d s t o t h e s t i l l were cu t and a l l pneumkic instrument
Pines f r ~ m t h e valve box were disconnected. The sampler w a s dismantled
and s e n t t o t h e b u r i a l ground; t h e p r o j e c t i n g end of t h e s m p l e l i n e w a s
f langed.
high b8y sea.
remain i n piece.
Valve handle extensions were cu t f l u s h with t h e f l o o r o f the
The process v e s s e l s and t h e valve box were allowed to
4. EXPERIMENTAL RESULTS
4 . 1 S m a r y of Experimental Data
I n o r d e r t o determine t h e c a p a b i l i t y of t h e d i s t i l l a t i o n equipment
f o r s epa ra t ing f i s s i o n products from t h e c a r r i e r s a l t , w e measured t h e
fol lowing q u a n t i t i e s i n t h e course of t h i s experiment: t h e concentrat ion
of 8.11 t h e major and most of t h e minor components i n t h e f eed sa l t t o t h e
s t i P P , $the concentrat ion of each component i n t h e condensate as it l e f t
28
t h e s t i l l p o t , t h e volume of l i q u i d f e d t o t h e s t i l l p o t , and t h e volume
of' l i q u i d c o l l e c t e d i n t h e r e c e i v e r . An e s t i m a t e 7 w a s made of t h e con-
c e n t r a t i o n o f each f i s s i o n product whose concentrat ion i n t h e feed sal t
was not measured. The estimate w a s based on t h e production ra te o f each
f i s s i o n product i n t h e MSRE and assumed that a l l t h e p recu r so r s of a
given f i s s i o n product remained i n t h e s a l t . This seemed t o be a f a i r l y
good assumption f o r i so topes having no long-lived gaseous p recu r so r s .
All t h e Concentrations were converted t o mole f r a c t i o n s ; t h e m o l e
f r a c t i o n s of r a d i o a c t i v e m a t e r i a l s were c a l c u l s t e d as of May 7 , 1969.
The volumes were determined by measuring t h e weight of l i q u i d over t h e
end of a bubbler , d iv id ing by a sa l t dens i ty of 2.2 g / m 3 t o o b t a i n t h e
depth of l i q u i d , and mult iplying t h i s va lue by t h e c ros s - sec t iona l area
of t h e p a r t i c d a r vessel t o o b t a i n t h e volume. We assumed t h a t t h e mass
dens i ty of t h e l i q u i d w a s independent of canposi t ion and t h a t t h e volume
of l i q u i d i n t h e s t i l l pot could be c a l c u l a t e d by s u b t r a c t i n g t h e volnne
of condensate c o l l e c t e d from t h e t o t a l volume of s a l t f e d to t h e s t i l l
from t h e feed t ank . Assuming t h a t molar volumes can be added (which i s
E f a i r l y gooti assumption f o r f l u o r i d e s a l t s ) , we c a l c u l a t e d m a s s d e n s i t i e s
f o r liquids i n t h e concec t r a t ion range seen i n t h i s experiment and found
only a 5% v a r i a t i o n ; hence, our assumption of constant d e n s i t y appears
t o be acceptable . The analyses of a l l t h e condensate samples are reported
i n t h e kppendix.
4 . 2 Materid Balance Calculat ions
~. .&? . . . . .
One of t h e most concise ways t o express t h e sepa ra t ion performance of &.&",
t h e d i s t i l l a t i o n equipment i s to convert t h e condensate analyses t o e f f e c t i v e
‘- r e l a t i v e v o l a t i l i t i e s with r e spec t t o LiF. The e f f e c t i v e r e l a t i v e
v o l a t i l i t y of component i with r e spec t t o LiF i s def ined as:
i-LiF = y /x a 9
LiP LiF
vhere y = mole f r a c t i o n i n t h e condensates
x = mole f r a c t i o n i n t h e s t i l l pot .
Although t h e composition of each component i n t h e still pot w a s not neas-
ured d i r e e t l y during t h e run , t h e d a t a allowed t h e composition of t h e
s t i l l pot t o be est imated from a mzterial balance f o r each component.
I n t h i s s e c t i o n , w e de r ive t h e material balance equations and o u t l i n e t h e
c a l c u l a t i o n a l procedure.
For t h e semicon t inu~us node of ope ra t ion , a d i f f e r e n t i a l mole balance
f o r component i gives:
where I = t o t a l moles f e d t o t h e still p o t ,
0 = t c t a l moles removed f r o m the s t i l l po t ,
= moles of component i i n t h e still p o t ,
= mole f r a c t i o n o f component i i n t h e f e e d ,
= mole f r a e t i o n of component i i n t h e condensate.
Mi
fi
y i
Since volume w a s t h e measured q u a n t i t y , we can make t h e following
s u b s t i t u t i o n s :
.. . ... . . .wiw . . . . . . .

where Vin = volume of' sa l t Ped t o t h e s t i l l p o t , l i t e r s ,
= v d m e of condensate co l l ec t ed$ l i t e r s
= p a r t i a l moEar volume" of component j, l i t e r s / m o k . v j
When w e s u b s t i t u t e t h e q u a n t i t i e s i n Eq. ( 3 ) i n t o Eq. (21, we o b t a i n :
f, Y,
f;
bJ
j -1 f .v
J j
v - in
= Mi = 0 at t h e start o f t h e experiment vout where the condi t ions V = i n
were used. The composition i n t h e s t i l l pot can be determined by so lv ing
f o r Ne f o r each component. This equation i s v a l i d up t o t h e p o i n t where 1
= 7.07 l i t e r s ( t h e ecd of t h e semicontinuous d i s t i l l a t i o n ) . vout
Sf M. moles of component i are p resen t i n t h e s t i l l pot and dbl P i
moles of component i are vaporized during t h e ba t ch d i s t i l l a t i o n , t h e
mole f r a c t i o n of component i i n t h e vapor i s given by
N
k-l
yi = 9
%
"Assumed t o be independent of t h e cornposition of t h e l i q u i d .
. . '.I:- =;' ...... ;
s i m i l a r l y , f o r component j ( i + j),
From Eqs . ( 6 ) and (91, w e ob ta in t he expression
Assuming t h a t t h e p a r t i a l molar volumes v
t i s n of t h e l i q u i d (as b e f o r e ) , w e multiply both s ides sf Eq. ( 9 ) by vi
and sum both s i d e s over all i to ob ta in t h e following equat ion:
are independent of t h e c o n p ~ ~ i - i
= volume of sa l t i n t h e still pot, l i t e r s . s t i l l where V
Sslving ~ q . (1.0) f o r CIM. y i e l d s : 9
In t eg ra t ing Eq. (11) y i e l d s :
~ Vst ill Y.
N dVst i i l 9
. . . . li ............ c "+..wp.
I I i=l
32
where %a = moles of component j present i n t h e s t i l l pot at t h e start j o of t h e batch d i s t i l l a t i o n ,
V = volume of sa l t i n s t i l l pot at start of batch d i s t i l l a t i o n .
The quan t i ty M i n Eq. (62) i s ca l cu la t ed by eva lua t ing Eq. (51, using
t h e va lues of v
6
j o ana vout t h a t correspond t o t h e end of t h e senicontinuous in
d i s t i l l a t i o n .
l i t e r s m a v ( A t t h e end of semicontinuous d i s t i l l a t i o n , Vin = 13.8
= 5.07 l i t e r s . ) TIE composition of t h e s t i l l pot i s out
determined by evaluat ing Eq. (12) for each component t h a t i s p resen t .
The i n t e g r a l s i n Eqs . ( 5 ) and (12) were evaluated by p l o t t i n g
Y .
vs t h e volume of condensate c o l l e c t e d i n t h e r ece ive r during t h e senzi-
continuous d i s t i l l a t i o n and
vs the s t i l l - p o t volume (ca l cu la t ed as explained previous ly) dcring t h e
batch d i s t i l l a t i o n , f i t t i n g t h e r e s u l t i n g curves t o simple empir ical
func t ions of t h e appropr ia te volume, and t hen i n t e g r a t i n g t h e s e equations e
For any component, a f a i r l y wide range of equat ion parameters f i t t h e
s c a t t e r e d da ta equal ly w e l l ; howevers t h e values sf the i n t e g r a l s were
not s i g n i f i c a n t l y s e n s i t i v e t o t h e s e v a r i a t i o n s i n t h e parameters. The N Tu’
sums r y i v i and f. v. were adequately represented by consider ing only 1 1 i=l
,.:. . . . . ..,. w.>.
t h e major s8lt components EiF, BeF2$ and ZrF4 s ince t h e mole f r a c t i o n s

3%
of t h e f i s s i o n products were n e g l i g i b l e as compared with t h e mole
f r a c t i o n s of t h e s e components.
Using Eqs. ( 5 ) and (121, we ca l cu la t ed the number of moles o f each
component present i n t h e s t i l l pot a t t h e t i m e each condensate sample was
t aken , The mole f r a c t i o n of each component i n t h e s t i l l pot at t h a t t i m e
w a s ca l cu la t ed using t h e following equation:
The measured values of yi and t h e c8 lcu la ted values of x. were then used
i n Eq. (1) t o c a l c u l a t e t h e r e l a t i v e v o l a t i l i t y of each component, wi th
1
r e spec t t o EiF, f o r each sample.
4.3 Resul t s of Relative ~ o l a t i l i t y Calcu la t ions
The e f f e c t i v e r e l a t i v e v o l a t i l i t i e s wi th r e spec t t o LiF of t h e
mafor sa l t components, B ~ F ana z ~ F ~ ~ ana of the f i s s i o n products 9 % ~ ~ 2
of t h e d i s t i l l a t i o n opera t ion , as obtained from t h e c a l c u l a t i o n s , a r e
given i n F igs . 14-17. I n t h e s e f i g u r e s , t h e most s e l f - cons i s t en t values
r e s u l t e d when t h e c a r r i e r salt composition i n t h e feed was assumed -to be
65-30-9 mole % LiP-BeF2-ZrF4 r a t h e r t han t h e s l i g h t l y d i f f e r e n t composi-
t i o n ind ica t ed by t h e ana lys i s of t h e sa l t from the f u e l s t o s
The d i f f e rence between t h e a n a l y t i c a l va lues and t h e values a c t u a l l y
.... . . . . . . . . :i <,w<pp used can probably be a t t r i b u t e d t o z i r c o n i m metal, which was presen t in
34
%,. . . . .... .... "
~
.
LlTEWS CONDEF6SATE COLLECTED
LITERS CONDENSATE COLLECTED

37
.. . ... .,.,. . . . . ..,by
0 2 3 4 5 6 a 8
LITERS CONDENSATE COLLECTED
Fig. 17. Effective Re la t ive V o l a t i l i t y of l a 7 C s , Showing Effect of Varying t h e AS SUE^ ~ e e d Concentrat ion of 1 3 7 ~ s .

t h e f u e l s torage tank a t the t i m e t h e ana lys i s w a s made but w a s f i l t e r e d
out when t h e sa l t w a s t r a n s f e r r e d t o t h e s t i l l feed tank.
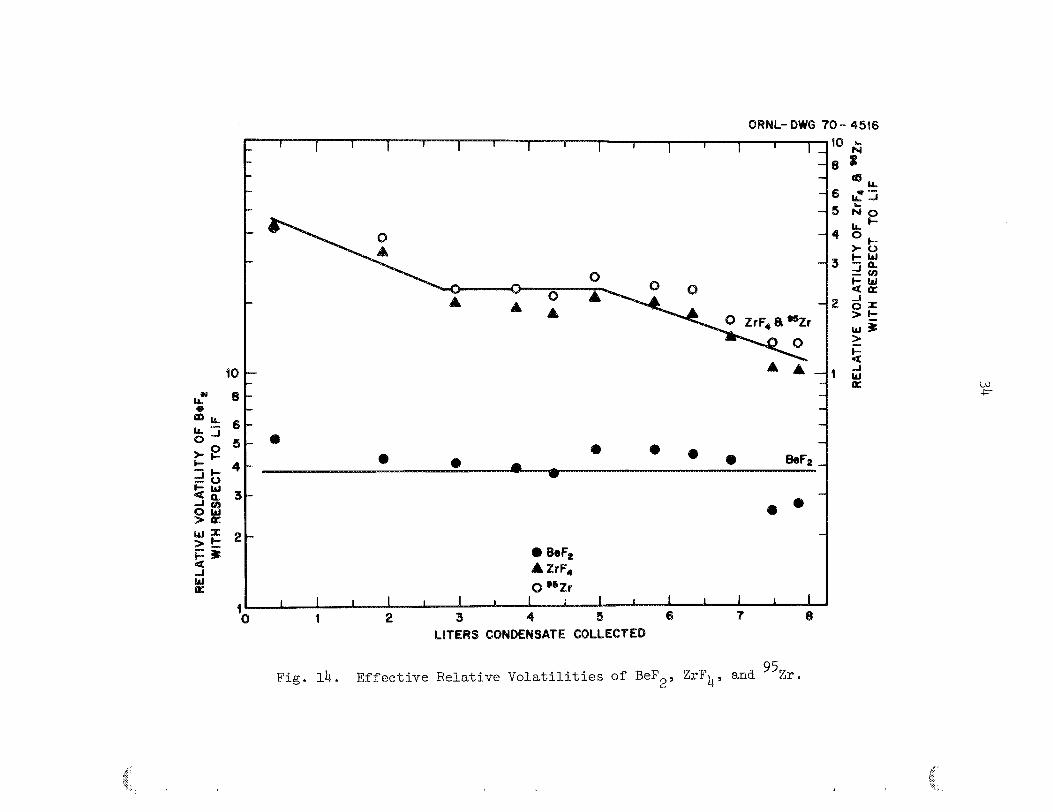
The e f f e c t i v e r e l a t i v e v o l a t i l i t i e s of BeF2' ZrF4, and 95Zr are
shorn i n Fig. 1 4 . The e f f e c t i v e r e l a t i v e v o l a t i l i t y of BeF w a s essen-
t i a l l y constanat during t h e run, exh ib i t i ng an average va lue o f 3.8.
value agrees favorably with t h e value of 3.9 measured by Smith, F e r r i s ,
and Thompson* but i s s l i g h t l y lower than t h e value of 4.7 measured by
Hightower and McNeese
t h e material balance ca l cu la t ions descr ibed ear l ie r ) and analyses probably
account f o r such d i f f e rences .
2
This
S l i g h t inaccurac ies i n ca l cu la t ions (especially
he e f f e c t i v e r e l a t i v e v o l a t i l i t i e s o f f i s s i o n product 9 5 ~ r and of
ZrF4, t h e c a r r i e r sa l t cons t i t uen t , are i n agreement with r e spec t t o
magnitude and v a r i a t i o n during t h e run .
i n t h e FST w a s used i n t h e r e l a t i v e v o l a t i l i t y c a l c u l a t i o n , t h e r e s u l t i n g
r e l a t i v e v o l a t i l i t i e s of t h e ZrF were about a f a c t o r o f 2 lower than t h e
values f o r "ZrS
value near 4 a t t h e start sf t h e run t o about l a t t h e end of t h e run.
When t h e ana lys i s of t h e sa l t
4 decreased from an i n i t i a l ZrFb -Lip Figure 1 4 shows t h a t a
'v
L These values bracket t h e value (2 .2 ) measured by Smith e t a l .
mixtures having a ZrF
i n sa l t
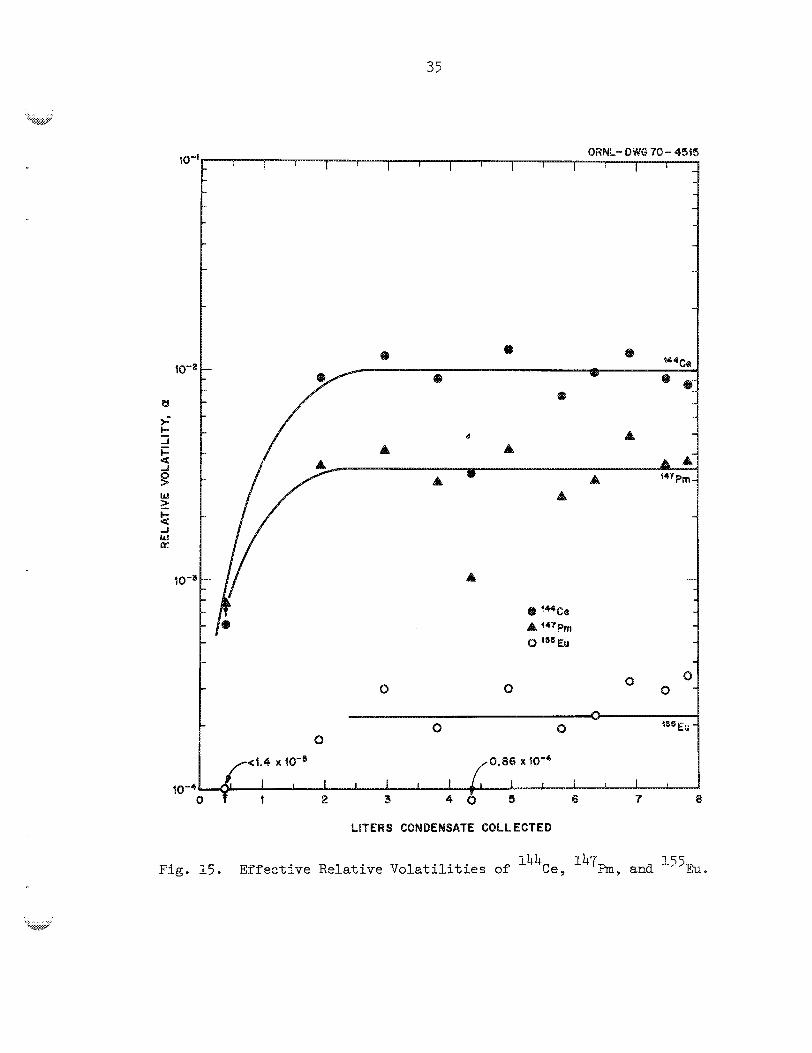
concentrat ion about 2% of t h a t i n t h i s system. 4 The e f f e c t i v e r e l a t i v e v o l a t i l i t i e s of t h e lan thanide f i s s i o n products
'44Ce:, l4'Prn, and 155Eu a r e shown i n F ig . 15.
v o l a t i l i t y of 144Ce ro se sharp ly from 6.1 x 10
sample t o about 1.0 x 10 where it remained f o r near ly a l l t h e subse-
quent samples. However, t h e r e l a t i v e v o l a t i l i t y f o r t h e f i f t h sample
The e f f e c t i v e r e l a t i v e
-4 at t h e t i m e of t h e f i r s t
-2
w a s lower than 1 . 0 x lo-' by a factor of 3.
1 . 5 t o 3.4 t i m e s the value measured i n an equi l ibr ium s t i l l , whereas t h e
The IGW i n i t i a l value w a s
. .. ... . . . . :...- .%. x;;...y

39
high, s teady va lue w a s 24 t o 56 t imes t h e va lue measured i n t h e
equi l ibr ium s t i l l .
The e f f e c t i v e r e l a t i v e v o l a t i l i t y 0% 147, w a s based on a computed
f e e d concen t r a t ion , which w a s considered t o be a more accu ra t e va lue
than t h e measured f eed concent ra t ion s i n c e measured concent ra t ions of
o the r l an than ide f i s s i o n products had agreed wel l wi th computed concen-
$ r a t i o n s A s i n t h e case of
low at t h e t ime t h e f i r s t sample w a s taken , t h a t i s , less than 7.8 x
10- ; it r o s e sharp ly to about 3.4 x POm3 f o r t h e remaining samples
144 Ce, t h e r e l a t i v e v o l a t i l i t y of L47h w a s
4
except f o r t h e f i f t h sample, which w a s low. There were no previo-Jsly
measured va lues f o r the r e l a t i v e v o l a t i l i t y of promethium wi th which
t h e s e r e s u l t s could be compared.
At t h i s p o i n t , it i s i n t e r e s t i n g t o note t h a t , when t h e e f f e c t i v e
r e l a t i v e v o l a t i l i t y of 147h w a s c d c u l a t e d on t h e b a s i s of t h e measured
concent ra t ion of l4’Rn i n t h e FST i n s t ead of on an est imated concentra-
t i s n , t h e ci f o r each sample, except t h e f i r s t , nea r ly coincided
wi th t h e r e s p e c t i v e c a l c u l a t e d po in t fsr 144Cee 1 4 7 h - L i P
The v a r i a t i o n sf t h e r e l a t i v e v o l a t i l i t i e s of 155Eu during t h e run
c l o s e l y p a r a l l e l e d t h e v a r i a t i o n s observed f o r 144Ce and 147F’m. Although
t h e value f o r t h e f irst sample w a s low ( l e s s t han 1.5 x 10⁻⁵), t h e va lues
f o r a l l subsequent samples, except t h e f i f t h , were much h ighe r , th8.t i s ,
about 2.2 x 10 . The va lue f o r t h e f i f t h sample was lower than t h i s by -4
a f a c t o r of 2.6. These c a l c u l a t e d e f f e c t i v e r e l a t i v e V Q h t i l i t i e S
(which were based on a computed f e e d concent ra t ion of 155Eu) were lower
.:.. . ........ :l ..&W ...,.,.,. . . .
than t h e va lue of 1.1 x measured i n r e c i r c u l a t i n g equi l ibr ium s t i l l s .
However, t h e accuracy of t h e ’55Eu va lues i s ques t ionable s i n c e some
40
d i f f i c u l t y w a s experienced i n making t h e analgrses; a l l of Zhe results
f o r " b u i n t h e condensate samples were repor ted as approximate (see
t h e Appendix). On t h e o the r hand, it i s s i g n i f i c a n t t h a t t h e v a r i a t i o n
during t h e run c l o s e l y p a r a l l e l e d t h e r e l a t ive v o l a t i l i t i e s Of %5rn,LiF
of 144,e and 147pm.
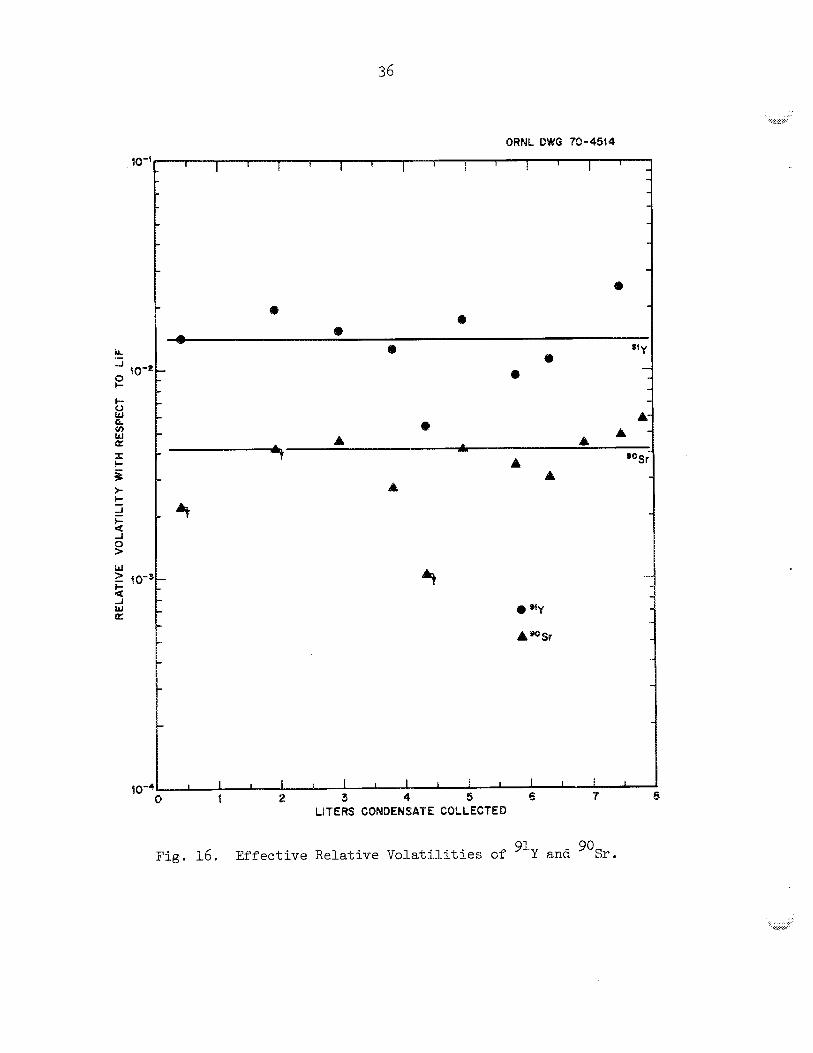
Figure 16 shows t h e e f f e c t i v e re la t ive v o l a t i l i t i e s of 91Y and "Sr.
During t h e run , t h e e f f e c t i v e r e l a t i v e v o l a t i l i t y of 91Y had an average
value of 1 . 4 x
equi l ibr ium s t i l l s .
t o v a r i a t i o n s of re la t ive v o l a t i l i t i e s of t h e lan thanides ; t h e low value
about 410 t i m e s t h e value measured i n r e c i r c u l a t i n g
The v a r i a t i o n of agl during t h e run w a s s i m i l a r Y-LiF
f o r t h e f i f t h smphe w a s most no t iceable .
The e f f e c t i v e r e l a t i v e v o l a t i l i t y of "Sy. (based on t h e measured
concentrat ion i n t h e f eed ) had an average value during t h e run of 4.1 x
10-39 about 84 t imes t h e va lue measured i n r e c f r c u l a t i n g equi l ibr ium
s t i l l s .
v o l a t i l i t y of "Sr (based on a computed Concentration i n t h e f eed ) w a s
Although not shown i n F ig . 16, t h e average value of t h e r e l a t i v e
0.193, about 3900 times t h e value measured i n equi l ibr ium s t i l l s . The
r a t i o of t h e 89Sr a c t i v i t y t o t he 90Sr a c t i v i t y i n t h e condensate samples
v a r i e d from 0.22 t o values g r e a t e r than 10 . It should have been about
0.002 f o r each sample o r , at t h e l e a s t , should have remained cons tan t .
Calculat ions of t h e e f f e c t i v e re la t ive v o l a t i l i t y of "7,s were
based on an est imated feed concentrat ion s ince t h e concent ra t ion of
137Cs i n t h e feed salt w a s not measured.
long-lived gaseous precursor (147Xe
t h e a c t u a l concentrat ion of 137C!s i n t h e sa l t t o be less than t h a t pre-
However, 137Cs has a f a i r l y
h a l f - l i f e = 3.9 min) t h a t causes
d i c t ed when t h e method o u t l i n e d ear l ier i s used. Also, because t h e
4 1
. . .. . .;.... . . . :; " . . . . . . . U,&
0
a c t u a l r e l a t i v e v o l a t i l i t y of CsF i s fairly high , t h e r e s u l t s of
ca l cu la t ions of t h e e f f e c t i v e r e l a t i v e v o l a t i l i t y are s e n s i t i v e t o t h e
assumed feed concentrat ion of 137Cs. Figure 17 shows ca l cu la t ed rela-
t i v e v o l a t i l i t i e s . of " 7 ~ s f o r two assumed feed concent ra t ions . e he
po in t s around t h e lower curve r e s u l t f rom t h e feed concentrat ion of
"'Cs which would apply i f a l l t h e precursors remained i n t h e sa l t
during MSRE opera t ion . These po in t s represent lower l i m i t s f o r t h e
e f f e c t i v e r e l a t i v e v o l a t i l i t y i n t h i s d i s t i l l a t i o n ; t h e po in t s around
t h e upper l i n e r e s u l t from a feed concentrat ion j u s t high enough t o keep
t h e computed concentrat ion of '37,s i n t h e s t i l l - p o t l i q u i d from falling
t o zero o r below, and represent upper l i m i t s f o r t h e e f f e c t i v e r e l a t i v e
v o l a t i l i t y 0%" 13',s. he highes t e f f e c t i v e r e l a t i v e v s l E t i l i t y of la7cs
seen i n t h e s e ca l cu la t ions was only about 20% of t h e value measured by
,Smith e t a l . i n LiP-BeF systems. 2
A s seen from t h e previous ca l cu la t ed r e s u l t s , a l l components except
beryl l ium and zirconium had e f f e c t i v e r e l a t i v e v o l a t i l i t i e s t h a t d i f f e r e d
(in some cases , d r a s t i c a l l y ) from values p red ic t ed f r o m work with equi-
librium systems. Some possible explanations for these discrepancies are
discussed i n t h e following sec t ion .
4.4 Poss ib le Explanations o f Calculated Resul t s
Poss ib l e causes f o r t h e d iscrepancies between t h e e f f e c t i v e r e l a t i v e
v o l a t i l i t i e s of some of t h e f i s s i o n products i n t h i s experiment and values
measured previously inc lude :
P iquid i n t h e vapors ( 2 ) concentrat ion g rad ien t s i n t h e s t i l l po t ,
(1) entrainment of d r o p l e t s of s t i l l - p o t
.. . ... .. ii.. ,.@
(3) contamination of samples during t h e i r p repara t ion f o r radiochemical
a n a l y s i s , and ( 4 ) inaccura te ana lyses . These p o s s i b i l i t i e s a r e discussed
below.
P
4 . 4 . 1 Entrainment of Droplets of 8 t i l l - P o t L i a s
Entrainment r a t e s of only 0.023 mole of l i q u i d pe r mole of vapor,
o r l e s s , would account f o r t h e high r e l a t i v e v o l a t i l i t i e s ca l cu la t ed f o r
t h e s l i g h t l y v o l a t i l e f i s s i o n products 1 4 4 ~ e , 147, , 9 l Y , and 9OSr.
Rates of t h i s order would not be r e f l e c t e d i n t h e e f f e c t i v e r e l a t i v e
v o l a t i l i t i e s of r e l a t i v e l y v o l a t i l e m a t e r i a l ( a 2 1). he h igh cor re la -
t i o n of t h e s c a t t e r of t h e ca l cu la t ed e f f e c t i v e r e l a t i v e v o l a t i l i t i e s of
d i f f e r e n t slightly v o l a t i l e f i s s i o n products i s cons i s t en t w i t h t h e
hypothesis t h a t entrainment occurred.
Although t h e r e w a s some evidence of entrainment during t h e non-
4 r ad ioac t ive opera t ion of t h e s t i l l , t h e considerably lower r a t e of
d i s t i l l a t i o n of t h e MSRE s a l t m k e s entrainment by t h e same mechanism
l e s s l i k e l y . Therefore , some o t h e r reason f o r entrainment i n t h e radio-
a c t i v e opera t ion should be sought. Evidence of a salt m i s t above t h e
sal t i n t h e pump bowl a t t h e ,KRE and a l s o above salt samples removed
from t h e MSWE has been r e p ~ r t e d ; ~ ” t h e s t u d i e s have ind ica t ed t h a t
t h e s e m i s t s a r e present over r ad ioac t ive salt mixtures but not over non-
r ad ioac t ive mixtures . According t o t h e r epor t ed d a t a , e i t h e r a m i s t
concentrat ion (grams of sa l t per em3 of g a s ) or a r a t e of formation of
m i s t (grams of sa l t pe r second) could be ca l cu la t ed . Entrainment r a t e s
s u f f i c i e n t l y l a r g e t o explain t h e r e s u l t s of t h i s experiment could only
be obtained by assuming t h a t t h e gas space above t h e salt contained sal t
m i s t having t h e same concentrat ion as t h a t seen i n t h e s t u d i e s , i n s t ead
43
+.&' . . . . . . . . . ,
of by assuming equal m i s t formation ra tes . However, t h e concentrat ions
ca l cu la t ed from t h e da t a were scarce ly adequate t o explain t h e en t ra ined
f r a c t i o n t h a t must have occurred. Furthermore, both t h e m i s t formation
r a t e and t h e concentrat ion of t h e m i s t would be expected to decrease
wi th decreasing decay power dens i ty i n t h e l i q u i d . Since t h e salt used
i n t h e d i s t i l l a t i o n experiment had a much lower decay power dens i ty than
t h e salt exmined f o r m i s t formation (400 days of coobing f o r 6 i s t i l l a -
t i o n f eed , as compared with l e s s than 36, days of cooling f o r sa l t sam$.es
t e s t e d f o r m i s t formation) , it seems un l ike ly t h a t t h e m i s t concentra-
t i o n would have been high enough t o explain t h e high r e l a t i v e v o l a t i l i -
t i e s f o r t h e s l i g h t l y v o l a t i l e f i s s i o n products .
I n add i t ion t o t h e argument aga ins t t h e entrainment hypothesis j u s t
given, not a91 t h e d iscrepancies , f o r example, t h e v a r i a t i o n s i n t h e
8'~r/ 90 ~r a c t i v i t y r a t i o of and t h e low v d u e for t h e e f f e c t i v e v o l a t i l i t y
of 137Cs, would be explained by t h e entrainment hypothesis .
4 e 4 e 2 Concentration Po la r i za t ion
Concentration p o l a r i z a t i o n would cause t h e e f f e c t i v e r e l a t i v e vola-
t i l i t i e s of t h e s l i g h t l y v o l a t i l e materials t o be h igher than t h e t r u e
r e l a t i v e v o l a t i l i t i e s . A s t h e more-volat i le materials w e r e vaporized
from t h e l i q u i d su r face , t h e s l i g h t l y v o l a t i l e ma te r i a l s would be l e f t
behind a t a higher concentrat ion than i n t h e l i q u i d j u s t below t h e su r -
face . I n turn, t h e vapor-phase concentrat ion of t h e s e s l i g h t l y v o l a t i l e
materisls would inc rease , s ince f u r t h e r vapor iza t ion would occur from
a l i q u i d wi th success ive ly higher concentrat ions of s l i g h t l y v o l a t i l e
materials. Thus, s ince e f f e c t i v e r e l a t i v e v o l a t i l i t i e s were based on
average concentrat ions i n t h e s t i l l pot, t h e vapor concentrat ion would

44
be higher than t h a t corresponding t o t h e average l i q u i d concent ra t ion ,
and t h e ca l cu la t ed e f f e c t i v e re la t ive v o l a t i l i t y would be h igher than
t h e t r u e r e l a t i v e v o l a t i l i t y , i f t h e concentrat ions a t t h e su r face of
t h e l i q u i d were higher than average. S imi l a r ly , concentrat ion polariza-
t i o n would cause t h e e f f e c t i v e r e l a t i v e v o l a t i l i t i e s of components with
r e l a t i v e v o l a t i l i t i e s higher than l t o be lower than t h e i r t r u e r e l a t i v e
v o l a t i l i t i e s . If mixing o r d i f f u s i o n d i d not reduce t h e concentrat ion
gradien t i n t h e l i q u i d , then t h e separa t ion performed by t h e s t i l l would
be adversely a f f ec t ed .
A s noted i n re f . 4, t h e ex ten t t o which concentrat ion p o l a r i z a t i o n
a f f e c t s t h e e f f e c t i v e r e l a t i v e v o l a t i l i t y of a p a r t i c u l a r component
depends on t h e dimens.ionless group D/vL, which q u a l i t a t i v e l y r ep resen t s
t h e r a t i o of t h e sa te of d i f f u s i o n of a p a r t i c u l a r component f r o l n t h e
vapor-liquid i n t e r f a c e i n t o t h e bulk of t h e s t i l l - p o t l i q u i d t o t h e r a t e
a t which t h i s material i s t r a n s f e r r e d by convection t o t h e i n t e r f a c e by
l i q u i d moving toward t h e vapor iza t ion sur face . I n t h i s r a t i o , D i s t h e
e f f e c t i v e d i f f u s i v i t y 0% t h e component of i n t e r e s t , v i s t h e v e l o c i t y o f
l i q u i d moving toward t h e i n t e r r a c e , and E i s t h e d i s t ance between t h e
i n t e r f a c e and t h e poin t where t h e f eed i s introduced.
The occurrence of concentrat ion p o l a r i z a t i o n i s suggested by t h e
sharp r i se , a t t h e beginning of t h e run, i n t h e e f f e c t i v e r e l a t i v e vola-
t i l i t i e s of 144Ce, 147h, "*Eu, and, poss ib ly , and 9oSr. This r i se
would correspond t o t h e formation of t h e concentrat ion gradien t a t t h e
beginning of t h e run. The e f f e c t i v e d i f f u s i v i t i e s sf NdF i n t h e s t i l l
pot ca l cu la t ed from r e s u l t s of t h e nonradioact ive experiments ranged
from 1 . 4 x lo-' t o 16 x 10-
3 4
4 2 em /see . They form the b a s i s f o r es t imat ing c.. .... :.;.

45
t h e magnitude of t h e concentrat ion p o l u i z a t i o n e f f e c t i n t h e r ad ioac t ive
opera t ion .
v e l o c i t y r e s u l t i n g from vapor iza t ion averaged 2.2 x 18
depth of l i q u i d above t h e i n l e t w a s approximately 9.4 cm.
During t h e semicontinuous opera t ion a t t h e MSRE, t h e l i q u i d
cm/sec and t h e -4
If one assumes
t h a t t h e e f f e c t i v e d i f f u s i v i t y of t h e f i s s i o n products i n t h e s t i l l pot
during t h e E R E D i s t i l l a t i o n Experiment w a s i n t h e same range as thet
seen during t h e nonradioact ive t e s t s
of t h e s l i g h t l y v o l a t i l e materials would be only 2.0 t o 18 t imes t h e
t h e observed r e l a t i v e v o l a t i l i t i e s
a c t u a l r e l a t i v e v o l a t i l i t i e s , and t h e observed r e l a t i v e v o l a t i l i t y of
I3'Cs would be 0.011 t o 8.021 t i m e s i t s t r u e value ( i n each case , assuming
%hat t h e t r u e r e l a t i v e v o l a t i l i t i e s were those given i n r e f s . 1 and 2 ) .
Although concent ra t ion p o l a r i z a t i o n may have been present i n t h e work
with r ad ioac t ive s a l t , t h e e f f e c t w a s l e s s important than t h a t needed t o
account f o r t h e d iscrepancies between observed r e l a t i v e v o l a t i l i t i e s and
what we consider t o be t h e t r u e va lues . Concentr-ation p o l a r i z a t i o n would
not expla in t h e v a r i a t i o n i n t h e r a t i o of t h e a c t i v i t i e s of @Sr- and "Sr
between sztmples.
4.4.3 Contamination Samples
The p o s s i b i l i t y t h a t t h e condensate samples were contaminated during
prepara t ion f o r ana lys i s i s suggested by t h e extreme v a r i a t i o n i n t h e
r a t i o of 89Sr and "Sr a c t i v i t i e s between samples. Although r o u t i n e
precaut ions aga ins t s m p l e contamination were taken i n t h e hot c e l l s
where t h e capsules were cu t open, no s p e c i a l precaut ions were taken.
(The sme manipulators t h a t are used t o handle MSRE salt samples were
employed f o r opening t h e s e condensate samples. 1
t h e source of t h e contamination w a s a sample from t h e MSRE taken just
If it i s assuaged t h a t
46
before t h e condensate analyses were sen t t o t h e hot c e l l s , then the
mount of r ad ioac t ive ma te r i a l necessary t o r e s u l t i n t h e observed va lues
of t h e r a t i o of 89Sr and "Sr a c t i v i t i e s w a s i n t h e range to g
per gram of sample. Prevention of such a low l e v e l of contamination i s
extremely d i f f i c u l t .
Other observat ions t h a t can be explained by assuming t h a t t h e samples
were contaminated a r e t h e high r e l a t i v e v o l a t i l i t i e s of t h e s l i g h t l y vol-
a t i l e f i s s i o n products and t h e high c o r r e l a t i o n between t h e v a r i a t i o n of
ca l cu la t ed r e l a t i v e v o l a t i l i t i e s of d i f f e r e n t f i s s i o n products. On t h e
other hand, t h e low r e l a t i v e v o l a t i l i t y for '3'Cs i s not explained by
t h i s hypothesis e
4.4.4 Inaccura te Analyses
The analyses f o r 95Zr, 137Cs, 144Ce, "Sr, and @Sr were made by
proved, r e l i a b l e methods and a r e considered t o be accu ra t e wi th in 2 5%.
The ana lyses f o r 14'h and "Y a r e thought t o be less r e l i a b l e b u t ,
never the less , accura te t o wi th in s -+ 10%. analysis for ' 5 5 , w a s d i f f i c u l t ;
t h e r e f o r e , t h e r e s u l t s a r e only approximate and t h e i r accuracy i s open
t o quest ion. 10
144 The analyses f o r Ce, which were made by gamma scanning and by
radiochemical separa t ion techniques using separa te po r t ions of t h e con-
densate samples, appeared t o be a c e m a t e . Good agreement w a s obtained
between the two sets of analyses .
,.. . . .,... :"
47
5. CONCLUSIONS
The fol lowing conclusions were dram from t h e r e s u l t s obtained i n
t h e experiment descr ibed above.
1. The separa t ion of f u e l c a r r i e r salt from the l an thanide
f i s s i o n products was demonstrated by processing 1 2 l i t e r s
of f u e l sa l t from an opera t ing r e a c t o r . Although t h e
volume of salt t h a t was processed w a s less than a n t i c i p a t e d ,
a l l t h e important features of t h e opera t ion were adequately
t e s t e d . The opera t ion of t h e equipment f o r t h i s run w a s
smooth and t rouble- f ree .
2. The e f f e c t i v e r e l a t i v e v o l a t i l i t i e s f o r BeP2 and ZrF4 (based on both n a t u r a l zirconim. and f i s s i o n product 952,)
agreed with previous l abor s to ry measurements.
The upper l i m i t of t h e r e l a t i v e v o l a t i l i t y of 13'C!s,
e f f e c t i v e i n t h i s run, w a s found t o be only about 28% of
t h e va lue measured i n t h e l abora to ry We cannot adequately
expla in t h i s discrepancy i n terns sf the occurrence of
l i q u i d entrainment , concent ra t ion p o l a r i z a t i o n i n t h e
s t i l l o r condensate s a p l e contaninat ion.
3.
4. The e f f e c t i v e r e l a t i v e v o l a t i l i t i e s for t h e lan thanide
f i s s i o n products 144Ce and n47h w e r e unexpectedly high.
The e f f e c t i v e r e l a t i v e v o l a t i l i t y of l 4 4 ~ e was about 56 t i m e s t h a t i nd ica t ed by previous measurements. No
previous measurements f o r '47h were ava i l ab le ; however,
t h e r e l a t i v e v o l a t i l i t y i s thought t o be c lose t o t h a t of
CeP3. It i s be l ieved t h a t the discrepancy between
observed values and previous measurements i s , in p a r t ,
due t o sample contamination.
5. Even i f t h e re la t ive v o l a t i l i t i e s of t h e lan thanides are
as high 8s seen here (W.019, adequate recovery of 7LiF from w a s t e sa l t streams by d i s t i l l a t i o n i s still poss ib l e .

48
Lf t h e r e l a t i v e v o l a t i l i t i e s o f t h e r a re -ea r th f l ~ o r i d e s
were as high as 0.01, only 3% of t h e rare e a r t h s would
be vo%atilized during vapor iza t ion of 95% of t h e PrEiP
i n a batch d i s t i l l a t i o n .
w
6. ACmowLmGmms
The au thors g r a t e f u l l y acknowledge t h e h e l p of t h e following people
i n t h e i n s t a l l a t i o n , opera t ion , and a n a l y s i s of t h e %RE D i s t i l l a t i o n
Experiment: P. M. Haubenreich, W. H. Guymon, E'. H. Harley, A. I.
Krakoviak, and M. Richardson, sf t h e Reactor Div is ion; W. W. Tucker of
t h e Instrumentat ion and Controls Div is ion , R. B. LindaUer of t he Chemical
Technology Divis ion; J. H. Moneyhun of t h e Analytical Chemistry Divis ion;
8. S. Jackson of t h e P lan t and Equipment Divis ion; and 8 . 0. Payne,
V. E. Fowler, J. Beams, F. L. Rogers, E. I?. Johns, and J. C. Rose,
t echn ic i ans i n t h e Unit Operations Sec t ion of" t h e Chemical Technology
Division.

49
7. REFERENCES
1.
2 .
3 .
4.
6.
7.
8.
9.
3. R . Hightower, Jr., and %. E. McMeese, Measurement of t h e Re la t ive
V o l a t i l i t i e s of Fluorides of Ce, La, P r , Nd, Sm, Eu, B a , S r , Y, and
Zr i n Mixtures sf LiF a-BeF,, OWNL-TI-2058 (January 1968).
F. J. Smith, L. M. F e r r i s , and C . T. Thompson, Liquid-Vapor E q u i l i b r i a
i n LiP-BeF, and LiF-BeF,-ThF4 Systems, OWML-4415 (June 1969).
W. E. Carter , R . B. Lindauer, and L. E. McNeese, Design of an
Engineering-Scale Vacuum D i s t i l l a t i o n Experiment f o r Molten S a l t
Reactor Fuel , OR63L-TM-2213 (November 1968 9 - J. 3. Hightower, Jr., and E. E. McNeese, Low-Pressure D i s t i l l a t i o n
o f Kolten Fluoride Mixtures : Nonradioactive Tests f o r t h e MSRE
D i s t i l l a t i o n Experiment, OREL-4434 (January 1971).
$1. 'd. Rosenthal, 9
L L
OR€&-4919, F. 76.
M. W. Wosenthal,
OREL-4396, p. 24.
E. E. Compere., ORNL, personal communication, July 1, 1969.
M. W. Rosenthal , Y
ORm-4254, p . LOO.
M. W. Wosenthal, MSR P r o g r t ~ ~ ~ Semiann. Progr. Rept. Feb. 28, 1969,
0~~~-4396, p. 1-45.
J. H. Moneyhm, QRNL, pe r sona l conmunication, Feb. 9, 1970.


8 . APPENDIX: ANALYSES O F SAmEES PROM TEE YSRE DISTILLATIOM EXPEPIPbEITT
.. .. ... ... ~ .,.,.,. . . . .
.X&,P

53
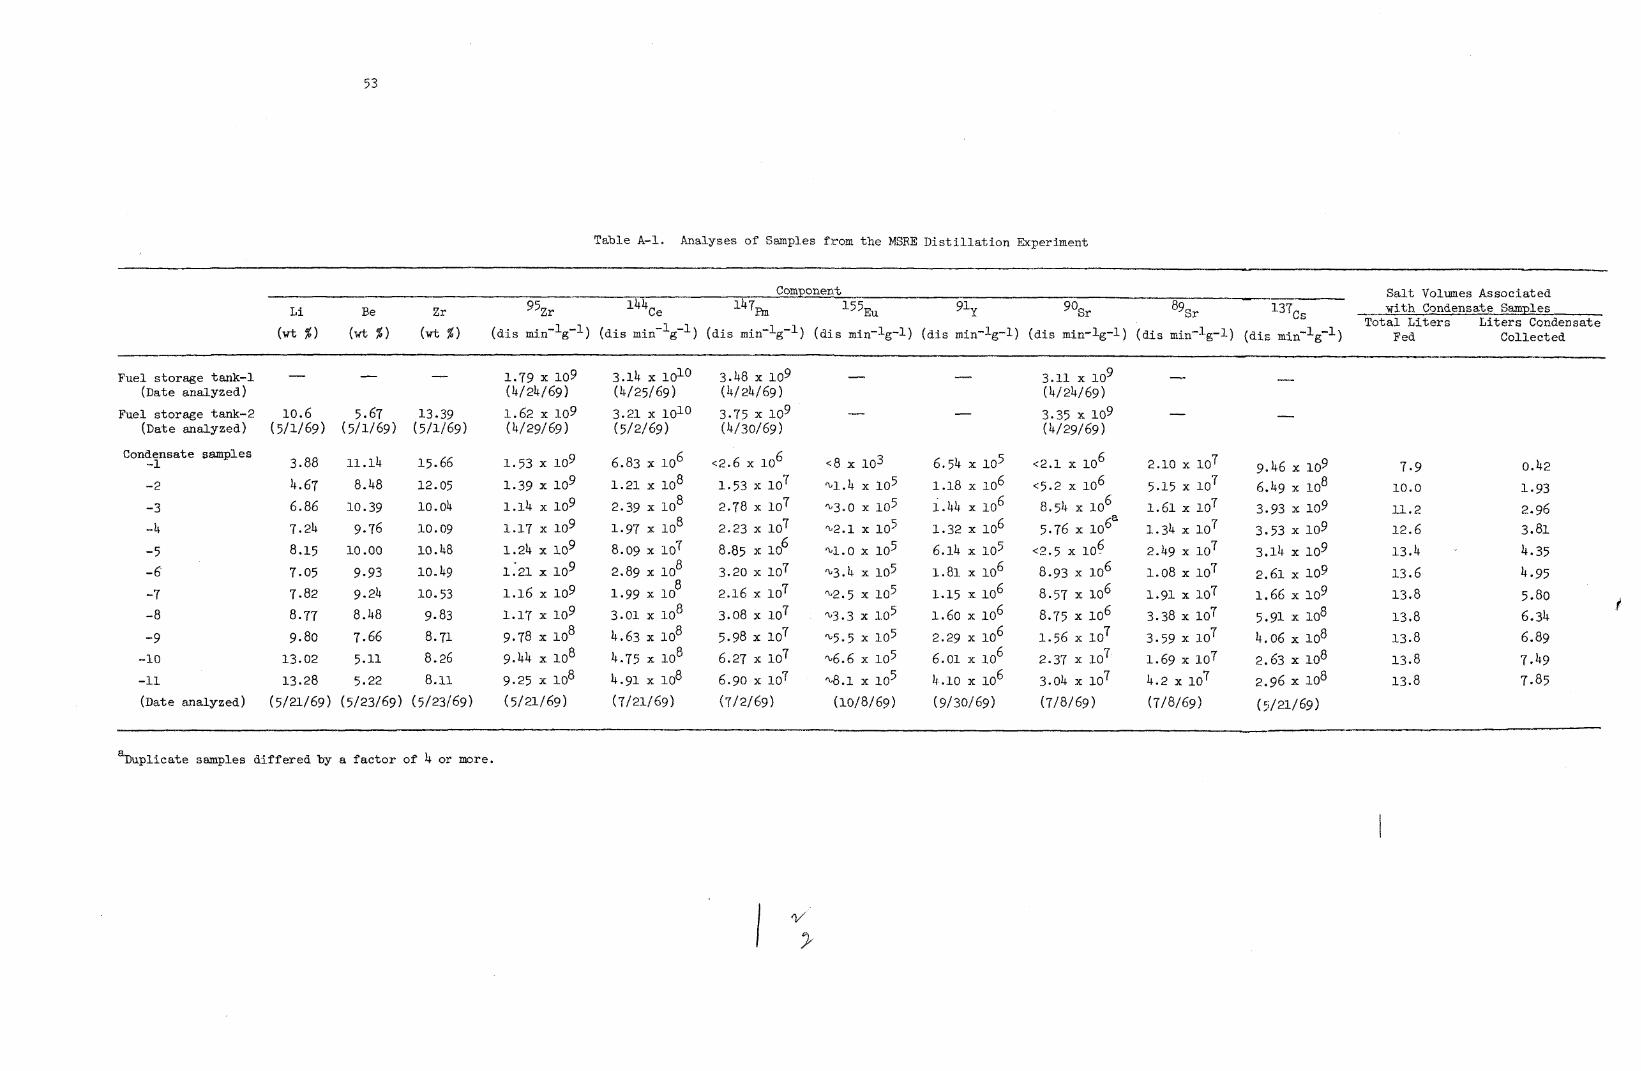
Table A - l . Analyses of Samples from the MSRE D i s t i l l a t i o n Experiment
S a l t Volumes Associated wi th Condensate Samples
Total L i t e r s Li te rs Condensate L i Be Zr
( w t % ) (wt. % ) ( w t $) (ais rnin-lg-l-1 (dis min-lg-') (dis min-lg'l) (a is mira'lg-1) ( d i s min-lg-1) (ais min-lg-1) ( d i s min-lg-1) (dit, mTn'-lg-') Fed Collect ea
Fuel storage tank-1
Fuel storage tank-2
(Date analyzed)
(Date analyzed)
Condensate samples -1
-2
-3 -4 -5 -6 -7 -8
-9 -10
-11
(Date analyzed 1
3.88 11 .14 15.66
6.86 10.39 10.04
4.67 8.48 12.05
7.24 9.76 l.o.09
7.05 9.93 i o . 49 8.15 10.00 10.48
7.82 9.24 10.53 8.77 8.48 9.83 9.80 7.66 8.71
13.02 5.11 8.26 13.28 5.22 8.11
(5/21/69) (5/23/69) (5/23/69)
1.53 109 1.39 x lo9 1.14 x l o 9 1.17 109
1121 109 1.16 109
1.17 1 ~ 9 8 9.78 x 1 0
9.44 x 1 0 8
9.25 x 10⁸
1.24 x 10'
(5/21/69)
6.83 x lo6
8 2.39 x 10 8 1.97 x 10
8.09 x lo7 8 2.89 x i o 8 1.99 x 10
3.01 x 10 8 8 4.63 x 10 8 4.75 x 10
4.91 x 10⁸
1 . 2 1 x 10⁸
(?/21/69)
6 <2.6 x i o 1.53 x 10'1 2.78 x 10⁷
2.23 107 8.85 x 10 6
3.20 x l o 7 2.16 x 10⁷
3.08 107 5.98 107 6.27 107
(7/2/69 1 6.90 x 10⁷
6.54 105 1.18 x 10⁶
6 1.44 x 10
1.32 x 10⁶ 6.14 x l o 5
6 1.81 x 10 6 1.15 x i o
1.60 x l o 6 6 2.29 x i o 6 6
6.01 x 10
4.10 x 10
( 9/30/ 69)
6 6 6 8.54 x 1 0 6& 5.76 x 10
6 e . 5 x 1 0 . 6 8.93 x 10
8.57 x 10 6
8.75 x 10⁶
1.56 x 1Q7 7 2.37 x 10
<2.1 x 1 0
<5.2 x 10
3.04 107 (7/8/ 69 1
9.46 109 6.49 x l o8 3.93 x 10⁹ 3.53 109 3.14 109 2.61 x 10⁹ 1.66 x 10⁹ 5.91 x lo8 4.06 x l o8 2.63 x l o8 2.96 x lo8
( 5/ 21/ 69 1
7.9 10.0
11.2
12.6
13.6 13.4 1
13.8 13.8 13.8 13.8 13.8
0.42 1.93 2.96 3.81 4.35 4.95 5.80 6.34 6.89 7.49 7.85
8 k p l i e a t e samples differed by a f a c t o r o f 4 or more.


55
ORNL-4574 UC-80 -Reactor Technology
INTERNAL DISTRIBUTION
1-3. Central Research Library 4-5. FlSRP Director's Qffice 6. OWE - Y-12 Technical Library
Document Reference Section 7-41. Laboratory Records Department 42. Laboratory Records, ORNL R.C. 43. R. K. A d a m 44 . e. M. Adamson 45. s. E. Anderson 46. C . F. Baes 4 7 . 6 . E. Bamberger 48. C. J. Barton 49. H. F. Bauman 50. S. E. Beall 51. M. J. Bell 52. E. S. Bettis 53. R. E. Blaneo 54. P. F. Blankenship 55. J. 8 . Blomeke 56. R. Blumberg 57. E. G . Bshlmann
59. J. Braunstein 68. M. A . Bredig 61. R. B. Briggs 62. s. Cantor 63. W. L. Carter 64. M. D. Cochran, Jr. 65. E. k. Compere 66. W. H. Cook 67. B. Cox 68. J. L. Crowley 6 9 . P. E. C u l l e r 70. J. PI. DeVan 71. S. J. D i t t o 72. W. B. Eatherly
74. D. E. Ferguson 75. L. M. Ferris 76. A. P. Fraas 77. W. R. Grimes 78. A. G . Grindell 79. R. H. Gupon 80. B. A. Hannaford
82. P. N. Haubenreich 83. R. F. Hibbs
58. G . E. Boyd
73 . J. a. Engle
81. P. B. Harley
84-85. J. R. Hightower, Jr. 86. H. W e Hoffman 87. R. W. Horton 88. W. H. Jordan 89. P o R . Kasten 98. C. Id. Kee 91. M. J. Kelly 92. S. %. Mirs1is 9 3 . J . W. Koger 94 . K. B. Korsmeyer 95. A . I. Krakoviak 96. T. S. Kress 97. J. A . Lane 98. R. B. Eindauer 99. A. P . Litman
100. M. I. Lundin 101. H. G . MacPherson 102. J. C. Mailen 103. H. E. McCoy 104 . L. E. McNeese 105. A . S. Meyer 166. R. L. Moore
188. 9. P. NickoPs 109. E. L. Nicholson 110. A. N. Perry 111. J . E. Redford 112. M. Richardson 113. G . D. Robbins 114. K. A . Romberger 115. J. Roth 116. W. P. Schaffer 117. Bunlap Scott 118. J. H. Shaffer 119. M. J . Skinner 120. A. N. Smith 121. E'. J. Smith 122. D . A. Sundberg 12%. R. E. Thsrna 124. I). B. Trauger 125. Chia-Pao Tung 126. W. E. Unger 127. G . M. Watson 128. A. M. Weinberg 129. J. R. Weir 130. M. E. Whatley 131. J . C. White
107. D . M. F f Q U 1 t O n

56
3.32. Gale Young 136. 6. E. Ice (consu%tant) 133. E. L. Youngblood 134. P . H. Emmett (consultant) 138. R. €3. Richards (consultant) 135. J. J. Katz (consultant)
137. E. A . Mason (consultant)
EXTERNAL DISTRIBUTION
139. A. Giambusso, U.S. Atomic Energy Commission, Washington, D . C . 140. Kermit Laughon, AEC Site Representative, ORNL
143. M. Shaw, U.S. Atomic Energy Commission, WashPngt~n, D.C. 144. 3 . A . Swartout, Union Carbide Corporation, New Y w ~ , N . Y . 10019 145. Laboratory and University Division, AEC, OR0 146. Patent Office, AEC, OR0
141-142, T. W. McIntosh, U.S. Atomic Energy Commission, Washington, B.C.
147-149. Director, Division of Reactor Licensing, U.S. Atomic Energy
150-151. Director, Division of Reactor Standards, U.S. Atomic Energy
152-375. Given distribution as shown in TIB-4500 under Reactor Technology
Commission, Washington, D.C.
Commission, Washington, D e C .
category (25 copies - NITS)
.... .: w,.;.;.>y Y