o for aeronautics - nasa · (the airfoil terminology and methodof calculating ordinates are...
TRANSCRIPT

r-
=.
O
O
= •
f
F
[
Lit
....,,,_,................. RECEIVEDz ......
JUN u i_oz
Engineering Files
NATIONAL ADVISORY COMMITTEE
FOR AERONAUTICS
TECHNICAL NOTE 2670
HIGH-S]; SUBSONIC CHARACTERISTICS OF
16 NACA 6-SERIE_AIRFOIL SECTIONS
By MiltOn D. Van Dyke
Ames Aeronautical Laboratory
Moffett Field, Calif.
r- _-+,++:ASERETUPN TO
March 1952
=
Z
.... rm-: _ .......
. z
Z
https://ntrs.nasa.gov/search.jsp?R=19930083777 2018-09-15T17:06:14+00:00Z

t

iBNATIONAL ADVISORY COMMITTEE FOR AERONAUTICS
TECHNICAL NOTE 2670
HIGH-SPEED SUBSONIC CHARACTERISTICS OF
16 NACA 6-SERIES AIRFOIL SECTIONS
By Milton D. Van Dyke
SUMMARY
wind-tunnel investigation has been conducted to determine the
high-speed subsonic aerodynamic characteristics of N_CA 63-, 64-, 65-,
and 66-series airfoil sections having thicl_ess ratios of 6, 3, i0_
and 12 percent and an ideal lift coefficient of 0.2 with the uniform-load
type (a = 1.0) of mean camber line. Section drag, lift, and pitching-
moment coefficients measured at Mach numbers as high as 0.90 are pre-
sented for angles of attack from -6 ° to i0 ° or 12 ° .
For each thickness ratio, only a slight impairment of high-speed
section drag characteristics results from forward movement of position
of minimum base-profile pressure up to 40 percent of the chord. At the
same time_ however_ decrease of lift-curve slope and increase of angle
of zero lift, both of which adversely affect longitudinal stability and
control, are delayed further beyond the critical Mach number. Hence it
is concluded that_ for 6-series airfoil sectlons of a given thickness
ratio_ those with minimum pressure near 40-percent chord possess optimum
over-all aerodynamic characteristics.
Appreciable improvement in the hlgh-speed drag of airfoil sections
can be achieved only by decreasing their thickness ratio. Fortunatelyj
the accompanying reduction in range of lift coefficient for good high-
speed section characteristics is, for these 6-series airfoilsj much less
severe than consideration of the theoretically predicted critical Mach
number would indicate.
INTRODUCTION
In order to avoid excessive power requirements at subsonic speeds_
the airfoil sections for an airplane wing of given plan form must be
chosen so that the abrupt rise in drag associated with the formation of
shock waves is delayed to the highest possible speed. Airfoil sections
of the NACA low-drag type have critical speeds already so near to the
optimum value for any given thic1_ess ratio (reference i) that appreciable

2 NACATN 2670
improvementcan be achieved only by further reduction in thickness. Onthe other hand_ structural considerations and the desirability of obtain-ing a high maximumlift coefficient prescribe as thick a wing as is con-sistent with the attainment of the required high speed. Present practiceis to choosewing sections of such thickness that the marked drag increaseassociated with the formation of shockwaveswill commencealmost immedi-ately upon exceeding the maximumlevel-flight design speed.
This practice might on first thought appear to be a hmppycompro-mise. Cnfortunately_ however_other adverse effects of compressibility_of a more treacherous nature_ often manifest themselves at or slightlyabove the speed at which the marked drag rise begins. Chief amongtheseare an abrupt increase in angle of zero lift for camberedairfoils and apronounced reduction in lift-curve slope. Both have a deleterious influ-ence upon the airplane trim and longitudinaly stability and control_ asdiscussed for unsweptwings in reference 2.
If the speedat which these adverse effects commenceis exceededbythe airplane_ as in a dive, the increase of angle of zero lift coupledwith a decrease in lift-curve slope alters the trim to promote a furtherdiving tendency. Concurrently, greater stability results from the reduc-tion of lift-curve slope and from adverse changes in wing pitching moment.In extreme cases the increase in stability is so great that recovery fromthe dive cannot be effeeted by use of normal elevator control. Loss ofthe aircraft will follow unless drag at lower altitudes limits the speedsufficiently to re-estabilish elevator control_ or other morepowerfulmeansof obtaining longitudinal control are provided. It would accord-ingly appear desirable to choosefor a high-speed airplane an airfoilhaving, at the design lift coefficient_ as high a critical speedas isconsistent with structural limitations and_ further, having as smalladverse effects as far beyond that speedas possible.
In the case of a bomber, the level-flight lift coefficient will_ary through a wide range even on a single flight as a result of changesin loading causedby fuel consumption and disposal of bombs. In the caseof a fighter aircraft_ a similarly wide range of operating lift coeffi-cient will be required to attain satisfactory maneuverability. The idealairfoil for high-speed aircraft would therefore maintain the desiredhigh-speed characteristics throughout a broad range of lift coefficient.That this ideal maybe difficult to achieve is indicated by theory whichpredicts that_ as the critical speed of an airfoil is increased byreducing its thickness 3 the range of lift coefficient over which favor-able high-speed characteristics are realized shrinks rapidly.
Becauseexisting theory cannot be relied upon to predict theseconflicting effects accuratelyj the choice of optimumsubsonic airfoilsmust be guided by experiment. Accordinglyj in 1945 and 1947tests wereconducted in the Amesi- by 3-i/2-foot high-speed wind tunnel to deter-mine the subsonic characteristics of 16 NACA6-series airfoils havingvarious thickness ratios and positions of minimumpressure. The results

NACATN 2670 3
for 12 airfoils were originally published in 1945 in a report of limitedcirculation by Milton D. Van Dyke and Gordon A. Wibbert which was supple-mented in 1947 by data for the 63-series sections published in a report oflimited circulation by Richard J. llk. These results are combined in thepresent report, and the discussion is somewhatrevised, notably by includ-ing an analysis of the data according to the transonic similarity rule.
SYMBOLS
c
Cd
Cdcr
cz
Clmax
emc/4
dc Z
d_
D I, D 2
mcL
M
Mcr
R
t
_O
_cr
airfoil chord length
section drag coefficient
section drag coefficient at theoretical critical Mach number
section lift coefficignt
maximum section lift coefficient
section pitching-moment coefficient about quarter-chord point
section lift-curve slope, per degree
reduced section drag coefficient functions in transonic
similarity rule
(See equations (2) and (4).)
reduced section lift-curve-slope function in transonic
similarity rule
(See equation (6).)
free-streamMach number
theoretical critical free-streamMach number
free-streamReynolds number based on chord
airfoil maximum thickness
section angle of attack, degrees
transonic similarity parameter [ M-_e/ I ](t/c) 21SJ
transonic similarity parameter at theoretical critical Mach
number IMcr2 2/1]

APPARATUSANDMETHODS
NACATN 2670
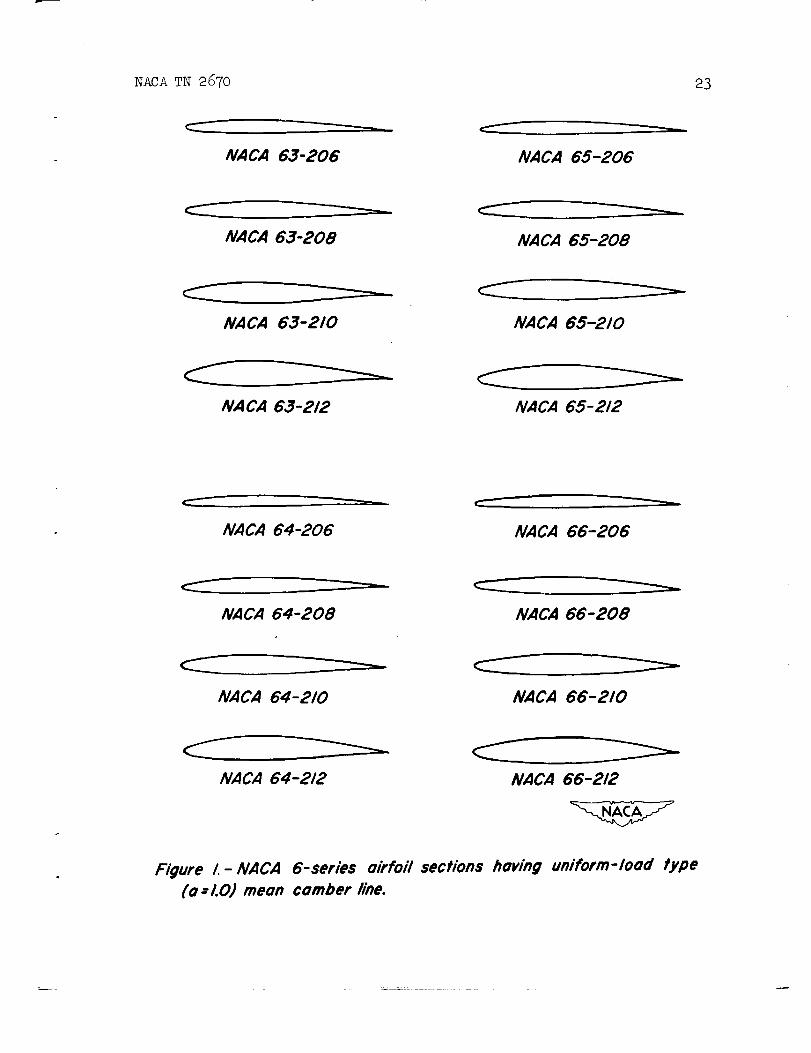
The following 16 NACAlow-drag airfoil sections, having uniform-load type (a = 1.0) meancamber line, were tested:
63-206 64-206 65-206 66-20663-208 64-208 65-208 66-20863-210 64-210 65-210 66-21063-212 64-212 65-212 66-212
The models were of 6-inch chord, polished aluminum alloy construc-tion, and completely spanned the 1-foot width of the tunnel test section.End leakage was prevented by a compressedrubber gasket at each end ofthe airfoil to assure two-dimensional flow. Sketches of the airfoilsappear in figure I, and the ordinates for each section are presented intable I. (The airfoil terminology and method of calculating ordinatesare described in reference 3.)
The Amesi- by 3-1/2-foot high-speed wind tunnel, in which the testswere conducted, is a two-dimensional flow, low-turbulence, single-return-type tunnel. It is powered by two lO00-horsepower electric motorsdriving oppositely rotating propellers. This power is sufficient in allcases to choke the tunnel.
The airfoil lift and pitching momentwere determined by tunnel-wall-reaction measurements,using a method similar to that described formeasurementof lift in the appendix to reference 3. Previous tests havedemonstrated excellent agreement at all Machnumbersbetween lift andpitching-moment characteristics as determined from wall-reaction measure-ments and from integration of simultaneously obtained pressure distri-butions.
Drag was determined by the wake-survey method using a movable 9-inch-wide rake of 35 total-head tubes. The rake was movedto take necessaryadditional readings when the wake width was greater than 9 inches at thedrag-rake station. It was not possible to evaluate the entire drag atthe choking Machnumberbecause the airfoil wake then extended from thefloor to the ceiling of the tunnel test section. Drag coefficients werecomputedby the method of reference 4.
For all tests, the free-stream Machnumberranged from 0.30 to thetunnel choking speed - approximately 0.90 Machnumberat low angles ofattack. The corresponding variation of Reynolds numberwas from one tonearly two million for the 6-inch-chord models investigated. (Seefig. 2.) Each airfoil was tested at angles of attack varying by incre-ments of 2° from -6° to i0 ° or 12°,e which range was ordinarily
2In the case of the NACA65-206 and 66-212 airfoils, the actual angleswere 0.5° greater than these values.
NACATN 2670 5
sufficient to determine the stall. Settings for angle of attack arebelieved to be accurate to within ±0.i0°; relative readings for any oneairfoil are reliable to within ±0.05° .
TESTRESULTS
Drag, lift, and quarter-chord pitching-moment coefficients at con-stant angle of attack are plotted for each of the 16 airfoils as functionsof free-streamMach number M in figures 3 to 50. Corresponding crossplots at constant Machnumberpresent, in figures 51 to 98, the variationof section lift coefficient with angle of attack, and of section dragand pitching-moment coefficients with lift coefficient. All data havebeen corrected for tunnel-wall interference by the method of reference 5.
In figur s 3 to 50, the experimental point shownat the highestMachnumber for each angle of attack was obtained with the wind tunnelchoked. Except for the pitching moment,data obtained at the chokingspeed can be repeated with good agreement. However_it is showninreference 5 that the choked condition cannot be corrected to free-airflow since, in fact, no equivalent free-alr flow exists. The usual cor-rection procedure has nevertheless been applied to these data_ and theresults are presented as a matter of interest.
These data are considered to be unreliable not only at the chokingspeed, but also within somerange of Machnumberbelow this limit. Shockw_vesbegin to form on one or both surfaces of an airfoil soon after thecritical Machnumberof the section is exceeded. At somehigher speedthey will have extended sufficiently far across the tunnel so that theirinteraction with the tunnel walls can no longer be neglected. An attempthas been madein figures 3 to 98 to indicate by a dashed line the possibleextent of the Machnumberrange below choking within which the data areat least quantitatively unreliable. This range may logically be presumedto be greater at high angles of attack since one surface of the airfoilthen shocks at a Machnumberfar below the choking Machnumber.
DISCUSSION
Drag Coefficient
Subcritical characteristics.- Within the low-drag range of lift
coefficients, figures 3 to l_show that the section drag coefficient at
constant angle of attack decreases slightly in most cases until a Mach
number of 0.40 is reached; this is probably a consequence of increasing
Reynolds number rather than any compressibility effect. From this point
on, whether considered at constant angle of attack or, as in figure 99, at
constant lift coefficient, the drag coefficient remains essentially un-changed until the predicted critical Mach number of the airfoil is exceeded.

6 NACATN 2670
A curious phenomenonappears in figures 3 to 18 for higher anglesof attack. After an initial rise with Machnumber, the drag coefficientdrops to a "trough" immediately preceding the final abrupt rise. Thistrough appears to be characteristic of NACA6-serles airfoils. It appearsalso in tests of NACA652-215 (a = 0.5) and 66, 2-215 (a = 0.6) airfoils,but is absent in the case of NACA0015 and 23015 airfoils and scarcelydiscernible in the case of the NACA4415 section. (See reference 6.)The trough becomesmore gentle if the variation is considered at constantlift coefficient, as in figure 100(a), rather than at constant angle ofattack. The cause of this trough has not been determined. It is inter-esting to note that a similar variation of drag was reported for circularcylinders in reference 7. Balance measurementsof the drag of cylindersof various diameters (representing Reynolds numbersof from 0.06 x 10⁶ to0.25 x i06 at 0.65 Machnumber) showedin each case a trough of the sameform. (See fig. lO0(b).)
Because the forces to be measuredvary over a wide range, resultsat low Machnumbers are unduly affected by errors in tares and zeroreadings which are negligible at higher speeds. For this reason, low-speed values of drag should be considered as qualitatively rather thanquantitatively correct. For example, the consistent reduction in low-speed drag coefficient expected to accompanyrearward movementof theposition of minimumbase-profile pressure is not evident in figure 99-
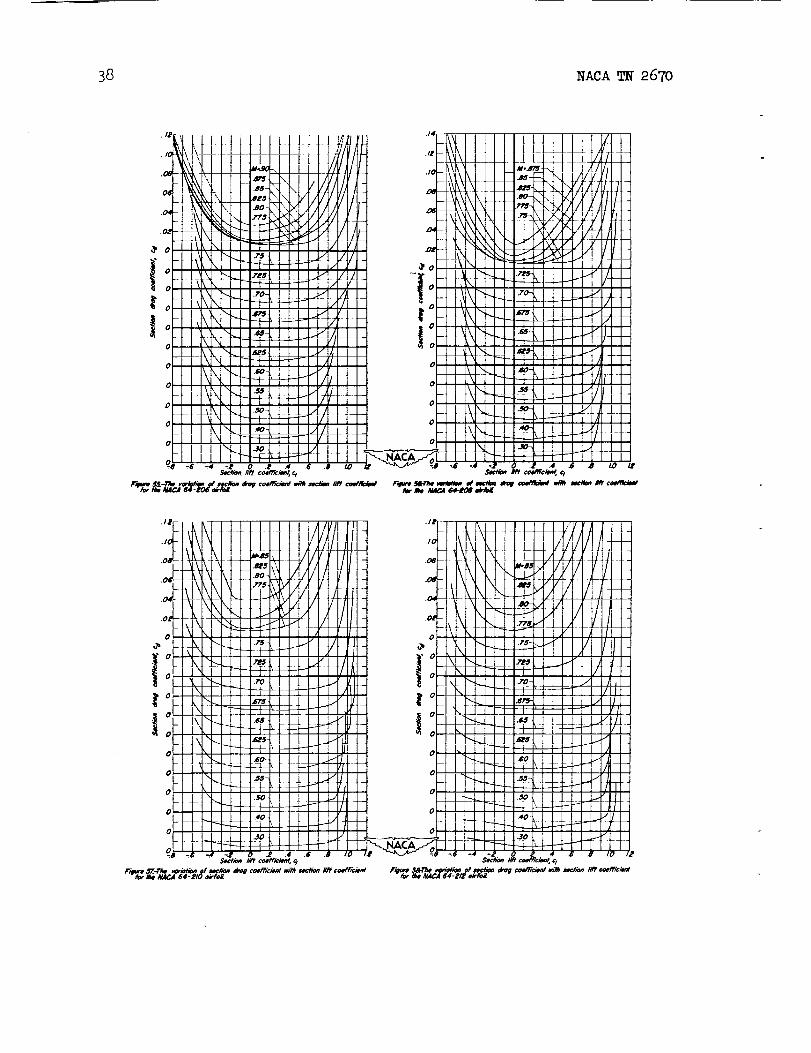
Low dra6 ran6e.- At low speeds, the drag polar curves for these
airfoils exhibit a characteristic "bucket" (reference 3). The drag has
a low value within the range of lift coefficients for which the minimum
pressure points on both surfaces lie well back on the airfoil. Outside
this range the drag jumps sharply to a higher value. The present tests
do not provide enough points to show this variation accurately. Measure-
ments were made at increments of not less than 0.2 lift coefficient,
whereas the extent of the low drag range is at most 0.4 lift coefficient
at low speeds. Therefore, only one or two test points are a_ilable
within the low drag range. Many more points would be required, particu-
larly near the ends of the region, to trace the typical bucket curve.
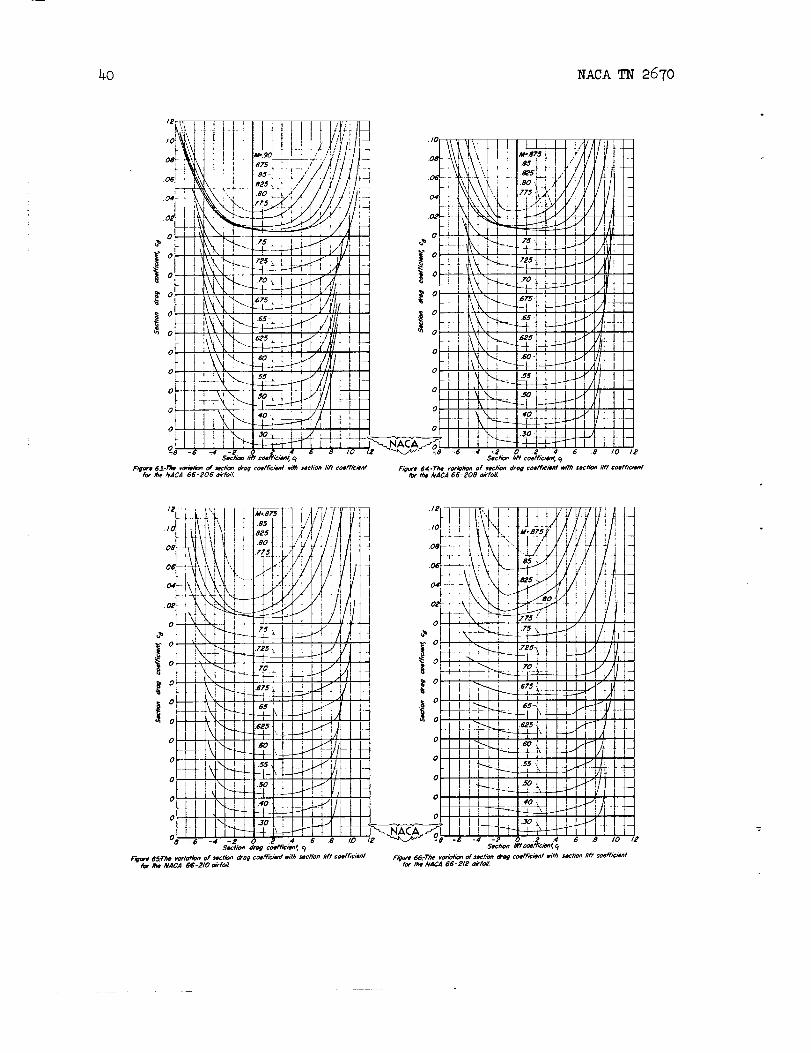
However, despite the fact that the drag curves (figs. 51 to 66) were
obtained by fairing through widely separated points, they give, particu-
larly for the thicker sections, a suggestion of the typical bucket shape.
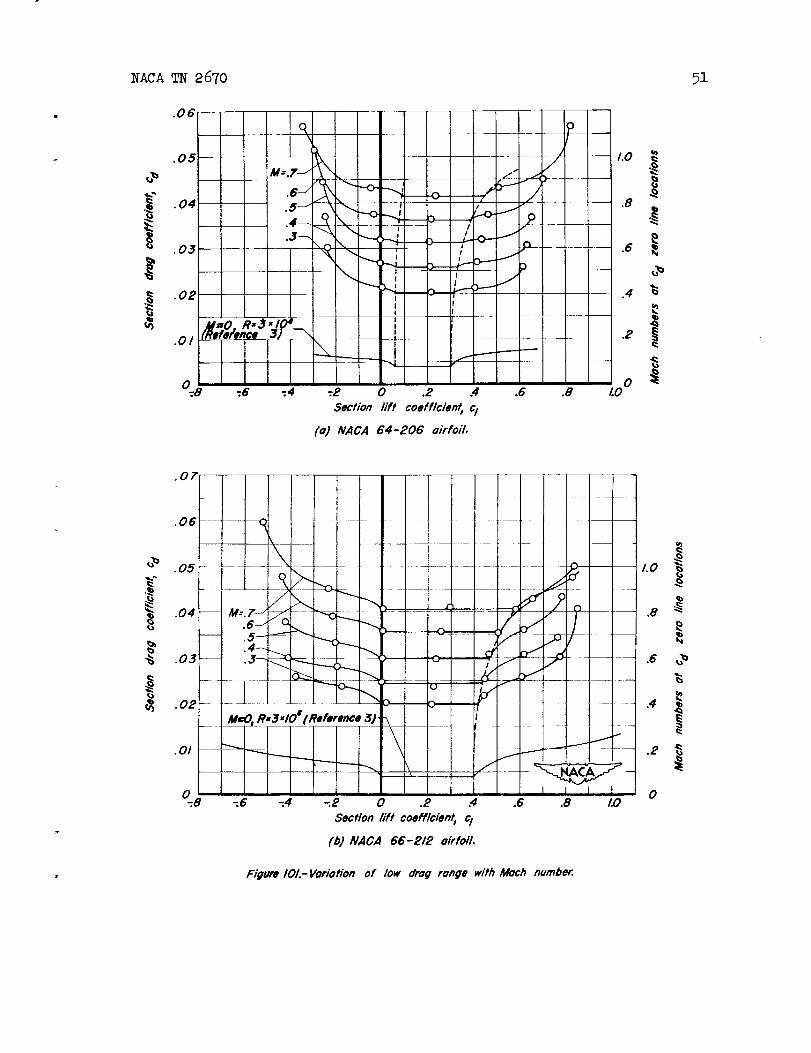
This matter has been investigated in greater detail, as shown in
figure lO1 for two of the airfoils, the NACA 64-206 and 66-212 sections.
Here advantage has been taken of the results of tests of the same air-
foils in the Langley two-dimensional wind Gunnel (reference 3) to fix
the extremities of the low drag range. Small-perturbation theory would
predict that at any free-streamMach number M the values of lift coef-
ficient corresponding to each end of the low drag range are equal to the
low-speed values multiplied by (1 - M_) -I/2. Low-speed values from
reference 3 have been magnified by this factor, and the polar curves of
figure lO1 are assumed to be flat within these limits and pass through
the single available point. In this manner, for every Mach number up to
NACATN 2670 7
the critical it is possible to draw curves passing through each pointwhich are remarkably similar to the low-speed curve. The agreement_shownhere for only two airfoils, was found to be equally as good forthe others. Hence it seemsreasonable to assumethat for all 16 airfoilsinvestigated the typical bucket form of the drag curve is preserved untilthe critical speed of the section is exceeded, and the correspondingrange of lift coefficients for low drag increases with free-stream Machnumberaccording to the factor (1 - M2)-I/2. Outside the low drag rangethe drag coefficient rises more rapidly with change of lift coefficientthan is indicated by the test results of reference 3. The differencecan probably be attributed to the lower Reynolds number of the presenttests.
Oncethe critical Machnumber of the section is exceeded it immedi-ately becomesimpossible to fit a curve of the form assumedabove. Thelow drag range vanishes; the polar curve becomesmoreparabolic in form,and, with further increase in speed_ shifts so that the lift coefficientfor minimumdrag approaches zero.
Critical Mach number.-Abrupt changes in the magnitudes of the forces
acting upon an airfoil, and of the drag in particular, are known to occur
at speeds somewhat in excess of the critical Mach number Mcr defined
as the Mach number of the free stream for which, at some point on the
surface of the airfoil, a velocity equal to the local velocity of sound
is first attained. For a given airfoil section, the critical Mach number
is a function only of the lift coefficient, and references 1 and 3 present
a method for approximating this relationship on the basis of the known
low-speed pressure distribution over the surface of the airfoil.
For NACA low-drag airfoils of moderate thickness, the maximum
velocity (or minimum pressure), which determines the critical speed,
occurs at a point which jumps between the midportion of the airfoil and
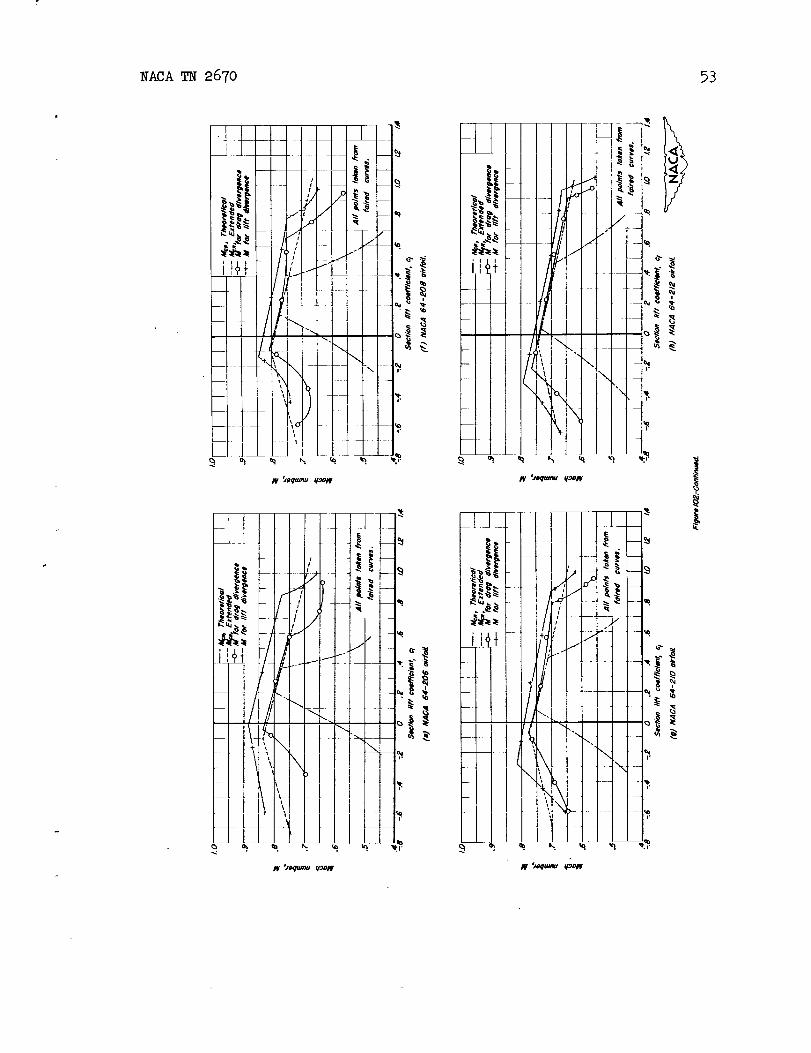
the nose with change of angle of attack. The variation of critical Mach
number with lift coefficient, consequently, has the characteristic jointed
form shown in figure 102. The curves consist, for these cambered air-
foils, of three connected segments: a central nearly flat portion encom-
passing the low drag range, which is associated with the realization of
the maximum velocity on the upper surface of the airfoil near the position
of maximum thickness; and two steeply inclined lines, which are determined
by maximum velocity at the nose on the upper or lower surface.
Comparison of the variation of critical Mach number as determined
from pressure-distribution measurements over NACA 652-215 (a = 0.5) and
66,2-215 (a = 0.6) airfoils with that predicted by theory has shown
good agreement throughout the flat portion of the curve (reference 6).
However; the experimentally determined corners are shifted farther out
along the flat portion of the theoretical curve. As a result, the range
of lift coefficients for high critical Mach numbers extends to consider-
ably higher values than theory would predict. Beyond the corners the
experimental curves fall roughly parallel to those predicted by theory.
8 NACATN 2670
The discrepancy is caused principally by the fact that the Karman-Tsienrelationship employed in the theoretical method to obtain high-speedpressure coefficients from incompressible values, while giving excellentagreement with experiment over most of the airfoil surface, overestimatesthe increase at the nose.
In view of this extension of the high critical-speed range of liftcoefficient, the flat portions of the theoretical curves showninfigure 102 have been extended for purposes of comparison in the followingdiscussion. This was done by assuming that the critical Machnumbercontinues to be determined by the velocity occurring near the position ofmaximumthickness.
Drag beyond critical sp_ed.- The critical Mach number is, in itself,
of no interest to the designer of high-speed aircraft. It is useful
only insofar as it aids in predicting the sudden changes in forces accom-
panying the formation of shock waves over an airfoil. Thus the Mach
number at which the drag coefficient begins suddenly to depart from its
low-speed value, termed the Mach number for drag divergence, is of greater
practical interest.
The Mach numb@r for drag divergence has been chosen from the experi-
mental curves (figs. 3 to 18) as that Mach number at which the final rise
in drag coefficient begins. For low angles of attack 3 this point is
fairly clearly defined. The drag curve can be approximated by a hori-
zontal line followed by a parabolic rise, and the divergence point is
taken to be thebeginning of the parabola. At higher angles of attack
precise determination of the divergence point is rendered difficult by
the presence of the trough discussed previously. In these cases the
divergence point is taken to be the bottom of the trough.
The Mach numbers for drag divergence selected in this manner are
compared in figure 102 with the critical Mach numbers predicted theo-
retically. It is seen that the Mach number for drag divergence is very
nearly equal to the predicted critical Mach number throughout the range
of lift coefficient within which the latter has a high value. The Mach
number for drag divergence remains high, however, through a considerably
wider range than does the theoretical critical Mach number. This widen-
ing of the favorable range of lift coefficient is explained in part by
the fact, mentioned previously, that the actual extent of high critical
Mach numbers is somewhat greater than theory would indicate. However,
this does not constitute a complete explanation, because in the tests
of thicker airfoils referred to previously (reference 6) the Mach number
for drag divergence was found to remain high through a much wider range
of lift coefficient than did even the experimentally determined critical
Mach number.
A possible explanation for this extension suggests itself. When,
as is the case within the favorable range of lift coefficients, sonic
velocity first occurs on the gently curved midportion of the airfoil,
2B NACATN 2670 9
only a slight Machnumbergradient exists normal to the surface. A smallincrease of free-stream Machnumberabove the critical will produce anextensive region of local supersonic flow, culminating in a shock waveextending far out from the airfoil and involving a correspondingly largedrag increase. On the other hand, when sonic velocity is first attainedon the sharply curved nose of the airfoil, the local Machnumberdropsabruptly with distance away from the surface. A muchgreater increaseof free-stream Machnumberabove the critical may then be required toinduce a shock wave extensive enough to produce large losses. Further-more, when sonic velocity appears first on the midportion of the airfoilrather than at the nose, the boundary layer will be more fully developedat the shock wave. The flow maythen be more susceptible to separationin the vicinity of the shock, which will result in rapid increase ofdrag.
It will be noted that the Machnumbersfor drag divergence follow_for somedistance in each direction, the extended theoretical criticalMachnumbers calculated by neglecting the velocity peak at the nose ofthe airfoil and assuming that the velocity near midchord is always thegreatest to be found anywhere on the airfoil.
Insufficient points are available to determine, with any accuracy,the exact amount by which this favorable range of lift coefficientsextends beyond that for high critical Machnumbers. In fairing thecurves of figure 102, howeverj the assumption has been madethat thevariation of Machnumberfor drag divergence is of the samejointed formas that of critical Machnumber. This assumption maybe unwarranted;its justification lies in the fact that curves of this form can be drawnto pass through every point. Whether or not this hypothesis is admitted,it is evident that the range of lift coefficients for good high-speeddrag characteristics is twice as wide as the theoretical range of highcritical speeds for 12-percent-thick airfoils and three times as widefor the 6-percent-thick sections. It should be noted that, even for thethinnest airfoils tested, high Machnumbers for drag divergence areattained over a wide enoughrange of lift coefficient to insure adequatemaneuverability in a fighter airplane at high speeds_and satisfactoryperformance at diverse loading conditions and altitudes for a high-speedbomber.
The variation of drag coefficient with Machnumberat the designlift coefficient of 0.2 is shownfor the 16 airfoils in figure 99-Theoretical critical Machnumbersare also indicated (extended valuesfrom fig. 102 are shownfor the NACA65-206 and 66-206 sections). It isseen that at design lift the supercritical drag rise is practicallyunaffected by position of minimumlpressure. The critical Machnumberincreases so slightly with rearward movementof minimumpressure thatsignificant improvement of high-speed drag characteristics can be achievedonly by reducing the airfoil thickness ratio.
Finally, the nature of the increase in drag coefficient beyond thetheoretical critical Machnumbermaybe considered. Figure 99 suggests

lO NACATN 2670
that the form of the rise maybe almost identical, at least near thedesign lift coefficient, for airfoils of widely varying thickness ratios,as well as different positions of minlmumpressure. Attempts based onboth theory and experiment have in the past been madeto obtain someform of universal drag curve applicable beyond the critical speed. Theincrement in drag coefficient above that observed at the theoreticalcritical Machnumber is shownin figure 103 for all but one of the air-foils near zero angle of attack as a function of the correspondingincrement in Machnumber. (Values for the NACA65-206 airfoil are notshownbecause no experimental points were obtained within the favorablerange of predicted critical Machnumber.) The points are seen to definea single curve; all scatter lies within the range of experimental uncer-tainty, and no consistent variation from the meanappears with changeof either thickness or minimum-pressure position. Plotting the samepoints on logarithmic coordinates shows a slope of 2; accordingly aparabola, given by
2
- = 2.36 (M - Mcr) (1)Cd Cdcr
has been fitted in figure 103. This correlation is not confined to zero
angle of attack, because for the NACA 66-212 section the angle was 0.5 ° .
It seems likely that equation (i) will predict the supercritical drag
characteristics of these airfoils throughout the theoretical range of
lift coefficients for high critical Mach numbers. Outside this range,
however, the agreement is found to be mediocre.
The question arises whether this empirical correlation is in accord
with the transonic similarity rule (reference 8). Unfortunately, the
similarity rule is not strictly applicable here. Each group of airfoils
having the same minimum-pressure position would constitute a family of
"similar" shapes were it not for the fact that their camber is fixed,
rather than proportional to thickness. However, it seems reasonable to
apply the rule as an approximation in the following way.
If the airfoils were truly similar, their drag coefficients would
be related by
ca = (t/c)s/3 (2)
where t/c is the thickness ratio_ and D z
transonic similarity parameter
M m - 1= •
(t/c) 21s
is some function of the
(3)
This rule does not apply even approximately to the present airfoils
because camber strongly affects the critical Mach number. Except for
the skin friction, which lies outside the scope of the similarity theory,
the drag must rise from zero at the critical Mach number. Hence the
NACATN 2670 ii
similarity rule maybe written in another form as
cd - cd = (t/c) 5/3D2 (_ _ _cr) (4)cr
where _r, the value of the similarity parameter at the theoretical
critical Mach number, is, within the accuracy of the transonic similar-
ity theory, a constant for truly similar shapes. In this form it seems
reasonable to apply the rule to the present airfoils_ because the fact
that _cr is not constant is accounted for. Thus the dissimilarity dde
to camber is counterbalanced. 2
Using the similarity rule in this way_ the data of figure 103 can
be fitted by taking the function D 2 to be twice the square of itsargument. 3 This gives
2
cd - Cdc r = 2(t/c) 5/3 (_ - _cr )2 = 2(t/c) 1/3 (M 2- Mcr 2) (5)
For all 16 airfoils, this expression differs from that of equation (i)
by less than 3 percent. Hence there is no need to replot the data;
figure 103 may be regarded alternatively as a correlation according to
one form of the transonic similarity rule.
Lift Coefficient
Angle of zero lift.- For incompressible flow, thin-airfoil theory
permits calculation of the angle of zero lift, which is determined largely
by the camber line, as disqussed in reference 3- Assuming the theoretical
value of the lift-curve slope, 2_ per radian 3 the angle of zero lift for
airfoils having a design lift coefficient of 0.2 and an a = 1.0 mean
camber line is calculated to be -i._2 °. The experimental values are_
with one exception, slightly less negative than this at low Mach numbers,
in agreement with the results of reference 3. (See fig. 104.) The
anomalous behavior of the NACA 65-206 airfoil may result from apparent
poor model construction near the trailing edge. At low speeds little
consistent variation of zero-lift angle, either with thickness or posi-
tion of minimum pressure, is evident from figure 104.
2It seems likely that the latter form of the similarity rule will yieldbetter correlation near the critical Mach number even for similar air-
foils, because _cr is not actually constant but varies markedly withthickness as a result of higher'order effects.
32he simplicity of the numerica_ factor 2 has no significance_ because
powers of (7 + i) have been neglected in stating the similarity rulej
where 7 is the adiabatic exponent.

12 NACATN 2670
With increase in Machnumber, the angle of zero lift is seen toremain sensibly constant, or tend only slightly closer to 0°, up to theextended theoretical value of the critical Machnumbertaken fromfigure 102. Approximately 0.075 Machnumberabove this critical speed,the 12- and 10-percent-thick airfoils exhibit an abrupt increase inangle of zero lift; and the sameeffect appears to have Just commencedat the highest test Machnumbers for the thinner sections. This suddenchange in angle of zero lift, together with the decrease in lift-curveslope discussed later, will require large alterations of trim for anairplane in level flight at any wing loading.
Lift at constant angle of attack.- At moderate angles of attack,the increase of lift coefficient w_th Mach number is in accord with the
Prandtl-Glauert factor (i - M2) -I/_ up to the critical speed of the
section. (See figs. 19 to 34.) At greater angles, however, this char-
acteristic curvature no longer appears; the variation is more nearly
linear within the Mach number range 0.30 to 0.60, and in many cases the
curvature is actually reversed, as it is for the NACA 65-212 section
at 6° and -6° . (See fig. 30.) This behavior can possibly be explained
as a variation with Reynolds number, which predominates over the com-
pressibility effect at low speeds.
Supercritical characteristics.- At any angle of attack_ shortly
after the critical Mach number for the section has been exceeded, the
losses in lift which accompany shock-wave formation begin to counteract
the subcritical rise. An inflection point is reached in the variation
of lift coefficient with Mach number for constant angle of attack
followed by a peak beyond which the lift falls rapidly. A final abruptreversal within the last few thousandths of a Mach number before the
choking speed often appears in the present tests, and in most other
high-speed subsonic wind-tunnel data.
The rapid loss of lift beyond the critical speed, producing as it
does a large change in airplane trim and a dangerous increase in sta-
bility, must, for airfoils intended for high-speed aircraft, be post-
poned to as high a Mach number as is practicable at the large lift
coefficients required for dive recovery as well as near design lift.
Reduction of airfoil thickness_ with consequent increase in critical
Mach number, serves within the low drag range to raise the speed at
which these undesirable effects appear. Consideration of the theoretical
variation of critical Mach number with lift coefficient might lead to
the conclusion that any improvement inside the low drag range can be
achieved only at the expense of greatly impairing the characteristics
at other lift coefficients. That this fear is unfounded is demonstrated
in figure 102. Mach number for lift divergence, defined as the inflec-
tion point in the curves of figures 19 to 34, is shown as a function of
lift coefficlent_ points used in cross plotting again being indicated.
It is seen that, in every case, the behavior of Mach number for lift
divergence is similar to that of Mach number for drag divergence dis-cussed previously. Instead of falling off rapidly outside a narrow

NACATN 2670 13
range of lift coefficient as does the theoretical critical Machnumber,it remains high through an even greater range than does the Machnumberfor drag divergence, running parallel to the extended critical Machnum-ber curve for a considerable distance in each direction. This wideningof the favorable range maybe causedby the fact, mentioned before, thatthe boundary layer will be more resistant to separation in the vicinityof a shock wavewhich appears near the nose than for one occurring firston the midportion of the airfoil.
It is important to observe that the Machnumberfor lift divergencelies considerably farther above that for drag divergence in the caseof 63-, 64-, and 65-series airfoils than it does for the 66-seriessections. As a consequence,because supercritical drag rise is essen-tially the samefor all 6-series airfoils of equal thickness, the66-series airfoils exhibit adverse compressibility effects at lowerspeeds, and at lower drag coefficients, than do the other sections. Inthis respect, then, 66-series airfoils are somewhatinferior in high-speedperformance to those having minimumpressure farther forward.
Lift-curve slope.- Low-speed lift-curve slopes shown in figure 105
are smaller than those reported in reference 3 for airfoils of the same
series, and appreciably less than the theoretical value for thin air-
foils (2_ per radian). The discrepancy can probably be attributed to
differences in Reynolds number. Variation of thickness ratio and mini-
mum pressure position have little effect on the low-speed lift-curve
slope; a slight decrease results in every case, however, from rearward
movement of minimum pressure. (See fig. 105(b).)
For all 16 airfoils the increase of lift-curve slope with Mach
number is well represented at moderate speeds by the factor (i - M2) -I/2
derived from small perturbation theory. At higher Mach numbers, the
rise is somewhat more rapid, reaching a sharp peak beyond the criticalspeed. 4 This peak is delayed to higher values of Mach number and lift
coefficient with decrease of thickness ratio and also with forward move-
ment of the chordwise position of minimum base-profile pressure. This
delay is ordinarily desirable. It must be noted, however, that exces-
sively high values of wing lift-curve slope tend to produce airplane
instability, as discussed in reference 2. For this reason the present
6-percent-thick sections may be unsuitable for use on unswept-wing
aircraft in cases for which the low-speed stability is marginal.
Furthermore, great care must be exercised in the choice of a section
for the horizontal tail plane when a thin wing section is employed.
Serious instability may result if the tail plane is so thick that it
experiences a loss of lift-curve slope at a lower Mach number than does
the wing.
As discussed previously, the transonic similarity rule is not
strictly applicable to these airfoils because of their fixed camber.
4For the NACA 65-206 and 66-206 sections, the theoretical critical Maeh
numbers indicated in figure 105 are the extended values taken from
figure 102.

14 NACATIC2670
However, according to thin wing theory, lift-curve slope is independentof camber in both subsonic and supersonic flow. It seemsreasonable toassumethat this is true also in the intermediate transonic range pro-vided that the lift curve is linear. If so, the lift-curve slopes forairfoils having the samethickness distribution but different thicknessratios t/c are related by
dcz- --(t/c) 1/s L_(_) (6)
where L_ is some function of the transonic similarity parameter(equation 3) •
The present lift curves are generally fairly linear up to the
design lift coefficient of 0.2 (see figs. 67 to 82). Therefore, the
"reduced lift-curve slope," (t/c) I/s (dc_/da), at design lift has been
plotted as a function of the similarity parameter in figure 106. Com-
parison with figure 105(a) shows that, in general, the correlation of
data at high Mach numbers has been significantly improved. Excepting
the anomalous results for the 65-208 airfoil, the correlation probably
lies within the bounds of experimental error and uncertainty in block-
age corrections.
The lift curves themselves (figs. 67 to 82) often show, above the
low drag range of lift coefficient, the Jog typical of NACA 6-series
airfoils, which is analyzed in reference 9. Beyond a Mach number of
0.65 or 0.70 the Jog disappears or is obscured by other phenomena. The
results of reference 9 indicate that at least for low speeds it will
vanish entirely at flight values of Reynolds number, and there is little
_reason to doubt that it will then disappear at all speeds.
Maximum lift coefficient.- It must at the outset be emphasized
that the low-speed values of maximum lift coefficient obtained in these
tests are not applicable to flight conditions. Numerous investigations
have indicated that scale effect is so great that, at the higher
Reynolds numbers of flight, maximum lift coefficients half again as
large as those shown in figure 107 may be attained. Other tests of
several of the present airfoils at greater values of Reynolds number
indicate, as would be anticipated, that the low-speed maximum lift
coefficient increases as the minimum pressure is moved forward as far
as the 40-percent-chord position. (See reference 3.)
The results of reference i0 indicate that scale effect on maximum
lift coefficient vanishes above a Mach number of about 0.55. The present
results shown in figure 107 can therefore probably be applied with con-
fidence above 0.60 Mach number. At these higher speeds the maximum lift
coefficient is greatest for airfoils having minimum pressure at the
40- or 50-percent-chord position. Thus it is seen that airfoil sections
with minimum pressure near 40 percent of the chord, in addition to having
almost as good high-speed drag characteristics as sections with minimum.
pressure farther back, and higher Mach numbers for lift divergence and

NACA TN 267O 15
for change of angle of zero lift, likewise demonstrate higher maximum
lift coefficients at low speeds as reported in reference 3; and, as
shown by the present tests, these airfoil sections maintain this
superiority up to high Mach numbers.
All 16 airfoils show desirable gradual-stall characteristics up to
high Mach numbers (figs. 67 to 82). The nature of the stall seems to
be essentially independent of both thickness ratio and position of mini-
mum pressure.
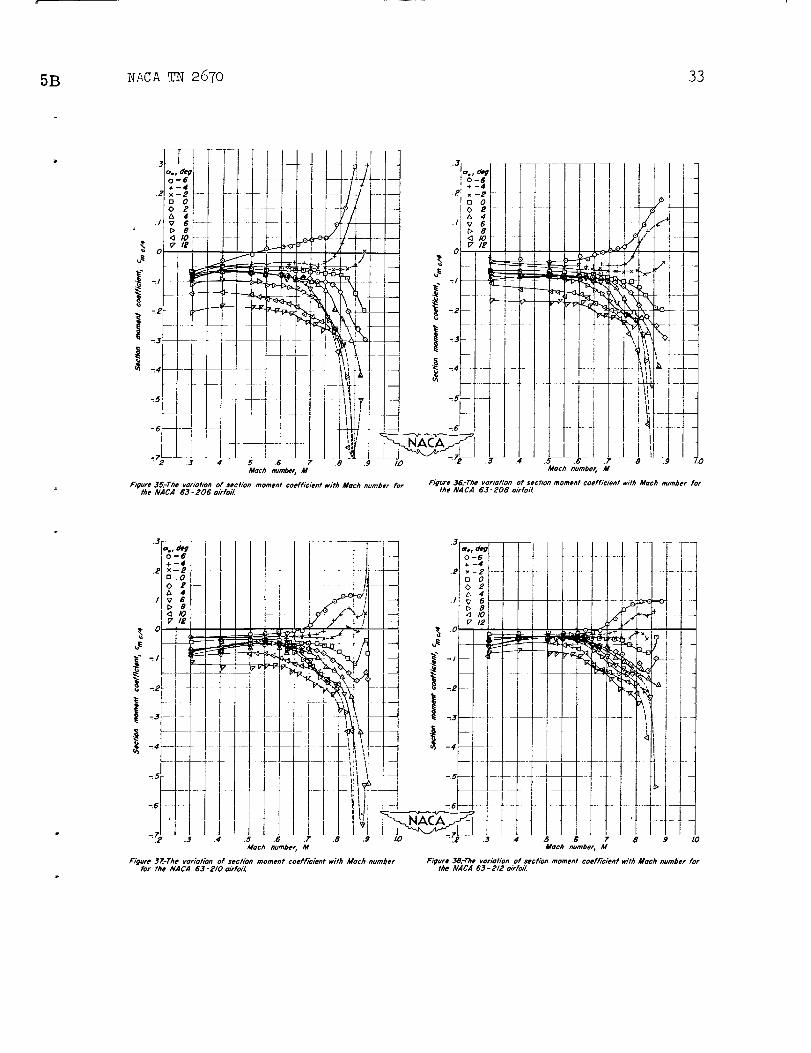
Pitching-Moment Coefficient
The pitching moment of an airfoil, like the angle of zero lift, is
determined mainly by the mean camber line. The low-speed value can
accordingly be calculated from thin-airfoil theory. For all 16 air-
foils considered here, the theoretical value of the quarter-chord
pitching-moment coefficient is -0.05. (See reference 3-) Figures 35
to 50 indicate the experimental values to be in most cases smaller than
this at low speeds and low angles of attack, and reference 3 reports
that such is generally the case for airfoils cambered with the uniform-
load type (a = 1.0) of mean camber line.
At moderate angles of attack, the variation of pitching-moment
coefficient with Mach number up to the critical is represented roughly
by the factor (i - M2) -I/2 from small-perturbation theory. At higher
Mach numbers the variation definitely departs from this rule.
It would be desirable at this point to define a moment divergence,
analogous to the drag and lift divergences discussed previously, and to
consider as before the Mach number at which it occurs. However, con-
sideration of figures 35 to 50 indicates that changes in pitching-
moment coefficient are much less pronounced near the critical speed
than are changes in either drag or lift coefficient. Consequently,
formulation of a criterion for moment divergence has not been attempted.
Figure 108 presents the variation with Mach number of the quarter-
chord moment coefficient at the design lift coefficient. 5 The variation
is similar for all 16 airfoils, no effects of changing either thickness
or minimum-pressure position being discernible.
Because of the strong effect of camber upon pitching moment, no
attempt has been made to apply the transonic similarity rule.
5Again, for the NACA 65'206 and 66-206 airfoils extended values of
Mcr are shown.

16 NACATN 2670
CONCLUSIONS
The most important conclusions to be drawn from tests at highsubsonic speeds of 16 NACA6-series airfoil sections are the following:
i. The "bucket" form of the low drag range of the drag curveappears to persist up to the critical speed of the section, the corre-sponding range of lift coefficient increasing with Machnumberby thefactor (i - M2)_/_.
2. The Machnumberat which a rapid increase in drag coefficientbegins is very nearly equal to the critical Machnumberpredicted bythe theory of references 1 or 3 throughout the range of lift coeffi-cient within which the theoretical value is high. Outside this range,all 16 airfoils continue to exhibit good drag and lift characteristicsthrough a considerably wider range of lift coefficient.
3. Near design lift, the increase in section drag coefficientbeyond the predicted critical Machnumber is nearly identical for all16 airfoils and can be represented by a parabola. This correlation isin accord with the transonic similarity rule.
4. Within the limits investigated, variation of chordwise positionof minimumbase-profile pressure has almost no effect on the high-speeddrag characteristics of these airfoils. Appreciable improvement can beachieved only by reduction of thickness ratio.
5. The 66-series airfoils tested were found to be decidedlyinferior to the other sections as far as maintaining good high-speedlift characteristics beyond the critical speed. Forward movementofthe position of minimumpressure to 40-percent of the chord; in additionto raising the maximumlift coefficient at high speed, produces twoeffects favorable to high-speed stability and control. Abrupt increasesin angle of zero lift and decreases in lift-curve slope are bothdelayed to Machnumbersfarther above that at which the drag begins torise.
AmesAeronautical Laboratory,National Advisory Committee for Aeronautics,
Moffett Field, Calif., December13, 1951.
REFERENCES
Heaslet, Max. A.: Critical MachNumbersof Various AirfoilSections. NACAACE4G18, 1944.

3B NACATN 2670 17
2. Hood, Manley J., and Allen, H. Julian: The Problem of LongitudinalStability and Control at High Speeds. NACARep. 767, 1943.
o
o
o
o
o
Q
i0.
Abbott, Ira H., yon Doenhoff 3 Albert E., and Stivers, Louis S., Jr.:
Summary of Airfoil Data. NACA Rep. 824, 1945.
Heaslet, Max. A.: Theoretical Investigation of Methods for Com-
puting Drag from Wake Surveys at High Subsonic Speeds.
NACA ARR 5C21, 1945.
Allen, H. Julian, and Vincenti, Walter G.: Wall Interference in a
Two-Dimensional-Flow Wind Tunnel, with Consideration of the Effect
of Compressibility. NACA REID. 782, 1944.
Graham, Donald J.j Nitzberg, Gerald E., and 01son 3 Robert N.: A
Systematic Investigation of Pressure Distributions at High Speeds
over Five Representative NACA Low-Drag and Conventional Airfoil
Sections. NACA Rep. 832, 1945.
Knowler, A. EJ 3 and Pruden, F. W.: On the Drag of Circular
Cylinders at High Speeds. R.&M. No. 1933, British A.R.C., 1944.
yon Karman, Theodor: The Similarity Law of Transonic Flow.
Jour. Math. and Phys., vol. XXVI, no. 3, October 19473
pp. 182-190.
yon Doenhoff, Albert E., and Tetervin, Neal: Investigation of the
Variation of Lift Coefficient with Reynolds Number at a Moderate
Angle of Attack on a Low-Drag Airfoil. NACA CB(19), 1942.
Spreiter, John R., and Steffen, Paul J.: Effect of Mach and
Reynolds Numbers on MaximumLift Coefficient. NACA TN 1044,1946.

18 NACA TN 2670
TABLE I.- AIRFOIL ORDINATES
[Stations and ordinates given in percent of airfoil chord]
NACA 63-206 NACA 63-208
I Upper surface Lower surface
! Statlon Ordinate Stati_ _
O. 0 O I 0
8 .551 .5_e j -.h51
.703 .677 .797 I -.937
1.197 .876 1.303 _ -.66_
2.h38 1.2_i 2.56a I _869
h.9_ 1.776 5,068 I -1.1h_7._9 2.189 7.571 J -1.3h1
g.g%O 2.526 10.O70 1 --I.E�e
I 14 _O_4 3•058 15,066 ] --I.712
, l_.g_l 3. 451 20.0_9 J --i.8_9
i 2_. g50 3 •736 25.050 J --I.9h6
_._O 3.9_6 3o.o_.o J -L�_
[ _ o_ _.030 35.030 J -1.970
i _@._I h.O }_ 110.019 J --1.900
,_,_ _I 3-97_ 4%9o9 J -1.78_
i 5o,o00 3.8e6 50.0oo I -1.6_o
95.008 3.6]2 _.992 l -1._2
60.015 3.338 99.985 ! --1.196
6%C_0 3.0_ 64.980 I -.95,9-
7o.o@3 a,6_a 69,977 J -,698
75. C@3 _.237 7h. 977 J -.hk7
8o. oez 1.8oh 79.978 J _212
_.o19 L 356 8_.981 I _ olo
9o.o13 .9oo 89.987 I .13_
95.006 ._Sh 9h. 993 ] .178
100.000 0 100.000 I 0
L. E. rmdius: 0.297
Slupm of raalus through L. E. : 0.08_
Upper surface Lower surface
Statlon Ordinate I Station 0rdlnste
i
o o.715 o o._h .596 -.615.687 .876 .813 -.736
1.179 1.131 1.321 -.917
2. M8 I. 592 2.982 -i. 220
4.909 2.266 5.o91 -i .63 h
7.406 2.780 7.59_ -1.932
9.906 3.201 lO.O�h -2.167
14.912 3.861 15.088 -2.515
19.922 4.3k9 2o.078 -2.753
24.934 h.690 25.066 -2.900
_9.9k7 k.918 3o,053 -2.97h
3h.961 5.030 35.o39 -2.970
39.97h 5.027 _0.096 -2.885
hh.988 _-919 45.o12 -2.729
9o.ooo _.717 5o.oo0 -2.511
55.on 4.h29 5_.989 -2.239
6o.o19 _.069 59.981 -I .927
65.026 3.645 6h.97h -1.585
70.030 3.170 69-970 -i.226
75.031 2.657 7h.969 -.867
80.029 2.119 79.971 -.593
85.025 1.963 8h.975 -.217
90.oly i .013 89.983 .021
95.008 ._94 9_.992 o.i38I00. ooo o ioo. 0oo
L. E. radius: 0,_03
Slope of radius through L. E. : 0.0842
NACA 63-210
Upper surface Lower _urfaee
Station Ordinate Station Or_Inute
0 O O 0
._30 .876 .57o -.776
.6_9 i.I07 .831 --967
1.162 1.379 1.338 -1._65
2.398 1.939 2.602 -1.5674.886 2.753 5.11h -2.121
7.382 3.372 7.618 -2.52_
9.882 3.877 lO.118 -9.843
lb.890 _.666 15.110 -3,329
19.902 5.2_0 20.098 -3.6_8
2_.917 5.61_7 25.083 -3.857
29.933 5.9_o 3o,o67 -3.966
3_.951 6.030 35.0_9 -3.97o
39._8 6.o09 40.032 -3.867
_a.985 5.861 h5.015 -3.671
_o.000 5-999 50.000 -3.393
55.O13 5.235 5h-987 -3.04560.02_ _.786 99.976 -2.644
65.032 4.26_ 64.968 -2.205
70.037 3.68h 69,963 -i .740
75.038 3.C61 7_.962 -1.271
80.036 2._'lh 79.96_ -.822
85.030 1.761 84.970 -.hi5
90.021 1.121 89.979 -,087
95.01o .530 9h-99o .io2ioo. _o 0 I00. 000 0
L. E. radium: 0.770
Slope of radi_s throush L, E.: 0.0_4_
NACA 63-212
Upper surface Lower surface
Station Ordinate Station Ordinate
0 0 O 0
.hi7 1.032 .583 -.932
-657 1,260 .843 -1,120
1.145 1,622 d,355 -1.408
2.378 9.284 2.622 -1.912
h.863 3.238 5.137 -2.606
7.398 3.963 7.6h2 -3.115
9.859 4-55_ I0. lhl -3.520
ih.868 5._70 15.132 -4.124
19.882 6.137 20.118 -h.545
24.900 6.606 25.100 -h.816
29.920 6.902 30.080 -h.958
3h.941 7.030 35.059 -_.970
39.962 6.991 h0.038 -h.849
_.982 6.799 b5.018 -h.609
90.00o 6._73 9o.000 -h._7
55.o16 6.030 5_.98h -3.84o
60.029 5._91 59,971 -3.349
65.038 4.870 6_.962 -_.810
7o.o_3 k.182 69.957 -2._38
75.0_5 3.451 7h,955 -1.661
8o.o_2 2.698 79.958 -hlO6
85.035 1.9h7 8_._65 -.6oi
9o.o_5 1.22h 89.975 -.19o
95.o1_ .556 9_.958 .o66
iO0.0OO O I00.000 0
L. E. radius: 1.087
Slope of radius through L. E.: O.08_2

NACA TN 2670 19
TABLE I.- CONTINUED
[Stations and ordinates given in percent of airfoil chord]
NACA 64-206 NACA 64-208
Upper surface Lower surface
Station Ordinate Station Ordinate
0 O O0.499 .5_2 .5_I -.442
.704 .664 -796 -. 524
1.198 .859 1.302 -.6_5
2.440 1.208 2.560 -.836
4.93_" 1.719 5.O66 -z.087
7.432 2.115 7.968 -1.267
9.933 2.&44 lO.O67 -i.410
I_.937 2.970 15.o63 -1.624
19.943 3.367 20.057 -1.775
2_.952 3.667 25.048 -1.877
29.961 3.879 30.039 -i .935
3_.971 4.011 35.029 -1.991
39.981 4.066 40.019 -1.924
44.991 4.o14 45.009 .1.824
50.000 3.878 50.000 -1.672
55.008 3.670 54.992 -i. 480
60,015 3.402 59.985 -1.260
65,020 3.080 64.980 -i.o20
70.023 2.712 69.977 -.768
75,025 2.307 74.975 -.517
80.024 1.868 79.976 -.276
85.o2o 1.41o 84.98o -.o64
9o,o15 .940 89.985 .094
95.0O7 .473 9_.993 .159
10O,000 o ioo.ooo o
L. E. radius: 0.256
Slope of radius through L. E.: 0.084
Upper surface Lower surface
Station Ordinate Station Ordinate
o 0 o O6o 6.445 .7o6 •555 -.
.688 .862 ,812 -.722
1.18o 1.ilO 1.320 -.896
2.421 1.549 2.579 -I.177
4.912 2.189 5.088 -1.557
7.410 2.681 7-990 -1.833
9.910 3.089 10.090 -2.055
14.915 3.741 15.085 -2-395
19.924 4.232 20.076 -2.6hO
24.935 4.598 25.065 -2.8O8
29.9h8 4.856 30.052 -2.912
34.961 5.oo9 35.039 -2.949
39.974 9.063 _0.O26 -2.921
44.988 4.978 45.012 -2.788
50.0O0 4.787 5(3.000 -2.581
59.011 4.506 9_.989 -2.316
60.020 4.152 59,980 -2.010
65.027 3.734 64.973 -1.674
70. O31 3. 263 69.969 -i. 319
75.032 2.749 74.968 -.959
80.O31 2.200 79.969 -.608
85.027 1.634 84.973 -.288
9o.o19 1.067 89.981 -.033
95.O10 .522 94.990 .iiOlOO.OOO o lOO.0oo o
L. E. radius: 0.h70
Slope or radius through L.E.: 0.084
NACA 64-210
Upper surface Lower surface
Station Ordinate Station Ordinate
0 "'0 0 0
.431 .867 .569 -.767
•673 1.056 .827 -.916
1.163 1.354 1.337 -i.140
2.40Z 1.884 2.599 -1.512
4.890 2.696 5.110 -2.024
7.387 3.248 7.613 -2._00
9.887 3-737 10.113 -2.703
14.894 4.514 15.106 -3.168
19.905 5.097 90.095 -3.505
24.919 5.933 25.081 -3.7_3
99.934 5.836 30.066 -3,892
34.951 6.OLO 35.0_9 -3.990
39.968 6.o99 h0.o32 -3,917
44.985 5.938 45.015 -3.748
90.000 5.689 _0.000 -3.48355.014 5.333 54.986 -3.143
60.025 4.891 59.975 -2.749
65.033 4.375 64.967 -2.31970.038 3.799 69.962 -i .855
75,040 3.176 74.960 -i. 386
80.038 2.518 79.962 -.926
85.O32 1.849 84.968 --903
90.023 1.188 89.977 -.154
99.O12 .564 94.988 .068
iOO.000 0 i00.OOO 0
L. E. radius: 0.720
Slope of radius through L. E.: 0.084
NACA 64-212
U_er surface Lower surface
Station Ordinate Station Ordinate
o o 0 o
.418 1.o25 .582 -.925
•659 1.245 .841 -1.i051.147 1.593 1.353 -1.379
2.382 2.218 2.618 -1.846
4.868 3,123 5.132 -9.491
7.364 3.815 7.636 -2.967
9.865 4.386 lo.135 -3.352
14.872 5.991 15.128 -3.9a5
19.886 5.968 _9.114 -4.376
24.903 6.470 25.097 -4.680
29.921 6.815 3o.o79 -4.871
34.941 7.008 35.099 -4.948
39.961 7.052 40.039 -4.910
44.982 6.893 45.O18 -4.703
50.000 6.583 50.000 -4,377
55,016 6.151 5_.984 -3.961
60.029 5.619 99.971 -3.477
65.039 9.004 64.961 -2.944
70.045 4.322 69.955 -2.378
75.047 3.590 74.953 -1.800
80.045 2.825 79.995 -1.233
85.038 2.054 84.962 -.708
90.027 1.303 89.973 -.269
95.013 .604 94.987 .028
ioo.ooo o IOO.OOO 0
L. E. radius: 1.0_O
Slope of radius through L. E.: O.O84

20 NACA TN 2670
TABLE I.- CONTINUED
[Stations and ordinates given in percent of airfoil chord]
NAOA 65-2o6
llpF_r surface Lower surface
.......Station Ordl_te
0 0
.46o .5247o6 .642
1.2oo .822
9.h4& 1.140
4.930 1.625
7 437 2,012
9.Q3_ 2,3h0
la.939 2.869
19 •Qk5 3. 277
2&. 953 3. 592
29.962 3,82&
3k. 971 3,982
3 o . 981 4.069
44.990 4.078
50,o00 4.oo3
5%o09 3.836
f_%.O16 3,589
65.022 3.27670.026 2.907
7%028 2.589
80. 027 2,029
85.024 i. 538
Oe.O18 1,027
95.oo9 ,511
IOO.O00 0
0
.ShO I -.524
• 79g 1 -.902
1.see I -.608
2.556 I -.768
5.061 t -.9937.5,53 ] -1.164
10.065 ] -I. 306
15.061 ] -1.923
20.055 I -1.68525.047 t -1.802
30,O %q 1 -1.88o
35.029 t -1.922
_o.o19 I -1.92745.010 I -1,8_8
90.00o 1 -i.79754. q01 { -I. 656
59.984 ] -I, hh7
6_. 978 I -i.216
69.975 I -.963
74.972 I -.699
79.973 I -.537
_M976 I -.19
_9. 982 I .007
94.991 I .]21
i00. OeO I 0
T. W. rndlus: 0.2&O
Slope of radius thro_h L. g.: 0.084
NACA 65-208
Up,per
Station
0 i
._47
.651
1,184
2._26
h.qlH
7._15 :
9.91;
14.91_
19.927
24.9y_
29.9h9
34.961
39- 97 _
M_. _,
50.ooo
55.o1260.022
65.029
7o.c34
75.o37
Eo.o36
85.o31
9'3,023
95.012
1630,000 i.......... I
surface Tmwer surface
Ordinate ] Statior r_rdinate
0 0 0
•675 -553 --575
•82h .809 -.685 •
1.050 1. 316 -.836
1.451 2.574 -i.079
2.059 5.082 -i.427
2.5ho 7.545 -1.692
2.948 I0,085 -I.91L3.6o3 15;081 -2.257
k.107 20.073 -2,515
4.493 25.063 -2.7o3
4.777 3o.o51 -2.833
4.968 35.039 -2.908
5.069 40.026 -2.927
5.069 45.013 -2.879
_.960 5( .000 -2.7_t_
5.733 5_,988 -2,543
5.408 59.978 -2.266
5.001 64.971 -1.941
3•525 69.966 -i. 581
2.991 74.963 -t. 201
2.413 79. 964 -. 821
1.8O4 8_. 969 -.458
i. 181 89. 977 -.147
.568 94.988 .065
0 lOO.OOO 0
L. E. raalus: 0.$3&
Slope of radius through L. E.: 0.084
NACA 65-210
_per Surface Lower surface
St_t_on Ordlnate _tation | Ordinate
o o o i o
• _35 .819 .565 I -.719
•678 .999 .822 -.859
1.169 1.273 1.331 -i.059 ]2.4o8 i.757 2.59e -I. 385 I
.898 2,491 5 • 102 -i. 859
7.394 3.069 7.6_6 -2.221
o 89k 3.555 10.106 -2. 521
14.899 4.338 15.101 -2.992
19.909 4.93_ 20.091 -3.3462k-921 5.397 25.079 -3.607
29.936 5.73) 30.06_ -3,788
34.951 5..°54 35. 0h9 -3,894
39.968 6.067 4o.032 -3.925
&h.984 6.058 45.016 -3.866
5_.000 [ 5 915 50.000 -3.7o9
55 "Ol_ ] 5 I_5 54-986 -3.435
6o.o27 5.217 59-973 -3.07565.036 4.712 65.964 -2.652
i 70"043 k. 12,q 69.957 -2.18_
75.045 3-479 74-955 -1.689{ 8o,:9,4 _.783 79.956 -i.191
_. 85.03_q 2.057 84,962 -.711
i _. 028 i. 327 89,972 -.293
, 95.01_ .622 94.9_6 .SlOIOO. c_D 0 i00.000 0
T,. E. radius: 0.687
Slope of radius throl_h L. F..: 0.084
NACA 65-212
Lower surface
Statlon0_iFrO_l. :reIOrdlnate Statlon0.577ltO_dinateo-*870
.665 ] L176 I .836 I -Lo36
1.154 11.491 I 1.3h6 ] -1.277
2._9_ 2.0_ I 2._9 | -1.686
4.878 _.919 I 5.122 l -2,2_7
7.373 ] 3.593 [ 7.627 | -2.7_5
9.8_73 1 U'_@ l 10.m7 l -3._8
14.879 [ 5.073 _ 15.121 | -3.727
19.89O [ 5.770 I 2o.11o 1 _.178
24.9o6 I 6.3_ I 25.094 [ -4.5zo
29.923 [ 6.687 [ 30.077 |-h.7_3
34-952 1 6-942 I 35.058 |-4.882
39.961 I 7.068 ] h0.039 |-4.926
k4.981 ] 7.04_ [ 45.019 [-4.855
50,000 [ 6.8_ I _o.oee l-4.654
I I 54 3. 317• oN I 6.OlU I 59.968 [-3.872
65.053 _ 5.511 I 6_'.957 |-3,351
70.050 [ k.715 I 69.950 |-2.771
75.053 I 3.95 _ I 75.947 [-2.16480.o52 [ 3.14o [ 79.948 /-1.5_8
85.C4_ 2.m/ I 84,o55 | -.__._ I 1._3 I e9._ l .L29
95.017 _ .672 ] 9_.983 [ -,o_
l°°X°° L°
L. E. radius: 1.000
Slope of ra_llus through L. E,: 0.084

NACA TN 2670 21
TABLE I.-
[Stations and ordinates given
NACA 66-206
Upper surface
Station Ordinate
0 0
.461 .509
.707 .622
1.202 .798
2.447 1.102
h.941 1.572
7.439 $.947
9.939 2.268
14.942 2,791
19,947 3.196
24.954 3.513
29.962 3.754
34,971 3.929
39.981 4.042
4k.990 4 ,o95
5o.0oo 4 .O88
55.009 4 .o2o63.o18 3.886
65.026 3.641
7o.o31 3.288
75.034 2.848
80.034 2.339
85.031 1.78090.023 1.182
95.O12 .578
iOO.000 0
L.E. radius: 0.223
Lower sur f&ee
Statlom Ordinate
0 0
•539 -.409
•793 -.4_2
1.298 -.984
2-553 -.730
5.059 -.94o
7.561 -1.099
io.o61 -1.234
15.o58 -1.4k5
20.053 -1,604
25.046 -1.723
30.038 -1.810
35.029 -1.869
4o.O19 _1.900L5.olo -1.905
50.OOO -1.882
54.991 -1.830
59.982 -i.744
64.974 -1.581
69.969 -1.344
74.966 -I.0_8
79.966 -.7h7
84.969 -.434
89,977 -.1N_
94.988 .054
i00.O00 0
Slope of radius through L.E.: 0.084
CONCLUDED
in percent of airfoil chord]
NACA 66-208
Upper surface Lower surface
Station Ordimate Station Ordinate
O O
.449 .658
• 693 .8031.186 i.o2_
2.429 1.403
4.922 1.987
7.419 2.453
9.918 2.851
14.922 3.498
19,929 3.996
24.939 4.384
29.95O h.681
34.962 4.895
39.974 5-033
44.987 5.095
5o._ 5.o81
55.o12 4.991
6o.o24 4.811
65.o3_ 4._89
70.o41 4.034
75.oh5 3._69
80.045 2.823
85.0_0 2.119
90.030 1.38o
95.o16 .654
1oo.ooo o
L.E. radius: O._ii
O 0
• 551 -,5_
.807 -.6631.314 -.810
2.571 -1.031
5.078 -1-3557.581 -1.6O5
10.082 -1.817
15.078 -2.152
20.071 -2.40_
25.061 -2.594
30,050 -2.737
35.038 -2.835
40.026 -2.891
45.013 -2.90"3
5O.000 -2.875
54.988 -2._i
59.976 -2.669
64.966 -2.429
69.959 -2.090
74.955 -1.679
79.955 -1.231
84.96O -.7_i _89.970 -.3
94.984 -.o22ioo.0oo 0
Slope of radius through L,E.: 0.O84
NACA 66-210
Upper surface
Station Ordinate
O O
._36 .8o6
.679 .980
1.171 1.245
2.&12 1.699
4.902 2.401
7,399 2.958
9.898 3,_3214.903 _,202
19.912 4.796
24.924 9.257
29.937 5.60834.952 5.862
39.968 6.024
_4.984 6.095
9o,000 6.074
95.016 9.960
60.030 5-736
65.042 5-332
70.051 4-759
75.056 4.071
80.055 3.289
85.049 2.445
90.037 1.570
95.O19 .724
lqO.OOO 0
L.E. radius: 0.662
Slope of radius through
Lower surface
Station Ordinate
o._ 4 o-.7o6,821 -.84o
1.329 -1.031
2.988 -1.327
5.098 -1,7697.601 -2.110
lO. lO2 -2.398
15.o97 -2,85620.088 -3.20_
25.O76 -3.46730.063 -3.664
35.048 -3.8oe
40.032 -3.882
45.o16 -3-905
5o.ooo -3.868
54.984 -3.T7O
59-970 -3-594
64.958 -3.272
69.949 -2.815
74.944 -2.281
79.999 -1.697
84.951 -1.o99
89.963 -.536
94.981 -.o92
iOO.OO0 O
L.E.: 0.084
NACA 66-212
Upper surface
Station Ordinate
O 0
.424 .953
.666 1.154
1.156 1.462
2. 395 1.991
4.883 2.809
7.379 3.499
9.878 4.Oli14.883 4.905
19,894 5.596
24.908 6.132
29.925 6.539
34.943 6.833
39.962 7.018
44.981 7.095
5o.ooo 7.o68
55.019 6.931
60.036 6.659
65.o51 6.169
7o.o61 5._87
75.o66 4.661
80.O65 3.739
85.057 2-755
90.043 1.750
95.022 .789
100.000 0
L.E. radius: 0.952
Lower surface
Statlon T Ordlnat_
O I 0
.576 1 -.853
•83 h I -I.014
1.3 _4 I -1.248
2,605 t -1.619
5.117 I -2.1777.621 1 -2,611
10.122 1 -2.977
15.117 [ -3.55920.1061 -400425.092 1 -4.34230.075 1 -4.595
35.057 I -4.773
40.038 1 -h.876
_5.O19 1 -4.905
5O.0OO I -4.862
54.981 1 -4.741
59.96h I -4.517
64.949 I -4.1o9
69.939 I -3.543
74.934 1 -2,871
79-939 _ -2.147
84-943 1 -i.409
89.957 1 -.716
94.978 1 -.157
i00.000 I 0
Slope of radius through L.E.: 0.084

NACA TN 2670 23
C
NACA 63-=°06 NACA 65-206
C
NACA 63-208 NACA 65-208
NACA 63-210
NACA 63-212
NACA 65-210
NACA 65-212
NACA 64-206 NACA 66-206
NACA 64-208
C
NACA 66-208
NACA 64-210 NACA 66-210
NACA 64-=712 NACA 66-212
Figure I.- NACA 6-series airfoil sections having uniform-load type
(o = LO) mean camber line.

24 NACA TN 267O
3.O
2.O
_o /
//
/f
ff
J Y
0.2 .3 .4 .5 .6 .7 .8
Moch number, M
I I II 1 [
.9 /.0
F7gure 2.-Voriofion of Reynolds number with Moch number,

4B NACA TN 2670 25

26 NACA T_ 267O
.14
.08
.06
D4
.02
_- Vm_X_M of section d_g co_ff_i_nt wlM Mm_k r_m_ _
NACA 84-_0 _irfolL
LO
#O,-VoHo['/_ of _f'l_ _ coeffici_n/ _ _ _b_r for
NACA 64-2/2 ot_fo_

NACA TN 2670 27
Figu_ IL-Vorioh_ of section drag cmefflclenf with Much number for /hG •
NACA 65-206 olrfoiLFigure I_,-Voriotton of section drug coefficl_t with Much number for
NACA 65-208 oirfo#

28 NACA TN 2670
I
I
.5 .8 2' .8 9 10
MoCh number, M
drag coofflcleM with Moch number for /he

NACA TN 2670 29
Moth rm_ber, M Moc_ number_ M
Figcl_ 19.-77)e vO_iof_ of ,ll_#Y_,l lift ceeff#_mnf tith Much number for Figure _O.-The vorio#ion of section lift coefficient with Moch number for
the NAGA 53-_06 oirfoil. #he NACA 63-208 olrfotl.
'=,.- ,, I _l_i .,+_.!_, "Ii ill -i m lie ._,oi'-_ iiii lJ__ it';):,-:_ ,o<-:<_--LI '<__oI
i ! _ 2 ! .i -_i ,
_ _-' t I\T td .-.--o!i i i r I t i 1 1 1] 7_i ! I
I t-4 o,L= UI"_ "L_ L-L_LL_iI 11 I i I I/.l.J_!+,t;+"l1-4 _,_ _rm:, ,__--_.+.L!/_/1_ !_1
-+-'+-",1 " i_t _ l
4 S' A 7!._ .j, ] t j _id.-I! I ]::] _ !l j_oMoch numbs 4 M Moch _uftl_er, M
Figure 2/.-The roe/or/on of section lift coefficient with Moch number for Figure 22.-Ths relic#ion of section /if# coefficient with Moch _umber for##','e NACJ 63-1710 oirfoiL the NACA 63-212 oirfoiL

30 NACA TN 2670
i
/.0
.6
0
"_2_-I__=4
-i.°2"__ .._ .,_ .5 .e .rnu_M
I " i tt.t!o,,_,,, j I_LL -._: - o-6 _-
_j j _L,
_I _ _ ____
i: I_
Moch ,number, M
Fiqure 23,-Voriotion of section lift coefficient with Moch number for till
NAOA 64-_06 alrf_LFi_lre 24,-Voriol_on of section lift coefficient with Mach number for /he
NACA 64-20B oirfoi_
I.£
I.C
.8
.6
¢,
•_ o
"_6
-.e_
Figure BS.-VorioWon of sec#on lift coefficient with Moch numl;_t for the
NAC,4 64-_J0 otrfoiL
": -- i , i-- _ - -_:._ I-[- i.., 1 , '
g ,g t_ ,--- .6 .--__, _L_ ]_ J
i ill I bii-i-i .... _ "-[ ] i I ] _ J |;_ _ t I J. I I 1 J !
Moch number, M Moch number, M
FiFure 26:Vorlo#on of section lift coefficient with Moch number for the
N_C_ 64Ipf_ o#fotl.

NACA TN 2670 31
0 -5.5 J ! [_., o@9 t
,_1_-/.5 _ L- t2 J'-_ _--
,,orv 6.5._- _,_ _ I.OI__I_
= i!J--
Moch number, M
figure 27.-Votiotion of section lift coeffic/#M wHh Moch number for /t_
NACA 65-_06 oicfoiL
• !oMoch ,_mb_e, M
Figur_ 28.-V_riotlon of oechbn #ft coeffid#M with /l_./t r_ml_r For th_
NACA 65- _08 oirfo/Z
. _,-e. g.. I t _ i_ I H Io or._T u O _ f l I I I ' ix-2 4_--._
0 2 p-_ ' ' = _ 0 2_4' : . l,k LJ e!s 4_
,8 v 67- ! _ki;',: i I iv _4_+i D S _
-I
._ _ _o
Moch number_ M Moch numl_r_ M
Figure29.-Vor/otion of sect/on lift coefficient with Moth number f_ the Figure 30.-Voriofion of section lift coeff/cieM with M_ch numb_ for the
NACA 65-210 oirfoil. NACA 65-_12 oirfoiL

32 NACA TN 267O
I I
5B NACA TN 2670 33
.3 _ ....
.2 x -2
,a
.6 .7 B .9
Moch number, M
Figure 35.-The voNoflon of section moment coefflclenf with Moch number forthe NACA 63-206 oirfoil
3 4 5 6 7
Moch number, M
Figure 36.-The voriotion of section moment coefficient wlfh Moch number forthe NACA 63-208 oirfoiL
"9 NACA -
Moch number, M
Fi_/ure _8.-The vorlotlon of section moment coefficient with Moch number forthe NACA 63-212 oirfo#,

34 NACA TN 2670
number for
Moth number, M
Fibre 40.-Voriotion of section _t coefficient with Moch number
for the NACA 64-_08 oirfoii
.1
4-
It,
-J
o_ I _ __
o+:._
ao __X_ ...
4
I
Fl#ure 41.-Voriofion of section mome#l# coefficient with Mocil number fo_
#he NACA 64-_10 oirfo#_
, --_----
+-4 i.2I x-2
Im 0 iI_ -- " 0 2
!i6,_'_ , ,_ 4 I...... .1 'G 6 -- I _ t_
7"_ : i" _,t l ,-4--_ t
i - _,,'=_ - "_[ .i___L " '?2o"'2 1 ,I, _,',_ -- _., i!_
i
,, ! I.,r 6 _ ,7 ._ .9 /.0 .;" .e - _-9- zo
Moth number, M Moc_ number, M
Filrere 4_-Voriofion of $ecfion moment coefficient with Moch mallber for
#he NACA 64-21_ o/trolL

NACA Tl7 2670 35
.4.
d + -3. / ' I
I_ o.,, , -- - 4-- I_ a ! t , _
t<_,o.: .<..,.,__, _- . .i-<>7 ,
7-, :! 'iil "-- 7"--..NACA/6 .8 ,9 ZO . . .6 ? _9 _/,0
Moch #umber, #4 M_ch rlmber #4
Fi_we 43..-Vm'/oflon of sec#on moment coefficient with Moth number for Ftgure 44,-Voriofion of sic#ion /Ix]men/ coefficient with Moch m_mber for
hie NACA 65-206 O#fo4L . for NA1CA 65-208 _rfoJL
.3
_:_ -
.,0==
o
-4
-'!£_ .5
i I+-,1 ]: : ] s_,- -,,_-=' -;= 7>_t
i _ l.t /
I I _i 1_
.7 .8 .9 LO . .
Moch numblr, M
F_,_ure 45.-Vorio/ion of section moment c_efficJ_n# with Moch _mitt for
the NAI_A 65-B10 olrfoll.
, "_, r_
MOCh number,, M
Figure 46.-Pbriof/on of sic#ion moment coeff_ienf _#th Moch #umber for
#hi NAOA 65-_M oirf_l.

36 NACA TN 2670
!O B
lJ,
Figure 47,-Vorioh_ of see!ton moment cowfficienf with Moch humor for
the NACA 66-206 otrfoiL
Figure 48.-Voriotion of section momen! coefficient with Moch number for
the NACA 66-_08 o#foii
!o-__t+_ 4 ,
!ool.
',_ 6 i;1:> 8 I
!'
FTge_re 49-Vo_tkg_ of $eclJon moment coefficient with Moth number for
the NACA 66-_10 oirfoiL
• ¢' •_×-/_ l F_- I '
!! _t _ i--1 I l ', ! I ,1l "_" ! "e _F--" i +q F " _----:-]I i i' !q U
. kill _ '-1 l I ! , ! I t !
tlL _! . ' i
' r-ti t t!,tMoch number Moch number, M
Figure 50.-Voriohon of section mo,'nonf coeffic/bn! with Moch number for
the NACA 66-_M oirfoil.

NACA TN 2670 37
.06!
o_
"02 f
i :i
oI
dFi_# 53.-Tlhe vorlofion Of saeclion drog coefficient with section lift
co#fficient for the NACA 63-210 oirfo_
q? r,w ] qTY-I ]..:TIT- T_ "_iI:T: L_I I _. ,' . --, I ] , IO _ _J'd ] L J ,. "/,1\.....71/,/ --!,i'!.',..
X I' z_ ' X' 1 ' :-" , 'xlI'%1 I .z_L',..-W"
70 _ .
x _,_.,,p-_!2 .3 I or'.'s.i,,-_I: :,_w--_
t.,!: - ,_l , or ._ 'V , -I ' I 1.60 , /J "x_ , 60
i, _r--__l-'-:_'J ' - or- --"-_- ---
! -T_-_ __ /_. :q .... _ _-_i " : r_O, _ ; ' L--'Vll ' '; 0 ..1 I ! I I _0 r _ J , i
i ! I _ 40, J i : • _ 40 "
30, _ :. _ t t : , ' .30 '
Sect_ /_f C_ffic_t, Cl Secf_en k_t coeH_enf, cI
Figure 54.-T&e vo_iolio_ of S_CIiO_ _ coofflci_nf with section liftcoef_i_nf fo_ t_e NACA 63-_1_ OirfO_Z
_ Ii. Z L, \2 L
.o, % _\..
o
iI -_o I \!,,-
I o I \1\I _ \
o I_\l\
I _\'\o I!
o I i |\\_ -
!11 \ 4 _ I._,_-.4_
' 4:-- _L J
_3'< J
O- J--L----- 1
$- I--_-.m
'- A
! /,
/
/1
/f
i/
2i
//
i79
/] :
//
/-__

NACA TN 2670 39
40 NACATN2670
t

6B NACA TN 2670 41
_ _" 4 "
• _, _!_,_ -_f--I.L _,.-1...q
id ,-!\ i'
i' /I I I [
_jj \' ii
t "_11

42 NACA TN 267O

NACA _ 2670 43
I <.i "1"I_ L 1-% I'I-I"I"4.["I--CI-_-4.P-_
"L_-t. J"b_ "F.[',I- J'f-
.I t"1-4]"
,_,?_
i12!t!t!
I
I
ii'
4!

44 NACA TN 2670
I : i i I1iI
NI "t---
kiln
li III
!.. _ L
"\, I
Li \ '1-."" I_ ""1
!_i_ -_ 'k
I I
-} -I i
i
i
i
i I' Ir i"
r_f_
'i,]-i -_4
..J
,lli
tlttlt t-L:
titiIlt, o , . ,1! °,
]I
' I"_i I
4._,_\
"4_1
-_ I
t
!|

NACA TN 26704_
tlt-I[,_iI1
| __
! I
! 1-
11_
1":t-
k
I
;tt;1t
t "t_ , 1
?..t
b
F_._ ,J_4-Tlee e,_i_i_ of secllon moment c_ffickeM _ section h_'/_ _" tke NACA £,3-PO_ _

46 NACA TN 267O
i _
I-
I-II_I
f -
i.i
1

NACA TN 2670 47
c
I:I°
0
Io
c k II_
O
-4 _t
875
a_ . !1.8Z'5 ]
L i __
?'5 " • " _ ,a r _" '
, , _ ,, 1 _,Od J I, i
55! • -_ \,', | o_, i '.so, , _, :/ c_' ,_ •
.._I_:' ,'1 _-[- LLI-
APe"/he NAC'A 65-=00_ m@hl=l_
_st', ;ti, ,[
.00- - __-- :-Xb_I, Iyzs- -"'-.._ _ "%._.
7_$ _ ,,_ _',
1o , . I_
4 .6 8 10 I._
FitW._ 92-T-Ira v_t_io_ of secflon mo,w_! _¢/e_ mf_ secHo_ #ff
°t0 I ,
o [t,
0 '
I.
t°' Lo I
[-
0
0
0
C
C
cb
Figure 9_.-TI_ _ of sec_ mmee,_ coW'flcle,nf wi_ _ /if/coeflFcleM /or _ NACA 65-_10 mkfMl
$_ h_ o_f,",,cient, tt
F_ 94_7_ vodo,_n of seclion _ CoefflC_ wlfk lectlo_ /if/

48 NACA _N 2670
I
i'"
_bk,,
i K
q"
-2
_ I
1
._ --.a _o9
F_rw _-Th# v_r_tlo_ Of s_/iq_ mO_f _o_ffici_t with s_cllon tiffco_ffi_i_ PO_ /_ NACA 66-206 oi_fmZ
F_ 96,-Yhe vO_ioh'_ Of SWCItO_ mOm_/ _l_ient wi_ Seclion hllroefY_c_ent for I_e NACA 66-_0B eirfoil
I.Z
L_

7B NACA TN 2670 49
,04
.02
0
.04
.02
0
.04
"_ .02ca
0
.04
.02
NACA 63-206 oirfoil...... NACA 64-206 oirfoil
NACA 65-206 oirfoilNACA 66-206 oirfoil
NACA 63-208 oirfoilNACA 64-208 oirfoil
_-NACA 65-208 oirfoil_--NACA 66-208 oirfoil
Mcm
[
/J
fJ
J
NACA 63-210 oirfoil--- .... NACA 64-210 oirfoil
_-NACA 65-210 oirfoilNACA 66-210 oirfoil
II
/i
i
NACA 63-212 oirfoil__- .... NACA 64-212 oirfoil
_-NACA 65-212 oirfoilNAGA 66- 212 oirfoil
Mcl _ -
/
0.2 .3 .4 .5
tf
.6 .7'
II , |
.8 .9 1.0
Moch number, M
Figure 99.- Voriotion of section drog coefficient with Moch number
ot the design lift.

5o NACA TN 2670
.O8
.O6
.04 m
NAC,A 64-21,2 (c/--0.8)
...... NACA 66 - ,206 (c/ = 0.6)
/iI
.02 /
_____ :----_. 2__ I
B .3 . .7' .8C_
I/IIII
II
l
.9
(o) NACA 6-series oirfoil sections ot high lift coefficients.
1.0
j
.2 .3 .4 .5 .6 .7 .8
1
.9
Moch number, M
(b) Circulor cylinder (reference 7).
LO
1.0
Figure IO0_Voriotion of section drog coefficient with Moch number.
NACA TN 2670 51
.06
.04
03
]
!!!!
I!
-o---- /-_ 1 -- .8
T
___)___J.-.o- .e.... _ j," •
,!
• .2
J
.4 -2 0 .2 .4 .6
Section lift coefficient, cI
(a) NAGA 64-B06 airfoil.
.8 1.0
.07
.O6
.04
.03
.02
•OI
O 8
I
ii
6__ .1 D_
_ C
_o o--
.... i
1_
_ M= _R=SzlOe(Reference 5) -_
..-....._
-.6 -,4 -B 0
Section lift coefficient, cI
i
,B .4
(b) NACA 66-BI2 airfoil,
/in1 I "
s/
fl t t
I I I I.6 .8 LO
Figure IOI.-Voriotion of low drag range with Moch number.
.8
"i
0

52 NACATN2670
ii!i oii _;
,_!4! _
-- 'T/ t
-[7 -_-- t
L ".!
i
-- _"_ "I-_
. _V !'+,,m I ""__ ._
i_i: l ......- _i:t- L_4- i I°__ _ ! : ]
• [_ _ _ L_L__ L_.,-.z • *
_/+;<2/t,
9eq_u q_v
J
\
i !
"!\I
_ L5_qumu qsoPL
I
\
.i
.f
{IifI
I
NACA TN 2670 53
'11.
--I
• _
i
/
I I
÷
+ "q. i
_ _.[
_]
![ _.
i_:i
/I-
-- _
- tt'_Ht?
_ l
{.
//
ii
\
\)
=_
!:I
IL
IL
'i
i >I
._,__I"
LL.]I
.II-_
,.:0._% -
_ k\
.-9 %
-<
'It
t-,\
l --
,_ w_ _i"
\
<.
-- t
r
r
LI
i "
_. i
I
I:

_4 NACA TN 267O
• L
II
m_
I , ___I __ __
,t/7,,' z, rl
ff /
! I •
L l ]__
W 'Joqwnu q_olV
._ _- +.
t
,jw
_,_ -
--÷ -
iL
1
J _
' i
!i '• _.._
IV "_qwnu V_opi
_ I
--i
-i-i-i
i
._J
-I_1
i°
_ I_ L_
a..-.,,
, ..,!_ //:__i,_.
[ 1/_" ....
li't i_ _
Y
/
"--,. ,
W 5_qwnu q_o W
i

NACA TN 2670 55
\
I_ 51qmnu ¥_oW r/ 50qwnu q_
Ii
_i__,
L
. I
s I l--
/'i" i I
'_oqwnu q_ow
_J 1
/. !
!.)!|
_t:_I_,I
it 'I"

56 NACATN 2670
.040
.036
.032
_.028
•ik,,w*
._ .024
_ .020
•_ .Ol6
_ .012
.008
.004
00
NACA 63-206 cv=O °NACA 63-208 a=O °
Q NACA 63-210 a=O °l_ NACA 63-212 a=O °0 NACA 64-206 ¢z=O °+ NACA 64-208 c_=O°x NACA 64-210 _=0 =
NACA 64-212 a=O °NACA 65-208 a-O °V NACA 65-210 a=O =
i I!
1,1_ J_J.I
/
I
"--°i
!i
i
i
.04 .06 .08 .10 .12 .14 .16
Increment in Moch number, M-Mcn
Figure 103.-lncreose of section drog coefficient beyond theoreticol criticolMoch number.

8B NACA TN 2670 57
2
I
0
-/
-2
-- NACA 63-206 Extended Mce _ l......•_c__-2o8 fi--___-__3-e,o ,,63-212
2-- NACA 64-206
I ..... NACA 64-208
01----
_.,-22
--- NACA 64-210NAC_ 64-212
NACA 65-206.... NACA 65-=?08-- - NACA 65-210----NACA 65-2/2
Extended
l i I l
!
Extended Mcn -_ j,
I i ''
I
_ w
/]-- ___
21
I
0
-I
-2
-3.2
-- NACA 66-206..... NACA 66-208--- NACA 66-210---- NACA f;f;-2/2
II t I
.3 .4 .5 .6 .7 .8
Moch number, M
J1 I [
.9 LO
(o) Effect of thickness. .._
Figure 104:The voriofion of ongle of zero lift with Moch number for the NACA
6- series oirfoils.

_8 NACA TN 267O
/
0
-/
-2
-3
/
0
2
1
'_ -2
....... _ _:_ _ Ex_e_d_d M_ _l
NACA 65-206 I I 1 I I I I =,_,1 I
NACA 66-206 I 1 l
'ACA 63- 08 ten d
l: N_CA 6_-- Oa l =_1
NACA 63-210....... NACA 64-210
NACA 65-210NACA 66-210
Extended Men -_
Jj1%._
2
I
0
-I
-2.2
NACA 63-212...... NACA 64-212_- NACA 65-212_-- NACA 66-212
Extended
,--4----_k....-----.5 .6Moch
=
,3 .4 .7 _" .8 _
number, M
(b) Effect of minimum pressure pbsition.
Figure 104.- Concluded.
=ll _ 1.,
J
j.9 1,0

NACA TN 2670 59
.3 _NACA 63-206
I ..... NACA 63-208 [•el--- NACA 63-e10 _-
.,
I
0
[ ..... NACA66-2081 t I I [ ' t t I
I0_ °
Moch humbert M
(o) Effect of thickness.
Figure 105.-The voriotion of section lift-curve slope withMoch number of the design lift coefficient for the NACA
, 6-series oirfoils.

6o NACA TN 267O
.3
.21
.I
1 NACA 63-206NACA 64-206
- NACA 65-206_-- NACA 66-206
_m
2--"
J
.3
ca
.2
.I
0.2
NACA 63-208NACA 64-208NACA 65-208NACA 66-208
__ _ ___" _.... :..j ....
m NACA 63-2]0 ic_-_-_l
NACA 64-210NACA 65-210
NACA 63-212NACA 64-212NACA 65-212NACA 66-212
P
.3 .4 .5 .6 .7Moch number, M
I i |
.8 .9 LO
(b) Effecf of minimum pressure position.
Figure 105.- Concluded.

NACA TN 267O 61
./2
_CA_ACA6_-20863-206_ _'D'-NACA 63-212
........ _;_._ _ __
1NACA 64-206..... NACA 64-208 ......
"_ .08 ---NACA 64-.210
_- ----NACA 64_
.04
_ o
? .iz
.Oa
.04
..... NACA 65-208 /'---NACA 65-210----NACA 65-212 ._
l------NACA66-_SF_ f 11 F I J ! i--.o81---NACA 66-2/O ll .... i _ t -! _,t t t
-8 -7 - 6 -5 - 4 -3 -2 -I 0M e-- I
Tronsonic simiiority porome/er,_-- (Itch"
Figure 106.-Correlolion of section lift-curve slope
eccording to the trensonic similority rule.

62 NACA TN 2670
1.2
I.I
1.0
.5
1.2NACA 64-206
'- ..... NACA 64-208
_ _ I. I _-NACA 64-210.... •AcA6_-2_2
._ ,.o _ -J-J---
1.3
le 2 -- -
I.I
1.0
.9
NACA 63-206 _ /....._,,,cA_-_o8..... ,,--b-NACA 63-210 /-__. __:__
----NACA 63-212 I I t
I.I
1.0
NACA 65-206...... NACA 65-208
NACA 65-210----NACA 65-212
I
I .......
__-_y_ i. j-"
..... IA 1_ _ =
!!
__1___211.2
NACA 66-206 l..... NACA 66-208 [-
.8.2 .3 .4 ,5 .6 .7 .8 .9 I_
Mach number, M
(a) Effect of thickness,
Figure 107.- The variation of maximum section lift coefficient with Machnumber for the NACA 6-series airfoils.

NADA TN 2670 63
1.3NACA 63-206
"'---'- NACA 64-2061.2 _- NACA 65-206 --_ /"
!.------NACA 66-206 / j. "._
.... NACA 64-eoa _-_ )1- ! -; ]_
"_, /./ _° NACA 65-208 _- _ 4 : :
----NACA66-2081 1_E_-.
.....e- I j___
I.I
1.0
.9
.8,
r
NACA 63-210
..... NACA 64-210 "j A
P"'-- :
_-- -- i i i ......
--- NACA 65-2,10---- NACA 66-210
.....NACA 64-212 ,.
-_C---._ .._ , :_,".... 'i----_ .I .....
_.a......... ' _Ji.2 ._ .4 .5 .6 .7 .8 .9 1.0
Moch number, M '
(b_ Effect of minimum _ressure position,
Figure 107,- Concluded.

64 NACA TN 267O
O
_2
NACA 63-206 ....... ]-"'_,., "_,
NACA 63-208 __ " l "\NACA 63-210 McmJ 1 "-- -- NACA 63-212
X
.I
._- I
0
-2
I
-- NACA 64-206NACA 64-208
--- NACA 64-210NACA 64-212
!Mce I !
NACA 65-=?06 _'_NACA 65-208......NACA 65-210 4 I 1
iNACA 65-212 Mcn ! !
\
\
./
0
-/
_2
l____[ ..............
LI--..,...
.2 .3 .4
Mcn ,
.5 .6 .7Moch number, M
v
1
Ifi I
(o)Effect of thickness.
l
I I I.8 .9 /.0
Figure JOB-The voriofion of section moment coefficient with Moch numberof the design lift coefficient for the NACA 6-series oirfoils.

9B NACA TN 2670
.1
0
-I
0
__2
-.I
ii
65
i
f
NACA 63- 206NACA 64- 206
_- NACA 65-206_-- NACA 66-206
--.-..._
-,c,
\
NACA 63-208NACA 64-208
- NACA 65-208NACA 66-208
L _ _
_- Mcn - _k
NAOA 6_-210 "_"
....... NAOA 64-210 ii __
--- NACA 65-210 McnNACA 66-210
NACA 65-212NACA 66-212
.3
.. ........ 1
M rqj.4 .5 .6 .7
Moch number, M
I I ]
.8 .9 1.0
(b) Effect of minimum pressure position.
Figure 108.- Concluded.
NACA-Langley - 3-18-52 -I000
