nz1-2528063-drinking water standards new zealand cost ... · the additional cost for water carriers...
TRANSCRIPT
Report
Drinking Water Standards New Zealand Cost Benefit Analysis - Engineering Input Prepared for Ministry of Health (Client)
By CH2M Beca Limited
20 May 2010
© CH2M Beca 2009 (unless CH2M Beca has expressly agreed otherwise with the Client in writing). This report has been prepared by CH2M Beca on the specific instructions of our Client. It is solely for our Client’s use for the purpose for which it is intended in accordance with the agreed scope of work. Any use or reliance by any person contrary to the above, to which CH2M Beca has not given its prior written consent, is at that person's own risk.

CH2M Beca // 20 May 2010 // Page ii
6515967 // NZ1-2528063-63 2.6
Table of Contents 1 Introduction.............................................................................................................4
1.1 Purpose and Background............................................................................................ 4 1.2 Structure of Report ...................................................................................................... 4 1.3 Background to the Standards...................................................................................... 5 1.4 Existing infrastructure .................................................................................................. 6
2 Cost Model Development.......................................................................................7 2.1 Source Water Classification ........................................................................................ 7 2.2 Assessed Existing Treatment Processes .................................................................. 13 2.3 Assumed Upgraded Treatment Processes ............................................................... 13 2.4 Exclusions ................................................................................................................. 14 2.5 Reference Costing Data ............................................................................................ 14 2.6 Cost Model Capital Cost Summaries ........................................................................ 18 2.7 Cost Model Operating Cost Summaries.................................................................... 20
3 Large Population WTPs .......................................................................................22 3.2 Large WTP Cost for Option 2 - Bacterial Compliance Only ...................................... 24
4 Case Studies .........................................................................................................25 4.1 Approach ................................................................................................................... 25 4.2 Identification of Suitable Case Studies...................................................................... 25 4.3 Communities of 5001 - 10,000 Population ................................................................ 26 4.4 Communities of 501 - 5,000 Population .................................................................... 33 4.5 Communities of 101 - 500 Population ....................................................................... 39 4.6 Communities of 25 - 100 Population ......................................................................... 44 4.7 Summary of Case Studies......................................................................................... 47 4.8 Clutha District Council Concerns............................................................................... 53
5 Summary of Cost Estimates................................................................................54 5.1 Capital Cost ............................................................................................................... 54 5.2 Operating Costs......................................................................................................... 56
6 Sensitivity Analysis ..............................................................................................57 6.1 Water Use in New Zealand........................................................................................ 58 6.2 Water Use Overseas ................................................................................................. 60 6.3 Summary of Sensitivity Analysis ............................................................................... 61
7 Chemical Compliance ..........................................................................................62 7.1 Commentary on Chemical MAVs .............................................................................. 63 7.2 Cost Summary........................................................................................................... 66
8 Household Water Treatment Systems ................................................................68 8.1 Introduction................................................................................................................ 68 8.2 Compliance Issues .................................................................................................... 68 8.3 Treatment Components............................................................................................. 69

CH2M Beca // 20 May 2010 // Page iii
6515967 // NZ1-2528063-63 2.6
8.4 Advantages and Disadvantages of a Household Treatment System........................ 70 8.5 Point-of-Entry Systems.............................................................................................. 72 8.6 Point-of-Use Systems................................................................................................ 74 8.7 Cost Estimates .......................................................................................................... 74
9 Class 2 Water Carriers .........................................................................................79 9.1 Introduction................................................................................................................ 79 9.2 Survey........................................................................................................................ 79 9.3 Outcome of survey .................................................................................................... 79 9.4 Cost assessment ....................................................................................................... 80
10 Conclusion ............................................................................................................82
Appendices Appendix A - Source and Treatment Matrix Appendix B - Large WTPs Appendix C - Source and Treatment Matrix for Bacteria Only Compliance Appendix D - Chemical MAV Compliance

CH2M Beca // 20 May 2010 // Page 1
6515967 // NZ1-2528063-63 2.6
Executive Summary
To support the implementation of the Health (Drinking Water) Amendment Act 2007, the Ministry of Health (MoH) is undertaking a review that includes a quantitative cost benefit analysis (CBA) of compliance with the Drinking-water Standards for New Zealand 2005 (revised 2008) (DWSNZ). The CBA will assist the MoH in developing its drinking water policies further, and will be used in the review of the Capital Assistance Programme.
The following is a summary of the DWSNZ Cost Benefit Analysis – Engineering Input. It provides an outline of the key assumptions and summarises the costs associated with compliance with DWSNZ.
The engineering input for the CBA included analysing a total of 667 water treatment plants (WTPs) that were deemed non-compliant with the bacterial and/or protozoal requirements of DWSNZ. A breakdown of the treatment plant numbers and the population served is given in Table ES1.
Table ES1 - Total Number of and Total Population Affected by Non-Compliant WTPs
Population Category Number of Non-Compliant WTPs
Population Affected by Non-Compliant WTPs
Large (>10,001 population) 22 291,531
Medium (5,001-10,000) 29 124,107
Minor (501-5,000) 192 289,480
Small (101-500) 236 59,666
Neighbourhood (<101) 188 10,153
Total 667 774,937
For all population categories two forms of compliance with DWSNZ were considered. The first assumed that compliance with both the bacterial and protozoal requirements of the Standards would be required. The second assumed that only compliance with the bacterial requirements would be required.
For non-compliant WTPs in the large population category, a telephone survey was conducted with the council asset managers to determine expected costs to comply with DWSNZ.
For non-compliant WTPs in the medium through to neighbourhood population categories, a cost model was developed. The cost model considered, based on the data available from the WINZ database, the quality of the source water and the population served for each treatment plant. These factors were used as the basis for determining an assumed existing treatment system and what upgrades would consequently be required for compliance. This enabled estimates of probable capital and operating costs to comply with DWSNZ to be determined.
Twelve case study WTPs were selected from the medium to neighbourhood population categories and used to test the reasonableness of the assumptions and costs derived from the cost model and to provide a basis for cost model adjustments if deemed to be required.
In terms of chemical non-compliance, the number of WTPs with transgressions above the Chemical Maximum Acceptable Value (MAV) was determined, and the cost model used to derive an estimate of probable additional cost to achieve chemical compliance.
CH2M Beca // 20 May 2010 // Page 2
6515967 // NZ1-2528063-63 2.6
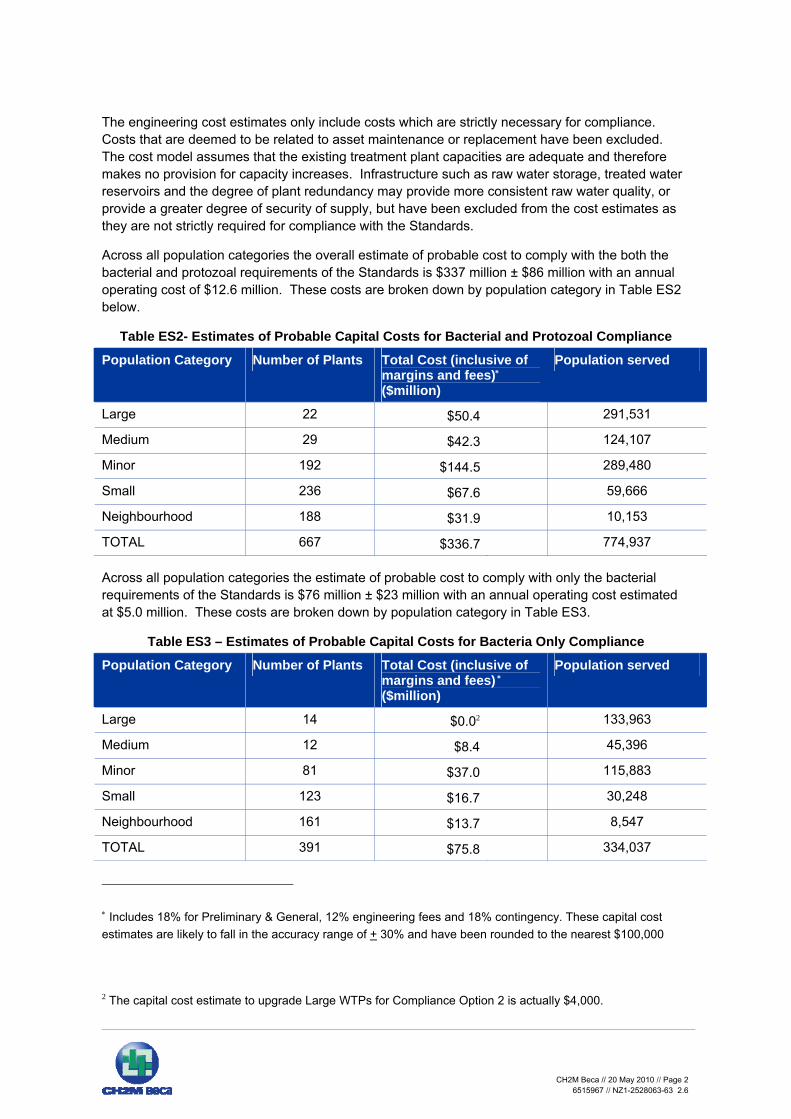
The engineering cost estimates only include costs which are strictly necessary for compliance. Costs that are deemed to be related to asset maintenance or replacement have been excluded. The cost model assumes that the existing treatment plant capacities are adequate and therefore makes no provision for capacity increases. Infrastructure such as raw water storage, treated water reservoirs and the degree of plant redundancy may provide more consistent raw water quality, or provide a greater degree of security of supply, but have been excluded from the cost estimates as they are not strictly required for compliance with the Standards.
Across all population categories the overall estimate of probable cost to comply with the both the bacterial and protozoal requirements of the Standards is $337 million ± $86 million with an annual operating cost of $12.6 million. These costs are broken down by population category in Table ES2 below.
Table ES2- Estimates of Probable Capital Costs for Bacterial and Protozoal Compliance
Population Category Number of Plants Total Cost (inclusive of margins and fees)∗ ($million)
Population served
Large 22 $50.4 291,531
Medium 29 $42.3 124,107
Minor 192 $144.5 289,480
Small 236 $67.6 59,666
Neighbourhood 188 $31.9 10,153
TOTAL 667 $336.7 774,937
Across all population categories the estimate of probable cost to comply with only the bacterial requirements of the Standards is $76 million ± $23 million with an annual operating cost estimated at $5.0 million. These costs are broken down by population category in Table ES3.
Table ES3 – Estimates of Probable Capital Costs for Bacteria Only Compliance
Population Category Number of Plants Total Cost (inclusive of margins and fees) ∗ ($million)
Population served
Large 14 $0.02 133,963
Medium 12 $8.4 45,396
Minor 81 $37.0 115,883
Small 123 $16.7 30,248
Neighbourhood 161 $13.7 8,547
TOTAL 391 $75.8 334,037
∗ Includes 18% for Preliminary & General, 12% engineering fees and 18% contingency. These capital cost estimates are likely to fall in the accuracy range of + 30% and have been rounded to the nearest $100,000
2 The capital cost estimate to upgrade Large WTPs for Compliance Option 2 is actually $4,000.

CH2M Beca // 20 May 2010 // Page 3
6515967 // NZ1-2528063-63 2.6
The estimate of probable cost to comply with the Chemical MAV limits is $5.2 million.
A sensitivity analysis was carried out and identified that significant capital cost savings could be made if the peak design demands were reduced. Peak design demands, based on typical New Zealand unmetered demands, of 1,200 L/person/day were used. These savings, which are in the order of 25% ($78 million) for a 60% reduction in peak demand (i.e. to 500 L/person/day) would have to be offset against the cost of implementing new legislation or initiatives aimed at water conservation and efficiency.
Cost estimates for point-of-entry and point-of-use systems were derived for both the small and neighbourhood population categories and compared with centralised treatment. Point-of-use is not recommended as it carries an inherently high risk of inadvertent consumption of untreated water. Point-of-entry system were comparable in cost with centralised treatment for the small population category but were shown to be cost competitive for neighbourhood sized supplies especially in combination with some centralised pre-treatment. The annual operating costs however are significantly higher.
The additional cost for water carriers to deliver Class 1 water was estimated at $36,000 per trader per year and at a total cost of $1.6 million per year.
To put the costs presented in this report into context, the country’s drinking water infrastructure was valued at about $11 billion in 2009. Local authorities’ operational expenditure for the years 2009 -2019 has been estimated at an average of $605 million/year. The average annual capital expenditure for 2009-2019 was estimated at $390 million (Auditor General’s Report 2010). Drinking water infrastructure is primarily made up of the following components: water treatment plants (WTPs), reticulation and reservoirs. This CBA has primarily focused on the WTPs.
CH2M Beca // 20 May 2010 // Page 4
6515967 // NZ1-2528063-63 2.6
1 Introduction
1.1 Purpose and Background
In implementing the Health (Drinking Water) Amendment Act 2007, the Ministry of Health (MoH) is undertaking a review that includes a rigorous, quantitative cost benefit analysis (CBA) of compliance with the Drinking-water Standards for New Zealand 2005 (revised 2008) (DWSNZ). The CBA will assist the MoH in developing its drinking water policies, and will be used in the review of the Capital Assistance Programme.
This report summarises the DWSNZ Cost Benefit Analysis – Engineering Input. It provides an outline of the key assumption, the methodology used to derive the costs, and the cost estimates.
The engineering input to the CBA has focused on the following activities:
i. Extraction from the WINZ database of the number of non-compliant WTPs for E.coli, protozoa and P2 determinands and subsequent grouping by population category, non-compliance type and source water quality.
ii. Assessment of the likely existing treatment processes for each WTP grouping
iii. Assessment of the least cost upgrade requirement for each WTP grouping based on bacterial compliance and for combined bacterial and protozoal compliance.
iv. Development of cost curves or lump sum costs for a number of different unit treatment processes which are then used to determine aggregate upgrade costs for each WTP grouping
v. A telephone survey of all water authorities with non-compliant WTPs that fall within the large population category.
vi. A series of detailed case studies for 12 WTPs within the medium, minor, small and neighbourhood population categories to validate the cost model output and to highlight the range of issues faced when looking at compliance on a case by case basis
vii. A review of the number of WTPs and/or distribution zones that have had P2 transgressions which exceed the chemical MAV limits and the costs associated with treatment
viii. A review of point of use/point of entry costs for small or neighbourhood communities
ix. A review of the costs associated with ensuring all tanker water for human consumption meets Class 1 requirements.
The reference year for the study has been taken as 2007/08. This is because the data obtained from the ESR annual surveys for that year have been validated and can be reviewed independently on the Drinking Water NZ website.
1.2 Structure of Report
Section 2 of the report describes the cost model development, the core assumptions and design basis and the cost model output as applied to the medium, minor, small and neighbourhood population categories for both capital and operating costs.

CH2M Beca // 20 May 2010 // Page 5
6515967 // NZ1-2528063-63 2.6
Section 3 presents the capital and operating costs for large WTPs as determined via the telephone survey.
Section 4 provides a detailed discussion of the case studies. Comparisons are made between the costs for upgrading given by the water suppliers and Beca’s assessment of what is required strictly for compliance. A further comparison with the cost model is given and is used to validate the core assumptions of the cost model.
Section 5 summarises all the capital and operating costs associated with bacterial and protozoal compliance for all population categories and includes adjustments to the cost model output based on the findings of the case studies.
Section 6 provides details and results from a sensitivity analysis of the assumed per capita demands.
Section 7 presents capital and operating costs associated with chemical MAV compliance.
Sections 8 & 9 while not strictly relating to compliance with the Standards provide further supporting information that may feed into policy discussions and development.
Section 10 presents the conclusions of the engineering input to the CBA.
1.3 Background to the Standards
The Drinking-Water Standards for New Zealand 1984 (Board of Health) were the first specifically New Zealand drinking water standards (but based on the World Health Organization Guidelines). These had a focus on bacteria by requiring testing for faecal or total coliforms, and for treated water turbidity to be less than 1 NTU for most of the time.
With the emergence of the health risks posed by the protozoa Giardia and then Cryptosporidium in the late 1980s, the Department of Health responded by incorporating some interim treatment requirements for Giardia in the 1993 Water Supply Grading. With the promulgation of the revised Drinking-Water Standards for New Zealand in 1995, the focus on the level of treatment changed markedly and protozoal compliance became the main driver of treatment upgrades. Significant research developments in the late 1990s allowed for the recognition of ultraviolet disinfection (UV) as a treatment technology for protozoa in the 2005 Standards, which for many suppliers offered a more cost-effective compliance option.
The focus of this report is compliance with the 2005 (revised 2008) Standards. It should be noted that compliance with the Standards is not strictly mandatory. However compliance with the Drinking Water Act is. There is a subtle difference between the two as described below.
The Health (Drinking Water) Amendment Act 2007 (the Act) took effect from 1 July 2008. Prior to this, local authorities had more discretion in the quality of the water they supplied to their residents and communities. While the Act does not require compliance with the DWSNZ, it does require reticulated drinking water suppliers to take all practicable steps to comply. Taking steps to implement an approved public health risk management plan is considered sufficient to comply with the "all practicable steps" duty. A public health risk management plan is essentially a quality assurance program for providing water. Compliance with the Act is staggered over several years, depending on the size of population served by the drinking water supply3.
3 Auditor Generals Report 2010: “Local authorities: Planning to meet the forecast demand for drinking water”
CH2M Beca // 20 May 2010 // Page 6
6515967 // NZ1-2528063-63 2.6
For the avoidance of doubt, we also note that the Act only required the implementation of “those provisions of the supplier’s public health risk management plan relating to the drinking water standards”.
1.4 Existing infrastructure
To put the costs presented in this report into context, the country’s drinking water infrastructure was valued at about $11 billion in 2009. Local authorities’ operational expenditure for the years 2009 -2019 has been estimated at an average of $605 million/year. The average annual capital expenditure for 2009-2019 was estimated at $390 million (Auditor General’s Report 2010). Drinking water infrastructure is primarily made up of the following components: water treatment plants (WTPs), reticulation and reservoirs. This CBA has primarily focused on the WTPs.
CH2M Beca // 20 May 2010 // Page 7
6515967 // NZ1-2528063-63 2.6
2 Cost Model Development
2.1 Source Water Classification
The following summarises the data sources and the decisions relating to how the data has been manipulated, and forms an important part of the design basis.
2.1.1 Data Source
All of the compliance data has been sourced from the WINZ database, which is held and managed by ESR on behalf of MoH. The reference year for the study is 2007/08.
2.1.2 Self Supplies
A self supplier is defined in the Health (Drinking Water) Amendment Act 2007, Section 69G, as:
“a person who owns a drinking-water supply that is exclusively used to supply water to –
a) 1 property that is also owned by that person; or
b) 1 or more buildings that are also owned by that person”
Self supplies are excluded from the CBA study as they do not come under the requirements of the DWSNZ, rather that they are covered by the Building Act, therefore self supplies have not been analysed further in this study. Some examples of typical self supplies are schools, marae and hospitals that are located beyond the area supplied by a drinking-water supply.
2.1.3 Relationship between Supplies, Zones, Water Treatment Plants and Population
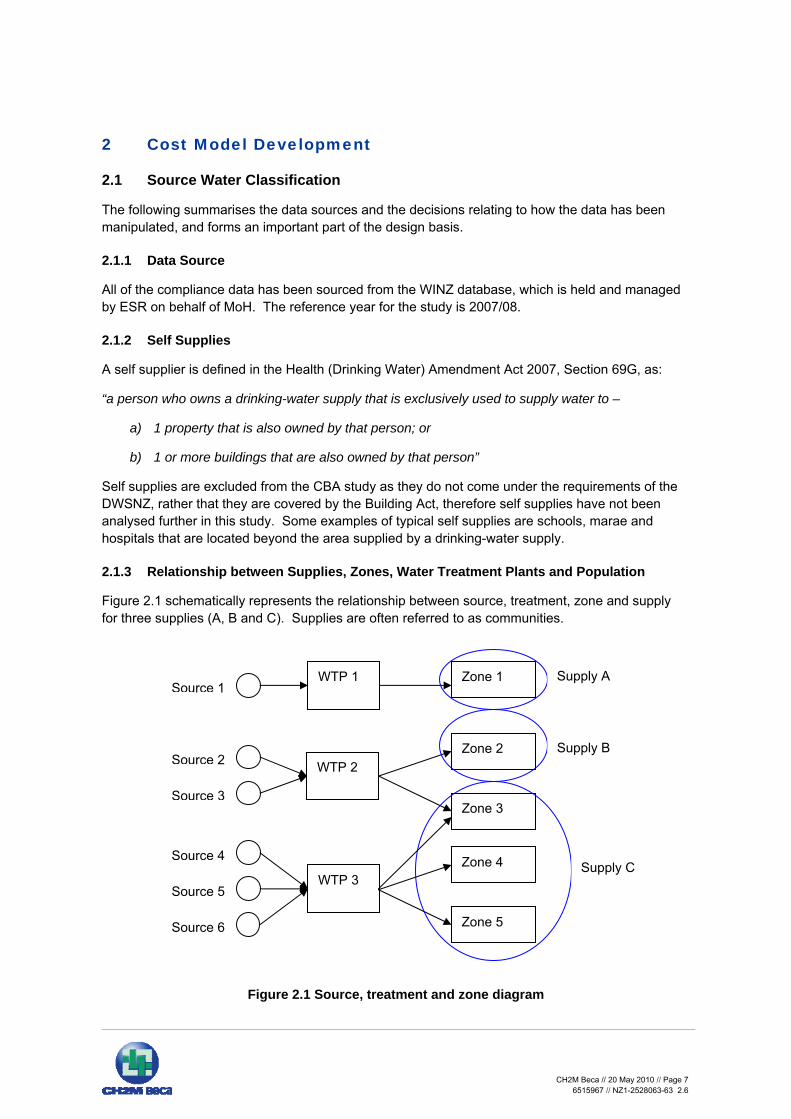
Figure 2.1 schematically represents the relationship between source, treatment, zone and supply for three supplies (A, B and C). Supplies are often referred to as communities.
Figure 2.1 Source, treatment and zone diagram
Source 1
Source 2
Source 3
Source 4
Source 5
Source 6
WTP 1
WTP 2
WTP 3
Zone 1
Zone 2
Zone 3
Zone 4
Zone 5
Supply A
Supply B
Supply C
CH2M Beca // 20 May 2010 // Page 8
6515967 // NZ1-2528063-63 2.6
Multiple water sources may serve a single water treatment plant. One or more water treatment plant (WTP) may serve a distribution zone (zone). Likewise a WTP may serve more than one zone. A supply is then made up of multiple zones which may in turn receive water from multiple treatment plants.
Protozoa compliance is based at the WTP level whereas E.coli compliance is based at both the zone and WTP level.
Within WINZ a water treatment plant population is based on the aggregate population of all the zones served by that WTP.
Although the costs of compliance will relate primarily to upgrading a given WTP, the benefit will relate to the population served. In many cases several WTPs may serve a single supply population and there can be discrepancies between the sum of the WTP design populations and the actual population of the supply; i.e. two or more water treatment plants may be sized to serve a population giving 100% redundancy. In addition some supplies will have primary and secondary WTPs for security of supply purposes. This can lead to inaccuracies in determining the population benefiting from the upgrade.
The WINZ data has been reviewed to identify where population overlaps occur and adjustments made to the cost matrix populations to enable the benefits to be more accurately assigned.
The population served by each WTP has been used as a proxy for the design capacity of the WTP.
2.1.4 Bacterial and Protozoa Compliance Status
The WINZ compliance data required further breakdown by bacterial and protozoa compliance status.
Protozoa Compliance
Protozoa compliance is straight forward as a WTP is deemed to be either compliant or not, based on the type and quality of the source water and whether it has met the specific requirements of DWSNZ for the installed treatment processes. The log removal requirement for protozoa compliance is defined for varying water sources by the DWSNZ and verified by the Drinking Water Assessor. Different treatment processes have assigned log removal credits so it is a relatively simple matter of adding the log credits to determine whether a plant is capable of meeting the overall log reduction requirements.
E.coli Compliance
E.coli compliance is less straight forward and required significant manipulation of the WINZ data.
Where non-compliance is due to “Inadequate monitoring, not enough samples, inadequate scheduling” or “not a recognised laboratory”, these are classified as administrative failures or “technical non-compliances” and the cost is limited to carrying out the correct bacterial monitoring for the size of supply. In the cost model we have allowed a nominal sum for increased/improved monitoring which is reported in the operating costs.
Where there is a “FAC4 transgression” it is assumed that the correct treatment is in place and that the transgression could be resolved through operational measures. Hence these are categorised it as a “technical non-compliance” requiring some upgrade to instrumentation and monitoring.
4 Free Available Chlorine

CH2M Beca // 20 May 2010 // Page 9
6515967 // NZ1-2528063-63 2.6
Where non-compliance is due to an E.coli transgression this is a clear non-compliance. From the dataset there were 207 WTPs that did not monitor E.coli at all and of those 87% belong
to either the Small or Neighbourhood population categories. Discussions with ESR indicate that in some cases not monitoring may be related to the knowledge that they do not comply, but for many small and neighbourhood WTPs it may be due to lack of organisation and/or funding. Where a WTP is not monitored at all, we have assumed the worse case; i.e. that the WTP is non-compliant for E.coli. One exception to this is with the Waipaoa WTP serving the Gisborne population (30,600). In that case it is not monitored all the time because the plant is a secondary supply and typically only operates for one to two weeks per year. This was picked up in the Large WTP telephone survey.
From the dataset there were 19 neighbourhood supplies that were exempt from E. coli monitoring. Discussion with ESR indicates that exempt plants tend to either be self supplies or to supply less than 3 buildings and have short reticulation distances. The water supplier is still required to undertake zone monitoring for E. coli compliance. These plants have been treated based on their zone compliance (which in all cases was non-compliant for E. coli).
Table 2.1 breaks down the total number of non-compliant treatment plants by bacterial and protozoal non-compliance and population category. Table 2.2 gives a similar breakdown but on the basis of the total population served.
Table 2.1 –Non-compliance by Type and Population Category (Number of WTPs)
Population Category
Non-compliant for Bacteria
Non-compliant for Protozoa
Non-compliant for both Bacteria and Protozoa
Total Non-Compliant
Large 0 8 14 22
Medium 0 17 12 29
Minor 1 111 80 192
Small 1 113 122 236
Neighbourhood 3 27 158 188
TOTAL 5 276 386 667

CH2M Beca // 20 May 2010 // Page 10
6515967 // NZ1-2528063-63 2.6
Table 2.2 – Non-compliance by Type and Population Category (Population)
Population Category
Non-compliant for Bacteria
Non-compliant for Protozoa
Non-compliant for both Bacteria and Protozoa
Total Non-Compliant
Large 05 157,568 133,963 291,531
Medium 0 78,711 45,396 124,107
Minor 606 173,597 115,277 289,480
Small 200 29,418 30,048 59,666
Neighbourhood 170 1,606 8,377 10,153
TOTAL 976 440,900 333,061 774,937
Note that E.coli compliance can be further broken down in terms of actual non-compliance or technical non-compliance as discussed above.
2.1.5 Source Water Categorisation
The type and quality of the source water was required for the WTPs (as opposed to the zones or supplies). Some of the sources are formally graded through collaboration by the water supplier and Drinking Water Assessor (DWA), with gradings being registered on the WINZ database. However many of the sources have not been formally graded. A consistent categorisation convention was required for the CBA to enable us to allocate the required log reductions for compliance. After consultation with ESR the following convention was agreed:
Where relevant data does exist for the source (from Source Grading questions Q126, Q137 and Annual Survey):
0 can only be a Secure Groundwater 1 is not secure but Q13 shows “Source has low risk of contamination” 2 is not 0 or 1 above and (all from Q12)
– the catchment is Protected AND – the catchment is Stable or Fairly consistent AND – Human pollution is Very unlikely or Not likely AND – Animal pollution is Very unlikely or Not likely AND
5 There is one WTP in the large population category that is only compliant for protozoa, however because the secondary supply for this community is non-compliant for both bacteria and protozoa, the population has been counted in the “Compliant for Neither Bacteria nor Protozoa” column. There will be other examples of this situation throughout all population categories.
6 Question 12 of the Public Health Grading of Community Drinking-Water Supplies Questionnaire applies to all surface waters and non-secure groundwaters. It is not applicable to secure groundwaters. The information is used in the drinking-water supply grading to determine the risk of contamination if water treatment is below standard.
7 Question 13 of the Public Health Grading of Community Drinking-Water Supplies Questionnaire applies to all surface waters and non-secure groundwaters. The information is used in the drinking-water supply grading to determine the risk of contamination for supplies receiving little or no treatment.
CH2M Beca // 20 May 2010 // Page 11
6515967 // NZ1-2528063-63 2.6
– Chemical pollution is Very unlikely or Possible/not likely 3 is not 0, 1 or 2 above (but is graded and so do have data regarding source quality).
Where relevant data did not exist for the Source:
G = a groundwater-type source R = a rainwater-type source. S = a surface water-type source
The ESR 0 to 3 codings were applied to all source types as a descriptor of quality (i.e. the likelihood that the source is contaminated) but only where source quality was known (i.e. the source was graded). Type 0 can only be groundwaters, many Type 1s will be groundwaters (non-secure) but it is possible for a surface water to meet the requirements of “low risk” as defined in the grading process. To be “low risk” the source is required to be of a higher quality/lower risk to that described as Type 2. Type 3s will almost all be surface waters and these have known contamination from humans and/or animals and/or chemicals. Where the source has been graded, then a Type of (for example) 2 represents the same quality water whether it comes from a groundwater, surface water or rainwater source.
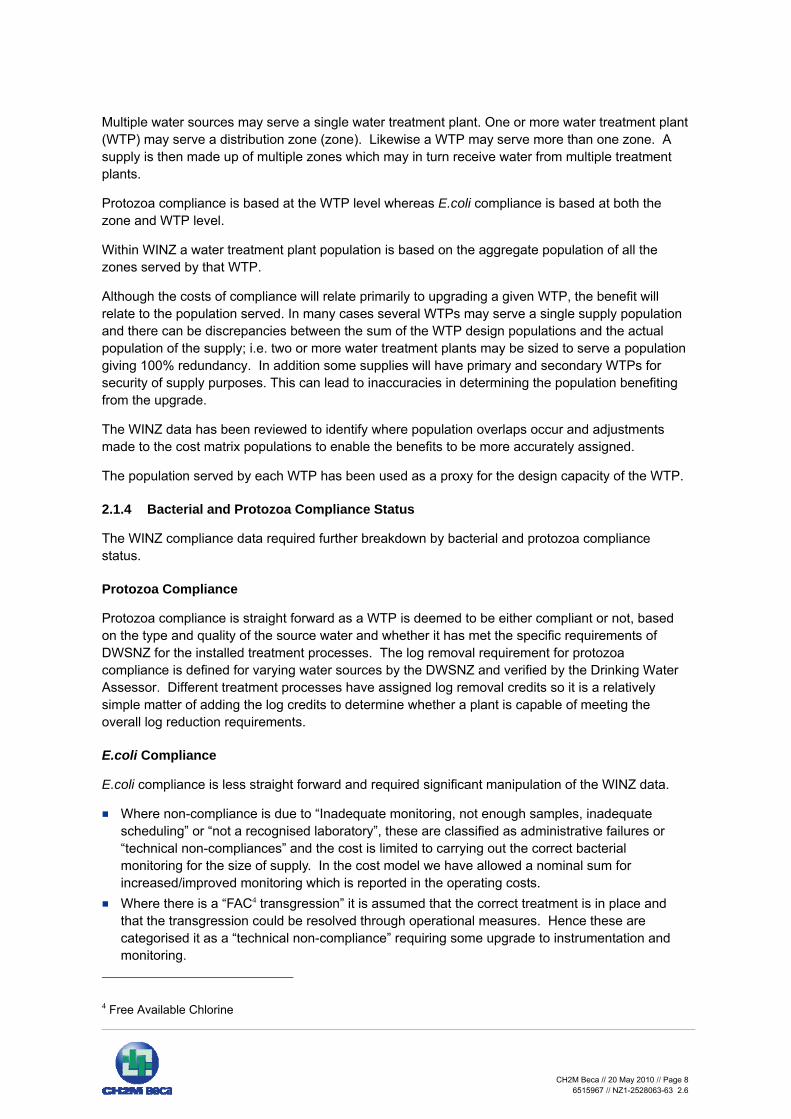
All ungraded sources were categorised into one of three types (Ground, Rain or Surface) and ranked in that order of diminishing quality. Source water qualities were ranked in order of best to worst as shown in Table 2.1.
Table 2.3 - ESR water quality ranking
ESR Category Quality ranking
0 Best
1 High quality
2 Medium
Ground (G)
Rain (R)
Surface (S)
3 Worst
Where a WTP received water from multiple sources, the sources were listed in order of graded and ungraded sources. For example:
TP00207 has three sources with qualities of 3,3,G. Two of the sources are known to be contaminated and the quality of the other is unknown but it is a groundwater-type and thus is likely to be of better quality than a surface source of unknown quality.
TP00334 has four sources with quality of 0,1,1,2. That is, one is secure groundwater, two are high quality but not secure groundwaters and one is a medium quality source.
This highlights that the quality of water entering a treatment plant can be complicated where there are multiple sources of varying or unknown quality. To simplify this in the cost benefit analysis (CBA), where there are multiple sources, the WTP treatment requirements have been determined according to the lowest quality source, for example TP00207 (as described above) would be based on Type 3 and TP00334 would be based on Type 2.

CH2M Beca // 20 May 2010 // Page 12
6515967 // NZ1-2528063-63 2.6
2.1.6 Source Water Categorisation Design Basis
In order to determine the compliance costs, the source water categories as defined above need to be allocated a log reduction requirement. Table 2.3 shows the log reduction assumption for each type of source water to meet the DWSNZ requirements.
Table 2.4 - Source Water Log Reduction Requirement
Log reduction requirement Equivalent ESR graded sources
No log reduction All sources of Type 0 ie Secure groundwater
High quality water (3 log) All sources categorised 1, 2, G & R, + 60% of S
Low quality water (4 log) 80% of Type 3 sources, 30% of S
Very low water quality (5 log) 20% of Type 3 sources, 10% of S
For each population category the number of non-compliant WTPs has been broken down by log reduction requirement. This is summarised in the design assumption and treatment matrix.
2.1.7 Flow and Population Design Basis
Following consultation with MoH the design flow for each population category has had the following principles applied:
Large WTPs (population >10,000) – design flow based on capacity advised by the water supplier. In the absence of actual design capacity a figure of 700 litres/person/day was used.
For WTPs serving populations <10,000 a higher per capita water usage rate of 1200 litres/person/day was used.
For each population category the WTP design flow was based on the per capita flow times the mean population for that category (based on population data received from ESR).
Table 2.5 gives the population design basis:
Table 2.5 - Population Design Basis
Population category Population band
Design population
Design Flow (m³/d)
Number of Non-Compliant WTPs
Medium 5001 – 10000 6900 8280 29
Minor 501 – 5000 2050 2460 192
Small 101 – 500 260 312 236
Neighbourhood < 100 55 66 188
Total 645
A copy of the design assumption and treatment matrix is attached in Appendix A.
It should be noted that the populations associated with the WTPs are based on the population registered in WINZ for the reference year ie 2007/2008. In some cases the population listed on the Drinking Water NZ website differs from that used in the study. This difference is because the population may have changed during the 2008/09 annual survey. For the purposes of the CBA all costs are related to the 2007/2008 population.

CH2M Beca // 20 May 2010 // Page 13
6515967 // NZ1-2528063-63 2.6
Rather than use the midpoint population of the population categories, which can cover a large range, the mean population has been used as the design population. For all population categories, the mean population was below the midpoint population.
2.2 Assessed Existing Treatment Processes
In order to determine the costs of complying with the DWSNZ we have had to assess what level of treatment a community actually has in place. Drawing on our experience of water treatment plants throughout New Zealand we have undertaken an assessment that assumes:
water suppliers typically have treatment systems in place that are matched to the source water the degree of non-compliance for each treatment plant as reported in the WINZ database
provides an indication of the shortcomings of each plant the treatment plant assets have been appropriately maintained.
For each population category and source water type we have developed a matrix that incorporates our assessment of a generic treatment process that is suitable for that water quality and is consistent with the type of non-compliance. In reality there will be significant variation from the processes selected as other factors such as process reliability, operability issues, availability of funds, the prevailing treatment trends of the time can all affect what treatment process a community or local authority has chosen to implement. Nevertheless we consider that the assumptions are reasonable based on our knowledge of WTPs around New Zealand.
2.3 Assumed Upgraded Treatment Processes
Based on the population category, source water type and the assumed existing treatment processes we were able to assume what treatment processes would be suitable to upgrade the plant to achieve compliance for E.coli, or E. coli and protozoa combined. Using our experience of designing upgrades of WTPs to meet the DWSNZ over the last 15 years we were able to select appropriate treatment processes. These were reality checked against the fundamental question of “what is the least cost treatment process required to achieve compliance?”
This question does not address the other questions a community may face when choosing how to upgrade their treatment system, such as:
which treatment process will give the greatest reliability of achieving compliance which treatment process gives the greatest flexibility of operation or can cope best with
fluctuations in raw water quality which is the easiest or most robust to operate which process provides the best match to the Water Authority’s level of operator training and/or
supervision.
Membrane treatment systems are gaining in popularity as they are seen as a robust technology that can reliably achieve compliance, especially as the Standards have developed over the last 15 years. Membranes normally cost more than conventional systems yet a community may choose them due to the perceived (and in many cases, actual) advantages of security of compliance, reliability and operability. We have not allowed for any membrane systems in the assumed upgrade as they have not been considered to be the least cost process for achieving compliance. We would note that these costs are coming closer together and it is anticipated in the short to medium term that membrane systems will be competitive with conventional systems, however for the purposes of the CBA they have been excluded.
The assumed existing treatment processes and upgrade processes are shown in the design assumption and treatment matrix in Appendix A.

CH2M Beca // 20 May 2010 // Page 14
6515967 // NZ1-2528063-63 2.6
2.4 Exclusions
The CBA excludes any costs which are deemed to be related to asset maintenance or replacement.
The cost model assumes that the existing treatment plant capacities are adequate and therefore makes no provision for capacity increases.
Infrastructure such as raw water storage, treated water reservoirs and the degree of plant redundancy may enable a WTP to have a more consistent raw water quality, or provide a greater degree of security of supply but are not strictly required for compliance with the Standards. In some cases implementing such infrastructure could be part of a supplier’s PHRMP, but unless it relates to DWSNZ is not required for the “all practicable steps” test. These items have therefore been excluded from the CBA as the costs are not directly attributable to complying with the Standards.
2.5 Reference Costing Data
2.5.1 Methodology
Reference costing information has been collated from previous Beca projects conducted primarily over the last 10 years for over 30 water treatment plants. The reference costs range in accuracy from preliminary design estimates, to detailed design estimates and tendered costs. The plants ranged in size from 0.02 MLD to 45 ML/day.
The costs for individual unit treatment processes were separated and percentage add-ons, for example Preliminary & General (P&G), design and contingency removed so that costs could be compared on a consistent basis. Where appropriate the costs were escalated to 2009 values8. Log-log graphs of WTP capacity versus treatment unit capital costs have been used to determine cost equations for each of the unit processes. These equations have then be used to scale the costs up or down based on the WTP design capacity. As a rule the costs included mechanical and electrical installation. For less scalable items, lump sum values were generated.
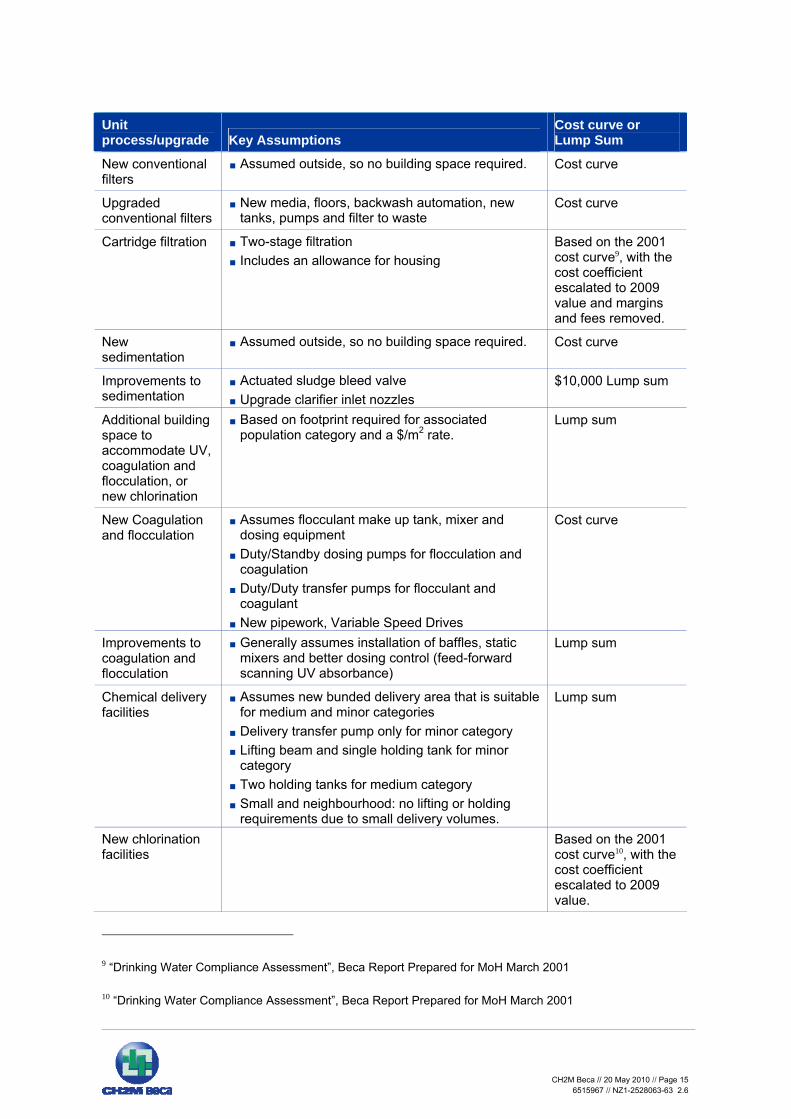
Many assumptions were made in generating the cost model and are summarised in the Table 2.6:
Table 2.6 - Cost Model Assumptions
Unit process/upgrade Key Assumptions
Cost curve or Lump Sum
UV Wide scatter in costs represents wide scatter in treatment requirements (i.e., water quality, UV transmissivity (UVT), log reduction requirement) – refer discussion following this table
For medium & minor population category assume duty/standby UV units
For small and neighbourhood population category assume duty UV unit only
Cost curve were generated based on provision of Duty/Standby units. For duty only assume half the cost from the cost curve
New building space required for all UV installations
Either new or upgrade to telemetry required
Assumed turbidity instrument and UVT sensor
Cost curve
8 Based on 3% inflation per year.
CH2M Beca // 20 May 2010 // Page 15
6515967 // NZ1-2528063-63 2.6
Unit process/upgrade Key Assumptions
Cost curve or Lump Sum
New conventional filters
Assumed outside, so no building space required. Cost curve
Upgraded conventional filters
New media, floors, backwash automation, new tanks, pumps and filter to waste
Cost curve
Cartridge filtration Two-stage filtration
Includes an allowance for housing Based on the 2001 cost curve9, with the cost coefficient escalated to 2009 value and margins and fees removed.
New sedimentation
Assumed outside, so no building space required. Cost curve
Improvements to sedimentation
Actuated sludge bleed valve
Upgrade clarifier inlet nozzles $10,000 Lump sum
Additional building space to accommodate UV, coagulation and flocculation, or new chlorination
Based on footprint required for associated population category and a $/m2 rate.
Lump sum
New Coagulation and flocculation
Assumes flocculant make up tank, mixer and dosing equipment
Duty/Standby dosing pumps for flocculation and coagulation
Duty/Duty transfer pumps for flocculant and coagulant
New pipework, Variable Speed Drives
Cost curve
Improvements to coagulation and flocculation
Generally assumes installation of baffles, static mixers and better dosing control (feed-forward scanning UV absorbance)
Lump sum
Chemical delivery facilities
Assumes new bunded delivery area that is suitable for medium and minor categories
Delivery transfer pump only for minor category
Lifting beam and single holding tank for minor category
Two holding tanks for medium category
Small and neighbourhood: no lifting or holding requirements due to small delivery volumes.
Lump sum
New chlorination facilities
Based on the 2001 cost curve10, with the cost coefficient escalated to 2009 value.
9 “Drinking Water Compliance Assessment”, Beca Report Prepared for MoH March 2001
10 “Drinking Water Compliance Assessment”, Beca Report Prepared for MoH March 2001

CH2M Beca // 20 May 2010 // Page 16
6515967 // NZ1-2528063-63 2.6
Unit process/upgrade Key Assumptions
Cost curve or Lump Sum
New filter to waste facilities
Due to insufficient reference sites we applied a power function to one site of known cost and size
Cost curve
New and upgraded telemetry
Overall difference in cost between new and upgraded telemetry minor. Same price used for both
Lump sum
Feed-forward scanning UV absorbance controls package (applied to both new and improved coagulation and flocculation)
For medium and minor sized plants it is applied to 50% of plants where new or upgraded coagulation and flocculation is required and the source water quality is less than secure (0 log reduction)
For small and neighbourhood sized plants, it is applied to 50% of plants where new or upgraded coagulation and flocculation is required and the source water quality is requires more than a 3 log removal for protozoa.
Lump sum
New instrumentation such as UVT, turbidity
UVT meters allowed for within the UV cost. Turbidity meters allowed for when UV or coagulation added or improved
Lump Sum
Remedial work to well heads
Price based on population category Lump Sum
Some of the cost curves showed greater scalability than others. For example the new sedimentation cost curve showed excellent scalability as seen by both a high power value and R2
value whereas the UV cost curve showed significant scatter. This scatter can be explained by the fact that UV sizing is not just a function of flow. The number of UV lamps is also dictated by the water quality (i.e., UV transmissivity) and the log reduction required. For example a decrease in UVT of just 10% can result in a decreased hydraulic capacity of more than 50% resulting in significantly more lamps to achieve the same dose at the same design flow. However the cost equation is being applied to a large number of WTPs which do in fact have wide ranging water quality and log reduction requirements, so in fact we consider that the net result will be a reasonable representation of reality.
Some upgrade items are non scalable in which case a lump sum value was applied. A typical example of this is coagulation and flocculation control. Current trends are to use a feed-forward scanning UV absorbance system, rather than the traditional streaming current monitor, for this function. The cost of this item is approximately $75,000 regardless of WTP size. Consequently costs for implementing coagulation and flocculation for small or neighbourhood supplies can seem disproportionately large. For WTPs with less variable raw water quality, a feed forward scanning UV absorbance control package would not be justifiable. Accordingly it is assumed that only half the plants in the medium and minor population category where the upgrade includes new or upgraded coagulation and flocculation will require this level of control. For small and neighbourhood plants, it is assumed that only 50% of plants that require new or upgraded coagulation and flocculation and have a source water quality that requires 4 log protozoa removal or higher will require this level of control.
Once the overall upgrade capital cost has been determined a consistent percentage for P&G, design and contingency has been added to each upgrade option. P&G is not a profit margin, rather it covers the contractor’s onsite and offsite overheads, and includes amongst others;
Site establishment including site offices, provision of temporary services (water, electricity etc) and site access

CH2M Beca // 20 May 2010 // Page 17
6515967 // NZ1-2528063-63 2.6
General attendance upon the works by the contractor Care and security of the works Provision of plant, tools, scaffolding, cranage, environmental protection measures and testing Management, supervisions and administration of the works.
Based on recent construction contracts we have assumed a rate of 18% for P&G, 12% for design and construction management and due to the variability and accuracy of the cost data we have assumed a further 18% contingency. These percentage add-ons (herein referred to as ‘margins and fees’) are a very real and significant cost in any construction project and do need to be considered. P&G and contingency can vary between 15% and 20%, we have therefore used 18% as a midpoint. Design and construction management fee costs of 12% are based on the ACENZ/IPENZ Fee Guidelines for Consulting Engineering Services 200411 and are less likely to fluctuate than P&G or contingency.
2.5.2 Bacterial Compliance versus Bacterial + Protozoal Compliance
Two options for compliance with DWSNZ have been considered.
Option 1 - Full compliance with the Standards, in other words compliance with both the bacterial and protozoal requirements, is assumed to be the default option in terms of compliance.
Option 2 - Compliance with only the bacterial requirements of the Standards is required is considered separately, and is included for the sake of policy option development.
Compliance with only the bacterial requirements of DWSNZ would provide a lower cost option than making full compliance (bacterial and protozoal) mandatory.
Tables 2.7 outlines the differences in the number of WTPs and population affected by the two compliance options.
11 Based on Category HH with a Design Fee of 10% and Construction Monitoring fee of 2%.

CH2M Beca // 20 May 2010 // Page 18
6515967 // NZ1-2528063-63 2.6
Table 2.7 –Number of Non-Compliant WTPs and Population Served by Population Category for Options 1 and 2
Option 1 (Bacteria and Protozoa Compliance Required)
Option 2 (Bacteria Compliance Only Required)
Population Category
Number of WTPs
Population Served
Number of WTPs
Population Served
Large 22 291,531 14 133,963
Medium 29 124,107 12 45,396
Minor 192 289,480 81 115,883
Small 236 59,666 123 30,248
Neighbourhood 188 10,153 161 8,547
TOTAL 667 774,937 391 334,037
In order to determine the cost to comply with only the bacterial requirements of the Standards, for each source water category the assumed upgraded treatment process was modified to reflect the altered compliance requirements. The assumed treatment processes for bacterial only compliance is presented in Appendix C.
2.6 Cost Model Capital Cost Summaries
Table 2.9 summarises the total cost (based on the cost model) to upgrade all of the non-compliant WTPs for each population category (excluding the large WTP category which covered in Section 3).
Estimates of probable cost for capital expenditure are provided in Table 2.8 (Option 1 - bacteria and protozoa compliance) and Table 2.9 (Option 2 - bacteria only compliance). These capital cost estimates are likely to fall in the accuracy range of + 30%.
Note that the costs presented in Tables 2.8 and 2.9 were changed based on corroboration with the Case Studies. The Case Studies are used to confirm that the outputs from the cost model are reasonable. The final costs, including any alterations made from the analysis of the Case Studies, are presented in Section 5.
Table 2.8 – Estimates of Probable Capital Costs for Neighbourhood, Small, Minor and Medium Population Categories for Compliance Option 1
Population Category Number of Plants
Total Capital Costs
Total Cost (inclusive of margins and fees)*
Population served
Medium 29 $25,100,000 $39,200,000 124,107
Minor 192 $87,300,000 $136,100,000 289,480
Small 236 $43,300,000 $67,600,000 59,666
Neighbourhood 188 $20,500,000 $31,900,000 10,153
TOTAL 645 $176,200,000 $274,800,000 483,406

CH2M Beca // 20 May 2010 // Page 19
6515967 // NZ1-2528063-63 2.6
Table 2.9 - Estimates of Probable Capital Costs for Neighbourhood, Small, Minor and
Medium Population Categories for Compliance Option 2
Population Category Number of Plants
Total Capital Costs
Total Cost (inclusive of margins and fees)*
Population served
Medium 12 $5,400,000 $8,400,000 45,396
Minor 81 $19,900,000 $31,000,000 115,883
Small 123 $10,700,000 $16,700,000 30,248
Neighbourhood 161 $8,800,000 $13,700,000 8,547
TOTAL 377 $44,800,000 $69,800,000 200,074
*Includes 18% P&G, 12% fees and supervision and 18% contingency.
2.6.1 Factors Influencing Cost
The likely accuracy range of ±30% relates to the inherent uncertainties when estimating the probable cost for capital works. It should be noted that the cost model itself is based on the mean population for each population category. While this introduces some inaccuracy in the estimate of probable cost per plant, as individual WTPs may serve a significantly higher or lower population than the mean for that category, this has been mitigated as much as possible by the use of the mean population in each population category.
Construction costs for water projects can also be affected by many other external factors such as currency exchange and whether the construction industry as a whole is booming or not. Over the last 10 years we have seen both a booming economy and a recession and swings in NZ currency value both of which have had significant impact on tendered costs. The following is a summary of factors which may have significant impact on out-turn costs.
Proportion of plant that is imported and therefore subject to currency exchange fluctuation. For WTPs it would be reasonable to assume 30 – 40% of the total cost is on imported materials/equipment and etc. In the past 10 years the New Zealand dollar has ranged between 0.34 and 0.812 against the US dollar resulting in significant potential swings in cost of imported goods.
Contractor’s appetite for the work. During the recent construction industry boom it was noticeably harder to attract multiple tenders from construction companies for utility type projects. In addition the tendered prices tended to be higher. More recently tendered prices have come down reflecting more of an appetite for the work during the recession.
Location of project – remote areas tend to attract fewer tenders and have higher costs. This is largely to cover more expensive mobilisation and the costs of bringing contractors into the area to do the work; i.e., insufficient local skills or number of workers to carry out the work.
The CBA is based on a design per capita consumption of 1,200 L/person/day for the medium, minor, small and neighbourhood population categories. Reducing this flow can have a significant impact on cost as it can:
12 Ref: New Zealand Reserve Bank Website: NZ Dollar and TWI for 1990 - 2010
CH2M Beca // 20 May 2010 // Page 20
6515967 // NZ1-2528063-63 2.6
Extend the existing plant’s life before a capacity upgrade is required New processes required for compliance will be smaller and hence lower cost.
Section 6 explores the sensitivity of cost to per capita consumption in more detail.
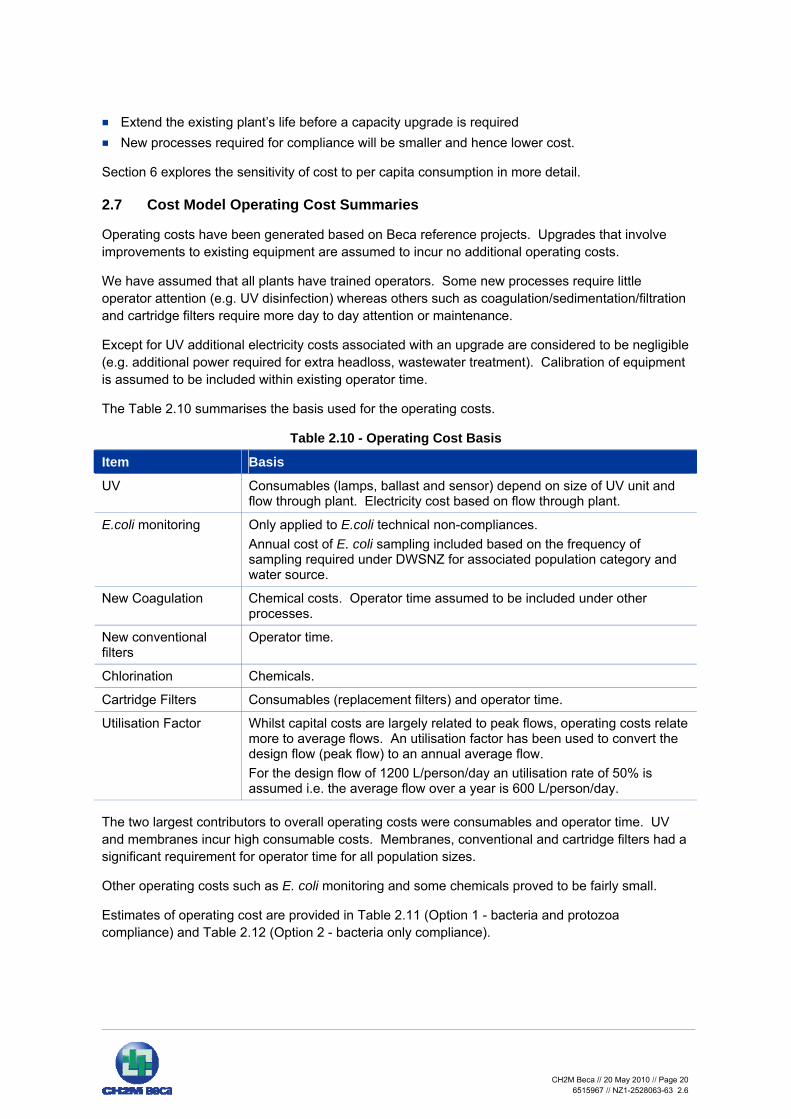
2.7 Cost Model Operating Cost Summaries
Operating costs have been generated based on Beca reference projects. Upgrades that involve improvements to existing equipment are assumed to incur no additional operating costs.
We have assumed that all plants have trained operators. Some new processes require little operator attention (e.g. UV disinfection) whereas others such as coagulation/sedimentation/filtration and cartridge filters require more day to day attention or maintenance.
Except for UV additional electricity costs associated with an upgrade are considered to be negligible (e.g. additional power required for extra headloss, wastewater treatment). Calibration of equipment is assumed to be included within existing operator time.
The Table 2.10 summarises the basis used for the operating costs.
Table 2.10 - Operating Cost Basis
Item Basis
UV Consumables (lamps, ballast and sensor) depend on size of UV unit and flow through plant. Electricity cost based on flow through plant.
E.coli monitoring Only applied to E.coli technical non-compliances. Annual cost of E. coli sampling included based on the frequency of sampling required under DWSNZ for associated population category and water source.
New Coagulation Chemical costs. Operator time assumed to be included under other processes.
New conventional filters
Operator time.
Chlorination Chemicals.
Cartridge Filters Consumables (replacement filters) and operator time.
Utilisation Factor Whilst capital costs are largely related to peak flows, operating costs relate more to average flows. An utilisation factor has been used to convert the design flow (peak flow) to an annual average flow. For the design flow of 1200 L/person/day an utilisation rate of 50% is assumed i.e. the average flow over a year is 600 L/person/day.
The two largest contributors to overall operating costs were consumables and operator time. UV and membranes incur high consumable costs. Membranes, conventional and cartridge filters had a significant requirement for operator time for all population sizes.
Other operating costs such as E. coli monitoring and some chemicals proved to be fairly small.
Estimates of operating cost are provided in Table 2.11 (Option 1 - bacteria and protozoa compliance) and Table 2.12 (Option 2 - bacteria only compliance).

CH2M Beca // 20 May 2010 // Page 21
6515967 // NZ1-2528063-63 2.6
Table 2.11 - Estimates of Operating Costs for Neighbourhood, Small, Minor and Medium Population Categories for Compliance Option 1
Population Category Number of Plants Annual Operating Cost Population served
Medium 29 $1,060,000 124,107
Minor 192 $3,810,000 289,480
Small 236 $4,810,000 59,666
Neighbourhood 188 $2,370,000 10,153
TOTAL 645 $12,050,000 483,406
Table 2.12 - Estimates of Probable Operating Costs for Neighbourhood, Small, Minor and
Medium Population Categories for Compliance Option 2
Population Category Number of Plants Annual Operating Cost Population served
Medium 12 $180,000 45,396
Minor 81 $460,000 115,883
Small 123 $2,460,000 30,248
Neighbourhood 161 $1,680,000 8,547
TOTAL 377 $4,780,000 200,074

CH2M Beca // 20 May 2010 // Page 22
6515967 // NZ1-2528063-63 2.6
3 Large Population WTPs
3.1.1 Methodology
A total of 30 WTPs each serving populations greater than 10,000 were identified as non-compliant for either E.coli or protozoa in the 2007/08 annual survey. Due to the larger size of the treatment plants within this category, the range of treatment processes likely to be found and the fact that many of the local authorities (LAs) responsible for the supply will already be actively planning how to achieve compliance or in the process or implementing an upgrade it was considered more accurate to determine costs on a case by case basis from the Councils’ own in-house or consultants’ estimates. Beca conducted a number of telephone interviews with 15 LAs to determine the following:
Source water and grading if known WTP design capacity Existing treatment processes Reason for non-compliance Log reduction required for compliance Whether upgrade works have been conducted since the 2007/08 annual survey If no works implemented, what is the LA strategy for achieving compliance and timeframes to
implement If there are any Council capital and/or operating cost estimates for achieving compliance (where
none available Beca made an assessment).
3.1.2 Survey results
The 30 non-compliant large population category WTPs serve 17 parent communities which supply a total population of 380,000. They are managed by 15 different Local Authorities.
All bar one WTP were non-compliant for protozoa, with the majority requiring either UV for compliance or modifications to bores to provide greater security. Nineteen of the WTPs were also non-compliant for E.coli. Most of the E.coli non-compliances were due to insufficient monitoring or insufficient FAC (free available chlorine), three related to secondary or emergency treatment plants that operate infrequently (typically less than two weeks/year) and hence are unable to meet E.coli operational monitoring requirements.
Since the 2007/2008 annual survey was conducted eight of the WTPs have either undergone upgrading for/proving compliance, are in the process of upgrading or in one case is to be shortly decommissioned. As these projects are currently live with committed funding the costs have been excluded from the CBA. Of the remaining 22 WTPs, 15 have clearly defined strategies in place to achieve compliance and are working towards implementing but have not yet committed the funding. Six are still in the planning and optioneering phase. A summary of the survey findings is presented in Appendix B
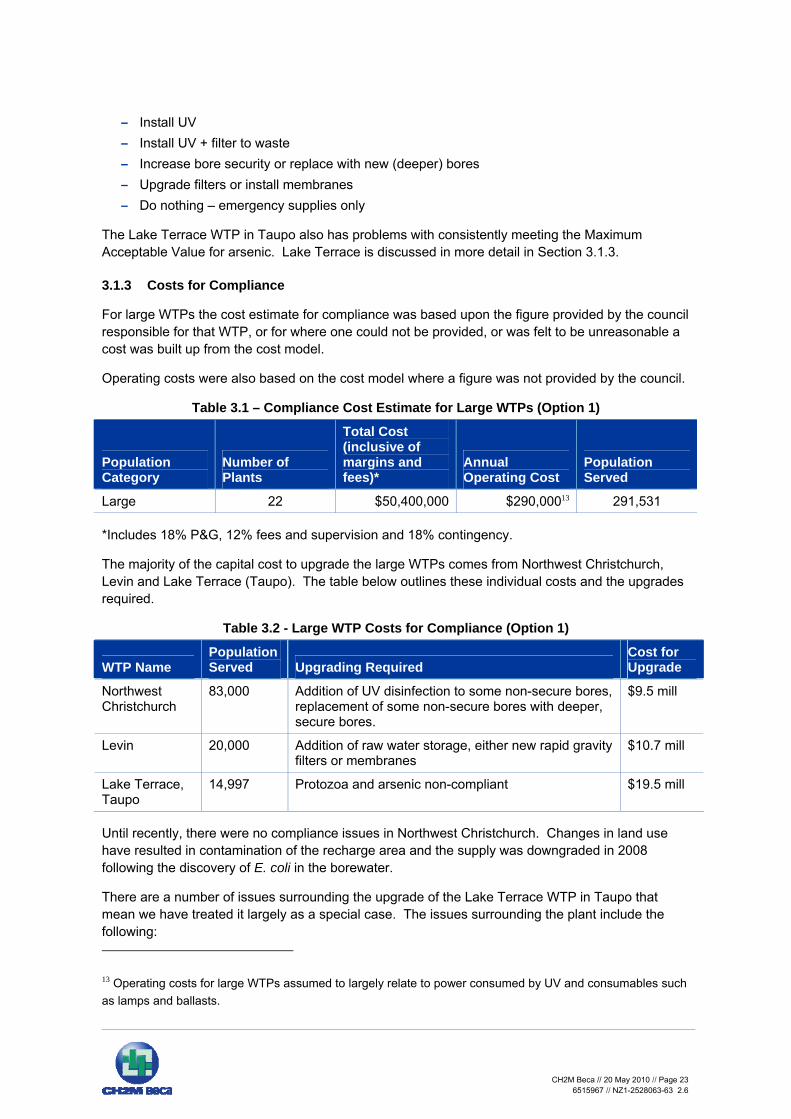
For Large WTPs the costs of compliance primarily come down to the following upgrade options:
E.coli (19 non-compliances) – Implement better E.coli sampling programs (operating cost) – Install more online instrumentation for FAC sampling – Do nothing – emergency supplies only
Protozoa (29 non-compliances)
CH2M Beca // 20 May 2010 // Page 23
6515967 // NZ1-2528063-63 2.6
– Install UV – Install UV + filter to waste – Increase bore security or replace with new (deeper) bores – Upgrade filters or install membranes – Do nothing – emergency supplies only
The Lake Terrace WTP in Taupo also has problems with consistently meeting the Maximum Acceptable Value for arsenic. Lake Terrace is discussed in more detail in Section 3.1.3.
3.1.3 Costs for Compliance
For large WTPs the cost estimate for compliance was based upon the figure provided by the council responsible for that WTP, or for where one could not be provided, or was felt to be unreasonable a cost was built up from the cost model.
Operating costs were also based on the cost model where a figure was not provided by the council.
Table 3.1 – Compliance Cost Estimate for Large WTPs (Option 1)
Population Category
Number of Plants
Total Cost (inclusive of margins and fees)*
Annual Operating Cost
Population Served
Large 22 $50,400,000 $290,00013 291,531
*Includes 18% P&G, 12% fees and supervision and 18% contingency.
The majority of the capital cost to upgrade the large WTPs comes from Northwest Christchurch, Levin and Lake Terrace (Taupo). The table below outlines these individual costs and the upgrades required.
Table 3.2 - Large WTP Costs for Compliance (Option 1)
WTP Name Population Served Upgrading Required
Cost for Upgrade
Northwest Christchurch
83,000 Addition of UV disinfection to some non-secure bores, replacement of some non-secure bores with deeper, secure bores.
$9.5 mill
Levin 20,000 Addition of raw water storage, either new rapid gravity filters or membranes
$10.7 mill
Lake Terrace, Taupo
14,997 Protozoa and arsenic non-compliant $19.5 mill
Until recently, there were no compliance issues in Northwest Christchurch. Changes in land use have resulted in contamination of the recharge area and the supply was downgraded in 2008 following the discovery of E. coli in the borewater.
There are a number of issues surrounding the upgrade of the Lake Terrace WTP in Taupo that mean we have treated it largely as a special case. The issues surrounding the plant include the following:
13 Operating costs for large WTPs assumed to largely relate to power consumed by UV and consumables such as lamps and ballasts.

CH2M Beca // 20 May 2010 // Page 24
6515967 // NZ1-2528063-63 2.6
Lake Terrace is non-compliant for Protozoa and has periodic transgressions for arsenic. Ultrafiltration initially suggested as an option for the upgrade, but there are concerns that this
process will not address the requirement for arsenic removal. Other treatment options are currently being investigated by Taupo DC but have not reached a
stage where a reliable cost estimate can be produced. There is a very limited footprint available at the existing WTP site (situated between the lake
edge and a steep bank/State Highway 1), and any process upgrades that require additional footprint will most likely require a new site to be found which creates location, acquisition, networking and consenting issues.
Because of the arsenic there are very limited disposal options for the waste stream from the WTP.
Current peak water use for Lake Terrace is estimated at 1,670 L/person/day based on current plant capacity (25 ML/day). A potential cost saving could be realised if per capita consumption could be reduced as this water use rate is high and a plant capacity increase to 30 ML/day is being considered as part of the upgrade works.
$19.5 million has been allocated in the Taupo LTCCP for the upgrade of the WTP. At this time, this is the only figure which Taupo District Council is comfortable to put against this project stating that to report costs at this stage would be premature. The complex issues listed above make building up a cost from scratch very difficult, and thus the LTCCP figure has been used in the large WTP cost estimate.
3.2 Large WTP Cost for Option 2 - Bacterial Compliance Only
To achieve compliance with only the bacterial requirements of the Standards, all large WTPs require improved online monitoring for FAC or more frequent E. coli sampling programmes. For some WTPs where there was insufficient monitoring, it was assumed that the source was secure but this had not yet been proven. For these cases a capital cost of $2,000 was allowed to prove security, but no additional operating cost for E. coli monitoring as the existing monitoring system was assumed to be adequate once security was proven.
The three emergency/backup supplies would still be unable to meet the monitoring requirements for compliance due to their infrequent use.
Therefore the cost of complying with only the bacterial requirements of the Standards is given in Table 3.3.
Table 3.3 – Compliance Cost Estimate for Large WTPs (Bacteria Only)
Population Category
Number of Plants
Total Cost (inclusive of margins and fees)*
Annual Operating Cost
Population Served
Large 14 $4,000 $300 133,963
*Includes 18% P&G, 12% fees and supervision and 18% contingency.
CH2M Beca // 20 May 2010 // Page 25
6515967 // NZ1-2528063-63 2.6
4 Case Studies
4.1 Approach
Case studies were undertaken in order to confirm that the scope of upgrading work required and the cost estimates presented in Section 2 are reasonable. In each of the population categories (5,001 - 10,000; 501 - 5,000; 101 – 500; and 25 – 100), we selected three community water supplies for study, and approached the relevant water supply authority. The basis of the selection is described in section 3.2 following.
Because the focus of the CBA is to identify costs strictly associated with compliance only, the water supply authority was asked to provide as much of a breakdown of costs as possible so that such costs could be excluded. Examples of costs that are not strictly necessary for compliance include such things as asset renewals on existing infrastructure, components of the water supply not related to improved treatment (e.g. intakes and reservoirs), treatment for aesthetic parameters, and selecting a treatment technology that is more expensive than the minimum required for compliance.
A much greyer area is that associated with what level of treatment a community could have been expected to have in place prior to 1995, so that costs that are not directly associated with complying with DWSNZ changes since 1995 can be excluded. The approach has been taken that water suppliers are assumed to have had treatment systems in place that were matched to the source water and complied with the DWSNZ 1984.
However, deciding the details of what is strictly necessary for compliance is difficult, and in each of the case studies where scope and costs have been excluded, we have provided a commentary for the rationale of that exclusion.
4.2 Identification of Suitable Case Studies
We identified suitable communities for the case studies on the following basis:
the water treatment plant (WTP) of the community served a population that matched one of the four population categories (5,001 - 10,000, 501 - 5,000, 101 – 500, and 25 – 100)
the WTP was not serving a self-supplier (e.g. schools, marae) for the 2007/08 year the WTPs were reported in WINZ as having E. coli compliance (although
this was too difficult for the smaller WTPs), but not having protozoa compliance.
The selection was made to give a reasonable geographic spread across New Zealand, a mix of different source waters, and being Council owned wherever possible.
Three of the initial selection had to be discarded because the supplier had only done limited planning for the upgrading, and did not know the scope and/or cost of the upgrading work. These were replaced with other WTPs.
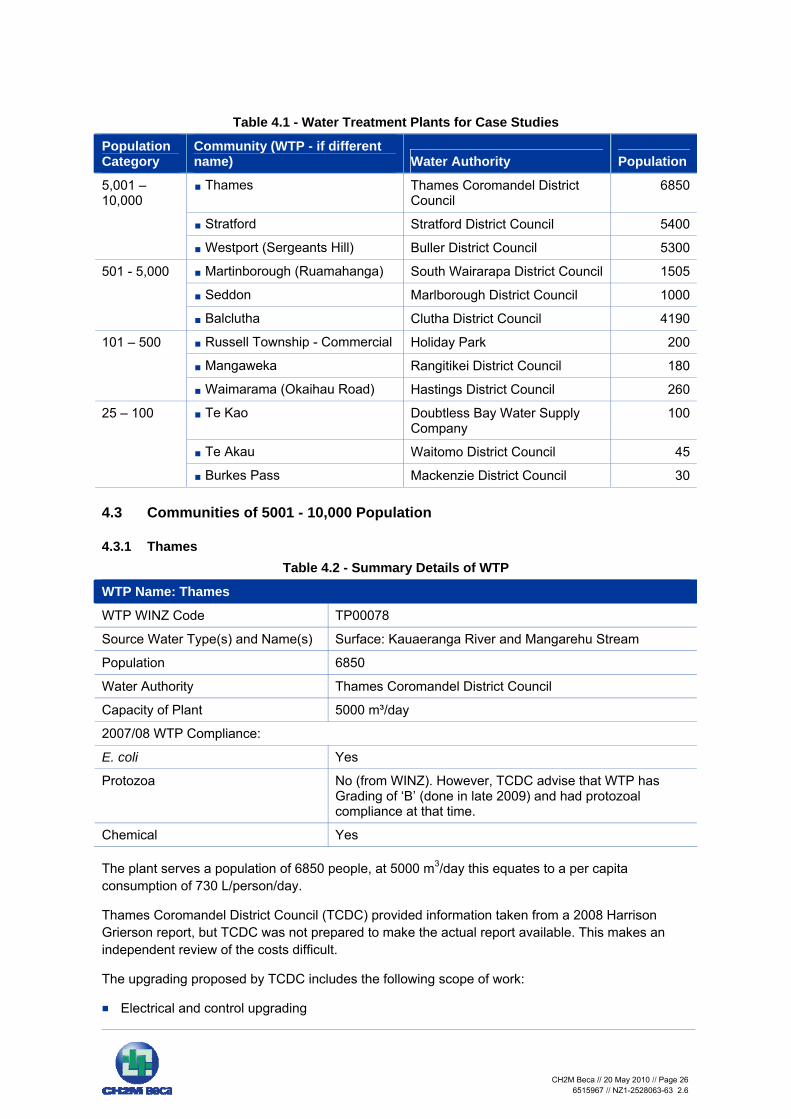
Table 4.1 lists the WTPs finally selected for the case studies.
CH2M Beca // 20 May 2010 // Page 26
6515967 // NZ1-2528063-63 2.6
Table 4.1 - Water Treatment Plants for Case Studies
Population Category
Community (WTP - if different name) Water Authority Population
Thames Thames Coromandel District Council
6850
Stratford Stratford District Council 5400
5,001 – 10,000
Westport (Sergeants Hill) Buller District Council 5300
Martinborough (Ruamahanga) South Wairarapa District Council 1505
Seddon Marlborough District Council 1000
501 - 5,000
Balclutha Clutha District Council 4190
Russell Township - Commercial Holiday Park 200
Mangaweka Rangitikei District Council 180
101 – 500
Waimarama (Okaihau Road) Hastings District Council 260
Te Kao Doubtless Bay Water Supply Company
100
Te Akau Waitomo District Council 45
25 – 100
Burkes Pass Mackenzie District Council 30
4.3 Communities of 5001 - 10,000 Population
4.3.1 Thames Table 4.2 - Summary Details of WTP
WTP Name: Thames
WTP WINZ Code TP00078
Source Water Type(s) and Name(s) Surface: Kauaeranga River and Mangarehu Stream
Population 6850
Water Authority Thames Coromandel District Council
Capacity of Plant 5000 m³/day
2007/08 WTP Compliance:
E. coli Yes
Protozoa No (from WINZ). However, TCDC advise that WTP has Grading of ‘B’ (done in late 2009) and had protozoal compliance at that time.
Chemical Yes
The plant serves a population of 6850 people, at 5000 m3/day this equates to a per capita consumption of 730 L/person/day.
Thames Coromandel District Council (TCDC) provided information taken from a 2008 Harrison Grierson report, but TCDC was not prepared to make the actual report available. This makes an independent review of the costs difficult.
The upgrading proposed by TCDC includes the following scope of work:
Electrical and control upgrading

CH2M Beca // 20 May 2010 // Page 27
6515967 // NZ1-2528063-63 2.6
Installation of VSDs on raw water pumps to allow slow start of clarifier Chemical mixing improvements (automation of chlorine and improved flash mixing) Pipework modifications to existing two Paterson Candy horizontal pressure filters to improve
process control (bypassing of filters to allow clarifier to stay in service during filter backwash, and modification to filter pipework to allow one filter to remain operational during backwash)
Installation of filter-to-waste pipework Possibly UV if protozoa monitoring shows a 4 log requirement.
Although the number of protozoal log credits required for compliance is unknown, TCDC advised that it was allocated an interim default log credit of 3 under DWSNZ 2005, but as of 31 December 2008 this has now defaulted to 4 log. Although protozoa monitoring is proposed, and may show that only 3 log removal is actually required, we have assumed the worst case (4 log) at this point in time.
Table 4.3 following summarises the proposed and assessed compliance cost estimates (note that where a range of costs was provided by TCDC, the table only includes the larger figure, and all dollar values have been rounded up to the nearest $5,000).
Table 4.3 - Summary of Proposed and Assessed Compliance Cost Estimates
Proposed by Water Authority Beca Assessment of Compliance
Scope Item Cost Estimate Comments on, or Modification to, Scope Cost Estimate
Electrical upgrades $20,000 Assume 50% of this cost is asset renewal and other 50% necessary for compliance
$10,000
Chemical mixing improvements
$15,000 $15,000
VSDs on raw water pumps $110,000 Slow start likely to be more cost effectively achieved by installation of modulating valve on raw water pipeline
$15,000
Filter pipework modifications $175,000 This appears to be a high cost to improve what is recognised as a fairly poor-performing filter design. Depending upon condition of existing filters and their historical performance, it may be more economic and/or necessary to replace with new filters. Therefore allow for new filters.
$560,000
Filter-to-waste $30,000 Included in new filters cost. -
UV $60,000 Delete, as new filters will be able to achieve 4 log.
-

CH2M Beca // 20 May 2010 // Page 28
6515967 // NZ1-2528063-63 2.6
Proposed by Water Authority Beca Assessment of Compliance
Scope Item Cost Estimate Comments on, or Modification to, Scope Cost Estimate
SUBTOTAL $410,000 SUBTOTAL $600,000
Preliminary & general 18% $110,000
Engineering 12% $90,000
Contingency
$220,000
18% $150,000
TOTAL $630,000 TOTAL $950,000
We have allowed for replacement filters as the old Paterson Candy horizontal pressure filters, while a suitable treatment process for the time in which they were installed, are not a suitable process for the current standards. Allowing for replacement with new rapid gravity filters is considered appropriate in this case.
If only 3 log protozoal removal is found to be required, the existing pressure filters may be able to be retained as a pre-treatment for a new UV unit, which would significantly reduce the Beca assessed cost.
4.3.2 Stratford Table 4.4 - Summary Details of WTP
WTP Name: Stratford
WTP WINZ Code TP00347
Source Water Type(s) and Name(s) Surface: Konini Stream and Patea River
Population 5400
Water Authority Stratford District Council
Capacity of Plant 4,000 m3/day
2007/08 WTP Compliance:
E. coli Yes
Protozoa No
Chemical Yes
The plant serves a population of 5,400 people, at 4,000 m3/day this equates to a per capita consumption of 740 L/person/day.
Stratford District Council (SDC) provided the following information:
Stratford Water Treatment Plant Membrane Pilot Trial, Report, October 2009 Public Health Risk Management Plan for the Stratford Water Supply, May 2009 Stratford Water Treatment Options, Report, August 2008
The upgrading proposed by SDC includes the following scope of work (as described in the Stratford Water Treatment Options report):
CH2M Beca // 20 May 2010 // Page 29
6515967 // NZ1-2528063-63 2.6
Replacement of existing WTP with new membrane filtration plant and ancillary equipment (includes new chemical dosing for coagulation, pH correction, and chlorination)
New electrical & control system, and instrumentation New building to house membrane treatment plant and ancillary equipment New system to transfer wastewater to existing settling pond for disposal to river.
The proposed upgrading is based on requiring a 4 log removal of protozoa.
The options report considered a wide range of options, including upgrading the existing direct filtration WTP, which was rejected because it was considered unlikely that the filters could be upgraded to produce water that complied with the DWSNZ turbidity limits and concerns about the robustness of an upgraded plant. The report carried forward three new WTP options for costing, these being:
i. clarification (adsorption clarifier), filtration and UV
ii. off-river storage, filtration and UV
iii. membrane filtration.
Although Option 1 had a $0.5 million lower capital cost than Option 3, the NPV over a 20 year period favoured Option 3. A comparison of the robustness of the different options to cope with the adverse raw water conditions, also favoured Option 3.
Without inspecting the WTP it is not possible to independently assess whether the state of the current facility is such that upgrading is not feasible. We would note, however, that this plant was upgraded in 1995 to meet the then 1995 DWSNZ, which required 95% of filtered water turbidity to be less than 0.5 NTU. Because the WTP prior to 1995 did not include a sedimentation step, and one was not added in the upgrade, it relied on the WTP being taken off-line during freshes and floods. The changes to DWSNZ since 1995 do require this WTP to have some kind of clarification step to achieve compliance.
However, the approach in this study is to assess the minimum capital costs necessary for compliance, and assumes that assets that existed prior to DWSNZ 1995 have been maintained with a view to their indefinite life. The PHRMP describes the limitations of the existing filters, but does not seriously consider whether or not they could be upgraded to overcome these limitations. The performance of the existing filters as reported in the PHRMP and in the options report, suggests that if a clarifier were to be added upstream, filtered water turbidity of less than 0.3 NTU for more than 5% of the time could probably be achieved, allowing for 3 log credits. The balance of the 4 log requirement could be made up with UV disinfection.
We have therefore assumed that the minimum capital cost to achieve compliance is to upgrade the filters (add filter-to-waste, improve backwashing), and to add a new clarifier and UV. This is similar to their option 1 however we have removed the items of scope that relate to asset renewal or existing processes.
Table 4.5 following summarises the proposed and assessed compliance cost estimates. We note that the P&G, engineering and contingency allowances (at 21%, 16% and 22% respectively), are higher than the percentages estimated by Beca.

CH2M Beca // 20 May 2010 // Page 30
6515967 // NZ1-2528063-63 2.6
Table 4.5 - Summary of Proposed and Assessed Compliance Cost Estimates
Proposed by Water Authority Beca Assessment of Compliance
Scope Item Cost Estimate Comments on, or Modification to, Scope Cost Estimate
Land purchase easements & consents
$100,000 Assume this will also be necessary for clarifier
$50,000
Site work (intake modifications)
$100,000 Pre-existing asset -
Site work (other) $290,000 Assume these costs would be reduced by half for upgrade of existing WTP
$145,000
Treatment building $395,000 New building unnecessary, but existing building likely to require some modifications
$100,000
Electrical & control $190,000 Assume these costs would be reduced by half for upgrade of existing WTP
$95,000
Membrane treatment plant $1,730,000 Modify to: new clarifier & UV, and upgrade of filters
$1,340,000
Chemical equipment $175,000 Assume these costs would be reduced by half for upgrade of existing WTP
$90,000
Wastewater handling $50,000 $50,000
SUBTOTAL* $3,100,000 SUBTOTAL $1,870,000
Preliminary & general $620,000 18% $340,000
Engineering $580,000 12% $265,000
Contingency $930,000 18% $445,000
TOTAL* $5,300,000 TOTAL $2,920,000
* Note that line items do not add up to match Subtotal and Total. Figures are reproduced exactly from SDC Options Report.
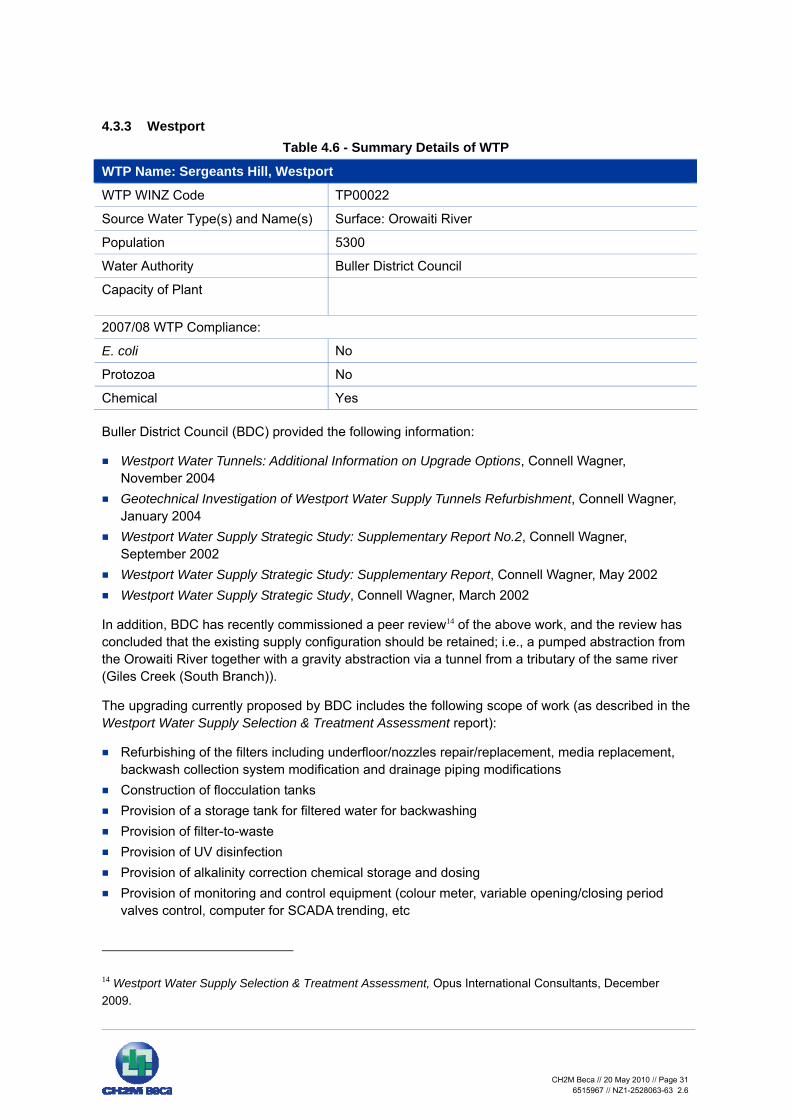
CH2M Beca // 20 May 2010 // Page 31
6515967 // NZ1-2528063-63 2.6
4.3.3 Westport Table 4.6 - Summary Details of WTP
WTP Name: Sergeants Hill, Westport
WTP WINZ Code TP00022
Source Water Type(s) and Name(s) Surface: Orowaiti River
Population 5300
Water Authority Buller District Council
Capacity of Plant
2007/08 WTP Compliance:
E. coli No
Protozoa No
Chemical Yes
Buller District Council (BDC) provided the following information:
Westport Water Tunnels: Additional Information on Upgrade Options, Connell Wagner, November 2004
Geotechnical Investigation of Westport Water Supply Tunnels Refurbishment, Connell Wagner, January 2004
Westport Water Supply Strategic Study: Supplementary Report No.2, Connell Wagner, September 2002
Westport Water Supply Strategic Study: Supplementary Report, Connell Wagner, May 2002 Westport Water Supply Strategic Study, Connell Wagner, March 2002
In addition, BDC has recently commissioned a peer review14 of the above work, and the review has concluded that the existing supply configuration should be retained; i.e., a pumped abstraction from the Orowaiti River together with a gravity abstraction via a tunnel from a tributary of the same river (Giles Creek (South Branch)).
The upgrading currently proposed by BDC includes the following scope of work (as described in the Westport Water Supply Selection & Treatment Assessment report):
Refurbishing of the filters including underfloor/nozzles repair/replacement, media replacement, backwash collection system modification and drainage piping modifications
Construction of flocculation tanks Provision of a storage tank for filtered water for backwashing Provision of filter-to-waste Provision of UV disinfection Provision of alkalinity correction chemical storage and dosing Provision of monitoring and control equipment (colour meter, variable opening/closing period
valves control, computer for SCADA trending, etc
14 Westport Water Supply Selection & Treatment Assessment, Opus International Consultants, December 2009.

CH2M Beca // 20 May 2010 // Page 32
6515967 // NZ1-2528063-63 2.6
Refurbishment of buildings/structures, replacement of old equipment as necessary (valves, analysers, sensors, etc)
The proposed upgrading is based on requiring a 4 log removal of protozoa.
Based on a description of the existing direct filtration treatment plant from the March 2002 Connell Wagner report it appears that, even though the plant is only 25 years old, it suffers from poor performance. Unfortunately, according to the Opus report, there is no treated water turbidity data on which to assess its performance. Although the plant is located in a high rainfall area with a run-of-river source, the plant has three raw water storage reservoirs (total volume 130,000 m3) that provide good quality raw water during fresh and flood events in the river and creek sources, and presumably allow the direct filtration process to be feasible. So, while the March 2002 Connell Wagner report describes problems with filter mudballing and floc settlement in the treated water reservoir, this is likely to be due to poor control of the coagulation and backwashing process, rather than the direct filtration process being overloaded. In addition, the filter loading rate is low – 6.4 m/hour.
There is insufficient detail provided in the Opus report to independently assess the proposed upgrading, and therefore our assessment is based on a few photos of the plant in the Connell Wagner reports and what we would expect in a 25 year old facility.
Table 4.7 following summarises the proposed and assessed compliance cost estimates.
Table 4.7 - Summary of Proposed and Assessed Compliance Cost Estimates
Proposed by Water Authority Beca Assessment of Compliance
Scope Item Cost Estimate Comments on, or Modification to, Scope Cost Estimate
Filter refurbishment $255,000 For a plant of this age a filter refurbishment of this magnitude should not be required. Reduce slightly.
$150,000
Flocculation tanks $300,000 Buller estimate for flocculation tanks appears a little high, but add in $50,000 allowance for improved coagulation.
$250,000
Storage for backwash water $245,000 Not required for compliance, but may allow for reuse of filter-to-waste water
-
Filter-to-waste system $155,000 $150,000
UV disinfection $400,000 Necessary for achieving 4-log requirement with direct filtration. Buller estimate appears high.
$240,000
Alkalinity correction system $215,000 Plant already has lime system. Allow for minor improvements.
$20,000
Monitoring and control upgrade
$255,000 Buller cost appears a little high for scope of work described. In addition, some of the upgrade likely to be attributable to renewals and operations rather than strictly
$150,000

CH2M Beca // 20 May 2010 // Page 33
6515967 // NZ1-2528063-63 2.6
Proposed by Water Authority Beca Assessment of Compliance
Scope Item Cost Estimate Comments on, or Modification to, Scope Cost Estimate compliance-related.
Refurbishment/replacement of structures/plant
$100,000 Asset renewal, not compliance related.
-
SUBTOTAL $1,925,000 SUBTOTAL $960,000
Preliminary & general Included in above
18% $170,000
Engineering $288,750 12% $140,000
Contingency $288,750 18% $230,000
TOTAL $2,502,500 TOTAL $1,500,000
4.4 Communities of 501 - 5,000 Population
4.4.1 Martinborough Table 4.8 - Summary details of WTP
WTP Name: Ruamahanga
WTP WINZ Code TP00635 Note that there is another treatment plant and source for the Martinborough supply (Huangarua Reservoir (TP00636) and Huangarua Supplement Reservoir (S00388)) – this is an emergency supply taken from the Huangarua River (chlorinated only) which has not been used for a long time and therefore has not been included in the case study.
Source water type(s) and Name(s) Groundwater: WINZ: Herricks bore Actual: Bore #1, Bore #3 (Bore #2 now discontinued)
Population 1505
Water Authority South Wairarapa District Council
Capacity of Plant
2007/08 WTP Compliance:
E. coli Yes
Protozoa No
Chemical Yes
South Wairarapa District Council (SWDC) provided the following information:
Capital Assistance Programme Funding Agreement, Contract, May 2008 Martinborough Water Supply Required Improvements Cost Estimates, Excel spreadsheet,
September 2007
The upgrading proposed by the SWDC includes the following work:
Seal existing boreheads Install fourth bore including reticulation
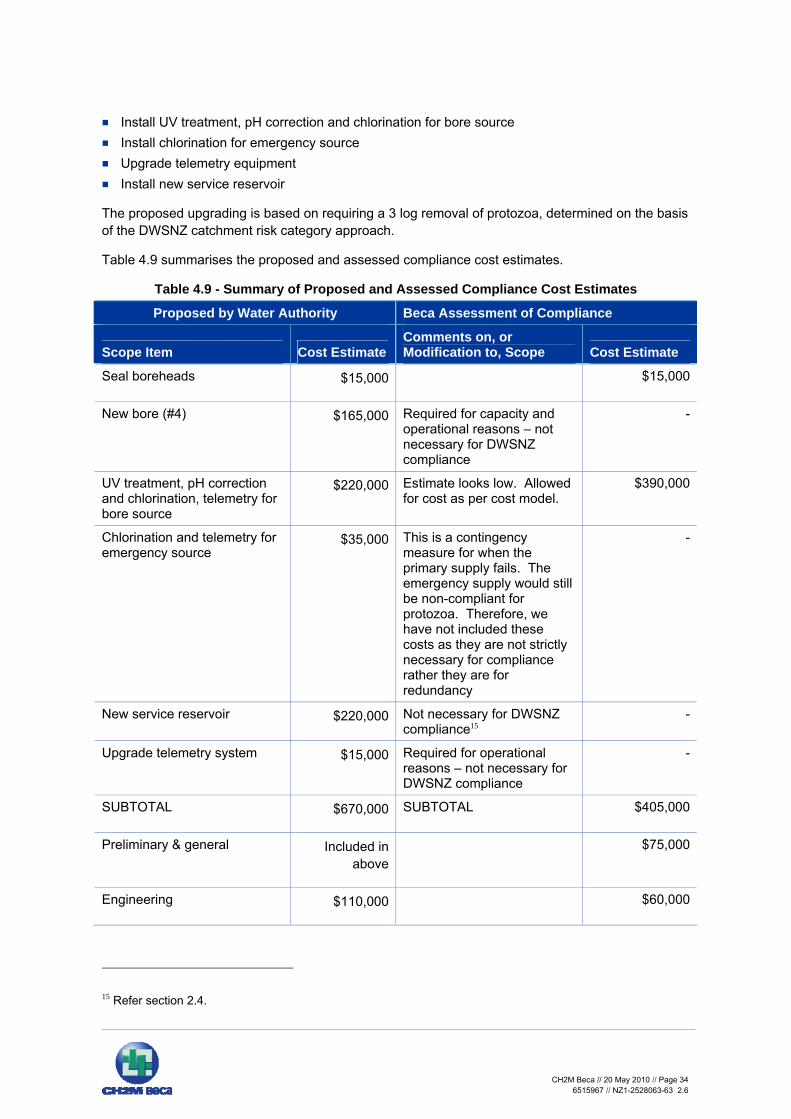
CH2M Beca // 20 May 2010 // Page 34
6515967 // NZ1-2528063-63 2.6
Install UV treatment, pH correction and chlorination for bore source Install chlorination for emergency source Upgrade telemetry equipment Install new service reservoir
The proposed upgrading is based on requiring a 3 log removal of protozoa, determined on the basis of the DWSNZ catchment risk category approach.
Table 4.9 summarises the proposed and assessed compliance cost estimates.
Table 4.9 - Summary of Proposed and Assessed Compliance Cost Estimates
Proposed by Water Authority Beca Assessment of Compliance
Scope Item Cost Estimate Comments on, or Modification to, Scope Cost Estimate
Seal boreheads $15,000 $15,000
New bore (#4) $165,000 Required for capacity and operational reasons – not necessary for DWSNZ compliance
-
UV treatment, pH correction and chlorination, telemetry for bore source
$220,000 Estimate looks low. Allowed for cost as per cost model.
$390,000
Chlorination and telemetry for emergency source
$35,000 This is a contingency measure for when the primary supply fails. The emergency supply would still be non-compliant for protozoa. Therefore, we have not included these costs as they are not strictly necessary for compliance rather they are for redundancy
-
New service reservoir $220,000 Not necessary for DWSNZ compliance15
-
Upgrade telemetry system $15,000 Required for operational reasons – not necessary for DWSNZ compliance
-
SUBTOTAL $670,000 SUBTOTAL $405,000
Preliminary & general Included in above
$75,000
Engineering $110,000 $60,000
15 Refer section 2.4.
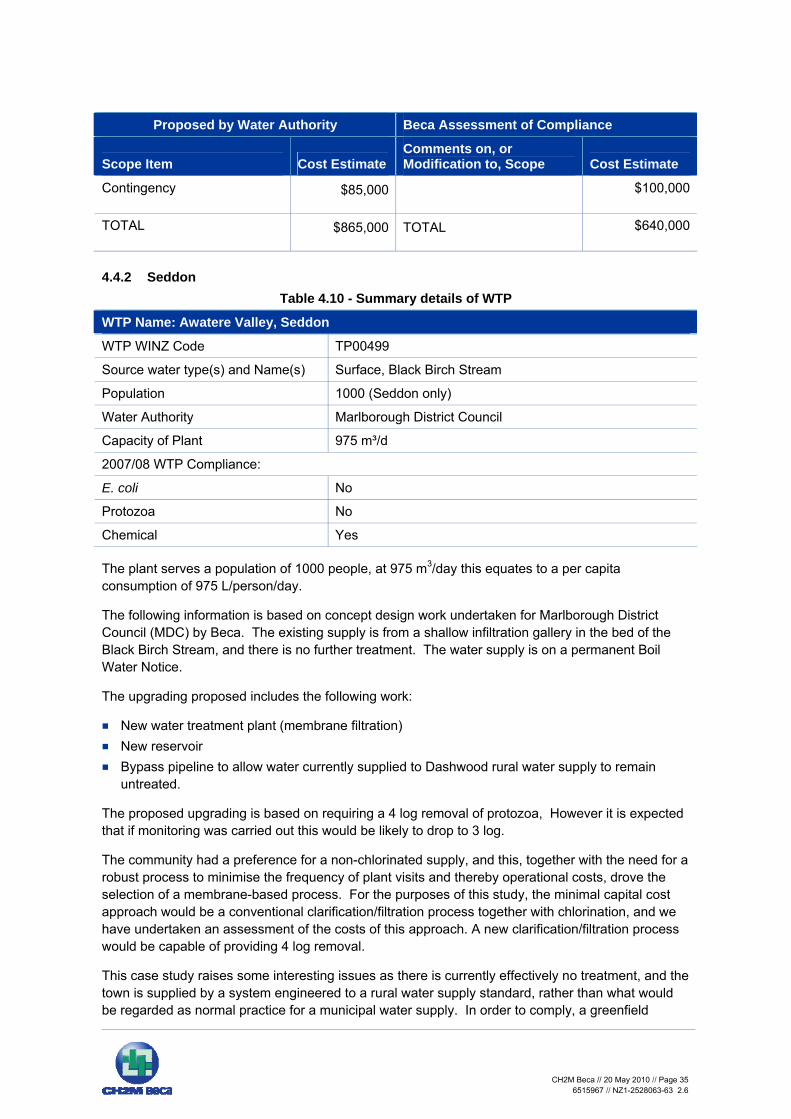
CH2M Beca // 20 May 2010 // Page 35
6515967 // NZ1-2528063-63 2.6
Proposed by Water Authority Beca Assessment of Compliance
Scope Item Cost Estimate Comments on, or Modification to, Scope Cost Estimate
Contingency $85,000 $100,000
TOTAL $865,000 TOTAL $640,000
4.4.2 Seddon Table 4.10 - Summary details of WTP
WTP Name: Awatere Valley, Seddon
WTP WINZ Code TP00499
Source water type(s) and Name(s) Surface, Black Birch Stream
Population 1000 (Seddon only)
Water Authority Marlborough District Council
Capacity of Plant 975 m³/d
2007/08 WTP Compliance:
E. coli No
Protozoa No
Chemical Yes
The plant serves a population of 1000 people, at 975 m3/day this equates to a per capita consumption of 975 L/person/day.
The following information is based on concept design work undertaken for Marlborough District Council (MDC) by Beca. The existing supply is from a shallow infiltration gallery in the bed of the Black Birch Stream, and there is no further treatment. The water supply is on a permanent Boil Water Notice.
The upgrading proposed includes the following work:
New water treatment plant (membrane filtration) New reservoir Bypass pipeline to allow water currently supplied to Dashwood rural water supply to remain
untreated.
The proposed upgrading is based on requiring a 4 log removal of protozoa, However it is expected that if monitoring was carried out this would be likely to drop to 3 log.
The community had a preference for a non-chlorinated supply, and this, together with the need for a robust process to minimise the frequency of plant visits and thereby operational costs, drove the selection of a membrane-based process. For the purposes of this study, the minimal capital cost approach would be a conventional clarification/filtration process together with chlorination, and we have undertaken an assessment of the costs of this approach. A new clarification/filtration process would be capable of providing 4 log removal.
This case study raises some interesting issues as there is currently effectively no treatment, and the town is supplied by a system engineered to a rural water supply standard, rather than what would be regarded as normal practice for a municipal water supply. In order to comply, a greenfield

CH2M Beca // 20 May 2010 // Page 36
6515967 // NZ1-2528063-63 2.6
treatment plant has to be created to serve the town, and this requires significant civil works, pipelines, power supply, and a treated water reservoir. The approach taken in our assessment of compliance costs is to assume that prior to the introduction of DWSNZ 1995, water suppliers had, as a minimum, treatment systems in place that were matched to the source water and could comply with DWSNZ 1984. This community did not. Nevertheless, to include all the costs for Seddon that are associated with a new greenfield plant undermines the approach of the study, and therefore we consider that ancillary costs such as reservoirs and pipelines should not be included. This is not to deny that the community is faced with these costs if the water supply is going to be brought into compliance, but we note that many other communities spent the money necessary to meet these costs in the past (and enjoyed the benefits).
Because of the wide gulf between the assumptions underlying this study and what is actually necessary for Seddon, we have not undertaken an independent assessment of the scope and costs.
Table 4.11 summarises the proposed compliance cost estimates. We note that for a community in this population category the cost model (refer Section 2) shows a compliance cost of approximately $1.01M16 and assumes for this quality source water that coagulation, direct filtration and chlorination would be the existing treatment processes.
Table 4.11 - Summary of Proposed and Assessed Compliance Cost Estimates
Proposed by Water Authority Beca Assessment of Compliance
Scope Item Cost Estimate Comments on, or Modification to, Scope Cost Estimate
Land purchase $135,000
Pipework, including bypass $375,000
Raw water tank $40,000
Membrane filtration $1,800,000
Coagulant dosing $45,000
pH correction $45,000
UV disinfection $270,000
Backwash reuse and waste disposal
$135,000
Building (190 m2) $340,000
Civil and site works $230,000
16 Assumes existing treatment consisting of coagulation, direct filtration and chlorination and upgrade to include new clarifier, UV and Turbidity monitoring for 4 log removal.
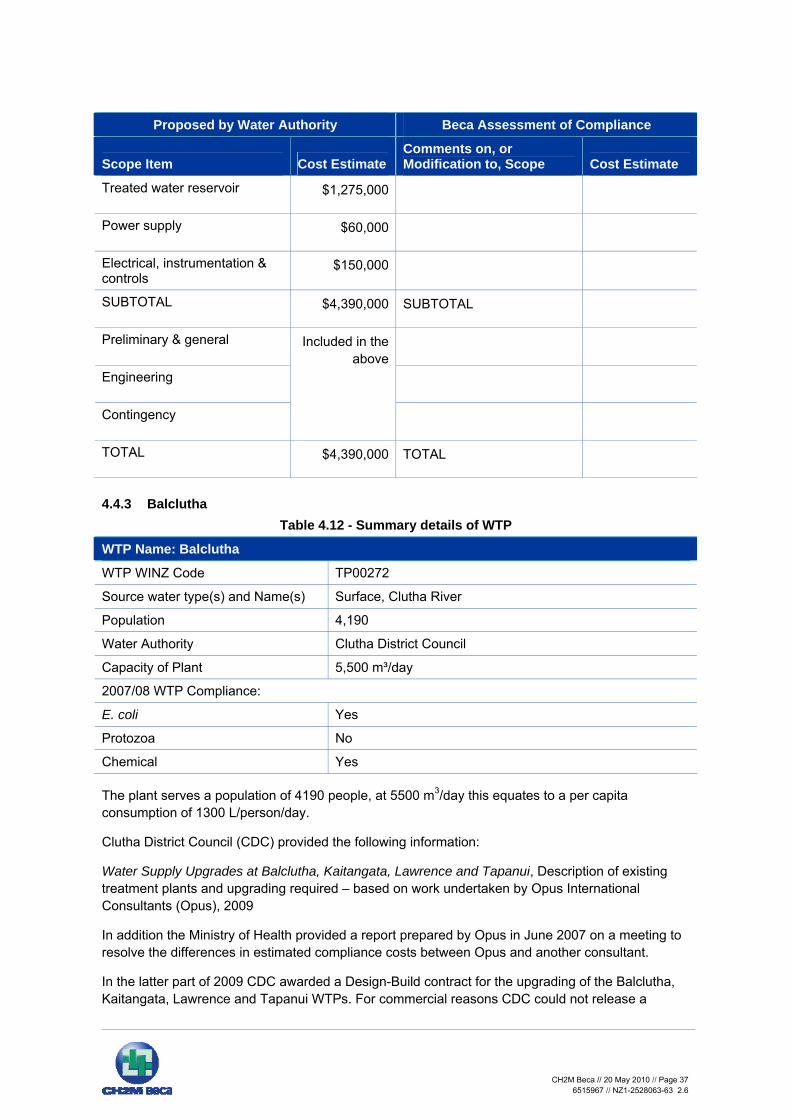
CH2M Beca // 20 May 2010 // Page 37
6515967 // NZ1-2528063-63 2.6
Proposed by Water Authority Beca Assessment of Compliance
Scope Item Cost Estimate Comments on, or Modification to, Scope Cost Estimate
Treated water reservoir $1,275,000
Power supply $60,000
Electrical, instrumentation & controls
$150,000
SUBTOTAL $4,390,000 SUBTOTAL
Preliminary & general
Engineering
Contingency
Included in the above
TOTAL $4,390,000 TOTAL
4.4.3 Balclutha Table 4.12 - Summary details of WTP
WTP Name: Balclutha
WTP WINZ Code TP00272
Source water type(s) and Name(s) Surface, Clutha River
Population 4,190
Water Authority Clutha District Council
Capacity of Plant 5,500 m³/day
2007/08 WTP Compliance:
E. coli Yes
Protozoa No
Chemical Yes
The plant serves a population of 4190 people, at 5500 m3/day this equates to a per capita consumption of 1300 L/person/day.
Clutha District Council (CDC) provided the following information:
Water Supply Upgrades at Balclutha, Kaitangata, Lawrence and Tapanui, Description of existing treatment plants and upgrading required – based on work undertaken by Opus International Consultants (Opus), 2009
In addition the Ministry of Health provided a report prepared by Opus in June 2007 on a meeting to resolve the differences in estimated compliance costs between Opus and another consultant.
In the latter part of 2009 CDC awarded a Design-Build contract for the upgrading of the Balclutha, Kaitangata, Lawrence and Tapanui WTPs. For commercial reasons CDC could not release a
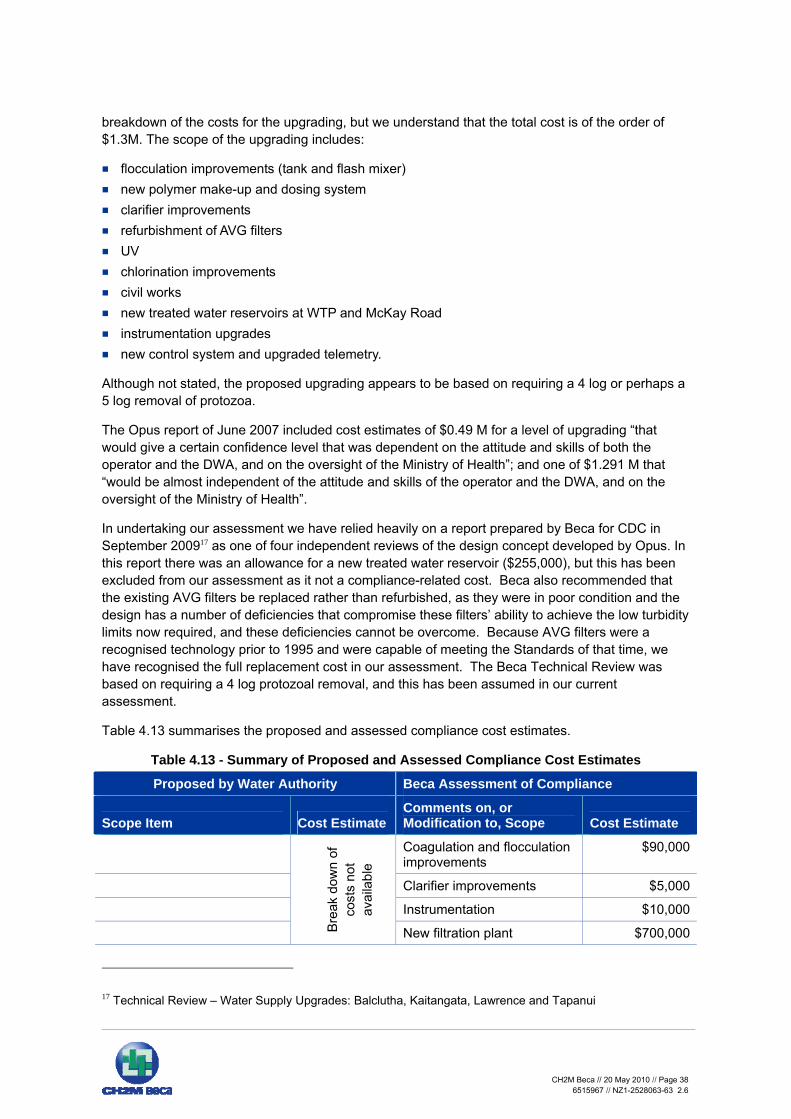
CH2M Beca // 20 May 2010 // Page 38
6515967 // NZ1-2528063-63 2.6
breakdown of the costs for the upgrading, but we understand that the total cost is of the order of $1.3M. The scope of the upgrading includes:
flocculation improvements (tank and flash mixer) new polymer make-up and dosing system clarifier improvements refurbishment of AVG filters UV chlorination improvements civil works new treated water reservoirs at WTP and McKay Road instrumentation upgrades new control system and upgraded telemetry.
Although not stated, the proposed upgrading appears to be based on requiring a 4 log or perhaps a 5 log removal of protozoa.
The Opus report of June 2007 included cost estimates of $0.49 M for a level of upgrading “that would give a certain confidence level that was dependent on the attitude and skills of both the operator and the DWA, and on the oversight of the Ministry of Health”; and one of $1.291 M that “would be almost independent of the attitude and skills of the operator and the DWA, and on the oversight of the Ministry of Health”.
In undertaking our assessment we have relied heavily on a report prepared by Beca for CDC in September 200917 as one of four independent reviews of the design concept developed by Opus. In this report there was an allowance for a new treated water reservoir ($255,000), but this has been excluded from our assessment as it not a compliance-related cost. Beca also recommended that the existing AVG filters be replaced rather than refurbished, as they were in poor condition and the design has a number of deficiencies that compromise these filters’ ability to achieve the low turbidity limits now required, and these deficiencies cannot be overcome. Because AVG filters were a recognised technology prior to 1995 and were capable of meeting the Standards of that time, we have recognised the full replacement cost in our assessment. The Beca Technical Review was based on requiring a 4 log protozoal removal, and this has been assumed in our current assessment.
Table 4.13 summarises the proposed and assessed compliance cost estimates.
Table 4.13 - Summary of Proposed and Assessed Compliance Cost Estimates
Proposed by Water Authority Beca Assessment of Compliance
Scope Item Cost Estimate Comments on, or Modification to, Scope Cost Estimate
Coagulation and flocculation improvements
$90,000
Clarifier improvements $5,000
Instrumentation $10,000
B
reak
dow
n of
co
sts
not
avai
labl
e
New filtration plant $700,000
17 Technical Review – Water Supply Upgrades: Balclutha, Kaitangata, Lawrence and Tapanui

CH2M Beca // 20 May 2010 // Page 39
6515967 // NZ1-2528063-63 2.6
Proposed by Water Authority Beca Assessment of Compliance
Scope Item Cost Estimate Comments on, or Modification to, Scope Cost Estimate
SUBTOTAL SUBTOTAL $805,000
Preliminary & general 18% $145,000
Engineering 12% $115,000
Contingency 18% $190,000
TOTAL $1,300,000 TOTAL $1,260,000
4.5 Communities of 101 - 500 Population
4.5.1 Russell Township - Commercial Table 4.14 - Summary details of WTP
WTP Name: Russell Township - Commercial
WTP WINZ Code TP01059
Source water type(s) and Name(s) Groundwater, Russell Township-Com. Bore
Population 200
Water Authority Holiday Park
Capacity of Plant 260m³/day
2007/08 WTP Compliance:
E. coli No
Protozoa No
Chemical Yes
The Holiday Park answered our telephone questionnaire. The upgrading is due for completion by end of March and comprises the following:
Installation of 1 µm filtration Installation of UV treatment
The Holiday Park was not able to advise the required log removal of protozoa, but based on a discussion with the Northland Regional Council (Ananda Habul) we understand the existing bore is 47 m deep and the pump is mounted at 27 m deep, and as it is in hard rock it is not screened. Assuming the aquifer is not shallower than 30 m and the bore head is sealed, only 2 log removal would be required. A more conservative assumption is to assume that the water is drawn from an unconfined aquifer 10 to 30 m deep, and to allow for sealing the borehead to ensure it is sealed, in which case a 3 log removal would be required. Table 4.15 summarises the proposed and assessed compliance cost estimates.

CH2M Beca // 20 May 2010 // Page 40
6515967 // NZ1-2528063-63 2.6
Table 4.15 - Summary of Proposed and Assessed Compliance Cost Estimates
Proposed by Water Authority Beca Assessment of Compliance
Scope Item Cost Estimate Comments on, or Modification to, Scope Cost Estimate
1 µm cartridge filtration and UV treatment
$15,000 Assume cartridge filtration required as pre-treatment for UV. Cost estimate looks low.
$125,000
$,000 Allowance for sealing borehead
$5,000
SUBTOTAL $15,000 SUBTOTAL $130,000
Preliminary & general Included in above
18% $25,000
Engineering - 12% $20,000
Contingency Included in above
18% $30,000
TOTAL $15,000 TOTAL $205,000
For a fully engineered solution the water authority’s estimate is too low. The plant is serving a population of 200 people and at 260 m3/day this equates to a per capita consumption of 1300L/person/day. In reality it probably serves a much higher population due to the seasonal tourist influx.
A plant of this size would need a small building to house the cartridges and UV unit. A cheaper, off the shelf “kit set building” could be purchased from a high street building supplier.
The Beca cost assessment is based on fully engineered solution using cartridge filters for pretreatment and UV disinfection for both E. coli and protozoa compliance, all housed within a building.
A reality check of the Beca cost was provided by approaching a package supplier for a plant to achieve E. coli compliance and a 3 log removal for protozoa. The plant is an off the shelf unit capable of delivering 245 m3/day and consists of filters, UV and chlorination (plus ancillary equipment). The installed price for such a plant is $90,000 but excludes the cost for a small shed to house it. By dealing direct with the Vendor, the margins and fees are significantly reduced.

CH2M Beca // 20 May 2010 // Page 41
6515967 // NZ1-2528063-63 2.6
4.5.2 Mangaweka Table 4.16 - Summary details of WTP
WTP Name: Mangaweka
WTP WINZ Code TP00059
Source water type(s) and Name(s) Surface, Rangitikei River (ungraded)
Population 180
Capacity of Plant 245 m³/day
Water Authority Rangitikei District Council
2007/08 WTP Compliance:
E. coli Yes
Protozoa No
Chemical Yes
The design flow of the plant is 245 m³/day, which equates to a peak design per capita consumption of 1390 L/person/day.
Rangitikei District Council (RDC) answered our telephone questionnaire and also some follow-up clarifications by phone. The upgrading is scheduled for between March 2010 and March 2011 but is expected to be completed before the end of June 2010.
RDC cited a 2002 report covering options for improvement but did not make the report available. We were therefore unable to verify the costs reported. In addition they have applied for, and had approved, funding for the work under the CAP subsidy scheme.
The plant currently consists of a strainer and two sets of cartridge filters followed by chlorination. The intake is an infiltration gallery in the bed of the river.
The proposed upgrading is based on requiring a 5 log removal of protozoa, determined on the basis of the DWSNZ catchment risk category approach.
The upgrading proposed by the RDC includes the following work:
Security fencing Installation of coagulation/ sand filtration upstream of existing cartridge filters to reduce solids
loading on filters and to improve UVT Installation of UV (duty only) for protozoal compliance located downstream of existing cartridge
filters Monitoring equipment (residual chlorine and pH analysers, and two new turbidity meters) Replacement of the existing telemetry system Electrical work Extension to building to house UV system.
The Rangitikei River is a very low quality water source which at times is subject to very high raw water turbidity. Depending on the performance of the existing infiltration gallery, in order to achieve the required 5 log credits, we would recommend:
If the infiltration gallery does not consistently provide water of less than about 10 NTU, then, replacing the existing cartridge filtration with coagulation/sedimentation & filtration, followed by UV. The clarification stage would provide greater reliability of achieving turbidity out of the filters

CH2M Beca // 20 May 2010 // Page 42
6515967 // NZ1-2528063-63 2.6
of less than 0.3 NTU for 95% of the time and hence achieve the 2.5 log credits across the filtering process.
Or, if the infiltration gallery does consistently provide water of less than about 10 NTU, RDC’s proposal is probably reasonable, subject to raw water colour not being too high.
Additional monitoring equipment would be a reasonable requirement for both enhancement to coagulation and flocculation and for the new UV plant. Likewise an extension to the building to house the new UV plant would be considered a reasonable cost associated with compliance.
Security fencing is part of the Council’s cost for protecting its existing asset and is not a requirement for compliance with the Standards.
Table 4.17 summarises the proposed and assessed compliance cost estimates, assuming that the infiltration gallery does consistently provide water of less than about 10 NTU.
Table 4.17 - Summary of Proposed and Assessed Compliance Cost Estimates
Proposed by Water Authority Beca Assessment of Compliance
Scope Item Cost Estimate Comments on, or Modification to, Scope Cost Estimate
Security fencing $6,000 Not required for compliance -
Coagulation/direct filtration $65,000Enhanced sand filtration and UV
$103,000
UV (duty only) $65,000
Monitoring equipment $36,000
Telemetry & electrical $21,400
Telemetry, turbidity monitoring, additional monitoring for cartridge fillers)
$30,000
Extension to building to house UV
$19,400 Building for coagulation and UV
$40,000
SUBTOTAL SUBTOTAL $200,000
Preliminary & general $0 18% $40,000
Engineering Done in house 12% $30,000
Contingency 10% included above
18% $50,000
TOTAL $185,800 TOTAL $320,000

CH2M Beca // 20 May 2010 // Page 43
6515967 // NZ1-2528063-63 2.6
4.5.3 Waimarama Table 4.18 - Summary details of WTP
WTP Name: Okaihau Road
WTP WINZ Code TP00114
Source water type(s) and Name(s) Spring and bore; Okaihau Road #1 Spring, Okaihau Road #2 Spring, Waingongoro Stream Shallow Bore
Population 260
Water Authority Hastings District Council
Capacity of Plant 1000 m³/day
2007/08 WTP Compliance:
E. coli Yes
Protozoa No
Chemical Yes
The design flow of the plant is 1000 m3/day which equates to a per capita consumption of 3,850 L/person/day. We suspect that this reflects a high summertime influx of people which is not currently reflected in the WINZ population figure.
Hastings District Council (HDC) provided information by verbal responses to our telephone queries, which was followed up by an email confirmation. Cost estimates are based on information from HDC’s LTCCP.
The existing treatment process comprises cartridge filtration (1 μm absolute) followed by UV disinfection. The existing UV unit does not have the required validation and as such does not receive any log credits. The upgrading proposed by HDC is to replace the existing UV unit with one that has been validated and has an independent UV intensity sensor and can therefore achieve compliance. No standby UV unit is proposed.
Based on the DWSNZ catchment risk category approach, HDC believes that that the sources require 4 to 5 log protozoal removal.
Table 4.19 summarises the proposed and assessed compliance cost estimates.
Table 4.19 - Summary of Proposed and Assessed Compliance Cost Estimates
Proposed by Water Authority Beca Assessment of Compliance
Scope Item Cost Estimate Comments on, or Modification to, Scope Cost Estimate
Replace existing UV unit (duty only)
$100,000 Appears high. $55,000
Preliminary & general Included in above
18% $10,000
Engineering No allowance 12% $10,000
Contingency Included in above
18% $15,000
TOTAL $100,000 TOTAL $90,000
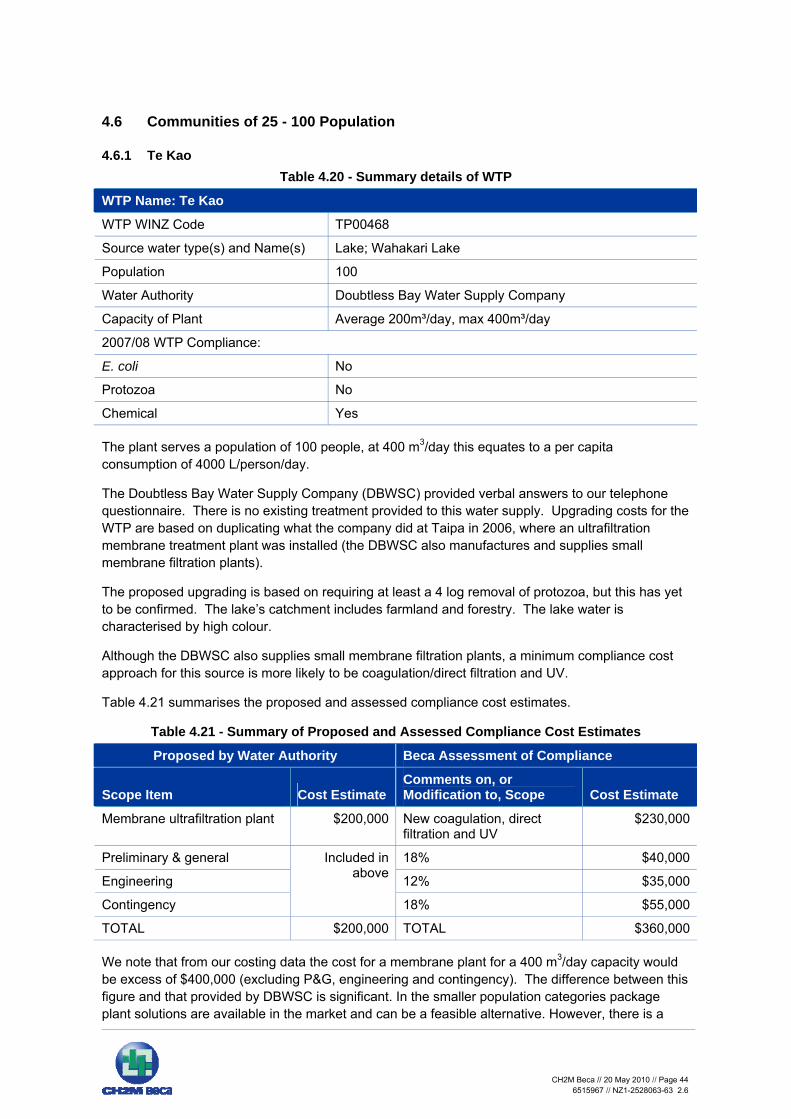
CH2M Beca // 20 May 2010 // Page 44
6515967 // NZ1-2528063-63 2.6
4.6 Communities of 25 - 100 Population
4.6.1 Te Kao Table 4.20 - Summary details of WTP
WTP Name: Te Kao
WTP WINZ Code TP00468
Source water type(s) and Name(s) Lake; Wahakari Lake
Population 100
Water Authority Doubtless Bay Water Supply Company
Capacity of Plant Average 200m³/day, max 400m³/day
2007/08 WTP Compliance:
E. coli No
Protozoa No
Chemical Yes
The plant serves a population of 100 people, at 400 m3/day this equates to a per capita consumption of 4000 L/person/day.
The Doubtless Bay Water Supply Company (DBWSC) provided verbal answers to our telephone questionnaire. There is no existing treatment provided to this water supply. Upgrading costs for the WTP are based on duplicating what the company did at Taipa in 2006, where an ultrafiltration membrane treatment plant was installed (the DBWSC also manufactures and supplies small membrane filtration plants).
The proposed upgrading is based on requiring at least a 4 log removal of protozoa, but this has yet to be confirmed. The lake’s catchment includes farmland and forestry. The lake water is characterised by high colour.
Although the DBWSC also supplies small membrane filtration plants, a minimum compliance cost approach for this source is more likely to be coagulation/direct filtration and UV.
Table 4.21 summarises the proposed and assessed compliance cost estimates.
Table 4.21 - Summary of Proposed and Assessed Compliance Cost Estimates
Proposed by Water Authority Beca Assessment of Compliance
Scope Item Cost Estimate Comments on, or Modification to, Scope Cost Estimate
Membrane ultrafiltration plant $200,000 New coagulation, direct filtration and UV
$230,000
Preliminary & general 18% $40,000
Engineering 12% $35,000
Contingency
Included in above
18% $55,000
TOTAL $200,000 TOTAL $360,000
We note that from our costing data the cost for a membrane plant for a 400 m3/day capacity would be excess of $400,000 (excluding P&G, engineering and contingency). The difference between this figure and that provided by DBWSC is significant. In the smaller population categories package plant solutions are available in the market and can be a feasible alternative. However, there is a
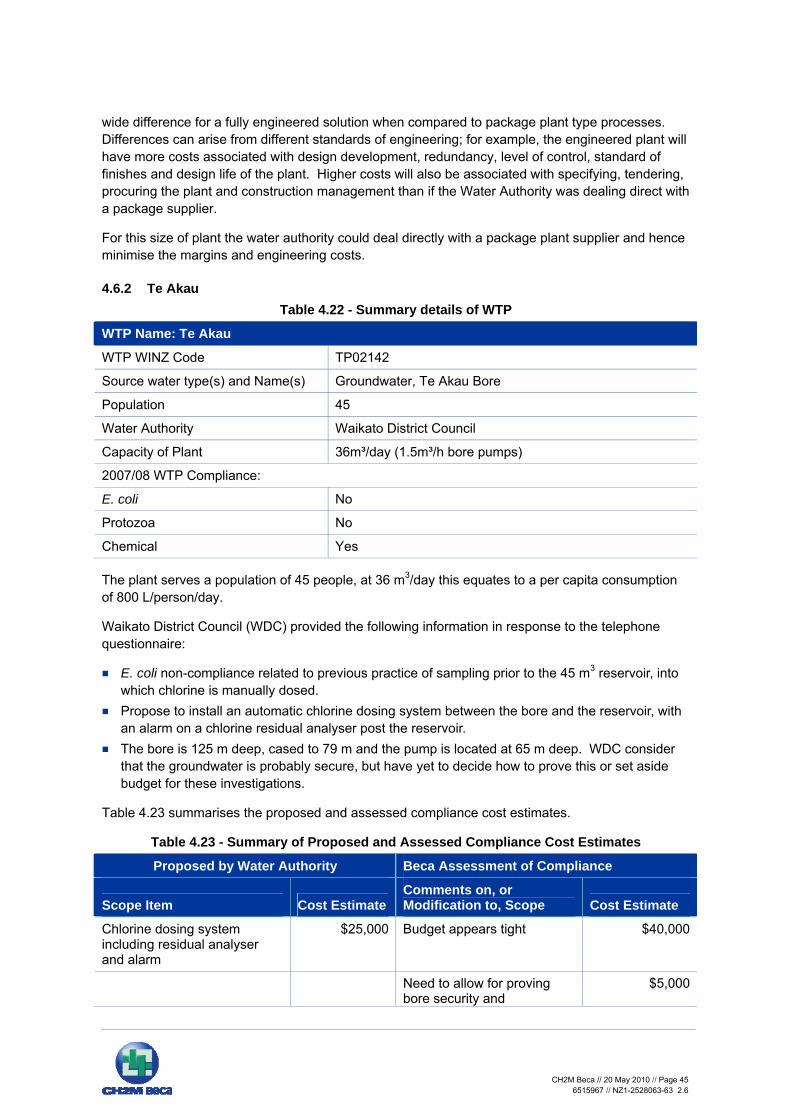
CH2M Beca // 20 May 2010 // Page 45
6515967 // NZ1-2528063-63 2.6
wide difference for a fully engineered solution when compared to package plant type processes. Differences can arise from different standards of engineering; for example, the engineered plant will have more costs associated with design development, redundancy, level of control, standard of finishes and design life of the plant. Higher costs will also be associated with specifying, tendering, procuring the plant and construction management than if the Water Authority was dealing direct with a package supplier.
For this size of plant the water authority could deal directly with a package plant supplier and hence minimise the margins and engineering costs.
4.6.2 Te Akau Table 4.22 - Summary details of WTP
WTP Name: Te Akau
WTP WINZ Code TP02142
Source water type(s) and Name(s) Groundwater, Te Akau Bore
Population 45
Water Authority Waikato District Council
Capacity of Plant 36m³/day (1.5m³/h bore pumps)
2007/08 WTP Compliance:
E. coli No
Protozoa No
Chemical Yes
The plant serves a population of 45 people, at 36 m3/day this equates to a per capita consumption of 800 L/person/day.
Waikato District Council (WDC) provided the following information in response to the telephone questionnaire:
E. coli non-compliance related to previous practice of sampling prior to the 45 m3 reservoir, into which chlorine is manually dosed.
Propose to install an automatic chlorine dosing system between the bore and the reservoir, with an alarm on a chlorine residual analyser post the reservoir.
The bore is 125 m deep, cased to 79 m and the pump is located at 65 m deep. WDC consider that the groundwater is probably secure, but have yet to decide how to prove this or set aside budget for these investigations.
Table 4.23 summarises the proposed and assessed compliance cost estimates.
Table 4.23 - Summary of Proposed and Assessed Compliance Cost Estimates
Proposed by Water Authority Beca Assessment of Compliance
Scope Item Cost Estimate Comments on, or Modification to, Scope Cost Estimate
Chlorine dosing system including residual analyser and alarm
$25,000 Budget appears tight $40,000
Need to allow for proving bore security and
$5,000

CH2M Beca // 20 May 2010 // Page 46
6515967 // NZ1-2528063-63 2.6
Proposed by Water Authority Beca Assessment of Compliance
Scope Item Cost Estimate Comments on, or Modification to, Scope Cost Estimate improvements to wellhead
SUBTOTAL $25,000 SUBTOTAL $45,000
Preliminary & general Included in above
18% $10,000
Engineering No allowance – proposing to
use vendors to reduce costs
12% $5,000
Contingency - 18% $10,000
TOTAL $25,000 TOTAL $70,000
The intention of the upgrade is that the chlorine dosing system will address the interim bacterial requirements of the Standards, and that wellhead improvements will address the protozoal, assuming that the bore is indeed secure.
4.6.3 Burkes Pass Table 4.24 - Summary details of WTP
WTP Name:
WTP WINZ Code TP00370
Source water type(s) and Name(s) Surface: Opihi River (tributary)
Population 30 (21 connections)
Water Authority Mackenzie District Council
Capacity of Plant 52m³/d
2007/08 WTP Compliance:
E. coli No
Protozoa No
Chemical Yes
The plant serves a population of 30 people, at 52 m3/day this equates to a per capita consumption of 1730 L/person/day.
Mackenzie District Council (MDC) provided the following information:
Public Risk Health Management Plan, Burkes Pass Water Supply, DRAFT, April 2009
The draft PHRMP does not give a definitive upgrading proposal, but canvases a number of options for reducing the risks associated with the existing WTP process (Arkal disc filtration (400, 200 and 130 μm), followed by chlorination) and includes indicative cost estimates for these. The number of log credits required for protozoa compliance has yet to be determined, but the source stream is within stock paddocks for sheep and beef cattle (no dairying) so at least a 4 log requirement is likely.
Given the lack of a definitive upgrading proposal we have selected those items from the PHRMP that we consider MDC is likely to adopt in order to achieve compliance and undertaken an assessment of these. For the proposed filtration plant the PHRMP suggests that membrane
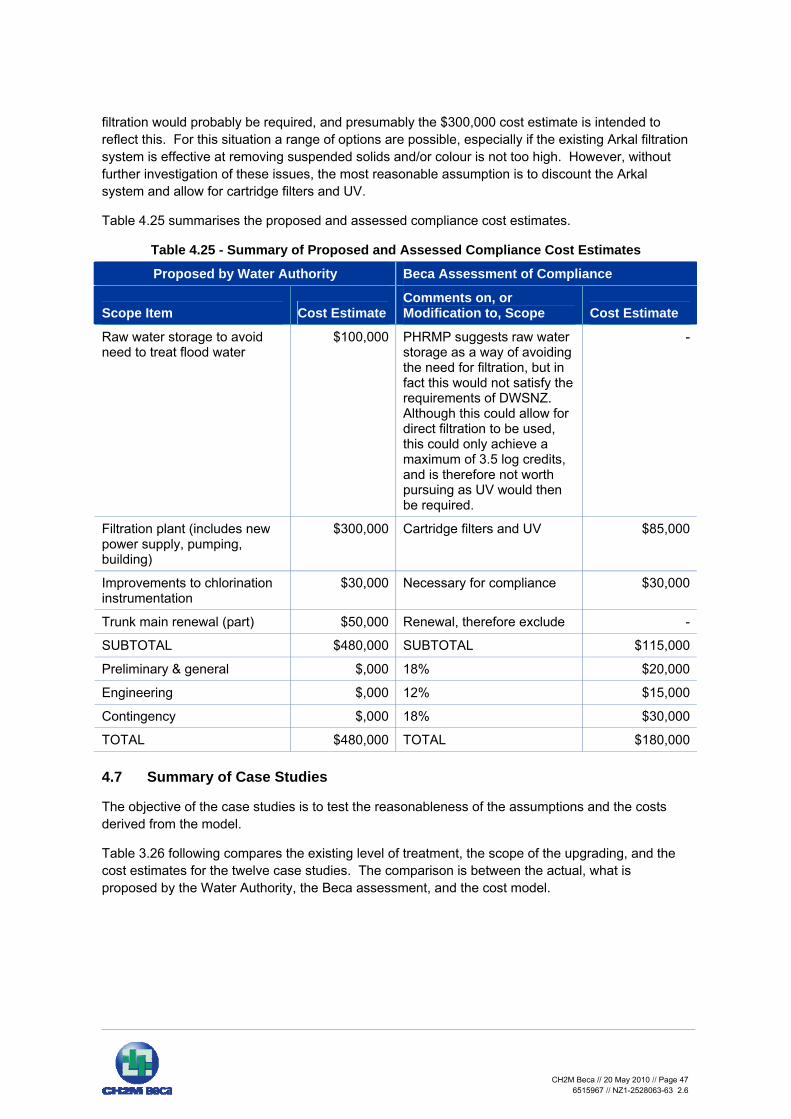
CH2M Beca // 20 May 2010 // Page 47
6515967 // NZ1-2528063-63 2.6
filtration would probably be required, and presumably the $300,000 cost estimate is intended to reflect this. For this situation a range of options are possible, especially if the existing Arkal filtration system is effective at removing suspended solids and/or colour is not too high. However, without further investigation of these issues, the most reasonable assumption is to discount the Arkal system and allow for cartridge filters and UV.
Table 4.25 summarises the proposed and assessed compliance cost estimates.
Table 4.25 - Summary of Proposed and Assessed Compliance Cost Estimates
Proposed by Water Authority Beca Assessment of Compliance
Scope Item Cost Estimate Comments on, or Modification to, Scope Cost Estimate
Raw water storage to avoid need to treat flood water
$100,000 PHRMP suggests raw water storage as a way of avoiding the need for filtration, but in fact this would not satisfy the requirements of DWSNZ. Although this could allow for direct filtration to be used, this could only achieve a maximum of 3.5 log credits, and is therefore not worth pursuing as UV would then be required.
-
Filtration plant (includes new power supply, pumping, building)
$300,000 Cartridge filters and UV $85,000
Improvements to chlorination instrumentation
$30,000 Necessary for compliance $30,000
Trunk main renewal (part) $50,000 Renewal, therefore exclude -
SUBTOTAL $480,000 SUBTOTAL $115,000
Preliminary & general $,000 18% $20,000
Engineering $,000 12% $15,000
Contingency $,000 18% $30,000
TOTAL $480,000 TOTAL $180,000
4.7 Summary of Case Studies
The objective of the case studies is to test the reasonableness of the assumptions and the costs derived from the model.
Table 3.26 following compares the existing level of treatment, the scope of the upgrading, and the cost estimates for the twelve case studies. The comparison is between the actual, what is proposed by the Water Authority, the Beca assessment, and the cost model.
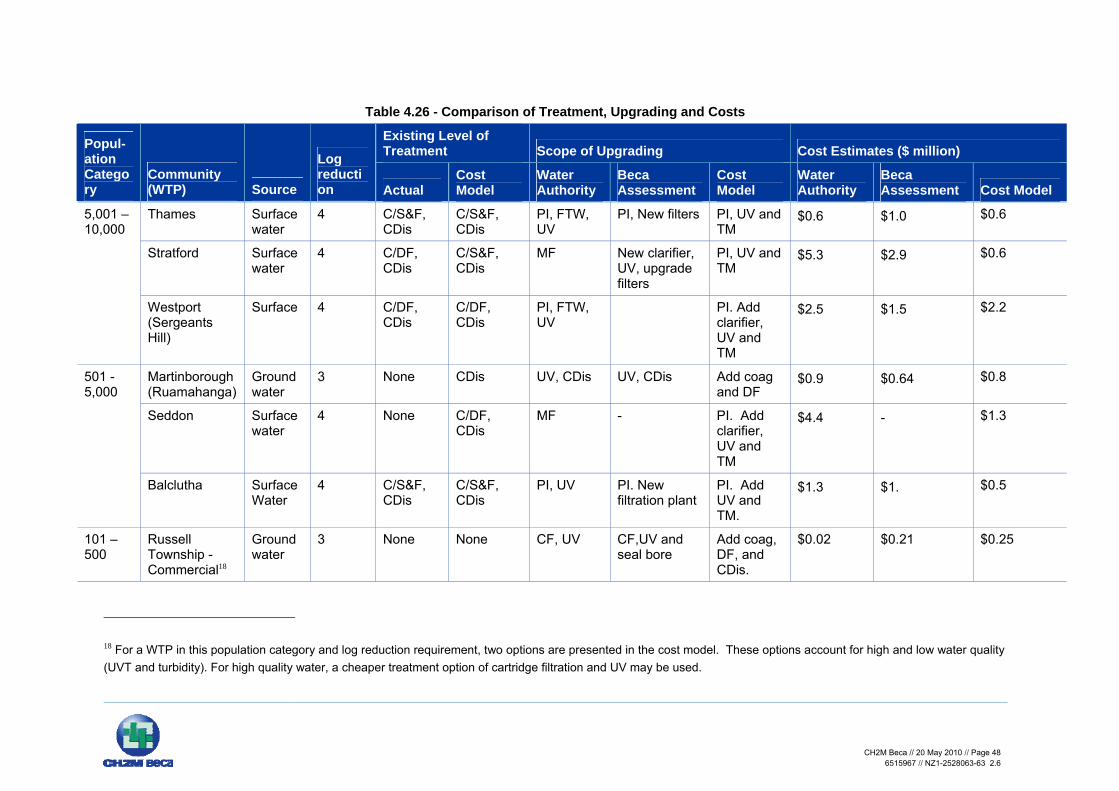
CH2M Beca // 20 May 2010 // Page 48
6515967 // NZ1-2528063-63 2.6
Table 4.26 - Comparison of Treatment, Upgrading and Costs
Existing Level of Treatment Scope of Upgrading Cost Estimates ($ million) Popul-
ation Category
Community (WTP) Source
Log reduction Actual
Cost Model
Water Authority
Beca Assessment
Cost Model
Water Authority
Beca Assessment Cost Model
Thames Surface water
4 C/S&F, CDis
C/S&F, CDis
PI, FTW, UV
PI, New filters PI, UV and TM
$0.6 $1.0 $0.6
Stratford Surface water
4 C/DF, CDis
C/S&F, CDis
MF New clarifier, UV, upgrade filters
PI, UV and TM
$5.3 $2.9 $0.6
5,001 – 10,000
Westport (Sergeants Hill)
Surface 4 C/DF, CDis
C/DF, CDis
PI, FTW, UV
PI. Add clarifier, UV and TM
$2.5 $1.5 $2.2
Martinborough (Ruamahanga)
Groundwater
3 None CDis UV, CDis UV, CDis Add coag and DF
$0.9 $0.64 $0.8
Seddon Surface water
4 None C/DF, CDis
MF - PI. Add clarifier, UV and TM
$4.4 - $1.3
501 - 5,000
Balclutha Surface Water
4 C/S&F, CDis
C/S&F, CDis
PI, UV PI. New filtration plant
PI. Add UV and TM.
$1.3 $1. $0.5
101 – 500
Russell Township - Commercial18
Groundwater
3 None None CF, UV CF,UV and seal bore
Add coag, DF, and CDis.
$0.02 $0.21 $0.25
18 For a WTP in this population category and log reduction requirement, two options are presented in the cost model. These options account for high and low water quality (UVT and turbidity). For high quality water, a cheaper treatment option of cartridge filtration and UV may be used.

CH2M Beca // 20 May 2010 // Page 49
6515967 // NZ1-2528063-63 2.6
Existing Level of Treatment Scope of Upgrading Cost Estimates ($ million) Popul-
ation Category
Community (WTP) Source
Log reduction Actual
Cost Model
Water Authority
Beca Assessment
Cost Model
Water Authority
Beca Assessment Cost Model
UV and CF $0.2
Mangaweka Surface Water
5 IG, CF, CDis
IG, C/DF, CDis
PI, add sedim, FTW, UV
$0.19 $0.32 $0.42
Waimarama (Okaihau Road)
Groundwater
4 CF, UV IG, C/DF, CDis
UV UV PI, add sedim and UV
$0.10 $0.09 $0.37
Install coag, S&F and UV.
$0.31 Te Kao19 Surface water
4 None IG, CDis MF Coag, UV and DF
CF and UV
$0.20 $0.36
$0.13
Install coag, DF, and ECM
$0.19 Te Akau3 Groundwater
3 None None CDis CDis
CF, UV and ECM
$0.03 $0.07
$0.13
Install coag, S&F and UV
$0.31
25 – 100
Burkes Pass3 Surface Water
4 IG, CDis IG, CDis PI, MF CF and UV
CF and UV
$0.48 $0.18
$0.13
19 For a WTP in this population category and log reduction requirement, two options are presented in the cost model. These options account for high and low water quality (UVT and turbidity). For high quality water, a cheaper treatment option of cartridge filtration and UV may be used.
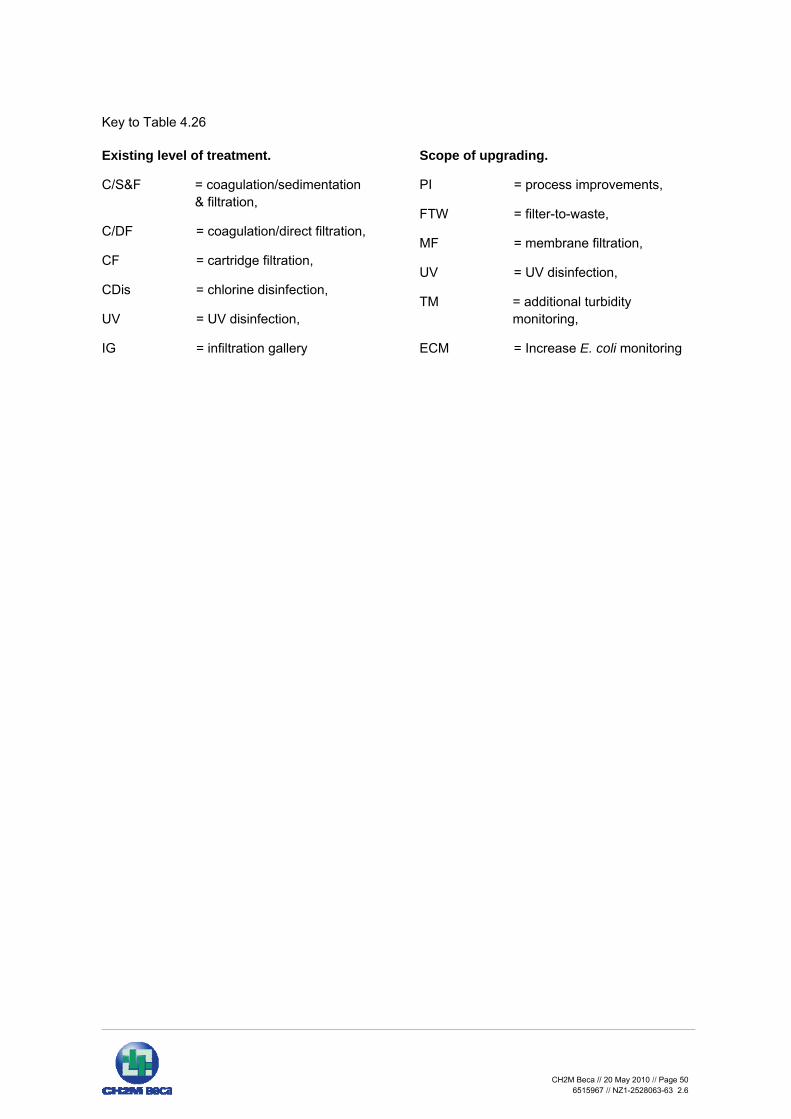
CH2M Beca // 20 May 2010 // Page 50
6515967 // NZ1-2528063-63 2.6
Key to Table 4.26
Existing level of treatment.
C/S&F = coagulation/sedimentation & filtration,
C/DF = coagulation/direct filtration,
CF = cartridge filtration,
CDis = chlorine disinfection,
UV = UV disinfection,
IG = infiltration gallery
Scope of upgrading.
PI = process improvements,
FTW = filter-to-waste,
MF = membrane filtration,
UV = UV disinfection,
TM = additional turbidity monitoring,
ECM = Increase E. coli monitoring
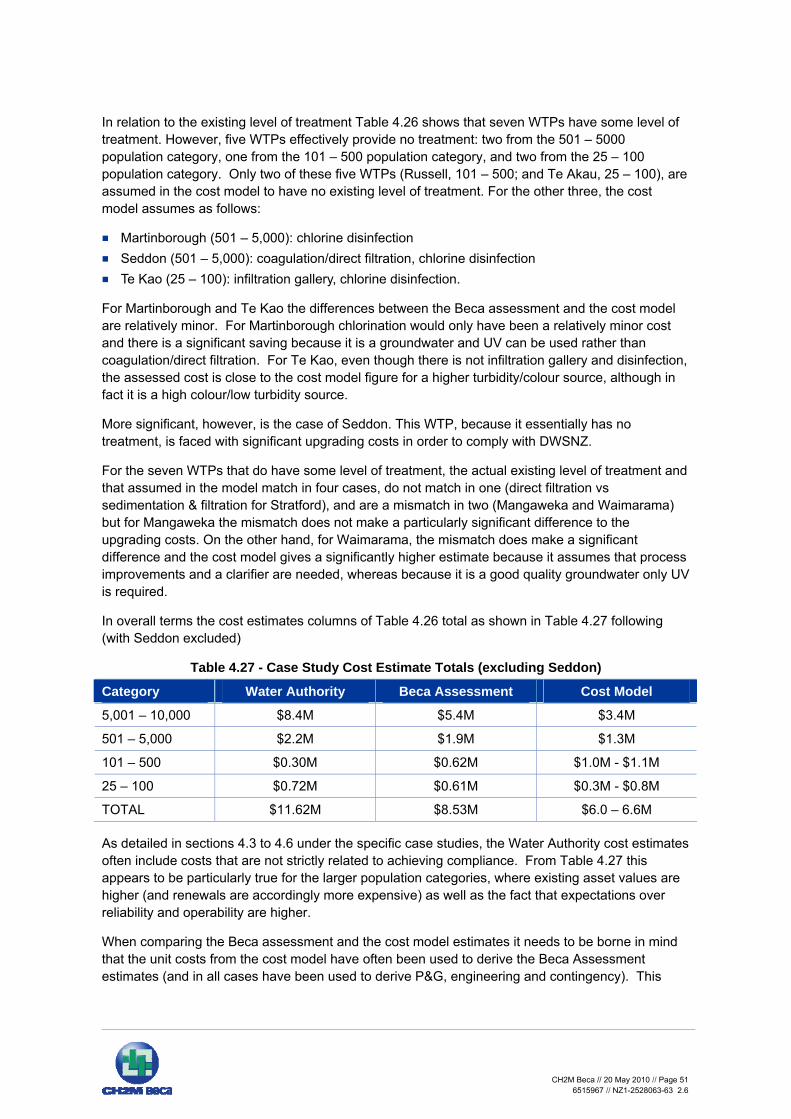
CH2M Beca // 20 May 2010 // Page 51
6515967 // NZ1-2528063-63 2.6
In relation to the existing level of treatment Table 4.26 shows that seven WTPs have some level of treatment. However, five WTPs effectively provide no treatment: two from the 501 – 5000 population category, one from the 101 – 500 population category, and two from the 25 – 100 population category. Only two of these five WTPs (Russell, 101 – 500; and Te Akau, 25 – 100), are assumed in the cost model to have no existing level of treatment. For the other three, the cost model assumes as follows:
Martinborough (501 – 5,000): chlorine disinfection Seddon (501 – 5,000): coagulation/direct filtration, chlorine disinfection Te Kao (25 – 100): infiltration gallery, chlorine disinfection.
For Martinborough and Te Kao the differences between the Beca assessment and the cost model are relatively minor. For Martinborough chlorination would only have been a relatively minor cost and there is a significant saving because it is a groundwater and UV can be used rather than coagulation/direct filtration. For Te Kao, even though there is not infiltration gallery and disinfection, the assessed cost is close to the cost model figure for a higher turbidity/colour source, although in fact it is a high colour/low turbidity source.
More significant, however, is the case of Seddon. This WTP, because it essentially has no treatment, is faced with significant upgrading costs in order to comply with DWSNZ.
For the seven WTPs that do have some level of treatment, the actual existing level of treatment and that assumed in the model match in four cases, do not match in one (direct filtration vs sedimentation & filtration for Stratford), and are a mismatch in two (Mangaweka and Waimarama) but for Mangaweka the mismatch does not make a particularly significant difference to the upgrading costs. On the other hand, for Waimarama, the mismatch does make a significant difference and the cost model gives a significantly higher estimate because it assumes that process improvements and a clarifier are needed, whereas because it is a good quality groundwater only UV is required.
In overall terms the cost estimates columns of Table 4.26 total as shown in Table 4.27 following (with Seddon excluded)
Table 4.27 - Case Study Cost Estimate Totals (excluding Seddon)
Category Water Authority Beca Assessment Cost Model
5,001 – 10,000 $8.4M $5.4M $3.4M
501 – 5,000 $2.2M $1.9M $1.3M
101 – 500 $0.30M $0.62M $1.0M - $1.1M
25 – 100 $0.72M $0.61M $0.3M - $0.8M
TOTAL $11.62M $8.53M $6.0 – 6.6M
As detailed in sections 4.3 to 4.6 under the specific case studies, the Water Authority cost estimates often include costs that are not strictly related to achieving compliance. From Table 4.27 this appears to be particularly true for the larger population categories, where existing asset values are higher (and renewals are accordingly more expensive) as well as the fact that expectations over reliability and operability are higher.
When comparing the Beca assessment and the cost model estimates it needs to be borne in mind that the unit costs from the cost model have often been used to derive the Beca Assessment estimates (and in all cases have been used to derive P&G, engineering and contingency). This
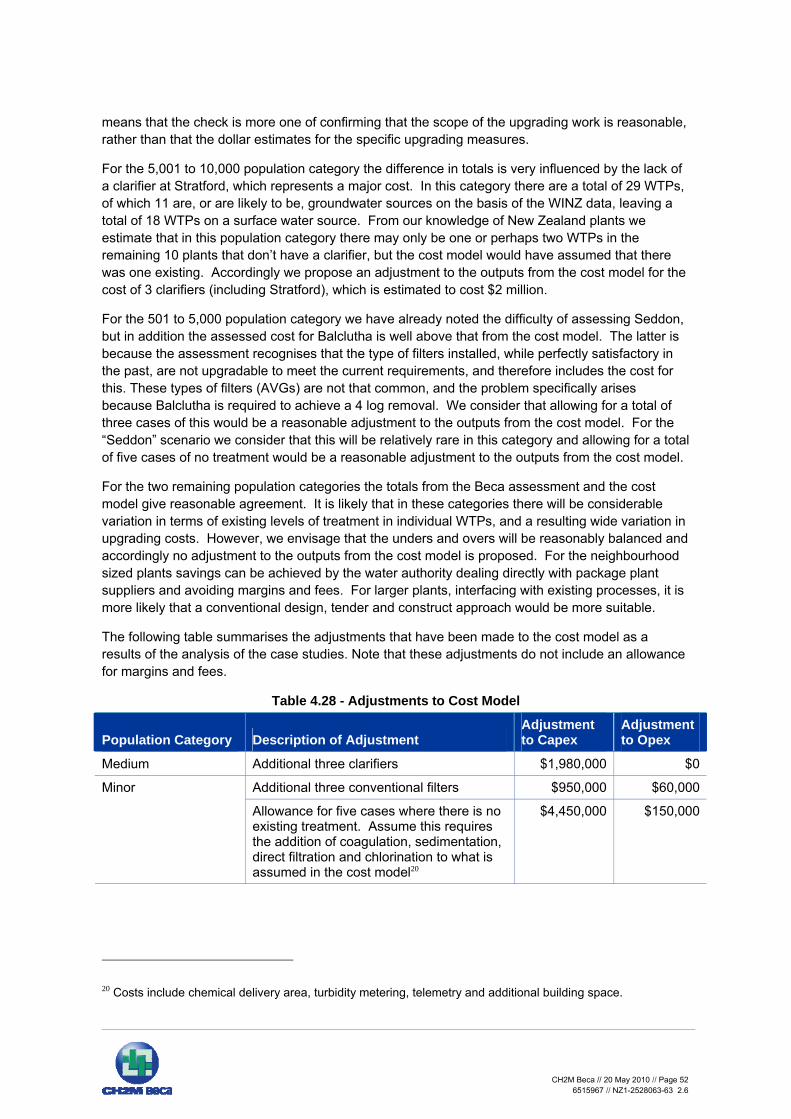
CH2M Beca // 20 May 2010 // Page 52
6515967 // NZ1-2528063-63 2.6
means that the check is more one of confirming that the scope of the upgrading work is reasonable, rather than that the dollar estimates for the specific upgrading measures.
For the 5,001 to 10,000 population category the difference in totals is very influenced by the lack of a clarifier at Stratford, which represents a major cost. In this category there are a total of 29 WTPs, of which 11 are, or are likely to be, groundwater sources on the basis of the WINZ data, leaving a total of 18 WTPs on a surface water source. From our knowledge of New Zealand plants we estimate that in this population category there may only be one or perhaps two WTPs in the remaining 10 plants that don’t have a clarifier, but the cost model would have assumed that there was one existing. Accordingly we propose an adjustment to the outputs from the cost model for the cost of 3 clarifiers (including Stratford), which is estimated to cost $2 million.
For the 501 to 5,000 population category we have already noted the difficulty of assessing Seddon, but in addition the assessed cost for Balclutha is well above that from the cost model. The latter is because the assessment recognises that the type of filters installed, while perfectly satisfactory in the past, are not upgradable to meet the current requirements, and therefore includes the cost for this. These types of filters (AVGs) are not that common, and the problem specifically arises because Balclutha is required to achieve a 4 log removal. We consider that allowing for a total of three cases of this would be a reasonable adjustment to the outputs from the cost model. For the “Seddon” scenario we consider that this will be relatively rare in this category and allowing for a total of five cases of no treatment would be a reasonable adjustment to the outputs from the cost model.
For the two remaining population categories the totals from the Beca assessment and the cost model give reasonable agreement. It is likely that in these categories there will be considerable variation in terms of existing levels of treatment in individual WTPs, and a resulting wide variation in upgrading costs. However, we envisage that the unders and overs will be reasonably balanced and accordingly no adjustment to the outputs from the cost model is proposed. For the neighbourhood sized plants savings can be achieved by the water authority dealing directly with package plant suppliers and avoiding margins and fees. For larger plants, interfacing with existing processes, it is more likely that a conventional design, tender and construct approach would be more suitable.
The following table summarises the adjustments that have been made to the cost model as a results of the analysis of the case studies. Note that these adjustments do not include an allowance for margins and fees.
Table 4.28 - Adjustments to Cost Model
Population Category Description of Adjustment Adjustment to Capex
Adjustment to Opex
Medium Additional three clarifiers $1,980,000 $0
Additional three conventional filters $950,000 $60,000Minor
Allowance for five cases where there is no existing treatment. Assume this requires the addition of coagulation, sedimentation, direct filtration and chlorination to what is assumed in the cost model20
$4,450,000 $150,000
20 Costs include chemical delivery area, turbidity metering, telemetry and additional building space.
CH2M Beca // 20 May 2010 // Page 53
6515967 // NZ1-2528063-63 2.6
4.8 Clutha District Council Concerns
When gathering the information for the case studies, there was some concern expressed by Clutha District Council (CDC) that the North Island small WTPs selected for the case studies typically had little or no treatment. CDC argued that while the cost of bringing such supplies up to compliance would be about the same as supplies which had some level of treatment (as for CDC), their health benefits would be greater. CDC’s view was that the cost-benefit ratio of upgrading North Island supplies may therefore appear more favourable than those for CDC. In fact, the final selection of supplies only has two North Island WTPs without treatment (Te Kao and Russell), and one South Island (Seddon).
On the costs side, if a treatment plant was originally well engineered and has been well maintained, it is typically more economic to upgrade, and costs are therefore not similar between no-treatment plants and some-treatment plants. The exceptions to this from the case studies are Balclutha and Thames, where the existing filters are not of an adequate design to cope with the current filtered water turbidity limits and need to be replaced (even if they have been well maintained).
It is worth noting that a special report on Clutha was presented to a select committee that specifically highlighted the state of their assets as being a significant contributing factor to the costs for CDC of complying with DWSNZ.
On the benefits side the differences between no-treatment plants and some-treatment plants compared with full compliance will be significant, but as this study is taking a nation-wide view this is not important.

CH2M Beca // 20 May 2010 // Page 54
6515967 // NZ1-2528063-63 2.6
5 Summary of Cost Estimates
5.1 Capital Cost
The following tables present a summary of the estimated probable costs for capital expenditure for all population categories. These costs have been adjusted to include the outcomes from the Case Studies in Section 4 and summarised in Table 4.28.
Note that two options for compliance have been considered, as discussed in Section 2.5.2
Option 1 - Full compliance with the Standards (bacterial and protozoal) is required. Option 2 - Compliance with only the bacterial requirements of the Standards is required.
Estimates of probable cost for capital expenditure for Option 1 are provided in Table 5.1.
Table 5.1 - Summary of Capital Costs for Compliance Option 1 ($million)
Population Category
Number of Plants
Total Capital Costs
Total Cost (inclusive of margins and fees)*
Population served
Large 22 $32.3 $50.4 291,531
Medium 29 $27.1 $42.3 124,107
Minor 192 $92.7 $144.5 289,480
Small 236 $43.3 $67.6 59,666
Neighbourhood 188 $20.5 $31.9 10,153
TOTAL 667 $215.9 $336.7 774,937
*Includes 18% P&G, 12% fees and supervision and 18% contingency.
These capital cost estimates are likely to fall in the accuracy range of + 30% and have been rounded to the nearest $100,000. The upper and lower cost bounds of the probable cost are given in Table 5.2. Refer to Section 2.5 for an explanation of how these bounds are determined.
Table 5.2 - Estimates of Probable Capital Cost for Compliance Option 1
Cost Estimate (+/- 30%) ($million) Total Cost (inclusive of margins and fees) ($million)* Population
Category Lower Midpoint Upper Lower Midpoint Upper
Large21 $32 $50
Medium $19 $27 $35 $30 $42 $55
Minor $65 $93 $120 $101 $145 $188
Small $30 $43 $56 $47 $68 $88
Neighbourhood $14 $20 $27 $22 $32 $42
21 Costs for large WTP compliance taken primarily from Water Authorities. We have not applied a cost accuracy band to this population category.
23 The capital cost estimate to upgrade Large WTPs for Compliance Option 2 is actually $4,000.
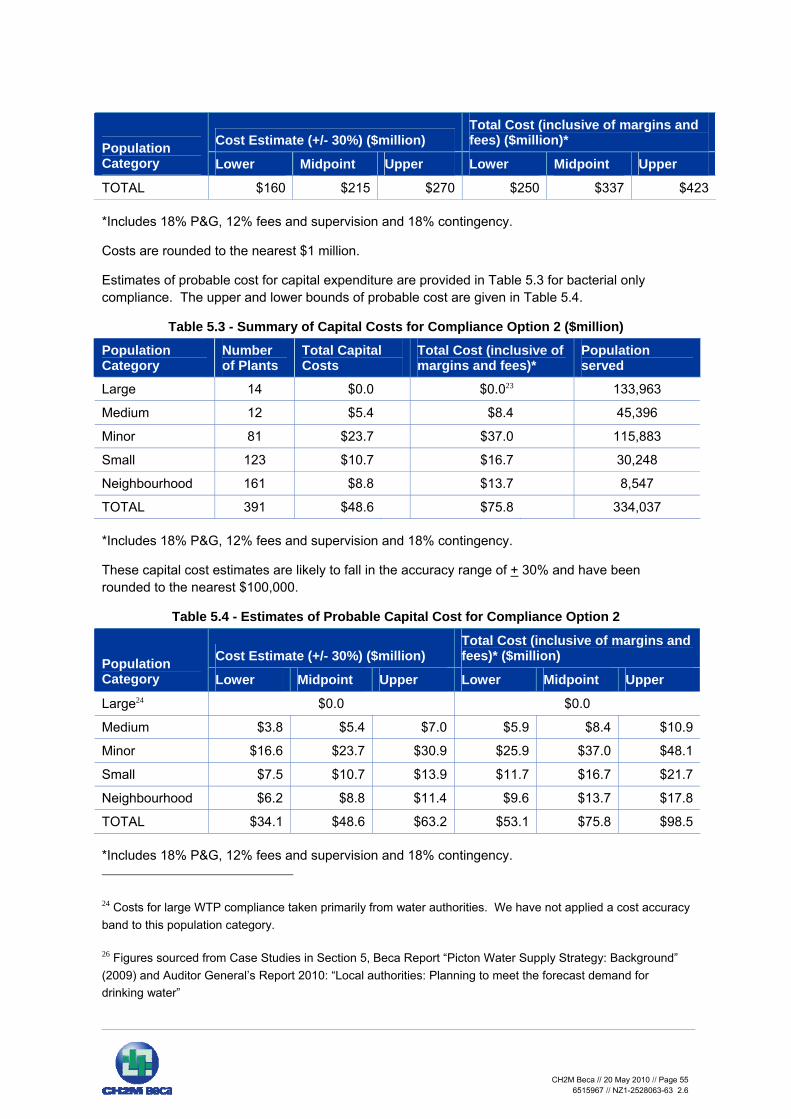
CH2M Beca // 20 May 2010 // Page 55
6515967 // NZ1-2528063-63 2.6
Cost Estimate (+/- 30%) ($million) Total Cost (inclusive of margins and fees) ($million)* Population
Category Lower Midpoint Upper Lower Midpoint Upper
TOTAL $160 $215 $270 $250 $337 $423
*Includes 18% P&G, 12% fees and supervision and 18% contingency.
Costs are rounded to the nearest $1 million.
Estimates of probable cost for capital expenditure are provided in Table 5.3 for bacterial only compliance. The upper and lower bounds of probable cost are given in Table 5.4.
Table 5.3 - Summary of Capital Costs for Compliance Option 2 ($million)
Population Category
Number of Plants
Total Capital Costs
Total Cost (inclusive of margins and fees)*
Population served
Large 14 $0.0 $0.023 133,963
Medium 12 $5.4 $8.4 45,396
Minor 81 $23.7 $37.0 115,883
Small 123 $10.7 $16.7 30,248
Neighbourhood 161 $8.8 $13.7 8,547
TOTAL 391 $48.6 $75.8 334,037
*Includes 18% P&G, 12% fees and supervision and 18% contingency.
These capital cost estimates are likely to fall in the accuracy range of + 30% and have been rounded to the nearest $100,000.
Table 5.4 - Estimates of Probable Capital Cost for Compliance Option 2
Cost Estimate (+/- 30%) ($million) Total Cost (inclusive of margins and fees)* ($million) Population
Category Lower Midpoint Upper Lower Midpoint Upper
Large24 $0.0 $0.0
Medium $3.8 $5.4 $7.0 $5.9 $8.4 $10.9
Minor $16.6 $23.7 $30.9 $25.9 $37.0 $48.1
Small $7.5 $10.7 $13.9 $11.7 $16.7 $21.7
Neighbourhood $6.2 $8.8 $11.4 $9.6 $13.7 $17.8
TOTAL $34.1 $48.6 $63.2 $53.1 $75.8 $98.5
*Includes 18% P&G, 12% fees and supervision and 18% contingency.
24 Costs for large WTP compliance taken primarily from water authorities. We have not applied a cost accuracy band to this population category.
26 Figures sourced from Case Studies in Section 5, Beca Report “Picton Water Supply Strategy: Background” (2009) and Auditor General’s Report 2010: “Local authorities: Planning to meet the forecast demand for drinking water”

CH2M Beca // 20 May 2010 // Page 56
6515967 // NZ1-2528063-63 2.6
Costs are rounded to the nearest $100,000.
Of the 14 large WTPs that are non-compliant for bacteria, 10 are technically non-compliant. The capital and operating costs associated with technical non-compliance are small as upgrading to achieve compliance involves work on existing systems. Of the remaining four non-compliant plants, three are emergency supplies which cannot meet the monitoring requirements of the standards and one is due to operational issues with its FAC monitoring system which is already in place.
5.2 Operating Costs
The following tables present a summary of the estimated probable operating costs for all sizes of treatment plant. These costs have been adjusted to include the outcomes from the Case Studies in Section 4 and summarised in Table 4.28.
Estimates of probable operating cost are provided in Table 5.5 for Option 1 - bacteria and protozoa compliance and Table 5.6 for Option 2 - bacteria only compliance.
Table 5.5 – Estimates of Probable Operating Costs for Compliance Option 1
Population Category Number of Plants Annual Operating Cost Population served
Large 22 $290,000 291,531
Medium 29 $1,060,000 124,107
Minor 192 $4,020,000 289,480
Small 236 $4,810,000 59,666
Neighbourhood 188 $2,370,000 10,153
TOTAL 667 $12,550,000 774,937
Table 5.6 - Estimates of Probable Operating Costs for Compliance Option 2
Population Category Number of Plants Annual Operating Cost Population served
Large 14 $300 133,963
Medium 12 $180,000 45,396
Minor 81 $670,000 115,883
Small 123 $2,460,000 30,248
Neighbourhood 161 $1,680,000 8,547
TOTAL 391 $4,990,000 334,037
Operating costs have been rounded to the nearest $10,000.

CH2M Beca // 20 May 2010 // Page 57
6515967 // NZ1-2528063-63 2.6
6 Sensitivity Analysis
WTPs are generally sized to be able to supply a community’s peak day water usage and allow for some population growth. Because of this the cost of a WTP is heavily reliant on the peak design flow. A sensitivity analysis was carried out for the relationship between demand (L/person/day) and the total cost for upgrading WTPs to comply with DWSNZ (including adjustments made from the Case Studies).
The base analysis assumed a conservative water use rate of 1,200 L/person/day as this reflects typical peak water use outside the main metropolitan centres. This includes allowance for losses in the reticulation system or large industrial users. Two other water use rates were used to assess the sensitivity: 500 L/person/day and 250 L/person/day. Sensitivity was only carried out on the case where bacterial and protozoal compliance was required.
Supplies in the “Large” population category have not been included in the sensitivity analysis. Larger supplies tend to have lower per capita consumption rates and are more likely to have volumetric metering for water.
The following tables summarise the findings from the sensitivity analysis. Table 6.1 gives the probable cost for capital expenditure (including margins and fees) and Table 6.2 gives the probable annual operating cost.
The likely accuracy range of ±30% would also apply to the capital cost component as described in Section 2.5.
Table 6.1 - Sensitivity Analysis – Estimate of Probable Capital Expenditure (including margins and fees) for Compliance Option 1
Population Category Water Use Assumption (L/person/day) Medium Minor Small N’bourhood Total
1,200 $42,290,000 $144,530,000 $67,670,000 $31,940,000 $286,430,000
500 $27,030,000 $101,780,000 $52,240,000 $27,330,000 $208,380,000
250 $20,170,000 $81,870,000 $44,790,000 $24,920,000 $171,750,000
Table 6.2 - Sensitivity Analysis – Estimate of Probable Operating Cost for Option 1
Population Category Water Use Assumption (L/person/day) Medium Minor Small N’bourhood Total
1,200 $1,060,000 $4,020,000 $4,810,000 $2,370,000 $12,260,000
500 $880,000 $3,660,000 $4,750,000 $2,360,000 $11,650,000
250 $780,000 $3,470,000 $4,720,000 $2,350,000 $11,320,000
The relationship between reduced flow and reduced capital cost is clear from Table 6.1. A 60% reduction in demand (from 1,200 L/person/day to 500 L/person/day) results in an estimated 25% decrease in capital cost. There is a diminishing return as the demand is further decreased from 500 to 250 L/person/day, the 50% decrease only returns a 17% reduction in capital cost.
The effect of reduced demand is much less (in the range of 5%) on operating costs as components such as operator labour costs are largely independent of flow.

CH2M Beca // 20 May 2010 // Page 58
6515967 // NZ1-2528063-63 2.6
Figure 6.1 illustrates the variation in costs from the sensitivity analysis.
Total Cost of Upgrading to DWSNZ (Option 1)
$0
$50
$100
$150
$200
$250
$300
$350
1200 500 250
Demand (L/person/day)
Cos
t ($
mill
)
Capital CostIncluding Marginsand Fees
Figure 6.1 – Capital Cost by Design Demand
6.1 Water Use in New Zealand
The purpose of the sensitivity analysis was to assess the effect that reducing the design demand had on the estimated capital cost for compliance.
Following the sensitivity analysis we looked at typical water use rates in New Zealand to see how they compared with the values used in the analysis. The Table 6.3 below gives some values for typical New Zealand water consumption rates.
Table 6.3 - Typical Average and Peak Water Use Rates in NZ by Council26
Council/Case Study Community
Household Water Metering
Average Water Use (L/person/day)
Peak Water Use/ Design Capacity (L/person/day)
Papakura27 Yes 190
Rodney Yes 221
Upper Hutt23 No 227
Tauranga Yes 234 500
Waitakere Yes 241
Tasman Yes 250
Manukau Yes 287
27 May be residential only water use
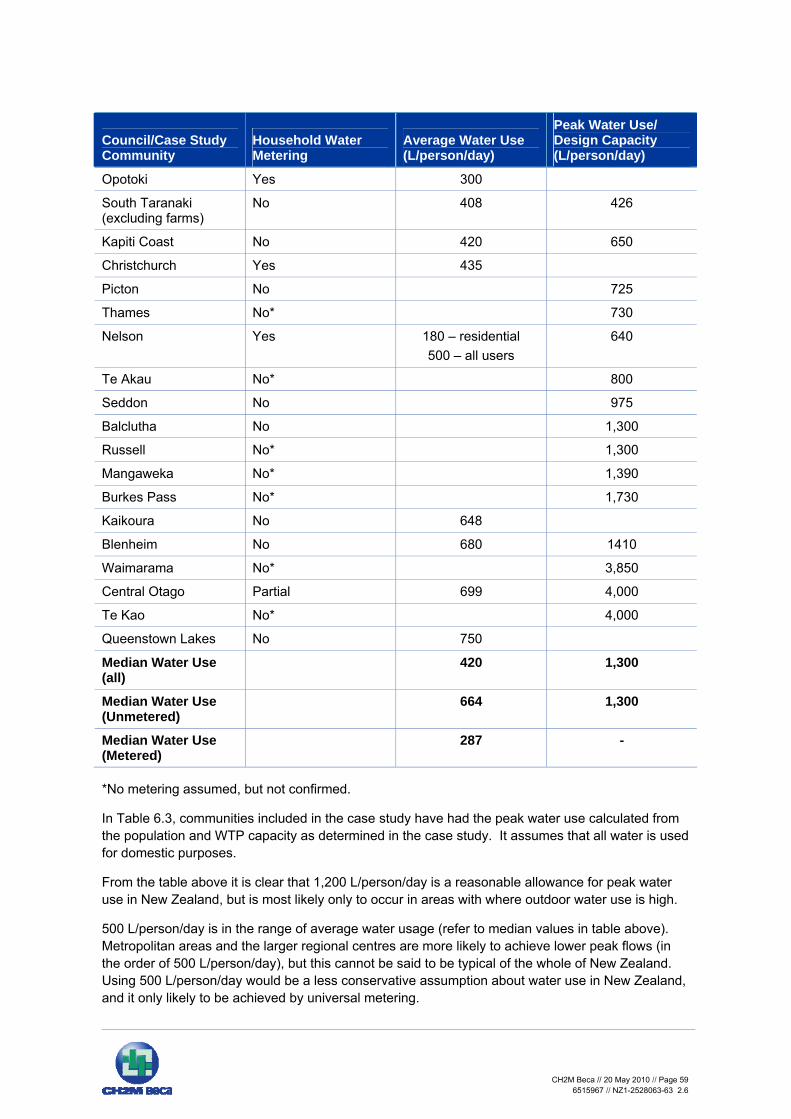
CH2M Beca // 20 May 2010 // Page 59
6515967 // NZ1-2528063-63 2.6
Council/Case Study Community
Household Water Metering
Average Water Use (L/person/day)
Peak Water Use/ Design Capacity (L/person/day)
Opotoki Yes 300
South Taranaki (excluding farms)
No 408 426
Kapiti Coast No 420 650
Christchurch Yes 435
Picton No 725
Thames No* 730
Nelson Yes 180 – residential 500 – all users
640
Te Akau No* 800
Seddon No 975
Balclutha No 1,300
Russell No* 1,300
Mangaweka No* 1,390
Burkes Pass No* 1,730
Kaikoura No 648
Blenheim No 680 1410
Waimarama No* 3,850
Central Otago Partial 699 4,000
Te Kao No* 4,000
Queenstown Lakes No 750
Median Water Use (all)
420 1,300
Median Water Use (Unmetered)
664 1,300
Median Water Use (Metered)
287 -
*No metering assumed, but not confirmed.
In Table 6.3, communities included in the case study have had the peak water use calculated from the population and WTP capacity as determined in the case study. It assumes that all water is used for domestic purposes.
From the table above it is clear that 1,200 L/person/day is a reasonable allowance for peak water use in New Zealand, but is most likely only to occur in areas with where outdoor water use is high.
500 L/person/day is in the range of average water usage (refer to median values in table above). Metropolitan areas and the larger regional centres are more likely to achieve lower peak flows (in the order of 500 L/person/day), but this cannot be said to be typical of the whole of New Zealand. Using 500 L/person/day would be a less conservative assumption about water use in New Zealand, and it only likely to be achieved by universal metering.

CH2M Beca // 20 May 2010 // Page 60
6515967 // NZ1-2528063-63 2.6
250 L/person/day is low, even for an average water use. It is generally only achievable in residential areas where these is extremely limited outdoor or industrial water use and where there is volumetric based charging (universal metering) for water.
Our analysis, based on 1,200 L/person/day is therefore likely to give a reasonable overall cost estimate for compliance, but the sensitivity analysis shows the savings that could be achieved if per capita demand was reduced.
6.2 Water Use Overseas
This section aims to put water consumption rates in New Zealand into an international perspective. Figure 6.2 outlines some average (not peak) water use figures from overseas28.
0
100
200
300
400
500
600
700
Lithu
ania
German
y
Brisba
ne
Denmark
Englan
d and
Wale
s
Gold C
oast
Goulbu
rn Vall
ey
France
Sydne
y
Netherl
ands
Norway
Coliba
nSpa
inPert
h
NZ Mete
red (m
edian
)
NZ All (
median
)
Darwin
Alice S
pring
s
NZ Unm
etered
(med
ian)
Wat
er C
onsu
mpt
ion
(L/p
erso
n/da
y)
Figure 6.2 – International Average Household Water Consumption
It is clear from Figure 6.2 that water consumption rates in New Zealand are comparatively high in an international context. The regions listed above in general have much higher populations than in New Zealand, and the prevalence of volumetric water metering and urbanisation will influence water use rates overseas.
From Figure 6.2 it is clear that 250 L/person/day as a peak design flow is probably unreasonable, as for many regions this is their average consumption rate. From looking at the international figures, 500 L/person/day is a reasonable target for New Zealand for peak water consumption, but is likely to require universal metering.
28 Ref: National Performance Report Urban Water Utilities 2007-08 National Water Commission and WSAA (Residential Water Supplied), Freshwater Consumption in Europe Household Water Consumption Rates- OECD website (2003), and OFWAT website (2007-08)
CH2M Beca // 20 May 2010 // Page 61
6515967 // NZ1-2528063-63 2.6
6.3 Summary of Sensitivity Analysis
From the sensitivity analysis it is clear that reducing water usage has a large financial pay-off. There are several approaches to demand management that have been used to varying degrees of success in New Zealand.
Water restrictions are a common demand management practice, usually exercised in times of drought/low rainfall. They rely heavily on voluntary community participation, and are not suitable for extended periods of time (as the perception of the need to restrict water use will diminish over time). Enforcing or penalising users who exceed water restrictions can be difficult.
Universal metering is another method of demand management commonly used overseas, but which is met with resistance in some parts of New Zealand. There is a common perception that people should have the right to free drinking water, which is largely a misconception, as through rates councils already charge residents for the drinking water provided to them. Universal metering works in much the same way as gas or electricity metering, users are charged for water based on how much they use. Councils in New Zealand (and overseas) that have implemented universal metering have found that it greatly reduces water demand, reductions of around 25-30% in both average and peak day demand. As the cost to implement universal metering is relatively high (for the most basic metering supply and installation is in the region of $200 - $400 per house), and the concept may be met with stiff opposition from residents, it may not be a feasible option for all councils. The cost savings from smaller WTPs would have to be offset against the cost of installing the metering systems.
Although leakage reduction is not strictly a demand management technique, some councils may find they have significant leakage in their water reticulation networks. If leakage can be reduced, so the volume of water required to be treated can be reduced, and depending on the extent of the leakage problem, and how easy the leaks are to find and fix, may yield significant financial benefit.
The use of water efficient appliances and fittings can be encouraged through Building Standards or Local Authority/Government initiatives and incentives.
Policy options could be explored which look at ways to reduce overall consumption, with potential associated savings in DWSNZ compliance costs.

CH2M Beca // 20 May 2010 // Page 62
6515967 // NZ1-2528063-63 2.6
7 Chemical Compliance
Microbiological contaminants are monitored in all supplies and hence are known as Priority 1 determinands. A second level, defined as Priority 2 (P2) determinands, do not have to be measured in every supply but are specified for only those supplies which the Ministry of Health believes exceed half the maximum allowable value (MAV) for a particular health-significant determinand.
Only supplies with populations of 100 or more have been assessed, and the population must be at least 500 before a Priority 2 (P2) determinand is officially assigned and appears in the Register of Community Drinking-Water Supplies in New Zealand.
With a few exceptions, MAVs (maximum acceptable values) for chemicals are calculated for long-term exposure, i.e., their health effects are manifested over a lifetime (defined as 70 years) of consumption. The P2 value is set at half the MAV. For the CBA we have only looked at transgressions above the MAV. The data is provided from the WINZ database by ESR for the 2007-08 reference year.
P2s can be assigned to Zones or Plants. Of the P2s assigned to Plants, almost all of them are for fluoride and have fluoride added at the WTP. All of the examples of fluoride transgressions are for added (not natural) fluoride and therefore represents a failure in the plant to properly manage the addition of fluoride rather than for other P2s where generally excess levels are not due to dosing faults.
There are only seven non-fluoride P2s assigned to Plants (arsenic x1, chlorate x4 and nitrate x2). These have been assigned to the Plant so that the water supplier does not have to monitor for the same P2 in multiple Zones where the concentrations of the P2 were likely to be the same as that coming out of the plant.
All other P2s have been assigned to Zones. Where the zone is supplied by multiple plants we have assumed that all WTPs will require some form of treatment upgrade or modification to prevent future transgressions.

CH2M Beca // 20 May 2010 // Page 63
6515967 // NZ1-2528063-63 2.6
Table 7.1 – Non-Compliant Treatment Plants &/or Distributions Zones for P2 Determinands
Determinand Abbreviation Chemical MAV
Number of WTPs or zones exceeding MAV
Population affected by non-compliance
Antimony Sb
Arsenic As 0.01 mg/L 8 29,986 (includes Lake Terrace – 15,000)
Boron B 1.4 mg/L 1 1,332
Bromodichloromethane CHBCl2 0.06 mg/L 1 879
Chlorate ClO3 0.8 1 900
Dichloroacetic acid DCA 0.05 mg/L 3 (one of which is a self supply for Tiwai Pt)
1,011 (excluding Tiwai Pt – 900)
Fluoride F 1.5 mg/L 5 (one of which is a self supply for Woodbourne Base)
37,509 (excluding Woodbourne Base – 1,500 )
Manganese Mn 0.4 mg/L 2 1,170
MAV sum ratio for HAAs
MAVHAA 0.05 mg/L 4 (one of which is a self supply for Tiwai Pt)
2,511 (Excluding Tiwai Pt - 900)
MAV sum ratio for THMs
MAVTHM 0.06 mg/L 7 (one of which is a self supply for Tiwai Pt)
14,493 (Excluding Tiwai Pt - 900)
Nitrate (as NO3) NO3 50 mg/L 1 10,500
Note that some of the WTPs are non-compliant for more than one P2 determinand, and there is subsequently an overlap in the above population figures.
7.1 Commentary on Chemical MAVs
7.1.1 General
Where chemical MAV transgressions have occurred and the associated WTP has also been identified as non-compliant for a P1 determinand we have firstly looked at the upgrade requirements for the P1 and then whether any further treatment is required for the chemical MAV. The costs reported for chemical MAV compliance is therefore over and above any costs required for P1 compliance.
7.1.2 Arsenic
Arsenic is a genotoxic carcinogen (i.e. there is no-threshold concentration below which it is considered to have no health effect). The arsenic concentration in many of the effected supplies is

CH2M Beca // 20 May 2010 // Page 64
6515967 // NZ1-2528063-63 2.6
probably relatively constant, therefore the maximum reported concentrations are probably reasonable estimations of the typical concentration.
Data downloaded from the WINZ database contains a list of supplies in which arsenic was reported to have exceeded its MAV at least once. The high percentages of samples exceeding the MAV show that exceedence is typical.
The eight zones with arsenic transgressions were limited to the Taupo and Whakatane regions and are attributable to the high degree of geothermal activity in the region. Lake Terrace WTP has been considered separately under the Large WTP analysis, and the cost for upgrading it to comply with P2 determinands is not included here.
The generic treatment for arsenic that has been applied is enhanced coagulation (which consists of improvements to dosing control (S:CAN) and pH), and direct filtration (which may be necessary for P1 compliance).
7.1.3 Boron
Conventional treatment (coagulation/flocculation-clarification-filtration-disinfection) does not significantly reduce the boron concentration in water. Ion exchange and membrane filtration may have some effect, but are expensive. If a suitable (i.e. low-boron) secondary source is available, blending of the waters is probably the most economic approach to dealing with high boron concentrations.
There was only one transgression above the MAV for Boron. Franklin District Council (FDC), the Water Authority responsible for the supply has advised us that the Clarks Beach supply is blended with the Waiau supply. They are still making adjustments to adjust the dilution, but have not had any transgressions of the MAV for six months. FDC acknowledged that under certain circumstances, e.g. fire demand, the supply won't comply, but that for the majority of the time it will. As the public health effects are based on a lifetime of exposure, this is probably a reasonable solution. Accordingly no costs have been allowed for any further upgrading of this supply for boron.
7.1.4 Bromodichloromethane
Bromodichloromethane (BDCM) is a disinfection by-product and suspected carcinogen without a threshold.
Two supplies were found to exceed the MAV for bromodichloromethane. We have assumed that transgressions can be resolved by enhanced coagulation. However analysis by ESR shows that the population affected by exceedences of the MAV is so small that excess cancer development over a 70 year period due to bromodichloromethane exceeding its MAV to the extent presently found is negligible so the cost benefit of upgrading may not be worthwhile.
7.1.5 Chlorate
Chlorate is only found in water supplies that are chlorinated using sodium or calcium hypochlorite (although not all of these supplies have the problem). In high strength solutions, hypochlorite reacts with itself to form chlorate. Both sodium and calcium hypochlorite are used as high concentration solutions that are then dosed into the water being treated. The older the solution the longer the time this reaction has to proceed, and the higher the concentration of chlorate in the stock solution that is dosed into the water. Gas chlorine is not held in solution, but injected directly into the water at low concentrations so the problem does not arise.
Chlorate is an example of a determinand that can be reduced in concentration by means other than treatment. The water supplier should ensure that the chemical supplier provides fresh solutions,

CH2M Beca // 20 May 2010 // Page 65
6515967 // NZ1-2528063-63 2.6
and should not stock-pile large quantities to avoid the solutions becoming aged by the time they are used.
There was only one supply with chlorate transgressions. We have assumed that compliance could be maintained through better housekeeping such as moving the chlorate tank inside so as to not be in direct sunlight (currently kept outside) and ensuring that the turnover and age of the chemical is kept low. We have assumed negligible costs to implement this.
7.1.6 Fluoride
Although fluoride is listed as a P2 determinant, with one exception (Clarks/Waiau Beach, which did not have an exceedence in the reference year), all water supplies with fluoride assigned as a P2 determinand have this assignment because they intentionally add fluoride to their water. The concentrations are generally well-controlled close to the target concentration of ca. 1.0 mg/L (for protection against dental caries), so exceedences of the MAV are likely to be short-lived. Transgressions can be minimised through operational measures. For this reason we have excluded fluoride from the CBA.
7.1.7 Manganese
Manganese is a ubiquitous, naturally-occurring determinand, commonly present in groundwaters. It has an aesthetic guideline of 0.05mg/L, well below its MAV of 0.4 mg/L. Consequently, people are likely to complain about their laundry being stained before health problems are experienced.
There are two non-compliant WTPs for manganese. We have assumed that the Te Karaka WTP has a minimum of coagulation, filtration and chlorination and that the addition of potassium permanganate (KMnO4) will precipitate the manganese for removal in the filters. The Takapau Township supply is assumed to have no treatment and hence to be compliant for manganese would require the addition of filtration and with pre-chlorination to oxidise the manganese.
7.1.8 Dichloroacetic acid (DCAA)
DCAA is a disinfection by-product resulting from chlorination of a water supply. Three supplies had transgressions for DCAA. Of the three, one is for Tiwai Point which is a self-supply and exluded from the CBA.
For the other two we have assumed that transgressions can be resolved by enhanced coagulation. However analysis by ESR shows that the population affected by levels of DCAA in excess of its MAV is too small for estimated levels in cancer development to increase measurably so the cost benefit of upgrading may not be worthwhile.
7.1.9 MAV sum ratio for HAAs
The haloacetic acids are a family of disinfection by products that includes DCAA already considered above and trichloroacetic acid (TCAA).
The MAV ratio sum in the case of HAAs is defined as:
[ ] [ ]TCAADCAA MAV
TCAAMAV
DCAA+
where the square brackets denote concentrations, and TCAA is trichloroacetic acid.
The annual survey of water supplies does not provide information about the individual DCAA and TCAA concentrations when the P2 assignment is for the HAA MAV ratio sum. Consequently, the contributions of the two compounds to the MAV exceedence cannot be determined.
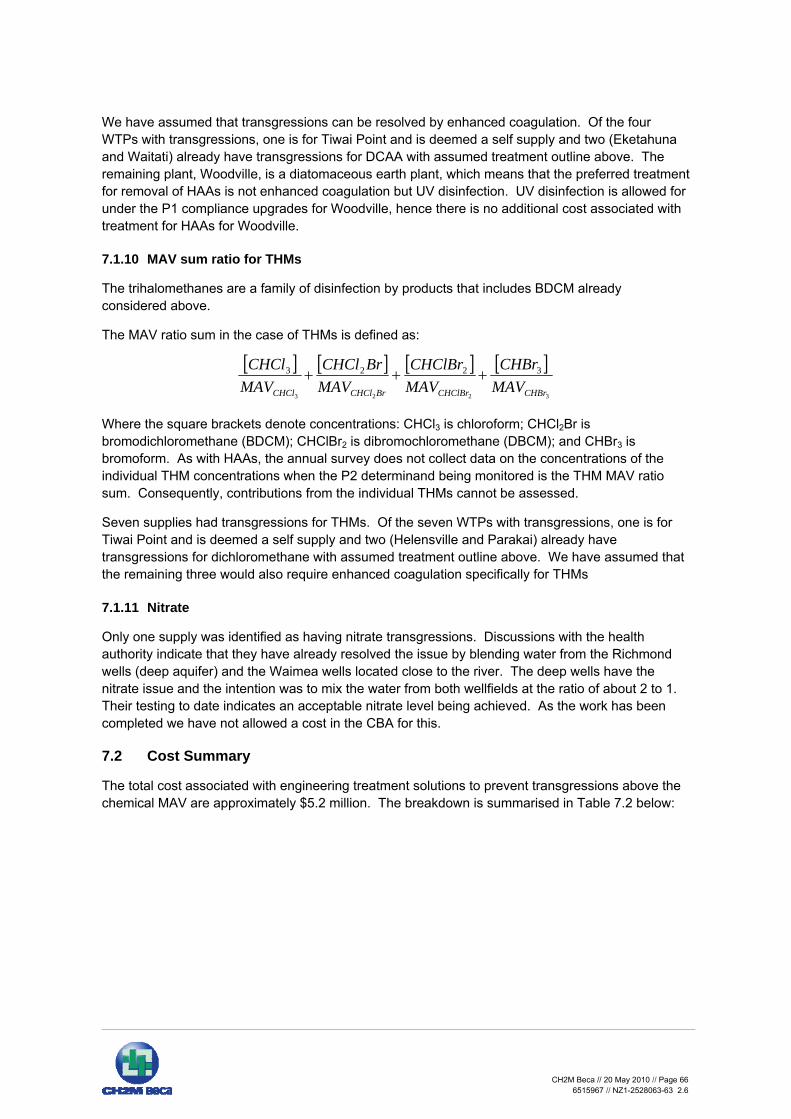
CH2M Beca // 20 May 2010 // Page 66
6515967 // NZ1-2528063-63 2.6
We have assumed that transgressions can be resolved by enhanced coagulation. Of the four WTPs with transgressions, one is for Tiwai Point and is deemed a self supply and two (Eketahuna and Waitati) already have transgressions for DCAA with assumed treatment outline above. The remaining plant, Woodville, is a diatomaceous earth plant, which means that the preferred treatment for removal of HAAs is not enhanced coagulation but UV disinfection. UV disinfection is allowed for under the P1 compliance upgrades for Woodville, hence there is no additional cost associated with treatment for HAAs for Woodville.
7.1.10 MAV sum ratio for THMs
The trihalomethanes are a family of disinfection by products that includes BDCM already considered above.
The MAV ratio sum in the case of THMs is defined as:
[ ] [ ] [ ] [ ]3223
3223
CHBrCHClBrBrCHClCHCl MAVCHBr
MAVCHClBr
MAVBrCHCl
MAVCHCl
+++
Where the square brackets denote concentrations: CHCl3 is chloroform; CHCl2Br is bromodichloromethane (BDCM); CHClBr2 is dibromochloromethane (DBCM); and CHBr3 is bromoform. As with HAAs, the annual survey does not collect data on the concentrations of the individual THM concentrations when the P2 determinand being monitored is the THM MAV ratio sum. Consequently, contributions from the individual THMs cannot be assessed.
Seven supplies had transgressions for THMs. Of the seven WTPs with transgressions, one is for Tiwai Point and is deemed a self supply and two (Helensville and Parakai) already have transgressions for dichloromethane with assumed treatment outline above. We have assumed that the remaining three would also require enhanced coagulation specifically for THMs
7.1.11 Nitrate
Only one supply was identified as having nitrate transgressions. Discussions with the health authority indicate that they have already resolved the issue by blending water from the Richmond wells (deep aquifer) and the Waimea wells located close to the river. The deep wells have the nitrate issue and the intention was to mix the water from both wellfields at the ratio of about 2 to 1. Their testing to date indicates an acceptable nitrate level being achieved. As the work has been completed we have not allowed a cost in the CBA for this.
7.2 Cost Summary
The total cost associated with engineering treatment solutions to prevent transgressions above the chemical MAV are approximately $5.2 million. The breakdown is summarised in Table 7.2 below:

CH2M Beca // 20 May 2010 // Page 67
6515967 // NZ1-2528063-63 2.6
Table 7.2 – Estimated Probable Capital Cost of complying with Chemical MAVs (including
margins and fees)
Chemical MAV Cost Population currently exposed
Arsenic29 $2,050,000 29,986
Boron $0 1,332
Manganese $800,000 1,170
Nitrate $0 10,500
Dichloroacetic Acid and MAV ratio sum of HAAs $580,000 1,011
MAV sum ration of HAAs $0 1,500
Bromodichloromethane and MAV sum ratio of THM $290,000 879
Chlorate and MAV sum ratio of THM $290,000 900
MAV sum ratio of THM $1,170,000 12,714
TOTAL $5,190,000 59,9921
Note: for some combinations of P2s the same treatment process is required hence the costs have been grouped by commonality of non-compliance.
Costs include 18% for preliminary and general, 12% for design and 18% for contingency. A cost accuracy of +/- 30% can be applied to the capital cost.
Refer Appendix D for a more detailed assessment of non-compliance and assumed treatment.
29 Excludes the costs for Lake Terrace, Taupo. The Lake Terrace bacterial/protozoal compliance upgrades will also treat arsenic, therefore no cost has been allowed for here. The population of Taupo still benefit from the removal of arsenic so the Lake Terrace population has been included. Refer Section 4.3.

CH2M Beca // 20 May 2010 // Page 68
6515967 // NZ1-2528063-63 2.6
8 Household Water Treatment Systems
8.1 Introduction
Household water treatment options are considered here as an alternative to a centralised water treatment system. In some rural situations they may provide a lower cost option than centralised systems, but there are a number of compliance-type issues that must be considered alongside cost.
There are two options for household water treatment systems:
Point-of-entry (POE) systems treat water where it enters the property or household, e.g. at the property boundary or at the point of entrance to the house. Thus all water used within the house is treated, although outside taps may not be.
Point-of-use (POU) systems treat water where it is used, i.e. at individual taps. Only taps that have treatment units attached to them are suitable for drinking water.
Reasons a community may choose to implement a household type water treatment system include:
High cost of a centralised treatment system Other difficulties in implementing a centralised water treatment system Concerns from some individuals surrounding taste and odour or other aesthetic issues, which
the community at large do not want to treat for Some (particularly rural) supplies only use a small portion of the supply’s design flow for
household use; and/or may augment this with, for example, roof water.
8.2 Compliance Issues
In terms of the Health (Drinking Water) Amendment Act, treatment systems for individual households do not need to comply with DWSNZ and are deemed to be covered under the Building Act. The Building Act states that waters supplied to households must be potable, but is unclear to what minimum standard household treatment systems should be designed to. A review of the Building Code (2007) suggests that in the future, “all water supplied at fixtures…intended for human consumption, utensil washing, food preparation, and personal washing meet the health requirements of the New Zealand Drinking Water Standards 2005” (revised 2008). The Health Act also defines potable water as that which is within the MAVs. With this is mind, the purpose of this study is to establish whether safe drinking water (i.e. complies with DWSNZ) can be more cost-effectively provided by POE or POU systems.
Centralised treatment systems rely on the monitoring of E. coli and key process parameters to ensure the treatment process is effective and compliant with DWSNZ. The only way to ensure that POE/POU treatment systems are effective and that the risks of inadequate treatment are managed is through regular maintenance and checks of each household treatment system.
The performance of the treatment system will also be dependent on the raw water quality. Examples of risks to the treated water quality include:
High turbidity reducing effectiveness of UV disinfection Low UV transmittance reducing effectiveness of UV disinfection UV lamp fouling reducing effectiveness of UV disinfection Power outage would mean no disinfection if using UV Excess flow reducing effectiveness of the treatment process
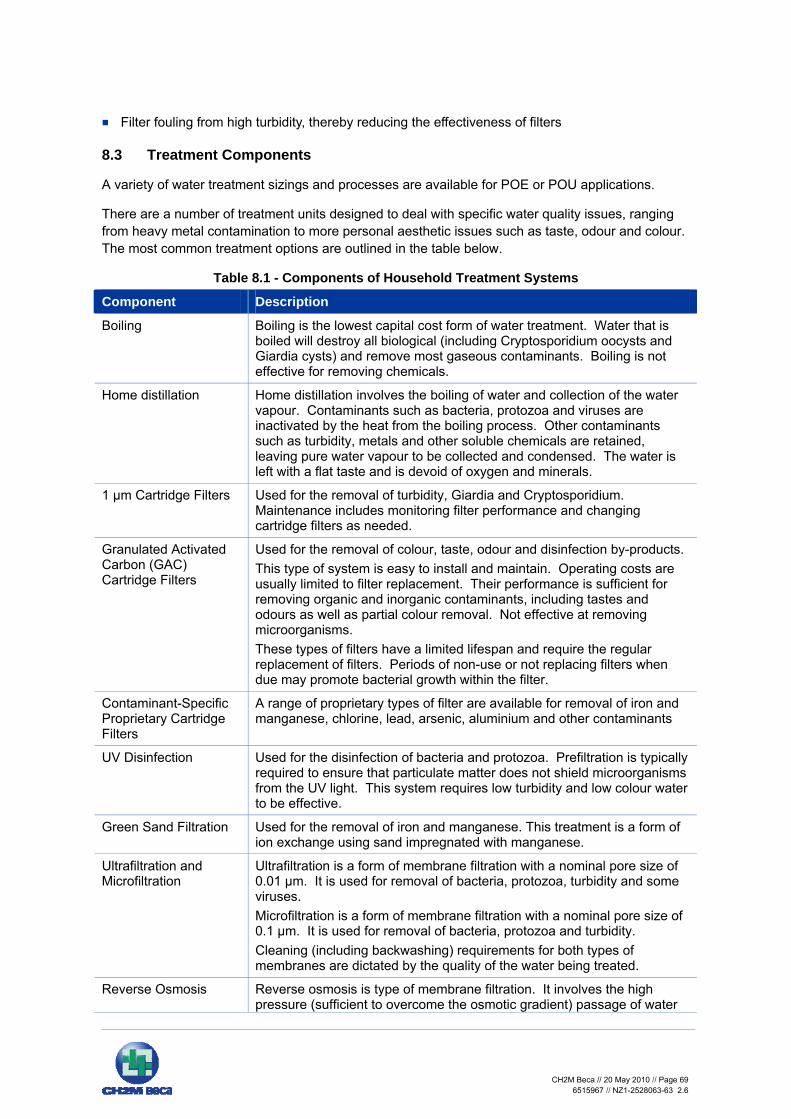
CH2M Beca // 20 May 2010 // Page 69
6515967 // NZ1-2528063-63 2.6
Filter fouling from high turbidity, thereby reducing the effectiveness of filters
8.3 Treatment Components
A variety of water treatment sizings and processes are available for POE or POU applications.
There are a number of treatment units designed to deal with specific water quality issues, ranging from heavy metal contamination to more personal aesthetic issues such as taste, odour and colour. The most common treatment options are outlined in the table below.
Table 8.1 - Components of Household Treatment Systems
Component Description
Boiling Boiling is the lowest capital cost form of water treatment. Water that is boiled will destroy all biological (including Cryptosporidium oocysts and Giardia cysts) and remove most gaseous contaminants. Boiling is not effective for removing chemicals.
Home distillation Home distillation involves the boiling of water and collection of the water vapour. Contaminants such as bacteria, protozoa and viruses are inactivated by the heat from the boiling process. Other contaminants such as turbidity, metals and other soluble chemicals are retained, leaving pure water vapour to be collected and condensed. The water is left with a flat taste and is devoid of oxygen and minerals.
1 µm Cartridge Filters
Used for the removal of turbidity, Giardia and Cryptosporidium. Maintenance includes monitoring filter performance and changing cartridge filters as needed.
Granulated Activated Carbon (GAC) Cartridge Filters
Used for the removal of colour, taste, odour and disinfection by-products. This type of system is easy to install and maintain. Operating costs are usually limited to filter replacement. Their performance is sufficient for removing organic and inorganic contaminants, including tastes and odours as well as partial colour removal. Not effective at removing microorganisms. These types of filters have a limited lifespan and require the regular replacement of filters. Periods of non-use or not replacing filters when due may promote bacterial growth within the filter.
Contaminant-Specific Proprietary Cartridge Filters
A range of proprietary types of filter are available for removal of iron and manganese, chlorine, lead, arsenic, aluminium and other contaminants
UV Disinfection Used for the disinfection of bacteria and protozoa. Prefiltration is typically required to ensure that particulate matter does not shield microorganisms from the UV light. This system requires low turbidity and low colour water to be effective.
Green Sand Filtration Used for the removal of iron and manganese. This treatment is a form of ion exchange using sand impregnated with manganese.
Ultrafiltration and Microfiltration
Ultrafiltration is a form of membrane filtration with a nominal pore size of 0.01 µm. It is used for removal of bacteria, protozoa, turbidity and some viruses. Microfiltration is a form of membrane filtration with a nominal pore size of 0.1 µm. It is used for removal of bacteria, protozoa and turbidity. Cleaning (including backwashing) requirements for both types of membranes are dictated by the quality of the water being treated.
Reverse Osmosis Reverse osmosis is type of membrane filtration. It involves the high pressure (sufficient to overcome the osmotic gradient) passage of water

CH2M Beca // 20 May 2010 // Page 70
6515967 // NZ1-2528063-63 2.6
Component Description through a semi-permeable membrane. The membrane only allows water to pass through it, thus removing most dissolved and suspended material. It is not commonly used in NZ because of cost.
Centralised pre-treatment could be considered in tandem with POE/POU systems; e.g. chorine disinfection, 10 micron filtration. This can be used to reduce the amount of treatment required at each household and ensure a basic level of treatment is provided. Any pre-treatment needs to complement the household water treatment system and raw water quality to be effective.
8.3.1 Summary of Treatment Options
The following table summarises the various treatment options and the water quality parameters they target.
Table 8.2 - Summary of Household Treatment Options
Water Quality Parameter B
oilin
g
Hom
e D
istil
latio
n
1 µm
Car
trid
ge F
ilter
s G
AC
Car
trid
ge F
ilter
s
Con
tam
inan
t Spe
cific
C
artr
idge
Filt
ers
UV
Dis
infe
ctio
n
Gre
en S
and
Filte
r
Ultr
afilt
ratio
n
Rev
erse
Osm
osis
Bacteria Viruses
Protozoa Iron
Manganese
Lead
Aluminium
Colour
Taste
Odour
Disinfection Byproducts
Turbidity Chlorine
8.4 Advantages and Disadvantages of a Household Treatment System
There are a number of advantages and disadvantages to household treatment systems. They include:
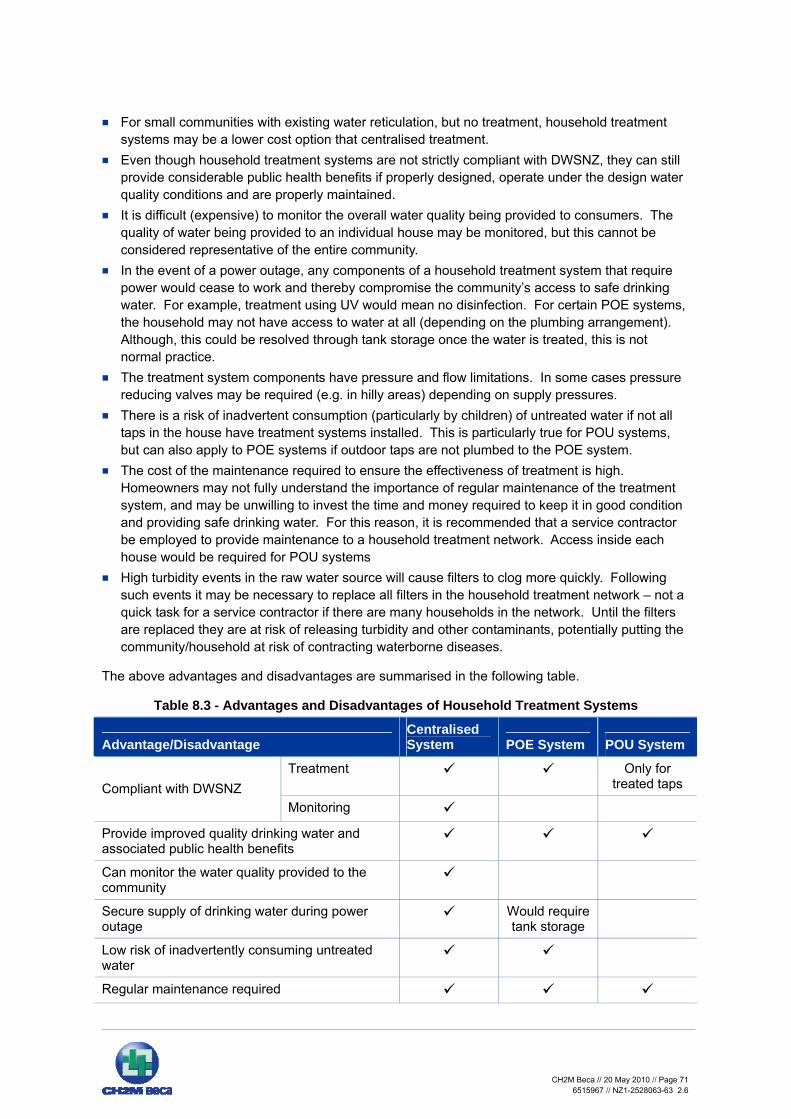
CH2M Beca // 20 May 2010 // Page 71
6515967 // NZ1-2528063-63 2.6
For small communities with existing water reticulation, but no treatment, household treatment systems may be a lower cost option that centralised treatment.
Even though household treatment systems are not strictly compliant with DWSNZ, they can still provide considerable public health benefits if properly designed, operate under the design water quality conditions and are properly maintained.
It is difficult (expensive) to monitor the overall water quality being provided to consumers. The quality of water being provided to an individual house may be monitored, but this cannot be considered representative of the entire community.
In the event of a power outage, any components of a household treatment system that require power would cease to work and thereby compromise the community’s access to safe drinking water. For example, treatment using UV would mean no disinfection. For certain POE systems, the household may not have access to water at all (depending on the plumbing arrangement). Although, this could be resolved through tank storage once the water is treated, this is not normal practice.
The treatment system components have pressure and flow limitations. In some cases pressure reducing valves may be required (e.g. in hilly areas) depending on supply pressures.
There is a risk of inadvertent consumption (particularly by children) of untreated water if not all taps in the house have treatment systems installed. This is particularly true for POU systems, but can also apply to POE systems if outdoor taps are not plumbed to the POE system.
The cost of the maintenance required to ensure the effectiveness of treatment is high. Homeowners may not fully understand the importance of regular maintenance of the treatment system, and may be unwilling to invest the time and money required to keep it in good condition and providing safe drinking water. For this reason, it is recommended that a service contractor be employed to provide maintenance to a household treatment network. Access inside each house would be required for POU systems
High turbidity events in the raw water source will cause filters to clog more quickly. Following such events it may be necessary to replace all filters in the household treatment network – not a quick task for a service contractor if there are many households in the network. Until the filters are replaced they are at risk of releasing turbidity and other contaminants, potentially putting the community/household at risk of contracting waterborne diseases.
The above advantages and disadvantages are summarised in the following table.
Table 8.3 - Advantages and Disadvantages of Household Treatment Systems
Advantage/Disadvantage Centralised System POE System POU System
Treatment Only for treated taps Compliant with DWSNZ
Monitoring
Provide improved quality drinking water and associated public health benefits
Can monitor the water quality provided to the community
Secure supply of drinking water during power outage
Would require tank storage
Low risk of inadvertently consuming untreated water
Regular maintenance required

CH2M Beca // 20 May 2010 // Page 72
6515967 // NZ1-2528063-63 2.6
Advantage/Disadvantage Centralised System POE System POU System
Treatment system sensitive to changes in raw water quality
Chance that pressure and flow restrictors required
Maintenance contractors require access to inside each household
8.5 Point-of-Entry Systems
8.5.1 System Set Up
The treatment unit would normally be situated where the water supply enters the house. The equipment requires its own housing to protect it from the weather and is preferably located outside so that maintenance can be carried out without requiring access to the house.
All sources of water within the house would provide water suitable for drinking.
Outside taps may be connected straight to the water main, and would thus provide untreated water. If large volumes of outdoor water are used this may be more economical.
In the event of a power cut, certain types of treatment systems will not be operational and the household may not have access to water (non-potable water may be available if outside taps are plumbed directly to mains water).
Note that no allowance has been made for inclusion of POE systems in a building’s compliance schedule (if in fact one is required).
8.5.2 Design Basis and Reference Costing
This section outlines the assumptions and assumed treatment system for a POE treatment system.
The typical household water use has been estimated from the water consumption of individual fixtures as per AS/NZS 3500:2003 (Plumbing and drainage Part 1: Water services.). This standard provides a method for sizing water service pipework (from flow rate calculations) based on water fixture loading units. The loading units are assigned to water fixtures based on the flow rate, length of time in use and frequency of use of the fixture.
The estimate of water fixtures in a ‘typical’ large household and the loading units assigned is provided in the table below.
Table 8.4 - Water use loading units for a 'typical' large household
Fixture No. of fixtures in household
Loading units per fixture Total loading units
W / C pan 2 2 4
Shower 1 4 4
Bath 1 8 8
Wash basin 2 1 2
Laundry tub 1 3 3
Washing machine 1 3 3
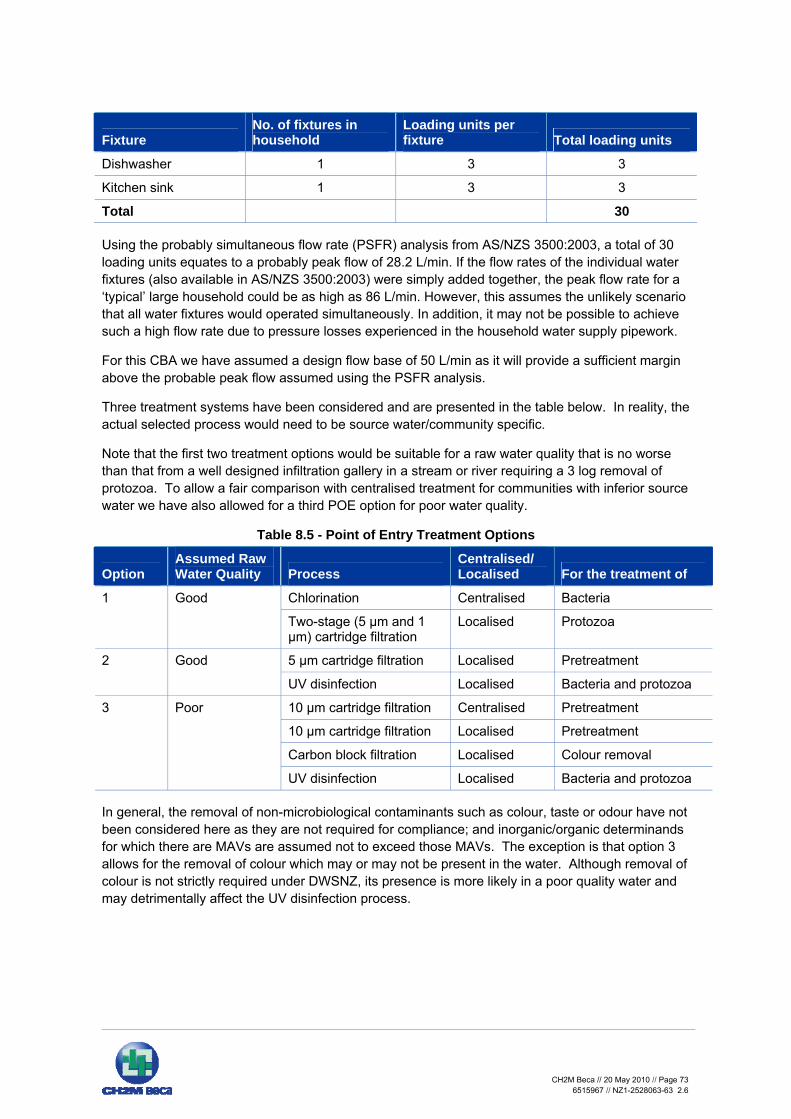
CH2M Beca // 20 May 2010 // Page 73
6515967 // NZ1-2528063-63 2.6
Fixture No. of fixtures in household
Loading units per fixture Total loading units
Dishwasher 1 3 3
Kitchen sink 1 3 3
Total 30
Using the probably simultaneous flow rate (PSFR) analysis from AS/NZS 3500:2003, a total of 30 loading units equates to a probably peak flow of 28.2 L/min. If the flow rates of the individual water fixtures (also available in AS/NZS 3500:2003) were simply added together, the peak flow rate for a ‘typical’ large household could be as high as 86 L/min. However, this assumes the unlikely scenario that all water fixtures would operated simultaneously. In addition, it may not be possible to achieve such a high flow rate due to pressure losses experienced in the household water supply pipework.
For this CBA we have assumed a design flow base of 50 L/min as it will provide a sufficient margin above the probable peak flow assumed using the PSFR analysis.
Three treatment systems have been considered and are presented in the table below. In reality, the actual selected process would need to be source water/community specific.
Note that the first two treatment options would be suitable for a raw water quality that is no worse than that from a well designed infiltration gallery in a stream or river requiring a 3 log removal of protozoa. To allow a fair comparison with centralised treatment for communities with inferior source water we have also allowed for a third POE option for poor water quality.
Table 8.5 - Point of Entry Treatment Options
Option Assumed Raw Water Quality Process
Centralised/ Localised For the treatment of
Chlorination Centralised Bacteria 1 Good
Two-stage (5 µm and 1 µm) cartridge filtration
Localised Protozoa
5 µm cartridge filtration Localised Pretreatment 2 Good
UV disinfection Localised Bacteria and protozoa
10 µm cartridge filtration Centralised Pretreatment
10 µm cartridge filtration Localised Pretreatment
Carbon block filtration Localised Colour removal
3 Poor
UV disinfection Localised Bacteria and protozoa
In general, the removal of non-microbiological contaminants such as colour, taste or odour have not been considered here as they are not required for compliance; and inorganic/organic determinands for which there are MAVs are assumed not to exceed those MAVs. The exception is that option 3 allows for the removal of colour which may or may not be present in the water. Although removal of colour is not strictly required under DWSNZ, its presence is more likely in a poor quality water and may detrimentally affect the UV disinfection process.

CH2M Beca // 20 May 2010 // Page 74
6515967 // NZ1-2528063-63 2.6
8.6 Point-of-Use Systems
8.6.1 System Set Up
Usually just one source in a household is fitted with a treatment system under a POU approach thus there is a need to clearly label taps as potable/non-potable. The source that is fitted with treatment must be used for all drinking water, food preparation and oral hygiene.
The risk of accidental consumption of untreated water is higher for POU systems than centralised or POE treatment systems.
The designs of POU systems are typically compact and a POU unit can fit in a cupboard under the sink for example.
8.6.2 Design Basis and Reference Costing
This section outlines the assumptions and assumed treatment system for a POU treatment system.
This system has been designed for treatment of microorganisms as per DWSNZ. It does not allow for removal of iron, manganese and aesthetic parameters such as colour and taste, which are not typically required for ‘compliance’.
The POU treatment system consists of the following for removal of bacteria and protozoa:
5 µm cartridge filtration UV disinfection
For costing purposes only one treatment system has been allowed for per household (i.e. only one tap will provide drinking water for the whole household).
UV disinfection units for POU systems provide a lower UV dose designed to meet protozoa requirements (16 mJ/cm2), but do not provide a dose that matches the bacterial requirements of DWSNZ (40 mJ/cm2). They are smaller as they only treat the flow to one tap. There is also a significantly higher risk of accidental consumption of untreated water as other taps in the house will not be treated.
Note that the above system would be suitable for a raw water quality that is no worse than that from a well designed infiltration gallery in a stream or river requiring a 3 log removal of protozoa. Source waters that have a quality that is inferior to this are unlikely to be suitable for household-based POU treatment, as most households would find the quality of water from the non-POU outlets (i.e. bathroom and laundry) unacceptable.
8.7 Cost Estimates
8.7.1 Capital Cost
The following table compares costs for POE and POU treatment systems. The basis of the cost estimate is covered in Sections 8.5 and 8.6. Costs are exclusive of GST.
It is assumed that household treatment systems would only really be viable for neighbourhood (25-100) or small (101-500) sized communities. The mean population for a neighbourhood sized community is 55 people and for small sized community it is 263.
Based on an average NZ occupancy rate of 2.7 people per household (from Statistics NZ Census 2006) this would give an average of 20 houses per neighbourhood sized community and 97 houses per small sized community.

CH2M Beca // 20 May 2010 // Page 75
6515967 // NZ1-2528063-63 2.6
Table 8.6 - Estimated Capital Cost for POE and POU treatment systems
Point of Entry
Option 1 Option 2 Option 3 Point of Use
Centralised pretreatment Chlorination30 - 10 µm CF31 -
Carbon block filter - - $270 -
Cartridge filtration $300
UV disinfection -$2,50032 $2,5003 $700
Plumbing33 $300 $300 $300 $300
Allowance for P&G (18%), and contingency (18%)
$200 $1,100 $1,200 $400
Total (per household) $800 $3,900 $4,300 $1,400
Centralised Pretreatment (neighbourhood)
$43,500 - $5,600 -
Total (per neighbourhood sized community)
$59,500 $78,000 $91,600 $28,000
Centralised Pretreatment (small)
$72,700 - $21,600 -
Total (per small sized community)
$150,300 $378,300 $438,700 $135,800
Of the three POE treatment options, Option 1 is by far the lowest cost. However, a community may consider that in this case, since centralised chlorination is required anyway, it may just be easier to set up an entirely centralised treatment system.
Option 3, which is nearly three times the price of Option 1 also requires centralised treatment, and considering the poor quality of the water and increased chance of microbial contamination, such a community may also consider that centralised treatment is more beneficial.
The POU system is low cost compared to the POE systems, especially for a neighbourhood sized community. However, the risks of only having one source of potable water per household need to be carefully considered when assessing this treatment option.
8.7.2 Operating Cost
30 The cost for centralised chlorination is based on the cost model and has not been broken down to a per household cost as it depends on the community size. It includes an allowance for P&G, engineering and contingency.
31 The cost for centralised pre-filtration (10 µm cartridge filters) is half the cost from the cost model (which assumes 2-stage filtration). It has not been broken down to a per household cost as it depends on the community size. It includes an allowance for P&G, engineering and contingency.
32 The normal retail cost of this system is more like $4,400. The cost in the table assumes an estimated bulk purchase cost, assuming a number of systems will be ordered at the same time.
33 The plumbing cost is based on a discounted rate, assuming that a number of houses are being plumbed at the same time. If a single house were to be plumbed the estimated cost would be $500.

CH2M Beca // 20 May 2010 // Page 76
6515967 // NZ1-2528063-63 2.6
The following table contains estimates of the operating costs for the POE and POU treatment. It includes a provisional cost to engage a service contractor to carry out the maintenance required (four visits per year).
Table 8.7 - Estimated Annual Operating Cost for POE and POU Treatment Systems
Point of Entry
Option 1 Option 2 Option 3 Point of Use
Centralised pretreatment Chlorination - 10 µm CF -
Carbon block filter30 - - $280 -
Cartridge filtration34 $440 $90 $100 $30
UV disinfection35 - $320 $320 $130
Maintenance36 $150 $150 $150 $150
Total (per household) $590 $560 $850 $310
Centralised Pretreatment (neighbourhood)
$50 - $10,350 -
Total (per neighbourhood sized community)
$11,900 $11,200 $27,400 $6,200
Centralised Pretreatment (small)
$230 - $20,900 -
Total (per small sized community)
$57,500 $54,300 $103,400 $30,100
Note that for POE Option 3, the high operating cost for the centralised cartridge filtration is largely due to the high level of operator time required to monitor and maintain the cartridge filters.
Although the operating costs have been estimated here, the issue of who will be paying them is not addressed. If a centralised system were to be introduced, the supplier would be responsible for maintenance, and the cost would be indirectly borne by the consumer. There is the opportunity under a POE/POU system for the cost to be solely and directly borne by the consumer, which may increase the risk that maintenance would be neglected and the treatment systems become ineffective.
8.7.3 Cost Comparison with Centralised Treatment
The following table compares the cost to upgrade a small or neighbourhood sized treatment plant to comply with DWSNZ against the cost for POE and POU systems. Note that the assumptions made with respect to the source water quality for POU systems (i.e. from a well-designed infiltration
34 Assume 3 month life for filter cartridges (including carbon block filters). Estimated filter life is 1 – 6 months depending on raw water quality. Therefore it is expected that filters will require replacement four times per year.
35 Assume UV lamp life of 1 years. Power costs are not included
36 Assume four 0.75 hour visits per year per household at $50/hour. Also assumes that all systems for that supply are serviced at the same time and a bulk rate applies.

CH2M Beca // 20 May 2010 // Page 77
6515967 // NZ1-2528063-63 2.6
gallery and a 3-log protozoa requirement) mean that the health outcomes are not comparable for all systems.
The centralised treatment costs are taken from the cost model matrix and are given as range, as the upgrading cost will be dependent on what existing treatment is present at each plant. The cost for household treatment systems largely does not depend on the existing treatment processes.
These costs all include percentage margins for P&G, design and contingency.
Table 8.8 - Cost Comparison of Household vs. Centralised Treatment Systems
Capital Cost
Annual Operating Cost Capital Cost
Annual Operating Cost
Community Size Small Neighbourhood
Population 101-500 <100
Number of Households 97 20
Min $200,000 $4,000 $120,000 $4,000Centralised System
Max $560,000 $26,000 $330,000 $15,000
Option 1 $150,000 $58,000 $60,000 $12,000
Option 2 $380,000 $54,000 $80,000 $11,000Point of Entry
Option 3 $440,000 $104,000 $90,000 $27,000
Point of Use $140,000 $30,000 $30,000 $6,000
For the purposes of comparing the costs between household and centralised water treatment we have excluded secure groundwater from the centralised system cost range as they only apply to four out of 427 water treatment plants in the small and neighbourhood population categories considered in the cost model.
Note that the minimum and maximum operating costs given in the table indicate the range of costs for that size of WTP, and do not necessarily relate to each other i.e. the centralised system with the lowest capital cost does not necessarily also have the lowest operating cost.
For both small and neighbourhood-sized communities, the capital costs for POE and centralised treatment systems are comparable. POE option 1 has a slightly lower capital cost than the centralised options, but requires centralised chlorination anyway. Options 2 and 3 fall within the range of costs for centralised treatment. However, the operating costs for POE are significantly higher than centralised treatment options. Considering the benefits associated with centralised treatment over household treatment, these figures would suggest that for a small-sized community, household treatment does not provide any cost advantages over centralised treatment.
POU systems have significantly lower capital costs (but higher operating costs) than centralised treatment options. Caution should be exercised when comparing these costs directly, as the systems are not being compared like for like. For example, POU UV disinfection systems provide a lower UV dose designed to meet protozoa requirements, but do not provide a dose that matches the bacterial requirements of DWSNZ.
The 2006 Department of Building and Housing “Building for the 21st Century - Report on the Review of the Building Code” proposed the following:

CH2M Beca // 20 May 2010 // Page 78
6515967 // NZ1-2528063-63 2.6
Water supplied at outlets of fixtures (including laundry tubs) and appliances intended for human consumption, utensil washing, food preparation, oral hygiene and personal washing meet the health quality requirements of the DWSNZ.
Should this recommendation be adopted, at least three POU units would be required in each household and the costs to provide a POU type system will be much greater than stated here and likely to be uneconomic compared with POE systems.
CH2M Beca // 20 May 2010 // Page 79
6515967 // NZ1-2528063-63 2.6
9 Class 2 Water Carriers
9.1 Introduction
Under the Health Act a water carrier is anyone that supplies raw or drinking water by a vehicle (or by any other means than by networked pipelines). Tankered water carriers are covered by Section 11 of the DWSNZ.
All water carriers that supply drinking water must be on the Register of Community Drinking Water Supplies and Suppliers. The customer must be advised of the source and class of water being delivered by the carrier. Tankered water is split into the following classes:
Class 1(a) – taken from a reticulated water supply that complies with DWSNZ. Class 1(b) – taken from an independent supply that has been approved by a Drinking Water
Assessor (DWA) as being compliant with DWSNZ. Class 2 – Is water for drinking purposes that is not Class 1, but has been approved by a DWA.
Obviously there are likely to be increased health risks associated with consumption of Class 2 drinking water. Consumers may mitigate this risk by having point of entry/use treatment systems in place on their properties.
The following section explores the additional cost required for all water carriers that currently deliver Class 2 water to upgrade to Class 1 water. The additional costs are associated with:
Increased distance to travel to a Class 1 water source Increased purchase cost for Class 1 water over Class 2 water
9.2 Survey
Currently, there are 19 water carriers that are registered as supplying Class 2 drinking water throughout New Zealand. An assessment has been completed to identify the additional transport cost that would be incurred if Class 1 water only was to be supplied.
A phone survey was completed of the registered Class 2 water carriers to answer the key questions of:
The current distance travelled to Class 2 water source The typical number of trips completed in a year The nearest Class 1 water source to the carrier
This information was used to estimate the additional transport cost that would be incurred if the water carriers were to source their water from a Class 1 supply.
9.3 Outcome of survey
The telephone survey had limited success, due to unwillingness of some carriers to participate or inability to make contact with the company. In all, six telephone surveys were completed and provide the base assumptions for this assessment. Two of the surveys completed were for Waiheke Island water carriers.
Where the physical location of the water carrier could be ascertained (13 of 19), the distance to the nearest Class 1 supply was identified through maps and using the Class 1 water carriers register.
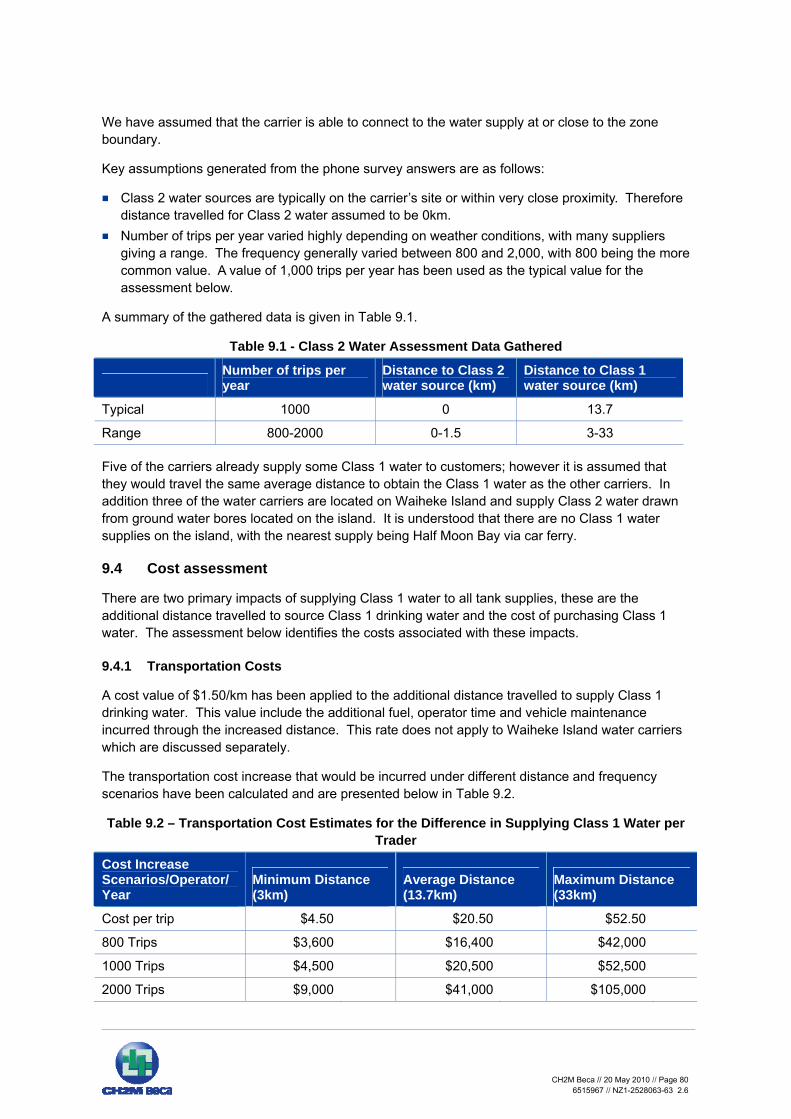
CH2M Beca // 20 May 2010 // Page 80
6515967 // NZ1-2528063-63 2.6
We have assumed that the carrier is able to connect to the water supply at or close to the zone boundary.
Key assumptions generated from the phone survey answers are as follows:
Class 2 water sources are typically on the carrier’s site or within very close proximity. Therefore distance travelled for Class 2 water assumed to be 0km.
Number of trips per year varied highly depending on weather conditions, with many suppliers giving a range. The frequency generally varied between 800 and 2,000, with 800 being the more common value. A value of 1,000 trips per year has been used as the typical value for the assessment below.
A summary of the gathered data is given in Table 9.1.
Table 9.1 - Class 2 Water Assessment Data Gathered
Number of trips per year
Distance to Class 2 water source (km)
Distance to Class 1 water source (km)
Typical 1000 0 13.7
Range 800-2000 0-1.5 3-33
Five of the carriers already supply some Class 1 water to customers; however it is assumed that they would travel the same average distance to obtain the Class 1 water as the other carriers. In addition three of the water carriers are located on Waiheke Island and supply Class 2 water drawn from ground water bores located on the island. It is understood that there are no Class 1 water supplies on the island, with the nearest supply being Half Moon Bay via car ferry.
9.4 Cost assessment
There are two primary impacts of supplying Class 1 water to all tank supplies, these are the additional distance travelled to source Class 1 drinking water and the cost of purchasing Class 1 water. The assessment below identifies the costs associated with these impacts.
9.4.1 Transportation Costs
A cost value of $1.50/km has been applied to the additional distance travelled to supply Class 1 drinking water. This value include the additional fuel, operator time and vehicle maintenance incurred through the increased distance. This rate does not apply to Waiheke Island water carriers which are discussed separately.
The transportation cost increase that would be incurred under different distance and frequency scenarios have been calculated and are presented below in Table 9.2.
Table 9.2 – Transportation Cost Estimates for the Difference in Supplying Class 1 Water per Trader
Cost Increase Scenarios/Operator/ Year
Minimum Distance (3km)
Average Distance (13.7km)
Maximum Distance (33km)
Cost per trip $4.50 $20.50 $52.50
800 Trips $3,600 $16,400 $42,000
1000 Trips $4,500 $20,500 $52,500
2000 Trips $9,000 $41,000 $105,000

CH2M Beca // 20 May 2010 // Page 81
6515967 // NZ1-2528063-63 2.6
Excluding the Waiheke Island traders, the estimated annual transportation cost of providing Class 1 water is $333,000. This assumes 1,000 trips per trader, an average of 13.7 additional kilometres per trip and 16 traders.
For the Waiheke Island traders, the cost of a return trip on the freight ferry operating between Waiheke Island and Half Moon Bay is $31737 for a 10m long vehicle and driver. Assuming that 1,000 trips are made per year per trader, an estimate of the transport cost to provide Class 1 water to Waiheke Island is $317,000 per year per trader. Although it is likely to be more economic for the carriers to treat their existing Class 2 source(s), we have not developed a cost estimate for this as we have no knowledge of the raw water quality or their source(s).
9.4.2 Water Purchasing Costs
As the water carriers typically supply from an on-site water source, it has been assumed that there is minimal cost in sourcing this water. Supplying Class 1 water will require purchasing water from the nearest Class 1 supplier which will add an additional cost to each delivery.
It has been assumed that each tanker delivers 7 m3 water per trip (tankers are usually between 5 -10 m3).
Several local government websites were reviewed for cost data for supplying water tankers. Prices reviewed ranged from $1.562/m3 in large city supplies to $3.24/m3 in smaller rural supply areas. The average charge rate across those assessed was $2.15/m³ and this figure has been used within this analysis. Table 9.3 gives an estimate for the cost of purchasing Class 1 water.
Table 9.3 - Water Purchasing Cost Estimates for Supplying Class 1 Water
Water Purchasing Cost (7 m3)
Cost per trip $15.00
Annual Cost (800 trips) $12,000
Annual Cost (1,000 trips) $15,000
Annual Cost (2,000 trips) $30,000
9.4.3 Estimated Total Additional Costs
Table 9.4 shows the total additional cost of supplying Class 1 drinking water in place of Class 2 water. These are based on the average calculated distance to Class 1 supply, 1,000 assumed trips per year and average cost for purchasing Class 1 water.
Table 9.4 - Total Additional Cost Estimate for Supplying Class 1 Water
Transport Cost Water purchase cost Total additional cost
Annual cost/trader (excl. Waiheke Island)
$21,000 $15,000 $36,000
Annual cost/trader (Waiheke Island)`
$317,000 $15,000 $332,000
Total cost (19 traders) $1,290,000 $290,000 $1,570,000
37 This cost is based on an approximate15% discount on the standard fare based on the use of multi-trip tickets. If a supplier was actually to provide Class 1 drinking water from Half Moon Bay, it is likely they could negotiate with the ferry company to achieve a further saving on the standard fare.
CH2M Beca // 20 May 2010 // Page 82
6515967 // NZ1-2528063-63 2.6
10 Conclusion
A telephone survey was conducted with all of the non-compliant large WTP asset managers to determine expected costs to comply with the DWSNZ.
A cost model was developed for the medium through to neighbourhood population categories and used to determine estimates of probable capital and operating costs to comply with just the bacterial requirements and the combined bacterial and protozoal requirements of the DWSNZ.
Twelve case study WTPs were selected from the medium to neighbourhood population categories and used to test the reasonableness of the assumptions and costs derived from the cost model and to provide a basis for cost model adjustments if deemed to be required.
The number of WTPs with transgressions above the Chemical MAV for P2 Determinands was determined and the cost model used to derive an estimate of probable cost to achieve compliance.
The overall cost, across all population size categories is summarised below.
The estimate of probable cost to comply with the bacterial Standards is $76 million ± $23 million with an annual operating cost estimated at $5.0 million.
The estimate of probable cost to comply with the bacterial and protozoa Standards is $337 million ± $86 million with an annual operating cost of $12.6 million.
The estimate of probable cost to comply with the Chemical MAV limits (note this different to the P2 limits defined in the Standard) is $5.2 million.
The sensitivity analysis identified that significant cost savings could be made if the peak design demands were reduced. These savings would have to be offset against the cost of implementing new legislation or initiatives aimed at water conservation and efficiency.
Cost estimates for point-of-entry and point-of-use systems were derived for both the small and neighbourhood population categories and compared with centralised treatment. Point-of-use is not recommended as it carries an inherently high risk of inadvertent consumption of untreated water. Point-of-entry system were comparable in cost with centralised treatment for the small population category but were shown to be cost competitive for neighbourhood sized supplies especially in combination with some centralised pre-treatment. The annual operating costs however are significantly higher.
The additional cost for water carriers to deliver Class 1 water was estimated at $36,000 per trader per year, $390,000 per year for traders on Waiheke Island, and at a total cost of $1.6 million per year.

Appendix A
Source and Treatment Matrix

Design Treatment Table -Medium
E.Coli Proto
WTP's shifted from:
NOTES1 Lake Terrace has been removed from this population category (compliance = YN, assumed low water quality (3)). It should rightfully be in the large population category2 Camerons has been added to this population category (compliance = YN, assumed high quality water (S)) from small 3 Te Ngawhai has been added to this population category (compliance = TNN, assumed high quality water (S)) from minor4 Waitohi has been added to this population category (compliance = NN, assumed high quality water (S)) from minor5 Peraki St has been removed from this population category (compliance = NN high quality water) and added to large due to population discrepency6 Darnley Square has been removed from this population category (compliance = TNN, secure groundwtaer) and added to large due to population discrepency
E.Coli Proto
WTP's shifted from:
Add coagulation/direct filtration. Increase monitoring (weekly)1 Tech non-
compNon-
comply Chlorination system
Non-comply
Non-comply
2 Tech non-comp
Non-comply
Total # Plants 28
1 Non-comply
Non-comply No treatment Add coagulation/direct filtration and chlorination
Add coagulation/direct filtration. Assume that for 50% of the plants that source water turbidity and UVT are low enough to only require 5µm cartridge filtration and UV treatment. Retain existing chlorination (assume doesn't require SCAN)
1 Comply Chlorination systemNon-comply
5 Non-comply
Non-comply No treatment Add coagulation/direct filtration and chlorination
Chlorination system
Chlorination system
Add coagulation/direct filtration9 Comply
Add coagulation/direct filtration. Increase monitoring (twice weekly)
Non-comply
Non-comply
Coagulation/direct filtration and chlorination
Add clarifier and UV system, improve coagulation and filtration and install additional turbidity monitoring 1
Tech non-comp
Non-comply
Coagulation/sedimentation/filtration and chlorination
Add UV system, improve coagulation and sedimentation and install additional turbidity monitoring . Increase monitoring (twice weekly).
1
Coagulation/sedimentation/filtration and chlorination
Add UV system, improve coagulation and sedimentation and install additional turbidity monitoring and filter to waste
6 Comply Non-comply
Coagulation/sedimentation/filtration and chlorination
Add UV system, improve coagulation and sedimentation and install additional turbidity monitoring
Ver
y lo
w q
ualit
y w
ater
(5 lo
g)
Low
qua
lity
wat
er (4
log)
Hig
h qu
ality
w
ater
(3 lo
g)
Sec
ure
grou
ndw
ater
Medium (5,001 - 10,000) Design flow mid-point
8,280 m³/day 2 Comply Non-comply
Small
OPE
X
Population Category
Small
CA
PEX
Minor
Minor
Medium (5,001 - 10,000) Design flow mid-point
8,280 m³/day
Add UV system, improve coagulation and sedimentation and install additional turbidity monitoring. Increase monitoring (twice weekly).
Add clarifier and UV system, improve coagulation and filtration and install additional turbidity monitoring
Non-comply
Non-comply
Non-comply
Tech non-comp
Non-comply
Total # Plants 28
1
Add coagulation/direct filtration
Add coagulation/direct filtration. Increase monitoring (twice weekly)
Chlorination system
No treatment Add coagulation/direct filtration and chlorination
Chlorination system
9
Non-comply
Comply Non-comply
Coagulation/direct filtration and chlorination
Add UV system, improve coagulation and sedimentation and install additional turbidity monitoring
Coagulation/sedimentation/filtration and chlorination
Coagulation/sedimentation/filtration and chlorination
2
Non-comply
Comply
Tech non-comp
Non-comply
Comply
Sec
ure
grou
ndw
ater
Non-comply
Add UV system, improve coagulation and sedimentation and install additional turbidity monitoring and filter to waste
Coagulation/sedimentation/filtration and chlorination
2
5
1
6
1V
ery
low
qua
lity
wat
er (5
log)
Low
qua
lity
wat
er
(4 lo
g)
Upgrading RequiredPopulation CategoryCompliance
AchievedAssumed Existing
Treatment
Source
Hig
h qu
ality
wat
er
(3 lo
g)
Source
Compliance Achieved Assumed Existing
Treatment Upgrading Required
Add coagulation/direct filtration. Increase monitoring (weekly)
Non-comply
Non-comply
Non-comply
Chlorination system
Add coagulation/direct filtration. Assume that for 50% of the plants that source water turbidity and UVT are low enough to only require 5µm cartridge filtration and UV treatment. Retain existing chlorination (assume doesn't require SCAN)
No treatment Add coagulation/direct filtration and chlorination
Chlorination systemTech non-comp
1
1
Comply
NZ1-2486104-DWSNZ Source and Treatment Matrix (3).xls

Design Treatment Table - Minor
E.Coli Proto
NOTES1 Te Ngawhai has been removed from this population category (compliance = TNN, assumed high quality water (S)) and put in medium2 Waitohi has been removed from this population category (compliance = NN, assumed high quality water (S)) and put in medium
E.Coli Proto
Population CategoryCompliance
Achieved Assumed Existing Treatment
Source
Hig
h qu
ality
wat
er (3
lo
g)
Upgrading Required
Very
low
qua
lity
wat
er (5
log)
Low
qua
lity
wat
er (4
lo
g)
Total # Plants 193
Secu
re g
roun
dwat
er
Comply Non-comply
Non-comply
Non-comply
ComplyNon-comply
Non-comply
26
Tech non-comp
Non-comply
Non-comply
Coagulation/sedimentation/filtration and chlorination
Coagulation/sedimentation/filtration and chlorination
Non-comply
Non-comply Chlorination system
Non-comply
Coagulation/direct filtration and chlorination
Tech non-comp
Comply
Non-comply
Tech non-comp
No treatment Remedial work on well and/or wellhead
Add coagulation/direct filtration . Increase monitoring (weekly)
Coagulation/sedimentation/filtration and chlorination
Coagulation/sedimentation/filtration and chlorination
Add UV system, improve coagulation and sedimentation and install additional turbidity monitoring and filter to waste. Increase monitoring (weekly)
Add UV system, improve coagulation and sedimentation and install additional turbidity monitoring and filter to waste
Remedial work on well and/or wellhead. Increase monitoring (monthly)
No treatment Add coagulation/direct filtration and chlorination
4
3
42
11
Non-comply No treatment
1
Tech non-comp
1
Add UV system, improve coagulation and sedimentation and install additional turbidity monitoring and filter to waste
Non-comply
Add clarifier and UV system, improve coagulation and filtration and install additional turbidity monitoring
Non-comply
Add UV system, improve coagulation and sedimentation and install additional turbidity monitoring
Add UV system, improve coagulation and sedimentation and install additional turbidity monitoring. Increase monitoring (weekly)
Coagulation/sedimentation/filtration and chlorination
11
15
21
Comply Chlorination system Add coagulation/direct filtration
Minor (501 - 5,000) Design flow mid-point
2,460 m³/day
58
Population Category
Source
Compliance Achieved Assumed Existing
Treatment Upgrading Required
Add UV system, improve coagulation and sedimentation and install additional turbidity monitoring and filter to waste (assume 50% of plants require SCAN)
Very
low
qu
ality
wat
er (5
lo
g)Lo
w q
ualit
y w
ater
(4 lo
g)
Hig
h qu
ality
w
ater
(3 lo
g)
Secu
re
grou
ndw
ater
Comply Non-comply
Coagulation/sedimentation/filtration and chlorination
Minor (501 - 5,000) Design flow mid-point
2,460 m³/day 11
3
42
Tech non-comp
Add UV system, improve coagulation and sedimentation and install additional turbidity monitoring and filter to waste Increase monitoring (weekly)
Non-comply
Non-comply
Coagulation/sedimentation/filtration and chlorination
Add UV system, improve coagulation and sedimentation and install additional turbidity monitoring and filter to waste.
Non-comply
Coagulation/sedimentation/filtration and chlorination
Coagulation/sedimentation/filtration and chlorination
Add UV system, improve coagulation and sedimentation and install additional turbidity monitoring. Increase monitoring (weekly)
Comply Non-comply
Coagulation/sedimentation/filtration and chlorination
Add UV system, improve coagulation and sedimentation and install additional turbidity monitoring
Tech non-comp
Non-comply
Coagulation/direct filtration and chlorination
Add clarifier and UV system, improve coagulation and filtration and install additional turbidity monitoring 15
11
Comply Non-comply
Non-comply
Non-comply
58
Chlorination system Add coagulation/direct filtration . Increase monitoring (weekly)
Chlorination system Add coagulation/direct filtration
26 Non-comply
Non-comply
21
Total # Plants 193
1
1 Non-comply Comply No treatment Remedial work on well and/or wellhead
No treatment Add coagulation/direct filtration and chlorination
Tech non-comp
Non-comply
CA
PEX
OPE
X
4
Tech non-comp
Non-comply No treatment Remedial work on well and/or wellhead. Increase
monitoring (monthly)
NZ1-2486104-DWSNZ Source and Treatment Matrix (3).xls

Design Treatment Table - Small
E.Coli Proto
WTPs shifted from:
NOTES1 Omanaia has been added to this population category (compliance = NN, assumed high quality water (S)) from neighbourhood 2 Kekerengu has been added to this population category (compliance = NN, assumed high quality water (S)) from neighbourhood 3 Colville Town has been added to this population category (compliance = NN, assumed high quality water (S)) from neighbourhood 4 Te Rerenga has been added to this population category (compliance = NN, assumed high quality water (S)) from neighbourhood 5 Camerons has been removed from this population category (compliance = YN, assumed high quality water (S)) and put in medium
E.Coli Proto
WTPs shifted from:
Add sedimentation step, improve coagulation and instrumentation, add filter to waste and UV system Comply
Neighbourhood
Small (101 - 500) Design flow mid-point
312 m³/day
4 Non-comply
Non-comply
Infiltration gallery, coagulation/direct filtration and chlorination
OPE
X
Population Category
No treatment
Total # Plants 237
No treatment
CA
PEX
Small (101 - 500) Design flow mid-point
312 m³/day
Neighbourhood
Non-comply
ComplyTech non-comp
1
Non-comply
Infiltration gallery, coagulation/direct filtration and chlorination
Infiltration gallery, coagulation/direct filtration and chlorination
Infiltration gallery and chlorination
Add coagulation/direct filtration. Assume that for 50% of the plants that source water turbidity and UVT are low enough to only require 5µm cartridge filtration and UV treatment. Retain existing chlorination (assume doesn't require SCAN)Add coagulation/direct filtration. Assume that for 50% of the plants that source water turbidity and UVT are low enough to only require 5µm cartridge filtration and UV treatment. Retain existing chlorination (assume doesn't require SCAN). Increase monitoring (quarterly)
No treatment
Add coagulation/direct filtration and chlorination. Assume that for 50% of the plants that source water turbidity and UVT are low enough to only require 5µm cartridge filtration and UV treatment (assume doesn't require SCAN).
10
75
80
Tech non-comp Chlorination system
Non-comply Chlorination system
Non-comply
Comply
Install coagulation/sedimentation/filtration process and UV Non-comply
Non-comply
Infiltration gallery, coagulation/direct filtration and chlorination
1
8 Comply
Add sedimentation step, improve coagulation and instrumentation, add filter to waste and UV system. Increase monitoring (quarterly)
Infiltration gallery, coagulation/direct filtration and chlorination
Add sedimentation step, improve coagulation and instrumentation, add filter to waste and UV system
7
Non-comply
Non-comply
Tech non-comp
Add sedimentation step, improve coagulation and instrumentation, add new UV system
Non-comply
Install coagulation/sedimentation/filtration process (incl. filter to waste), and UV
Infiltration gallery and chlorination
Remedial work on well and/or wellhead. Increase monitoring (quarterly)
Comply
Add sedimentation step, improve coagulation and instrumentation, add new UV system. Increase monitoring (quarterly)
4
21
26
Hig
h qu
ality
wat
er
(3 lo
g)
Tech non-comp
Sec
ure
grou
ndw
ater
Non-comply
Non-comply
Non-comply
Upgrading RequiredPopulation CategoryCompliance
Achieved Assumed Existing Treatment
Source
Ver
y lo
w q
ualit
y w
ater
(5 lo
g)
Low
qua
lity
wat
er
(4 lo
g)
Source
Compliance Achieved Assumed Existing
Treatment
Ver
y lo
w q
ualit
y w
ater
(5 lo
g)
Low
qua
lity
wat
er (4
log)
Hig
h qu
ality
w
ater
(3 lo
g)
Sec
ure
grou
ndw
ater
Upgrading Required
8
1
26
7
Infiltration gallery, coagulation/direct filtration and chlorination
Tech non-comp
Non-comply
Infiltration gallery, coagulation/direct filtration and chlorination
Add sedimentation step, improve coagulation and instrumentation, add filter to waste and UV system. Increase monitoring (quarterly)
Non-comply
Non-comply
Infiltration gallery and chlorination
Install coagulation/sedimentation/filtration process (incl. filter to waste), and UV
Add sedimentation step, improve coagulation and instrumentation, add new UV system
4 Tech non-comp
Non-comply
Infiltration gallery, coagulation/direct filtration and chlorination
Add sedimentation step, improve coagulation and instrumentation, add new UV system. Increase monitoring (quarterly)
21
Add coagulation/direct filtration. Assume that for 50% of the plants that source water turbidity and UVT are low enough to only require 5µm cartridge filtration and UV treatment. Retain existing chlorination (assume doesn't require SCAN). Increase monitoring (quarterly)
10 Tech non-comp
Non-comply Chlorination system
4 Non-comply
Non-comply No treatment
Non-comply
Non-comply
Comply Non-comply
80
Add coagulation/direct filtration and chlorination. Assume that for 50% of the plants that source water turbidity and UVT are low enough to only require 5µm cartridge filtration and UV treatment.
Tech non-comp
No treatment
Add coagulation/direct filtration and chlorination. Assume that for 50% of the plants that source water turbidity and UVT are low enough to only require 5µm cartridge filtration and UV treatment (assume doesn't require SCAN).
75 Non-comply
Non-comply
237
Comply No treatment Remedial work on well and/or wellhead. Increase monitoring (quarterly)
1
Add coagulation/direct filtration and chlorination. Assume that for 50% of the plants that source water turbidity and UVT are low enough to only require 5µm cartridge filtration and UV treatment.
Non-comply
Total # Plants
Comply Non-comply Chlorination system
Add coagulation/direct filtration. Assume that for 50% of the plants that source water turbidity and UVT are low enough to only require 5µm cartridge filtration and UV treatment. Retain existing chlorination (assume doesn't require SCAN)
Infiltration gallery and chlorination Install coagulation/sedimentation/filtration process and UV
NZ1-2486104-DWSNZ Source and Treatment Matrix (3).xls
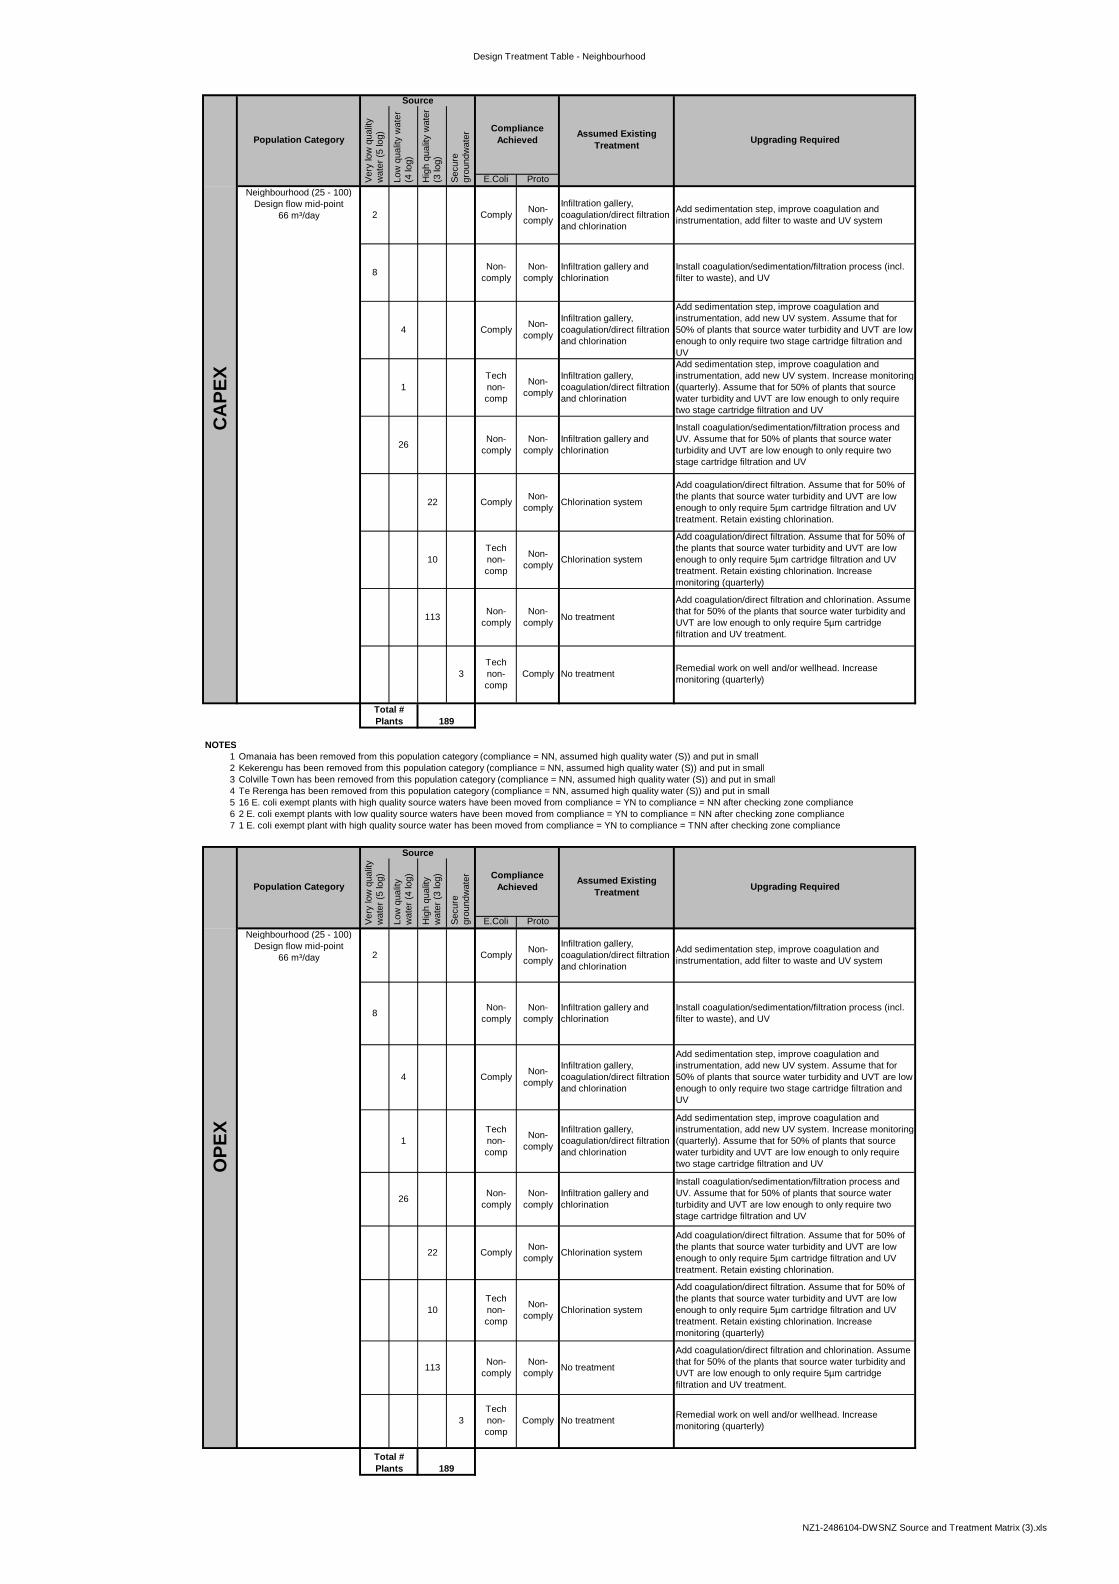
Design Treatment Table - Neighbourhood
E.Coli Proto
NOTES1 Omanaia has been removed from this population category (compliance = NN, assumed high quality water (S)) and put in small2 Kekerengu has been removed from this population category (compliance = NN, assumed high quality water (S)) and put in small3 Colville Town has been removed from this population category (compliance = NN, assumed high quality water (S)) and put in small4 Te Rerenga has been removed from this population category (compliance = NN, assumed high quality water (S)) and put in small5 16 E. coli exempt plants with high quality source waters have been moved from compliance = YN to compliance = NN after checking zone compliance6 2 E. coli exempt plants with low quality source waters have been moved from compliance = YN to compliance = NN after checking zone compliance7 1 E. coli exempt plant with high quality source water has been moved from compliance = YN to compliance = TNN after checking zone compliance
E.Coli Proto
Non-comply
Non-comply
Add sedimentation step, improve coagulation and instrumentation, add new UV system. Assume that for 50% of plants that source water turbidity and UVT are low enough to only require two stage cartridge filtration and UV
Add sedimentation step, improve coagulation and instrumentation, add new UV system. Increase monitoring (quarterly). Assume that for 50% of plants that source water turbidity and UVT are low enough to only require two stage cartridge filtration and UV
Install coagulation/sedimentation/filtration process and UV. Assume that for 50% of plants that source water turbidity and UVT are low enough to only require two stage cartridge filtration and UV
Infiltration gallery and chlorination
Infiltration gallery, coagulation/direct filtration and chlorination
Comply Non-comply Chlorination system
Total # Plants 189
3 Remedial work on well and/or wellhead. Increase monitoring (quarterly)
No treatment
Add coagulation/direct filtration and chlorination. Assume that for 50% of the plants that source water turbidity and UVT are low enough to only require 5µm cartridge filtration and UV treatment.
OPE
X
113
Tech non-comp
Infiltration gallery, coagulation/direct filtration and chlorination
Tech non-comp
Comply
Add coagulation/direct filtration. Assume that for 50% of the plants that source water turbidity and UVT are low enough to only require 5µm cartridge filtration and UV treatment. Retain existing chlorination. Increase monitoring (quarterly)
10 Non-comply Chlorination system
No treatment
Add coagulation/direct filtration. Assume that for 50% of the plants that source water turbidity and UVT are low enough to only require 5µm cartridge filtration and UV treatment. Retain existing chlorination.
22
26 Non-comply
Non-comply
Tech non-comp
Non-comply
Neighbourhood (25 - 100) Design flow mid-point
66 m³/day
4
1
2
Population CategoryCompliance
Achieved Assumed Existing Treatment
Source
Hig
h qu
ality
wat
er
(3 lo
g)
Very
low
qua
lity
wat
er (5
log) Upgrading Required
Comply
Low
qua
lity
wat
er
(4 lo
g)
Non-comply
Secu
re
grou
ndw
ater
Non-comply
Total # Plants 189
1
8
Infiltration gallery, coagulation/direct filtration and chlorination
Install coagulation/sedimentation/filtration process and UV. Assume that for 50% of plants that source water turbidity and UVT are low enough to only require two stage cartridge filtration and UV
Chlorination system
2
Install coagulation/sedimentation/filtration process (incl. filter to waste), and UV
Non-comply
Infiltration gallery and chlorination
Infiltration gallery, coagulation/direct filtration and chlorination
Non-comply
Add sedimentation step, improve coagulation and instrumentation, add filter to waste and UV system
Comply
Tech non-comp
Comply
Non-comply
Tech non-comp
Tech non-comp
Non-comply
Non-comply
26
22
10
113
3
No treatment
Add coagulation/direct filtration and chlorination. Assume that for 50% of the plants that source water turbidity and UVT are low enough to only require 5µm cartridge filtration and UV treatment.
No treatment Remedial work on well and/or wellhead. Increase monitoring (quarterly)
Add coagulation/direct filtration. Assume that for 50% of the plants that source water turbidity and UVT are low enough to only require 5µm cartridge filtration and UV treatment. Retain existing chlorination.
Infiltration gallery and chlorination
Chlorination system
Add coagulation/direct filtration. Assume that for 50% of the plants that source water turbidity and UVT are low enough to only require 5µm cartridge filtration and UV treatment. Retain existing chlorination. Increase monitoring (quarterly)
Neighbourhood (25 - 100) Design flow mid-point
66 m³/day
Population Category
Source
Compliance Achieved Assumed Existing
Treatment
Very
low
qua
lity
wat
er (5
log)
Low
qua
lity
wat
er (4
log)
Hig
h qu
ality
w
ater
(3 lo
g)
Secu
re
grou
ndw
ater
Upgrading Required
Add sedimentation step, improve coagulation and instrumentation, add filter to waste and UV system Comply Non-
comply
Infiltration gallery, coagulation/direct filtration and chlorination
8 Install coagulation/sedimentation/filtration process (incl. filter to waste), and UV
Infiltration gallery and chlorination
Comply Non-comply
Non-comply
Non-comply
Add sedimentation step, improve coagulation and instrumentation, add new UV system. Assume that for 50% of plants that source water turbidity and UVT are low enough to only require two stage cartridge filtration and UV
Comply Non-comply
Non-comply
Non-comply
Add sedimentation step, improve coagulation and instrumentation, add new UV system. Increase monitoring (quarterly). Assume that for 50% of plants that source water turbidity and UVT are low enough to only require two stage cartridge filtration and UV
Non-comply
CA
PEX
4Infiltration gallery, coagulation/direct filtration and chlorination
NZ1-2486104-DWSNZ Source and Treatment Matrix (3).xls

Appendix B
Large WTP Compliance

Annual Survey 2007/08: Treatment plants serving 10,000 or more people that do not comply for Protozoa or EColi Costs for Bacterial & Protozoa Compliance Data received from B. Mattingley at ESR, 29/10/09 Shaded squares indicate that that the WTP has already undergone upgrading for compliance, in the process of upgrading or is about to be decomissioned. As funding is already comitted for these plants, no cost has been assigned to them.
WTP No. PlantName Plant
CodePlant Pop*
Ecoli Comply
Protozoa Comply ZoneName Terratorial Local
Authority Reason for non compliance Upgrade description Log reduction required Current Status of Implementation Council reported Costs to implement Beca Costs to implement Capital Cost ($mill) Operating Cost ($K)
1 NW CHCH TP00181 83000 Y N Northwest Christchurch
Christchurch City Council
Non-secure groundwater sources, with no protozoa treatment
Some sites to have UV disinfection installed, others to have non-secure bores replaced with deeper, secure groundwater sources
3 To be upgraded in 2012 Initial cost estimate is $9.5 million - $ 9.5 $ 80.0
2 Utuhina TP00288 42500 N N Rotorua City Rotorua District Council
No monitoring attempted due to infrequent WTP use (ie <2 weeks per year) [ESR]. RDC: E coli because of gaps in data, protozoa because source not secure.
Addition of UV 3 Installed and being commissioned (Dec 09). N/A N/A $ - $ -
3 Waingake TP00174 N Y Gisborne City Insufficient FAC. GDC: Sampling is at WTP boundary not 10km down pipeline to first cutomer.
FAC monitoring program at location 4km from WTP being used to show compliance. Expect to have 12 months compliant data by Sept 2010
NA - protozoa is compliant Sampling for compliance underway
Capital cost = $15,000 monitoring equipment, Operating costs = $10000 to implement FAC monitoring program
- $ - $ -
4 Waipaoa TP00175 N N Gisborne City GDC: No monitoring attempted due to infrequent WTP use (ie <2 weeks per year) Install UV
4-5 log due to poor surface water
qualityBudget shifted to 2014/15 LTCCP
Capital cost =$255,000 for UV and retrofitting, and post treatment compliance monitoring. Budget cost for LTCCP, no council reports with details.
- $ 0.225 $ 23.5
5 Middle Renwick Road TP02065 Y N Blenheim Non secure groundwater Install UV + Bore flush to waste + building extension + monitoring and telemetry upgrade 3 Commissioned NA $2 - 2.5 million (works associated with
compliance only) $ - $ -
6 Bomford Street (Central WTP) TP02064 Y N Blenheim Non secure groundwater, multiple sources
Install UV + Bore pump flush to waste + new UV/controls building + modifications to lime dosing point+ monitoring and telemetry upgrade+ capacity upgrade to allow for some growth + capacity of decommissioned Andrew st WTP.
3Being implemented. Funding committed. All aspects of contract to be completed by 2011
NA$5 million associated with UV (have not included reservoir or retic pumps but have included capacity upgrade.)
$ - $ -
7 Andrew St TP00504 Y N Blenheim Non secure groundwater To be decommissioned and additional capacity built into Central WTP 3 Soon to be decommissioned NA NA $ - $ -
Whakatane
Ohope (same WTP as Whakatane)
9 Levin TP00142 20000 FALSE N Levin horowhenua District Council
Insufficient FAC - protozoa reason not specified [ESR]. HDC: E coli - didn't supply data, protozoa - breached turbidity limits.
Addition of raw water storage basin, and either new rapid gravity filters or membrane filtration.
3 09/10 and 10/11 $10.7M - $ 10.7 $ -
N Kitchener
N Anzac
N Hilltop
11 Billah Street TP00038 16000 N N Tokoroa South Waikato District Council
Non secure groundwater. E.coli - Insufficient monitoring. Protozoa - insufficient monitoring.
Installed online turbidity, pH and chlorine for E.coli compliance. Require UV for protozoa compliance.
3Online monitoring for E.coli installed. Telemetry upgraded. UV being priced at present
Online monitoring = $20K Telemetry = $5K + upgrades costs which were still being priced
Estimated $557K - for D/S UV and associated works. Based on discussion with SWDC's consultant
$ 0.557 $ 23.5
12 Ashburton Domain TP00334 16000 Y N Ashburton Ashburton District Council
Non-secure groundwater sources, with no protozoa treatment
Non-secure bores to be replaced with deeper, secure groundwater sources not known To be upgraded in 2010 - design by
Opus Council budget is $438,000 - $ 0.438 $ -
Cambridge
Karapiro Village
14 Alpha Street, Cambridge TP00013 13368 Y N Cambridge
WDC:Waikato River - non secure catchment. Unable to show 12 months reliable influent quality data - turbidity transgressions exceed allowable limits.
Optioneering - TBC Estimated $855K based on new D/S UV and building $ 0.855 $ 23.5
15 Hicks Road TP02526 13368 Y N Cambridge WDC: Non Secure catchment - 2 x Spring. Require UV for compliance
Individual UV for Hicks priced but too expensive. Reviewing Options
Estimated $855K based on new D/S UV and building $ 0.855 $ 23.5
16 Feilding, Awa Street TP02327 N N FeildingInsufficient E.Coli samples - protozoa reason not specified [ESR]. MDC: g/w not yet categorised as secure.
Addition of testable double check valve. 0 Awaiting submission of proof of g/w security. Unknown Allow $100k $ 0.1 $ -
17 Feilding, Almadale TP00162 N N FeildingInsufficient FAC - protozoa reason not specified [ESR]. MDC: Fault on chlorine analyser, operators failed to take daily samples.
Addition of UV if need to provide 4 log3 or 4 (sampling
and testing underway)
Planning stages only $1.5M - $ 1.5 $ 23.5
18 Dudley Park (Emergency) TP02444 N N No monitoring attempted Emergency supply - no upgrades
planned N/A N/A $ - $ -
19 Ayers Street, Rangiora TP00207 N N Insufficient Ecoli monitoring, and no protozoa treatment
Non-secure bores to be replaced with deeper, secure groundwater sources not known
To be upgraded in 2010 - design by Opus. Construction underway, due for completion mid 2011.
Cost estimate is $15 million, includes 9 km pipeline - $ - $ -
Te Awamutu Township
Tokanui
Pirongia
Hawera
Ohawe Beach
Okaiawa
Normanby
$ -
Estimated $855K based on new D/S UV and building $ 0.855
N/A
Estimated $855K based on new D/S UV and building
$ 1.2-1.4
$ 0.2
$ 0.855
12000
13000
Waipa District Council
Y N
30600
24028 Marlborough District Council
N
N
Whakatane District Council
Waipa District Council
N
Rangiora
Gisborne District Council
Manawatu District Council
South Taranaki District Council
Franklin District Council
Not specified - plant water source is Whakatane River [ESR]. WDC: E coli - No reporting tool to consolidate data for both FAC & turbidity; protozoa - some turbidity excursions.
Waimakariri District Council
WDC: Lake Karapiro - non secure catchment. Unable to show 12 months reliable influent quality data - turbidity transgressions exceed allowable limits.
Non secure catchment supplying Mangauika Stream. Require UV for compliance
Springwater and groundwater bores - Spring water requires UV for compliance
UV - Waipa DC currently developing overall protozoa compliance strategy. May combine Hicks rd and Karapiro treated water in one UV plant.
3 -4 as catchment non secure
Upgrading of filters, and if require 4 log removal will also add UV.
Uncertified UV unit installed in 2004/05. Wedeco to replace with certified unit but need significant reconfiguration to fit replacement unit.
UV installed 2007/08 year. Have had to upgrade monitoring and telemetry and data storage to cope with increased information demands.
4 (but sampling and testing to confirm)
Starting 09/10
Currently being upgraded
3
E.Coli or FAC transgression - protozoa reason not specified
First contact pre xmas - verbal download, follow up message 26/1.
Pending capacity increase decision before Wedeco provides replacement unit.
UV installed. Have had difficulty with reliability of monitoring and data storage. Believe to be compliant now.
Optioneering - TBC
Hawera21 10720 NTP00354
Te Tahi Road Plant20 10915 YTP00005
Karapiro13 13500TP00014
10 Hickey 19153 YTP02555
Whakatane Plant8 21020 NTP00323
First contact pre xmas - verbal download, follow up message 26/1.
$200K Additional contract to increase Spring capacity for $350K (not strictly compliance) -
Filter upgrade $0.7 - $0.8M, UV $0.5-$0.6M. -
N/A $ -
$ 23.5
$ -
$ 23.5
$ -
NZ1-2309460-2007-08 non compliant large WTP for ecoli-protozoa (7).xls 12/04/2010 2:14 p.m. 1 of 2

WTP No. PlantName Plant
CodePlant Pop*
Ecoli Comply
Protozoa Comply ZoneName Terratorial Local
Authority Reason for non compliance Upgrade description Log reduction required Current Status of Implementation Council reported Costs to implement Beca Costs to implement Capital Cost ($mill) Operating Cost ($K)
22 Richmond #3 TP00414 N N
23 Richmond #4 TP00415 N N
24 Appleby TP00417 N N
25 Richmond #5 TP00416 N N
26 Richmond #2 TP00413 N N
27 Whakarewarewa Forest Springs TP00279 10060 N N Rotorua Eastern
SuburbsRotorua District Council
Insufficient E.Coli samples - protozoa reason not specified [ESR]. RDC: only chlorinating since January 2009.
Addition of UV 3 Complete N/A N/A $ - $ -
28 Darnley Square TP00209 10843 N N Not enough E.Coli Samples - protozoa monitoring not required as secure bore
None required 0 n/a N/A N/A $ - $ 0.3
29 Peraki St TP02443 10843 N N Emergency supply None required n/a n/a N/A N/A $ - $ -
30 Lake Terrace TP00011 14997 Y N Taupo Central & West
Taupo District Council Not specified - water source is Lake Taupo $19.5M (LTCCP). Includes approx 20%
capacity increase - $ 19.5 $ 20.8
Total 50.4$ 289.1$
$ 3.0 10500 Install pipework to combine groundwater from wells and add UV disinfection.
Waimakariri District CouncilKaiapoi
Richmond Tasman District Council
In planning stages, due for completion in 2013
Insufficient E. coli monitoring. No protozoa treatment. Source assumed to be secure but not proven.
3 $3M capital cost - $ 23.5
NZ1-2309460-2007-08 non compliant large WTP for ecoli-protozoa (7).xls 12/04/2010 2:14 p.m. 2 of 2
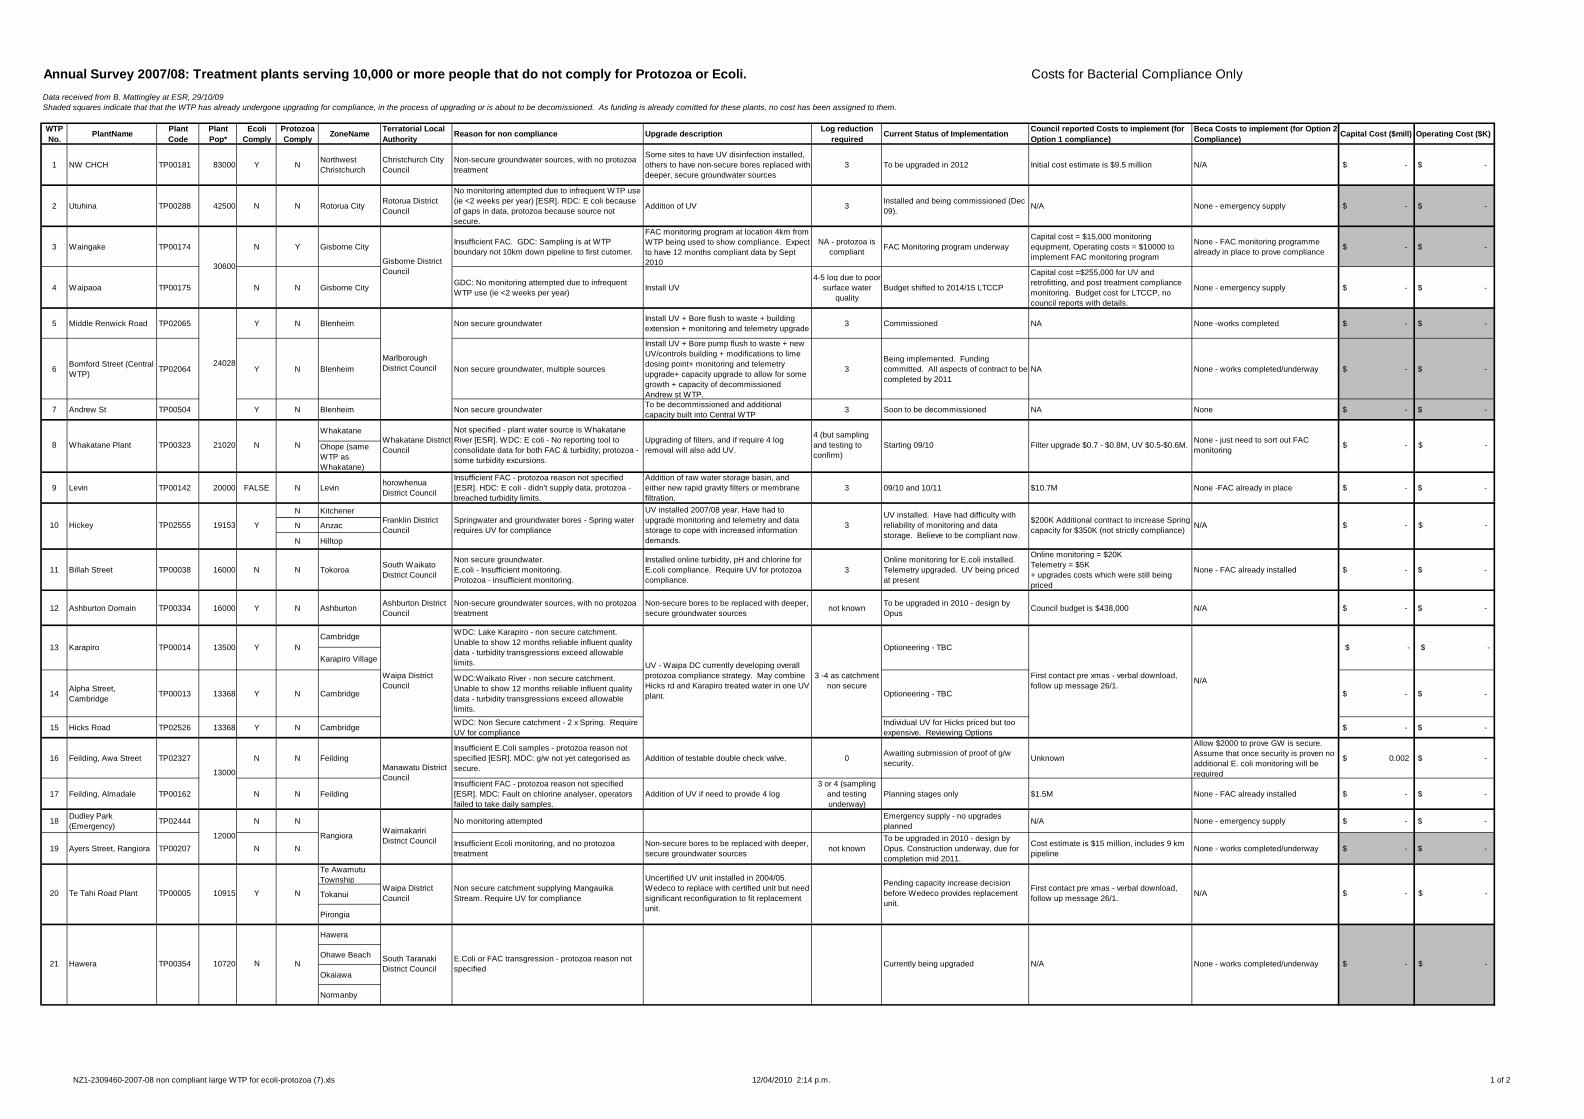
Annual Survey 2007/08: Treatment plants serving 10,000 or more people that do not comply for Protozoa or Ecoli. Costs for Bacterial Compliance OnlyData received from B. Mattingley at ESR, 29/10/09 Shaded squares indicate that that the WTP has already undergone upgrading for compliance, in the process of upgrading or is about to be decomissioned. As funding is already comitted for these plants, no cost has been assigned to them.
WTP No. PlantName Plant
CodePlant Pop*
Ecoli Comply
Protozoa Comply ZoneName Terratorial Local
Authority Reason for non compliance Upgrade description Log reduction required Current Status of Implementation Council reported Costs to implement (for
Option 1 compliance)Beca Costs to implement (for Option 2 Compliance) Capital Cost ($mill) Operating Cost ($K)
1 NW CHCH TP00181 83000 Y N Northwest Christchurch
Christchurch City Council
Non-secure groundwater sources, with no protozoa treatment
Some sites to have UV disinfection installed, others to have non-secure bores replaced with deeper, secure groundwater sources
3 To be upgraded in 2012 Initial cost estimate is $9.5 million N/A $ - $ -
2 Utuhina TP00288 42500 N N Rotorua City Rotorua District Council
No monitoring attempted due to infrequent WTP use (ie <2 weeks per year) [ESR]. RDC: E coli because of gaps in data, protozoa because source not secure.
Addition of UV 3 Installed and being commissioned (Dec 09). N/A None - emergency supply $ - $ -
3 Waingake TP00174 N Y Gisborne City Insufficient FAC. GDC: Sampling is at WTP boundary not 10km down pipeline to first cutomer.
FAC monitoring program at location 4km from WTP being used to show compliance. Expect to have 12 months compliant data by Sept 2010
NA - protozoa is compliant FAC Monitoring program underway
Capital cost = $15,000 monitoring equipment, Operating costs = $10000 to implement FAC monitoring program
None - FAC monitoring programme already in place to prove compliance $ - $ -
4 Waipaoa TP00175 N N Gisborne City GDC: No monitoring attempted due to infrequent WTP use (ie <2 weeks per year) Install UV
4-5 log due to poor surface water
qualityBudget shifted to 2014/15 LTCCP
Capital cost =$255,000 for UV and retrofitting, and post treatment compliance monitoring. Budget cost for LTCCP, no council reports with details.
None - emergency supply $ - $ -
5 Middle Renwick Road TP02065 Y N Blenheim Non secure groundwater Install UV + Bore flush to waste + building extension + monitoring and telemetry upgrade 3 Commissioned NA None -works completed $ - $ -
6 Bomford Street (Central WTP) TP02064 Y N Blenheim Non secure groundwater, multiple sources
Install UV + Bore pump flush to waste + new UV/controls building + modifications to lime dosing point+ monitoring and telemetry upgrade+ capacity upgrade to allow for some growth + capacity of decommissioned Andrew st WTP.
3Being implemented. Funding committed. All aspects of contract to be completed by 2011
NA None - works completed/underway $ - $ -
7 Andrew St TP00504 Y N Blenheim Non secure groundwater To be decommissioned and additional capacity built into Central WTP 3 Soon to be decommissioned NA None $ - $ -
Whakatane
Ohope (same WTP as Whakatane)
9 Levin TP00142 20000 FALSE N Levin horowhenua District Council
Insufficient FAC - protozoa reason not specified [ESR]. HDC: E coli - didn't supply data, protozoa - breached turbidity limits.
Addition of raw water storage basin, and either new rapid gravity filters or membrane filtration.
3 09/10 and 10/11 $10.7M None -FAC already in place $ - $ -
N Kitchener
N Anzac
N Hilltop
11 Billah Street TP00038 16000 N N Tokoroa South Waikato District Council
Non secure groundwater. E.coli - Insufficient monitoring. Protozoa - insufficient monitoring.
Installed online turbidity, pH and chlorine for E.coli compliance. Require UV for protozoa compliance.
3Online monitoring for E.coli installed. Telemetry upgraded. UV being priced at present
Online monitoring = $20K Telemetry = $5K + upgrades costs which were still being priced
None - FAC already installed $ - $ -
12 Ashburton Domain TP00334 16000 Y N Ashburton Ashburton District Council
Non-secure groundwater sources, with no protozoa treatment
Non-secure bores to be replaced with deeper, secure groundwater sources not known To be upgraded in 2010 - design by
Opus Council budget is $438,000 N/A $ - $ -
Cambridge
Karapiro Village
14 Alpha Street, Cambridge TP00013 13368 Y N Cambridge
WDC:Waikato River - non secure catchment. Unable to show 12 months reliable influent quality data - turbidity transgressions exceed allowable limits.
Optioneering - TBC $ - $ -
15 Hicks Road TP02526 13368 Y N Cambridge WDC: Non Secure catchment - 2 x Spring. Require UV for compliance
Individual UV for Hicks priced but too expensive. Reviewing Options $ - $ -
16 Feilding, Awa Street TP02327 N N FeildingInsufficient E.Coli samples - protozoa reason not specified [ESR]. MDC: g/w not yet categorised as secure.
Addition of testable double check valve. 0 Awaiting submission of proof of g/w security. Unknown
Allow $2000 to prove GW is secure. Assume that once security is proven no additional E. coli monitoring will be required
$ 0.002 $ -
17 Feilding, Almadale TP00162 N N FeildingInsufficient FAC - protozoa reason not specified [ESR]. MDC: Fault on chlorine analyser, operators failed to take daily samples.
Addition of UV if need to provide 4 log3 or 4 (sampling
and testing underway)
Planning stages only $1.5M None - FAC already installed $ - $ -
18 Dudley Park (Emergency) TP02444 N N No monitoring attempted Emergency supply - no upgrades
planned N/A None - emergency supply $ - $ -
19 Ayers Street, Rangiora TP00207 N N Insufficient Ecoli monitoring, and no protozoa treatment
Non-secure bores to be replaced with deeper, secure groundwater sources not known
To be upgraded in 2010 - design by Opus. Construction underway, due for completion mid 2011.
Cost estimate is $15 million, includes 9 km pipeline None - works completed/underway $ - $ -
Te Awamutu Township
Tokanui
Pirongia
Hawera
Ohawe Beach
Okaiawa
Normanby
$ -
$ -
$ -
$ -
$ -
First contact pre xmas - verbal download, follow up message 26/1.
$200K Additional contract to increase Spring capacity for $350K (not strictly compliance) N/A
Filter upgrade $0.7 - $0.8M, UV $0.5-$0.6M. None - just need to sort out FAC monitoring
N/A
Whakatane Plant8 21020 NTP00323
10 Hickey 19153 YTP02555
Karapiro13 13500TP00014
Te Tahi Road Plant20 10915 YTP00005
Hawera21 10720 NTP00354
First contact pre xmas - verbal download, follow up message 26/1.
Pending capacity increase decision before Wedeco provides replacement unit.
UV installed. Have had difficulty with reliability of monitoring and data storage. Believe to be compliant now.
Optioneering - TBC
4 (but sampling and testing to confirm)
Starting 09/10
Currently being upgraded
3
E.Coli or FAC transgression - protozoa reason not specified
UV - Waipa DC currently developing overall protozoa compliance strategy. May combine Hicks rd and Karapiro treated water in one UV plant.
3 -4 as catchment non secure
Upgrading of filters, and if require 4 log removal will also add UV.
Uncertified UV unit installed in 2004/05. Wedeco to replace with certified unit but need significant reconfiguration to fit replacement unit.
UV installed 2007/08 year. Have had to upgrade monitoring and telemetry and data storage to cope with increased information demands.
Not specified - plant water source is Whakatane River [ESR]. WDC: E coli - No reporting tool to consolidate data for both FAC & turbidity; protozoa - some turbidity excursions.
Waimakariri District Council
WDC: Lake Karapiro - non secure catchment. Unable to show 12 months reliable influent quality data - turbidity transgressions exceed allowable limits.
Non secure catchment supplying Mangauika Stream. Require UV for compliance
Springwater and groundwater bores - Spring water requires UV for compliance
Rangiora
Gisborne District Council
Manawatu District Council
South Taranaki District Council
Franklin District Council
30600
24028 Marlborough District Council
N
N
Whakatane District Council
Waipa District Council
N $ -
$ -
$ -
12000
13000
Waipa District Council
Y N
$ -
$ -
None - works completed/underway
N/A
N/A
NZ1-2309460-2007-08 non compliant large WTP for ecoli-protozoa (7).xls 12/04/2010 2:14 p.m. 1 of 2

WTP No. PlantName Plant
CodePlant Pop*
Ecoli Comply
Protozoa Comply ZoneName Terratorial Local
Authority Reason for non compliance Upgrade description Log reduction required Current Status of Implementation Council reported Costs to implement (for
Option 1 compliance)Beca Costs to implement (for Option 2 Compliance) Capital Cost ($mill) Operating Cost ($K)
22 Richmond #3 TP00414 N N
23 Richmond #4 TP00415 N N
24 Appleby TP00417 N N
25 Richmond #5 TP00416 N N
26 Richmond #2 TP00413 N N
27 Whakarewarewa Forest Springs TP00279 10060 N N Rotorua Eastern
SuburbsRotorua District Council
Insufficient E.Coli samples - protozoa reason not specified [ESR]. RDC: only chlorinating since January 2009.
Addition of UV 3 Complete N/A None - works completed $ - $ -
28 Darnley Square TP00209 10843 N N Not enough E.Coli Samples - protozoa monitoring not required as secure bore
None required 0 n/a N/A No capital cost. Allow for E. coli monitoring
$ - $ 0.3
29 Peraki St TP02443 10843 N N Emergency supply None required n/a n/a N/A None - emergency supply $ - $ -
30 Lake Terrace TP00011 14997 Y N Taupo Central & West
Taupo District Council Not specified - water source is Lake Taupo $19.5M (LTCCP). Includes approx 20%
capacity increase N/A $ - $ -
Total 0.004$ 0.3$
$ - $3M
Allow $2000 to prove GW is secure. Assume that once security is proven no additional E. coli monitoring will be required
In planning stages, due for completion in 2013
Insufficient E. coli monitoring. No protozoa treatment. Source assumed to be secure but not proven.
3
Kaiapoi
Richmond Tasman District Council
Waimakariri District Council
10500 Install pipework to combine groundwater from wells and add UV disinfection. $ 0.002
NZ1-2309460-2007-08 non compliant large WTP for ecoli-protozoa (7).xls 12/04/2010 2:14 p.m. 2 of 2

Appendix C
Source and Treatment Matrix: Bacterial Only Compliance
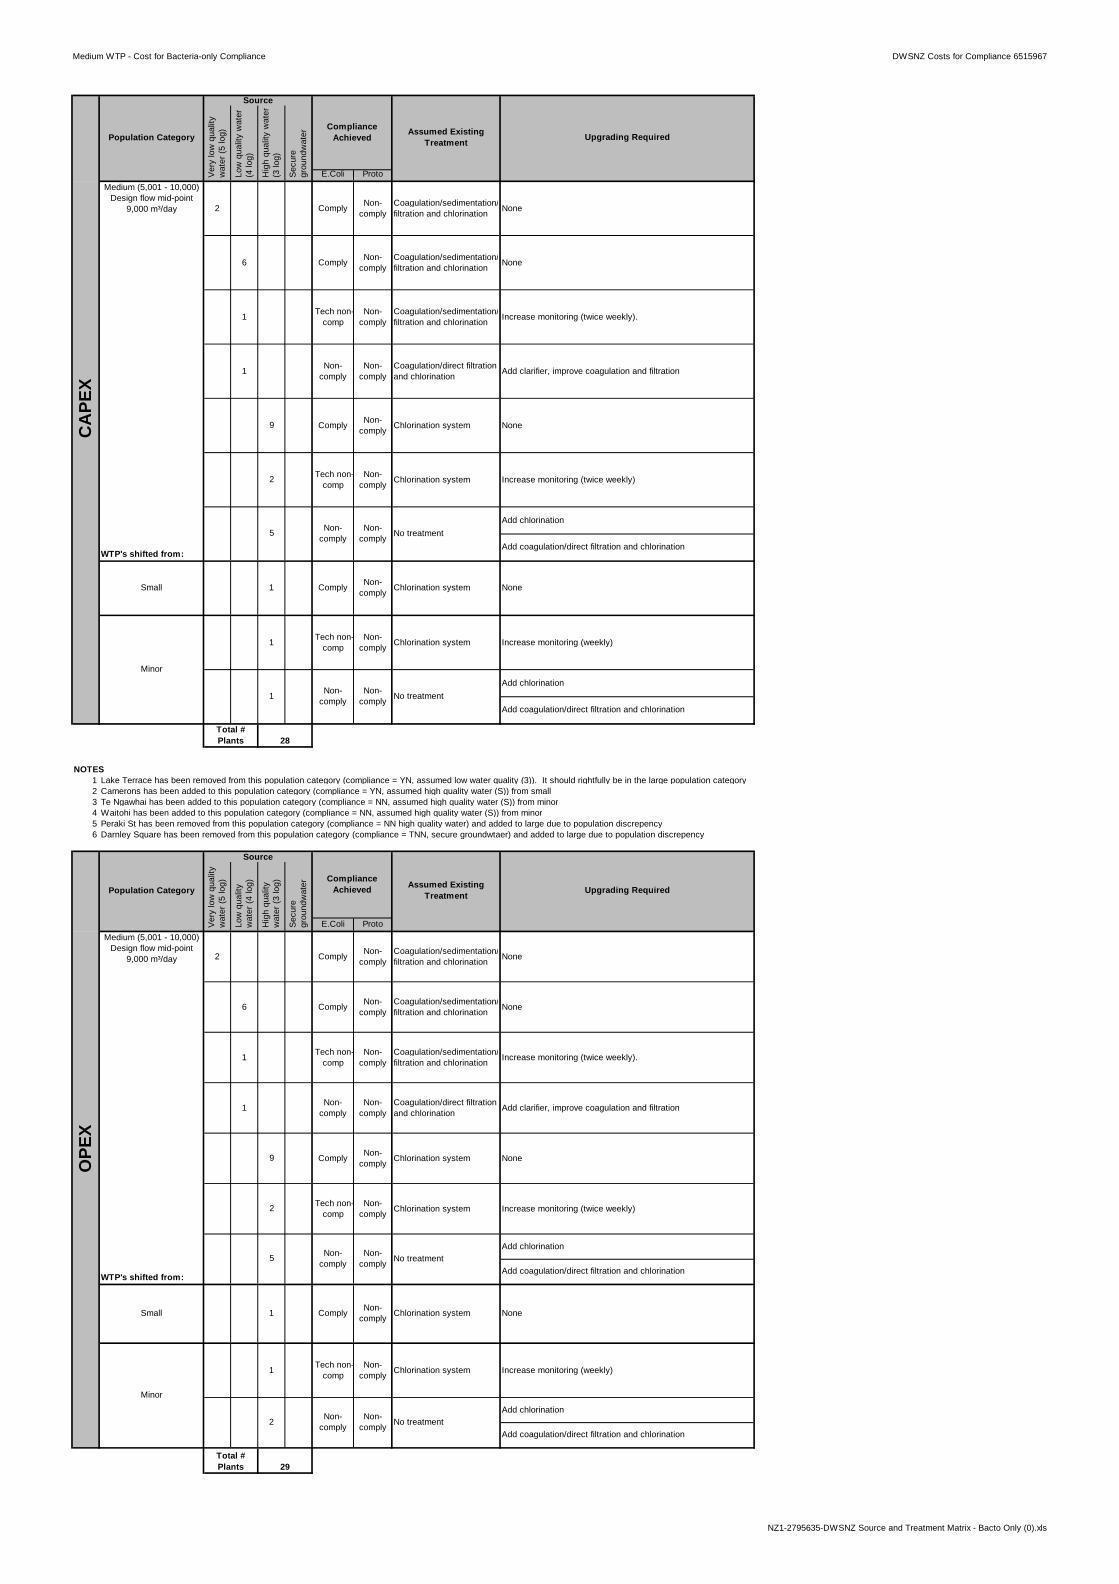
Medium WTP - Cost for Bacteria-only Compliance DWSNZ Costs for Compliance 6515967
E.Coli Proto
WTP's shifted from:
NOTES1 Lake Terrace has been removed from this population category (compliance = YN, assumed low water quality (3)). It should rightfully be in the large population category2 Camerons has been added to this population category (compliance = YN, assumed high quality water (S)) from small 3 Te Ngawhai has been added to this population category (compliance = NN, assumed high quality water (S)) from minor4 Waitohi has been added to this population category (compliance = NN, assumed high quality water (S)) from minor5 Peraki St has been removed from this population category (compliance = NN high quality water) and added to large due to population discrepency6 Darnley Square has been removed from this population category (compliance = TNN, secure groundwtaer) and added to large due to population discrepency
E.Coli Proto
WTP's shifted from:
1
1
Comply
Increase monitoring (weekly)
Non-comply
Non-comply
Non-comply
Chlorination system None
No treatment
Chlorination systemTech non-comp
Non-comply
Source
Compliance Achieved Assumed Existing
Treatment Upgrading Required
Population CategoryCompliance
AchievedAssumed Existing
Treatment
Source
Hig
h qu
ality
wat
er
(3 lo
g)
Low
qua
lity
wat
er
(4 lo
g)
Upgrading Required
Ver
y lo
w q
ualit
y w
ater
(5 lo
g)
6
1
2
5
NoneCoagulation/sedimentation/filtration and chlorination
Non-comply
Non-comply
Sec
ure
grou
ndw
ater
Comply
Non-comply1
Non-comply
Tech non-comp
Comply
2
Coagulation/direct filtration and chlorination
None
Coagulation/sedimentation/filtration and chlorination
Coagulation/sedimentation/filtration and chlorination
Non-comply
Non-comply
Comply
None
Increase monitoring (twice weekly)
Chlorination system
No treatment
Chlorination system
Add chlorination
Add coagulation/direct filtration and chlorination
9
Total # Plants 28
1
Tech non-comp
Non-comply
Increase monitoring (twice weekly).
Add clarifier, improve coagulation and filtration
Non-comply
Non-comply
Small
OPE
X
Population Category
Small
CA
PEX
Minor
Minor
Medium (5,001 - 10,000) Design flow mid-point
9,000 m³/day
Medium (5,001 - 10,000) Design flow mid-point
9,000 m³/day 2 Comply Non-comply
Ver
y lo
w q
ualit
y w
ater
(5 lo
g)
Low
qua
lity
wat
er (4
log)
Hig
h qu
ality
w
ater
(3 lo
g)
Sec
ure
grou
ndw
ater
Coagulation/sedimentation/filtration and chlorination None
6 Comply Non-comply
Coagulation/sedimentation/filtration and chlorination None
1 Tech non-comp
Non-comply
Coagulation/sedimentation/filtration and chlorination Increase monitoring (twice weekly).
1 Non-comply
Non-comply
Coagulation/direct filtration and chlorination Add clarifier, improve coagulation and filtration
9 Comply
Tech non-comp
Non-comply Chlorination system
Chlorination systemNon-comply
2
Non-comply
5 Non-comply No treatment
None1 Comply Chlorination systemNon-comply
Non-comply
Non-comply No treatment
Add chlorination
Add coagulation/direct filtration and chlorination
Total # Plants 29
2
Increase monitoring (weekly)1 Tech non-comp
Non-comply Chlorination system
Add chlorination
Add coagulation/direct filtration and chlorination
Add chlorination
Add coagulation/direct filtration and chlorination
None
Increase monitoring (twice weekly)
NZ1-2795635-DWSNZ Source and Treatment Matrix - Bacto Only (0).xls

Minor WTP - Costs ofr Bacteria-only Compliance DWSNZ Costs for Compliance 6515967
E.Coli Proto
NOTES1 Te Ngawhai has been removed from this population category (compliance = TNN, assumed high quality water (S)) and put in medium2 Waitohi has been removed from this population category (compliance = NN, assumed high quality water (S)) and put in medium
E.Coli Proto
Add coagulation/direct filtration and chlorination
Add Chlorination
Add Chlorination
Add coagulation/direct filtration and chlorination
None
Upgrading Required
CA
PEX
OPE
X
Tech non-comp
Non-comply No treatment
1
Total # Plants 193
1
Non-comply Comply
Increase monitoring (monthly)
No treatment None
No treatment26 Non-comply
Non-comply
Tech non-comp
Non-comply Chlorination system Increase monitoring (weekly)21
Comply Non-comply Chlorination system None58
Non-comply
Non-comply
Coagulation/direct filtration and chlorination Add clarifier, improve coagulation and filtration15
11Tech non-comp
Non-comply
Coagulation/sedimentation/filtration and chlorination Increase monitoring (weekly)
Comply Non-comply
Coagulation/sedimentation/filtration and chlorination
Increase monitoring (weekly)
Non-comply
Non-comply
Coagulation/sedimentation/filtration and chlorination Improve coagulation and sedimentation
None
4
Tech non-comp
Non-comply
Coagulation/sedimentation/filtration and chlorination
Minor (501 - 5,000) Design flow mid-point
3,300 m³/day 11
3
42
Comply Non-comply
Coagulation/sedimentation/filtration and chlorination
Very
low
qu
ality
wat
er
(5 lo
g)Lo
w q
ualit
y w
ater
(4 lo
g)
Hig
h qu
ality
w
ater
(3 lo
g)
Secu
re
grou
ndw
ater
Population Category
Source
Compliance Achieved Assumed Existing
Treatment
Minor (501 - 5,000) Design flow mid-point
3,300 m³/day
58 Chlorination system None
21
Comply
15
11
Add clarifier, improve coagulation and filtrationNon-comply
None
Increase monitoring (weekly)
Coagulation/sedimentation/filtration and chlorination
Improve coagulation and sedimentation
Non-comply
1
Tech non-comp
1 Non-comply No treatment
11
42
4
3
Increase monitoring (monthly)
No treatment
No treatment None
Increase monitoring (weekly)
Coagulation/sedimentation/filtration and chlorination
Coagulation/sedimentation/filtration and chlorination
Increase monitoring (weekly)
None
Non-comply
Tech non-comp
Non-comply Chlorination system
Non-comply
Coagulation/direct filtration and chlorination
Tech non-comp
Comply
Non-comply
Coagulation/sedimentation/filtration and chlorination
Coagulation/sedimentation/filtration and chlorination
Non-comply
Tech non-comp
Non-comply
ComplyNon-comply
Non-comply
26 Non-comply
Non-comply
Secu
re g
roun
dwat
er
Comply Non-comply
Total # Plants 193
Very
low
qua
lity
wat
er (5
log)
Low
qua
lity
wat
er (4
lo
g)
Population CategoryCompliance
Achieved Assumed Existing Treatment
Source
Hig
h qu
ality
wat
er (3
lo
g)
Upgrading Required
NZ1-2795635-DWSNZ Source and Treatment Matrix - Bacto Only (0).xls

Small WTP - Costs for Bacteria-only Compliance DWSNZ Costs for Compliance 6515967
E.Coli Proto
WTPs shifted from:
NOTES1 Omanaia has been added to this population category (compliance = NN, assumed high quality water (S)) from neighbourhood 2 Kekerengu has been added to this population category (compliance = NN, assumed high quality water (S)) from neighbourhood 3 Colville Town has been added to this population category (compliance = NN, assumed high quality water (S)) from neighbourhood 4 Te Rerenga has been added to this population category (compliance = NN, assumed high quality water (S)) from neighbourhood 5 Camerons has been removed from this population category (compliance = YN, assumed high quality water (S)) and put in medium
E.Coli Proto
WTPs shifted from:
Non-comply
Non-comply No treatment Add cartridge filtration and chlorination
Total # Plants 237
4
75
80
Tech non-comp Comply No treatment Increase monitoring (quarterly)
Non-comply Chlorination system
Non-comply
Non-comply
1
Increase monitoring (quarterly)10
No treatment Add cartridge filtration and chlorination
Tech non-comp
Comply Non-comply Chlorination system None
Infiltration gallery and chlorination Install 3-stage cartridge filtration21 Non-
complyNon-
comply
None
4 Tech non-comp
Non-comply
Infiltration gallery, coagulation/direct filtration and chlorination
Increase monitoring (quarterly)
Increase monitoring (quarterly)
Non-comply
Non-comply
Infiltration gallery and chlorination Install coagulation/sedimentation/filtration process
Comply Non-comply
Infiltration gallery, coagulation/direct filtration and chlorination
Tech non-comp
Non-comply
Infiltration gallery, coagulation/direct filtration and chlorination
1
26
7
Non-comply
Infiltration gallery, coagulation/direct filtration and chlorination
8
Upgrading Required
Source
Compliance Achieved Assumed Existing
Treatment
Ver
y lo
w q
ualit
y w
ater
(5 lo
g)
Low
qua
lity
wat
er (4
log)
Hig
h qu
ality
w
ater
(3 lo
g)
Sec
ure
grou
ndw
ater
Upgrading RequiredPopulation CategoryCompliance
AchievedAssumed Existing
Treatment
Source
Ver
y lo
w q
ualit
y w
ater
(5 lo
g)
Low
qua
lity
wat
er
(4 lo
g)
Hig
h qu
ality
wat
er
(3 lo
g)
Tech non-comp
Sec
ure
grou
ndw
ater
Non-comply
Non-comply
Non-comply
26
4
21
Increase monitoring (quarterly)
Comply
Increase monitoring (quarterly)
NoneNon-comply
Install coagulation/sedimentation/filtration processInfiltration gallery and chlorination7
Non-comply
Non-comply
Tech non-comp Increase monitoring (quarterly)
Infiltration gallery, coagulation/direct filtration and chlorination
NoneComply
1
8
Infiltration gallery, coagulation/direct filtration and chlorination
Install 3-stage cartridge filtrationNon-comply
Non-comply
Tech non-comp Chlorination system
Non-comply Chlorination system
Non-comply
Comply80
10
75
None
Increase monitoring (quarterly)
No treatment Add cartridge filtration and chlorination
Infiltration gallery, coagulation/direct filtration and chlorination
Infiltration gallery, coagulation/direct filtration and chlorination
Infiltration gallery and chlorination
Non-comply
ComplyTech non-comp
1
Non-comply
CA
PEX
Small (101 - 500) Design flow mid-point
360 m³/day
Neighbourhood
OPE
X
Population Category
No treatment
Total # Plants 237
No treatment
Add cartridge filtration and chlorination
Small (101 - 500) Design flow mid-point
360 m³/day
4 Non-comply
Non-comply
NoneComply
Neighbourhood
NZ1-2795635-DWSNZ Source and Treatment Matrix - Bacto Only (0).xls

Neighbourhood WTPs - Costs for Bacteria-only Compliance DWSNZ Costs for Compliance 6515967
E.Coli Proto
NOTES1 Omanaia has been removed from this population category (compliance = NN, assumed high quality water (S)) and put in small2 Kekerengu has been removed from this population category (compliance = NN, assumed high quality water (S)) and put in small3 Colville Town has been removed from this population category (compliance = NN, assumed high quality water (S)) and put in small4 Te Rerenga has been removed from this population category (compliance = NN, assumed high quality water (S)) and put in small
E.Coli Proto
CA
PEX
4Infiltration gallery, coagulation/direct filtration and chlorination
NoneComply Non-comply
Non-comply
Non-comply
Increase monitoring (quarterly).
Non-comply
Comply Non-comply
Non-comply
Non-comply8 Install coagulation/sedimentation/filtration processInfiltration gallery and
chlorination
Comply Non-comply
Infiltration gallery, coagulation/direct filtration and chlorination
None
Upgrading RequiredPopulation Category
Source
Compliance Achieved
Assumed Existing Treatment
Ver
y lo
w q
ualit
y w
ater
(5 lo
g)
Low
qua
lity
wat
er (4
log)
Hig
h qu
ality
w
ater
(3 lo
g)
Sec
ure
grou
ndw
ater
Neighbourhood (25 - 100) Design flow mid-point 75
m³/day
Infiltration gallery and chlorination
None
Chlorination system Increase monitoring (quarterly)
No treatment Add cartridge filtration and chlorination
No treatment Increase monitoring (quarterly)3
113
10
22
Comply
Non-comply
Non-comply
Non-comply
Comply
Tech non-comp
Non-comply
Install coagulation/sedimentation/filtration process
Non-comply
Infiltration gallery and chlorination
Infiltration gallery, coagulation/direct filtration and chlorination
Non-comply
None2
Infiltration gallery, coagulation/direct filtration and chlorination
Install 3-stage cartridge filtration
Chlorination system
8
Total # Plants 189
1Tech non-comp
Tech non-comp
26
Low
qua
lity
wat
er
(4 lo
g)Non-
comply
Sec
ure
grou
ndw
ater Upgrading Required
Comply
Population CategoryCompliance
AchievedAssumed Existing
Treatment
Source
Hig
h qu
ality
wat
er
(3 lo
g)
Ver
y lo
w q
ualit
y w
ater
(5 lo
g)
Neighbourhood (25 - 100) Design flow mid-point 75
m³/day
4
1
2
Non-comply
Non-comply
Tech non-comp
Non-comply
26
Chlorination system Increase monitoring (quarterly)
None22 Comply Non-comply Chlorination system
Add cartridge filtration and chlorination113 Non-comply
Non-comply
Tech non-comp
Comply No treatment
No treatment
Increase monitoring (quarterly)
OPE
X
Total # Plants 189
3
10
Infiltration gallery, coagulation/direct filtration and chlorination
None
Increase monitoring (quarterly).
Install 3-stage cartridge filtrationInfiltration gallery and chlorination
Infiltration gallery, coagulation/direct filtration and chlorination
Tech non-comp
Non-comply
NZ1-2795635-DWSNZ Source and Treatment Matrix - Bacto Only (0).xls

Appendix D
Chemical MAV Compliance

Additional Costs for P2 Compliance DWSNZ Costs for Compliance 6515967
Arsenic Te Teko TP00315 3 Minor No - NN 292,404$
Arsenic Braemar TP00324 1 Minor No - YN 292,404$
Arsenic Johnson Rd TP00325 3,3 Minor No - YN 292,404$
Acacia Bay Acacia Bay Arsenic Acacia Bay TP00002 3 Minor No - YN 292,404$
Motuoapa Motuoapa Arsenic Motuopa Pump TP00602 S Minor No - YN 292,404$
Omori Omori/Kuratau and Pukawa Arsenic Omori Pump TP00440 S Minor No - YN 292,404$
Rainbow Point Taupo South Arsenic Rainbow Point TP00012 S Minor No -YN 292,404$
2,046,828$
Waiau Beach TP01096 2 Minor No -YN -$
Clarks Beach TP00124 0 Minor Yes -$
-$
Te Karaka Te Karaka Manganese Te Karaka TP00176 S Minor No - YN 101,367$
Takapau Takapau Township Manganese Takapau TP00096 0 Minor Yes 702,129$
803,496$
Richmond #2 TP00413 G Large No - NN -$
Richmond #3 TP00414 G Large No - NN -$
Richmond #4 TP00415 G Large No - NN -$
Richmond #5 TP00416 G Large No - NN -$
Appleby TP00417 G Large No - NN -$
-$
Eketahuna Eketahuna Dichloroacetic acid and MAV ratio sum of HAA Eketahuna TP00157 3 Minor No - YN 292,404$
Waitati Waitati Dichloroacetic acid and MAV ratio sum of HAA
Waitati, Old North Rd TP00246 S Minor No - NN 292,404$
584,808$
Woodville Woodville MAV ratio sum of HAA Woodville TP00156 3,3 Minor No - YN -$
-$
Helensville/Parakai Helensville and Parakai
Bromodichloromethane and MAV ratio sum of THM Helensville TP00167 3,3 Minor Yes 292,404$
292,404$
Akaroa Aylmers Chlorate and MAV ratio sum of THM Aylmers TP00190 3 Minor No - NN
292,404$
292,404$
Paihia Haruru Falls MAV ratio sum of THM Paihia TP00311 3 Minor Yes 292,404$
Bream Bay Bream Bay MAV ratio sum of THM Ruakaka TP00389 3,3,3 Medium No - YN 580,464$
Wellsford Wellsford MAV ratio sum of THM Wellsford TP00008 3 Minor Yes 292,404$
1,165,272$ 5,185,211$
NotesThe costs given in this matrix are additional to any cost required for compliance with P1 criteria. If an upgrade is required for P1 criteria this is indicated by a "No" in the P1 compliance column.
Total costs include margins and fees as follows: preliminary and general and Contractor's margin (18%), design (12%), contingency (18%).
NZAS Tiwai Point has been excluded as it is a self suuply (BDCM, DCAA and Dichloroacetic acid)
Where possible, costs have been taken from the P1 costing table
Cost estimates for upgrades particular to P2 determinands are given below. Sourced from PLR and AWW
The letters in brackets in the P1 compliance column indicate whether the treatment plant has E. coli and protozoa compliance respectively (y=yes, n=no)
Lake Terrace also exceeded the MAV for arsenic in the 2007-08 year. It is dealt with separately as part of the Large WTP analysis.
Five WTPs also had transgressions for fluoride in the 2007/08 year. In these cases operational error caused excess fluoride (deliberately added for health benefits) to be added to the water at levels above the MAV. Thus the costs for resolving the fluoride transgressions are not related to compliance with the standards and are not considered here.
None
Edgecumbe and Thornton
Addition of coagulation and direct filtration allowed for under P1 compliance. Add enhanced coagulation
Upgrading RequiredP2 Determinand
None
None
None
Rangitaiki
Total
Zone Name Population Category
Existing Treatment (noted if assumed)
Total
P1 compliance (E. coli, Proto)Plant Name Plant Code Source water
code
Add chlorination and filtration
Chlorination and fluorodation
Clarks Beach/Waiau Beach
None. Franklin DC have stated that the two water sources have been joined to dilute the boron.
None
Nitrate
Boron
Assumed at least coagulation, filtration and
Total
Clarks Beach/Waiau Beach
Assumed no treatment
Community
Assumed at least coagulation, filtration and
Tota
l per
pl
ant (
incl
. m
argi
ns a
nd
fees
)
Enhanced coagulation
Add KMnO4
Enhanced coagulation
Diatomaceous earth and chlorination
Assumed at least coagulation, filtration and
Enhanced coagulation. Assume that a reduction in chlorate levels can be achieved through better housekeeping.
Enhanced coagulation
Assumed at least coagulation, filtration and
Assumed at least coagulation, filtration and
Total
Total
Total
Total
Richmond
Assumed at least coagulation, filtration and
At least coagulation, filtration and chlorination
None. Addition of UV allowed for under P1 compliance upgrades
Assumed at least coagulation, filtration and
None. Tasman DC has stated that not all wells have a nitrate problem and propose to mix the water from the various wells to dilute the nitrate.
None
None
Assumed chlorination
Addition of coagulation and direct filtration allowed for under P1 compliance. Add
enhanced coagulation
Total
None
Chlorination and fluorodation
Chlorination and fluorodation
None
Assumed at least coagulation, filtration and
Total
Richmond
NZ1-2486104-DWSNZ Source and Treatment Matrix (11).xls