nyu stern’s ross and salomon roundtable on cecl
TRANSCRIPT

NYU Stern’s Ross and Salomon Roundtable on
CECL: Transparency or Opacity? Implementation and Effects on Lending and
Pro-Cyclicality
October 28, 2019
Copyright 2019 by Financial Accounting Foundation, Norwalk CT. For non-commercial, educational/academic purposes only.
CECL: Transparency or Opacity?Implementation and Effects on Lending
Hal SchroederFASB Member October 28, 2019
Ross and Salomon Roundtable on Current Expected Credit LossesNYU Stern School of Business
The views expressed in this presentation are those of the presenter. Official positions of the FASB are reached only after extensive due process and deliberations.

Copyright 2019 by Financial Accounting Foundation, Norwalk CT. For non-commercial, educational/academic purposes only.3
Recent . . . Stop & Study?
Copyright 2019 by Financial Accounting Foundation, Norwalk CT. For non-commercial, educational/academic purposes only.
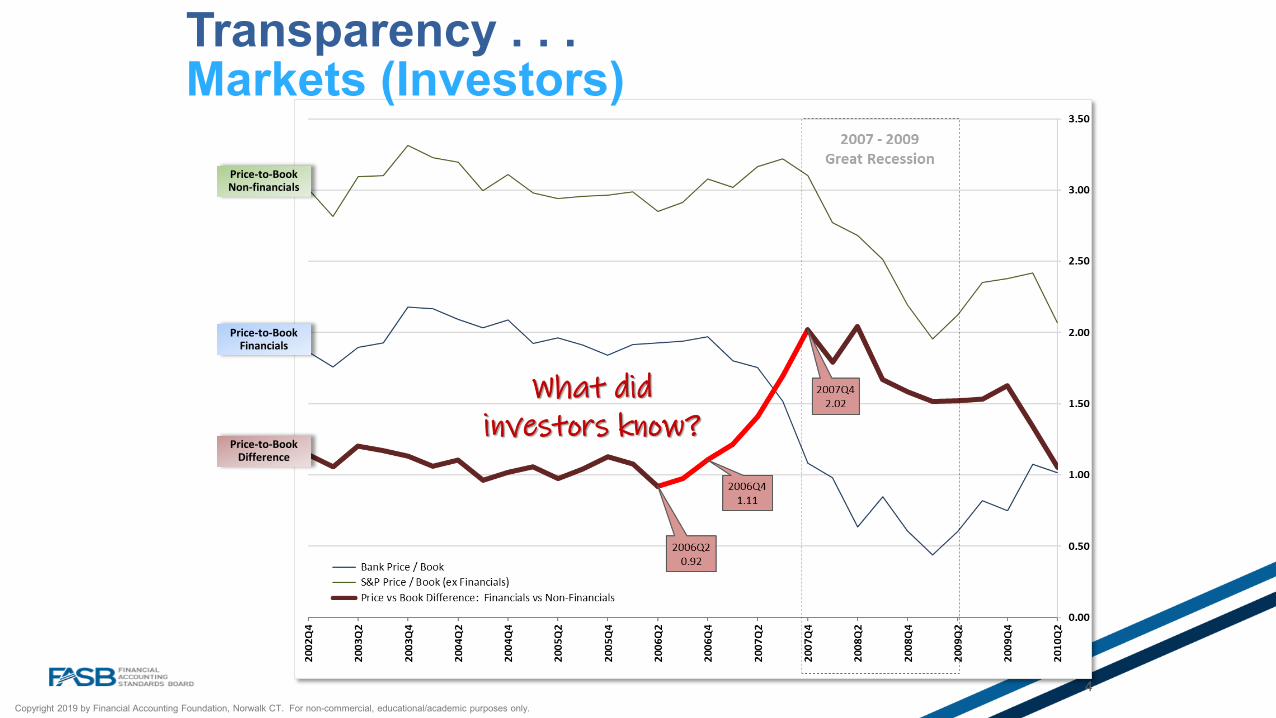
Price-to-Book Non-financials
Transparency . . . Markets (Investors)
4
Price-to-Book Financials
Price-to-Book Difference
What did investors know?
Copyright 2019 by Financial Accounting Foundation, Norwalk CT. For non-commercial, educational/academic purposes only.
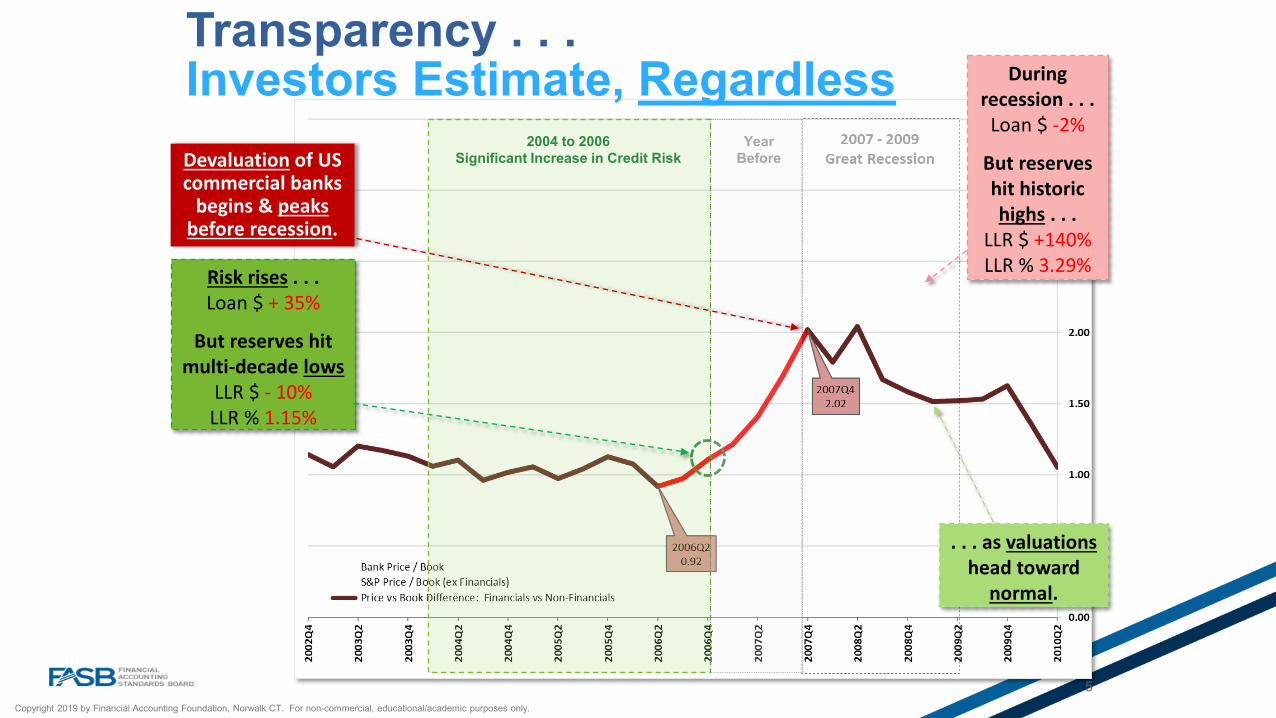
Transparency . . . Investors Estimate, Regardless
5
Year Before
Risk rises . . .Loan $ + 35%
But reserves hitmulti-decade lows
LLR $ - 10%LLR % 1.15%
Devaluation of US commercial banks
begins & peaks before recession.
2004 to 2006Significant Increase in Credit Risk
During recession . . .
Loan $ -2%
But reserves hit historic highs . . .
LLR $ +140%LLR % 3.29%
. . . as valuationshead toward
normal.
Copyright 2019 by Financial Accounting Foundation, Norwalk CT. For non-commercial, educational/academic purposes only.
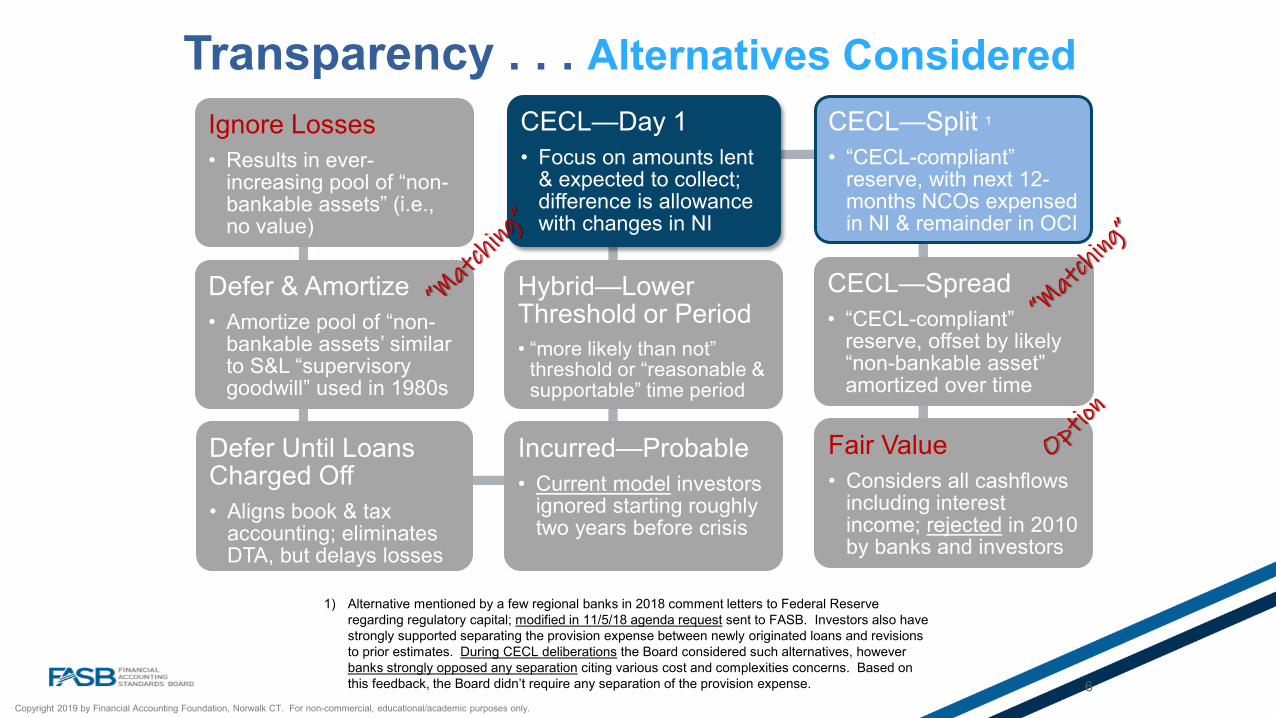
Ignore Losses• Results in ever-
increasing pool of “non-bankable assets” (i.e., no value)
Defer & Amortize• Amortize pool of “non-
bankable assets’ similar to S&L “supervisory goodwill” used in 1980s
Defer Until Loans Charged Off• Aligns book & tax
accounting; eliminates DTA, but delays losses
Incurred—Probable• Current model investors
ignored starting roughly two years before crisis
Hybrid—Lower Threshold or Period• “more likely than not”
threshold or “reasonable & supportable” time period
CECL—Day 1• Focus on amounts lent
& expected to collect; difference is allowance with changes in NI
CECL—Split 1
• “CECL-compliant” reserve, with next 12-months NCOs expensed in NI & remainder in OCI
CECL—Spread • “CECL-compliant”
reserve, offset by likely “non-bankable asset” amortized over time
Fair Value• Considers all cashflows
including interest income; rejected in 2010 by banks and investors
Transparency . . . Alternatives Considered
1) Alternative mentioned by a few regional banks in 2018 comment letters to Federal Reserve regarding regulatory capital; modified in 11/5/18 agenda request sent to FASB. Investors also have strongly supported separating the provision expense between newly originated loans and revisions to prior estimates. During CECL deliberations the Board considered such alternatives, however banks strongly opposed any separation citing various cost and complexities concerns. Based on this feedback, the Board didn’t require any separation of the provision expense. 6

Copyright 2019 by Financial Accounting Foundation, Norwalk CT. For non-commercial, educational/academic purposes only.
Key
“Probable” Threshold
Ris
k Ex
posu
re
Transparency . . . Comparability
7
Contractual + Renewals
Day 1
Con
tract
ual
Life
When?
How much?
CECL
12 months
Allowance by Period
Current
Copyright 2019 by Financial Accounting Foundation, Norwalk CT. For non-commercial, educational/academic purposes only.
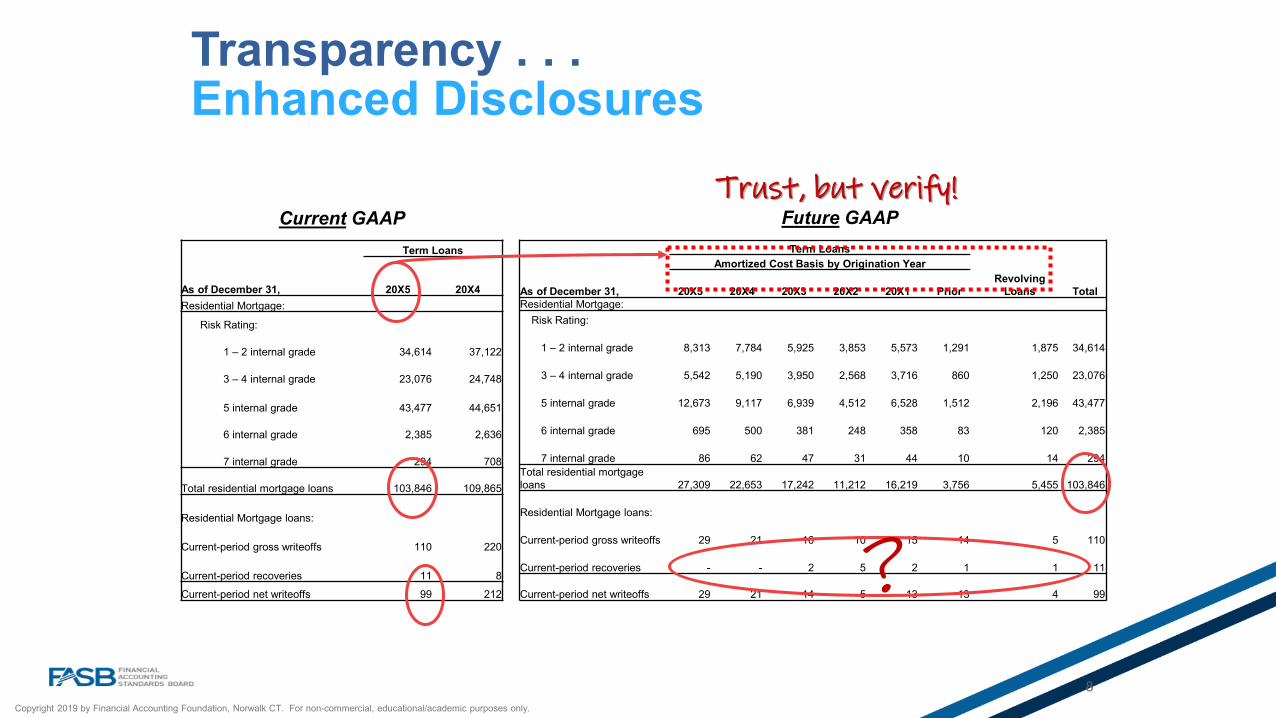
Term LoansAmortized Cost Basis by Origination Year
As of December 31, 20X5 20X4 20X3 20X2 20X1 PriorRevolving
Loans TotalResidential Mortgage:
Risk Rating:
1 – 2 internal grade 8,313 7,784 5,925 3,853 5,573 1,291 1,875 34,614
3 – 4 internal grade 5,542 5,190 3,950 2,568 3,716 860 1,250 23,076
5 internal grade 12,673 9,117 6,939 4,512 6,528 1,512 2,196 43,477
6 internal grade 695 500 381 248 358 83 120 2,385
7 internal grade 86 62 47 31 44 10 14 294 Total residential mortgage loans 27,309 22,653 17,242 11,212 16,219 3,756 5,455 103,846
Residential Mortgage loans:
Current-period gross writeoffs 29 21 16 10 15 14 5 110
Current-period recoveries - - 2 5 2 1 1 11
Current-period net writeoffs 29 21 14 5 13 13 4 99
Term Loans
As of December 31, 20X5 20X4Residential Mortgage:
Risk Rating:
1 – 2 internal grade 34,614 37,122
3 – 4 internal grade 23,076 24,748
5 internal grade 43,477 44,651
6 internal grade 2,385 2,636
7 internal grade 294 708
Total residential mortgage loans 103,846 109,865
Residential Mortgage loans:
Current-period gross writeoffs 110 220
Current-period recoveries 11 8
Current-period net writeoffs 99 212
Transparency . . . Enhanced Disclosures
Current GAAP Future GAAP
8
?
Trust, but verify!
Copyright 2019 by Financial Accounting Foundation, Norwalk CT. For non-commercial, educational/academic purposes only.
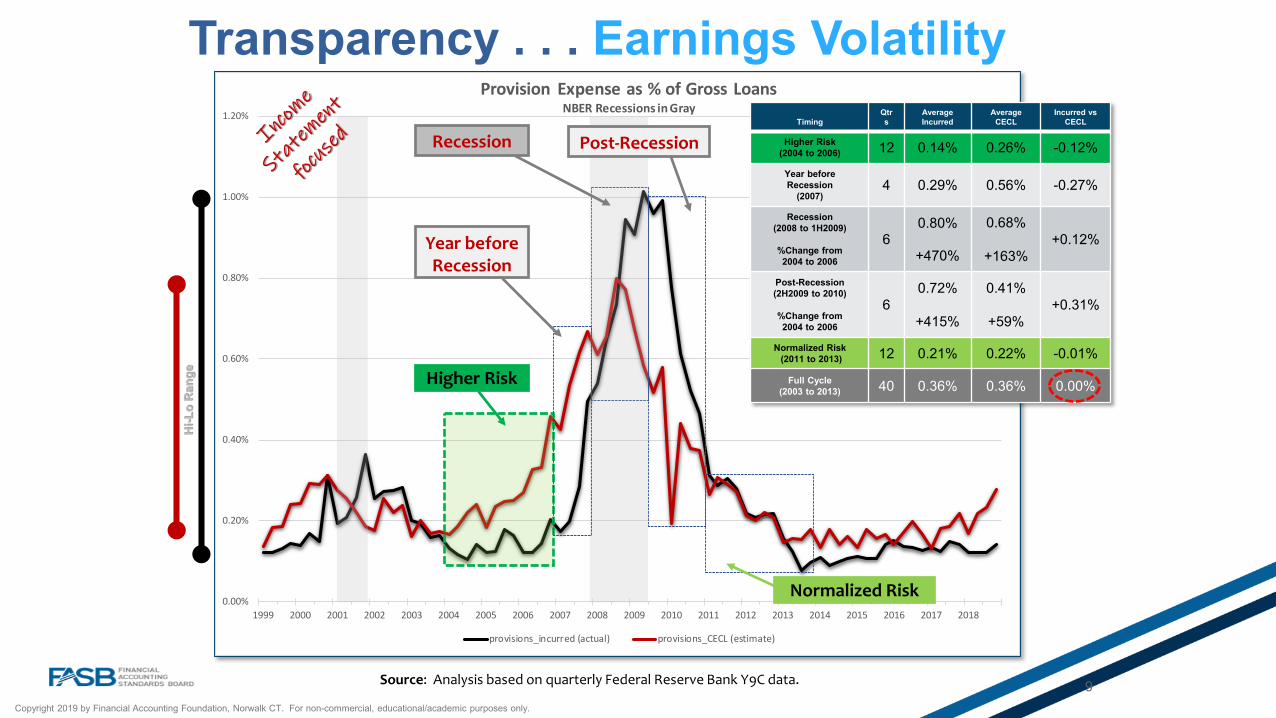
0.00%
0.20%
0.40%
0.60%
0.80%
1.00%
1.20%
1999 2000 2001 2002 2003 2004 2005 2006 2007 2008 2009 2010 2011 2012 2013 2014 2015 2016 2017 2018
Provision Expense as % of Gross LoansNBER Recessions in Gray
provisions_incurred (actual) provisions_CECL (estimate)
9
Year before Recession
Source: Analysis based on quarterly Federal Reserve Bank Y9C data.
Recession Post-Recession
Higher Risk
Normalized Risk
TimingQtrs
Average Incurred
Average CECL
Incurred vs CECL
Higher Risk (2004 to 2006) 12 0.14% 0.26% -0.12%
Year before Recession
(2007)4 0.29% 0.56% -0.27%
Recession(2008 to 1H2009)
%Change from 2004 to 2006
60.80%
+470%
0.68%
+163%+0.12%
Post-Recession(2H2009 to 2010)
%Change from 2004 to 2006
60.72%
+415%
0.41%
+59%+0.31%
Normalized Risk(2011 to 2013) 12 0.21% 0.22% -0.01%
Full Cycle(2003 to 2013) 40 0.36% 0.36% 0.00%
Transparency . . . Earnings Volatility
Hi-L
o R
ange
Copyright 2019 by Financial Accounting Foundation, Norwalk CT. For non-commercial, educational/academic purposes only.
0.00%
1.00%
2.00%
3.00%
4.00%
5.00%
6.00%
1999 2000 2001 2002 2003 2004 2005 2006 2007 2008 2009 2010 2011 2012 2013 2014 2015 2016 2017 2018
Allowance as % of Gross LoansNBER Recessions in Gray
alll_incurred (actual) acl_cecl_(estimate)
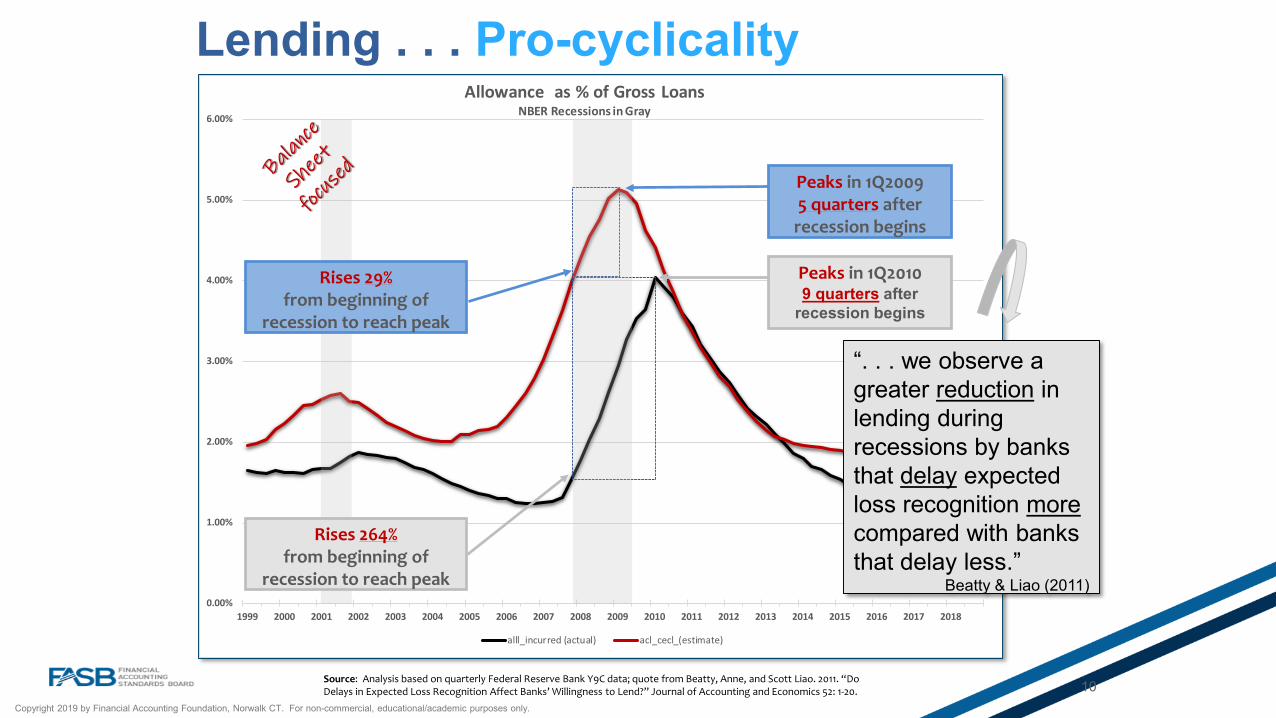
Lending . . . Pro-cyclicality
10
Rises 29%from beginning of
recession to reach peak
Peaks in 1Q2009 5 quarters after
recession begins
Source: Analysis based on quarterly Federal Reserve Bank Y9C data; quote from Beatty, Anne, and Scott Liao. 2011. “Do Delays in Expected Loss Recognition Affect Banks’ Willingness to Lend?” Journal of Accounting and Economics 52: 1-20.
Rises 264%from beginning of
recession to reach peak
“. . . we observe a greater reduction in lending during recessions by banks that delay expected loss recognition morecompared with banks that delay less.”
Beatty & Liao (2011)
Peaks in 1Q2010 9 quarters after
recession begins
Copyright 2019 by Financial Accounting Foundation, Norwalk CT. For non-commercial, educational/academic purposes only.
-5.0%
-2.5%
0.0%
2.5%
5.0%
7.5%
10.0%
12.5%
-$50
-$25
$0
$25
$50
$75
$100
$125
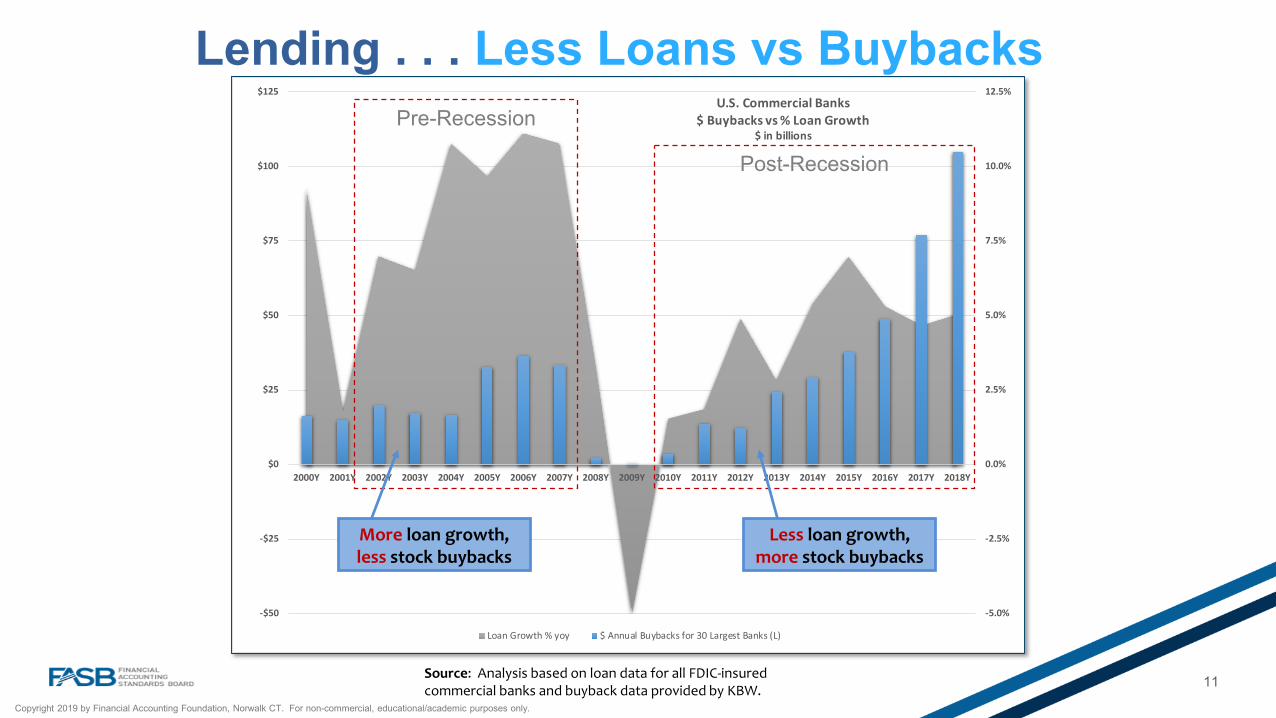
2000Y 2001Y 2002Y 2003Y 2004Y 2005Y 2006Y 2007Y 2008Y 2009Y 2010Y 2011Y 2012Y 2013Y 2014Y 2015Y 2016Y 2017Y 2018Y
U.S. Commercial Banks$ Buybacks vs % Loan Growth
$ in billions
Loan Growth % yoy $ Annual Buybacks for 30 Largest Banks (L)
11
Lending . . . Less Loans vs Buybacks
Post-Recession
Less loan growth, more stock buybacks
Pre-Recession
More loan growth, less stock buybacks
Source: Analysis based on loan data for all FDIC-insured commercial banks and buyback data provided by KBW.
Copyright 2019 by Financial Accounting Foundation, Norwalk CT. For non-commercial, educational/academic purposes only.
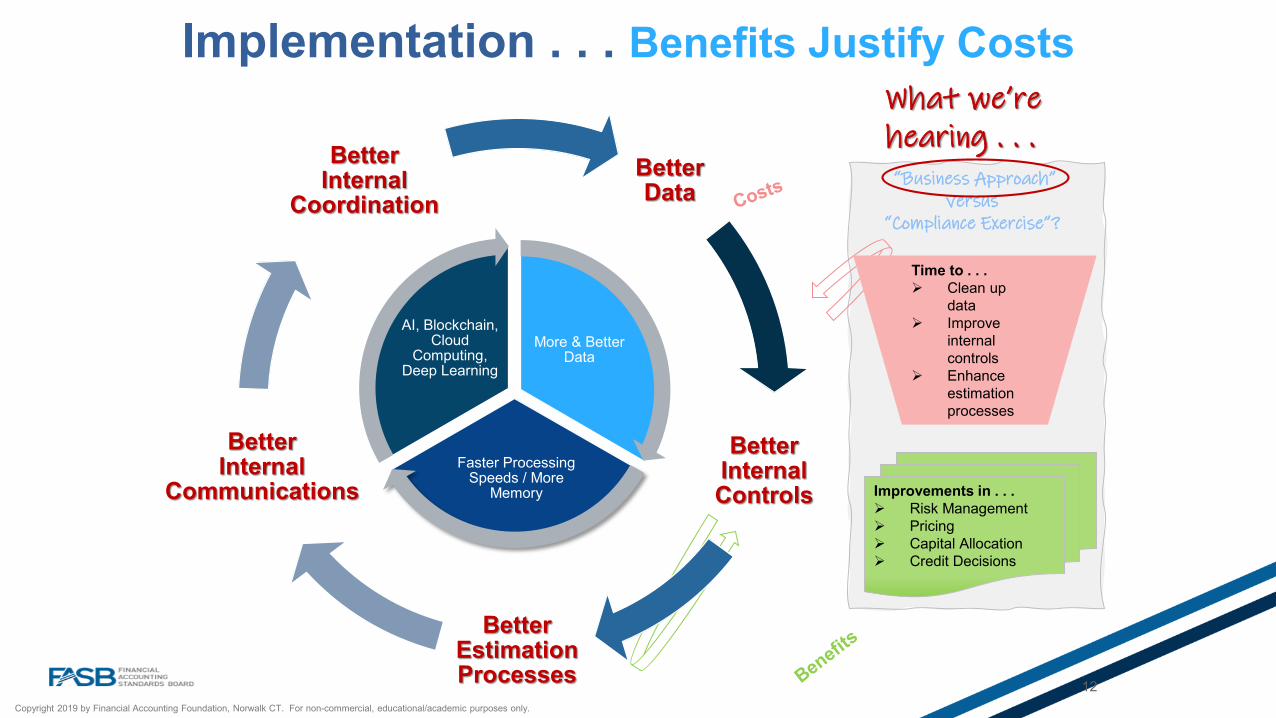
Better Data
Better Internal Controls
Better Estimation Processes
Better Internal
Communications
Better Internal
Coordination
12
Improvements in . . . Risk Management Pricing Capital Allocation Credit Decisions
Time to . . . Clean up
data Improve
internal controls
Enhance estimation processes
More & Better Data
Faster Processing Speeds / More
Memory
AI, Blockchain, Cloud
Computing, Deep Learning
Implementation . . . Benefits Justify Costs
“Business Approach” versus
“Compliance Exercise”?
What we’re hearing . . .
Copyright 2019 by Financial Accounting Foundation, Norwalk CT. For non-commercial, educational/academic purposes only.
13
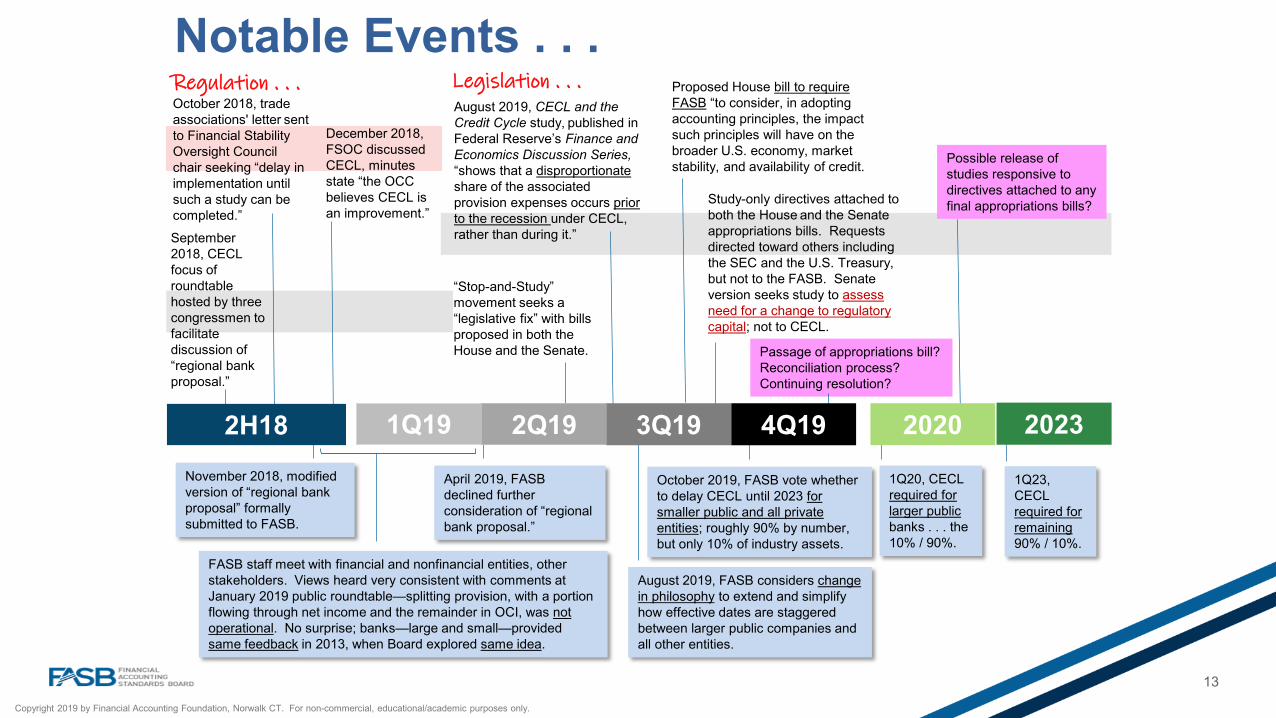
2023
December 2018, FSOC discussed CECL, minutes state “the OCC believes CECL is an improvement.”
“Stop-and-Study” movement seeks a “legislative fix” with bills proposed in both the House and the Senate.
1Q23, CECL required for remaining90% / 10%.
1Q20, CECL required for larger publicbanks . . . the10% / 90%.
October 2018, trade associations' letter sent to Financial Stability Oversight Council chair seeking “delay in implementation until such a study can be completed.”
November 2018, modified version of “regional bank proposal” formally submitted to FASB.
Notable Events . . .
September 2018, CECL focus of roundtable hosted by three congressmen to facilitate discussion of “regional bank proposal.”
FASB staff meet with financial and nonfinancial entities, other stakeholders. Views heard very consistent with comments at January 2019 public roundtable—splitting provision, with a portion flowing through net income and the remainder in OCI, was not operational. No surprise; banks—large and small—provided same feedback in 2013, when Board explored same idea.
1Q19 2Q19
April 2019, FASB declined further consideration of “regional bank proposal.”
August 2019, CECL and the Credit Cycle study, published in Federal Reserve’s Finance and Economics Discussion Series,“shows that a disproportionateshare of the associated provision expenses occurs prior to the recession under CECL, rather than during it.”
October 2019, FASB vote whether to delay CECL until 2023 for smaller public and all private entities; roughly 90% by number, but only 10% of industry assets.
Study-only directives attached to both the House and the Senate appropriations bills. Requests directed toward others including the SEC and the U.S. Treasury, but not to the FASB. Senate version seeks study to assess need for a change to regulatory capital; not to CECL.
3Q192H18
Possible release of studies responsive to directives attached to any final appropriations bills?
2020
Proposed House bill to require FASB “to consider, in adopting accounting principles, the impact such principles will have on the broader U.S. economy, market stability, and availability of credit.
Legislation . . . Regulation . . .
August 2019, FASB considers change in philosophy to extend and simplify how effective dates are staggered between larger public companies and all other entities.
Passage of appropriations bill? Reconciliation process? Continuing resolution?
4Q19
aba.com1-800-BANKERS
Michael GulletteSenior Vice President
Ross and Salomon Roundtable on Current Expected Credit LossesNYU Stern School of Business
October 28, 2019
aba.com1-800-BANKERS
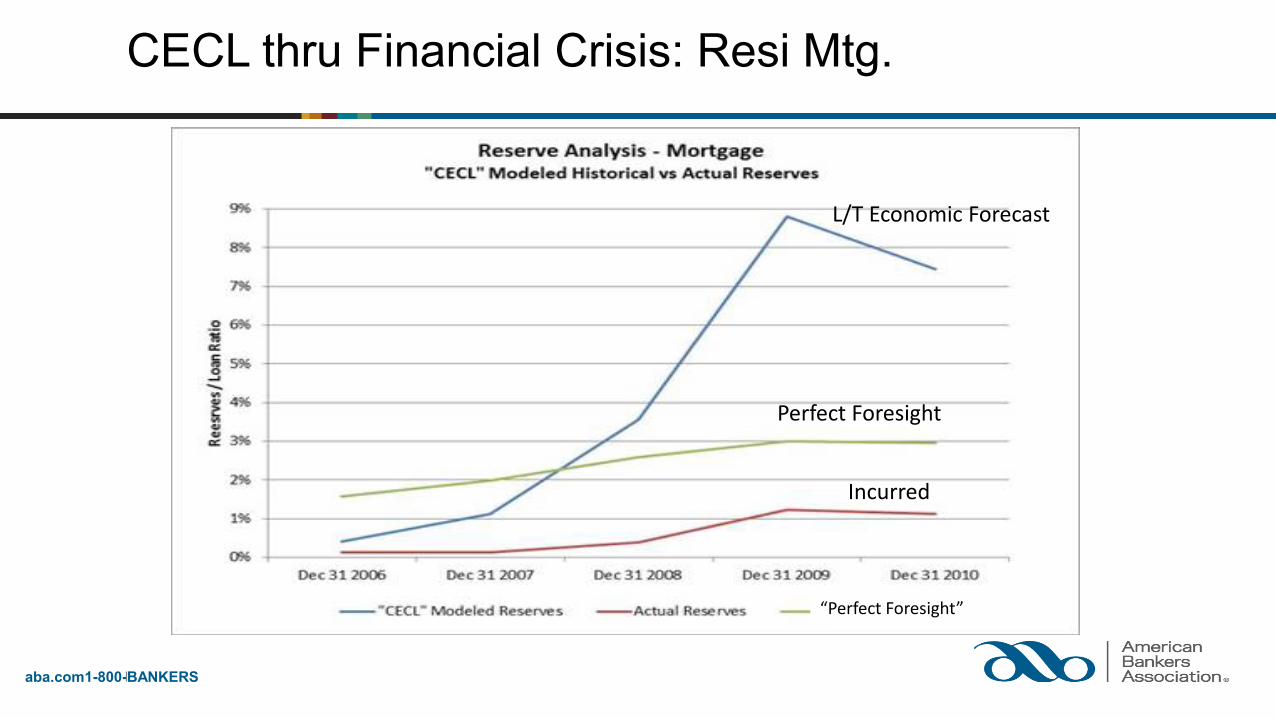
CECL thru Financial Crisis: Resi Mtg.
“Perfect Foresight”
Perfect Foresight
L/T Economic Forecast
Incurred
aba.com1-800-BANKERS
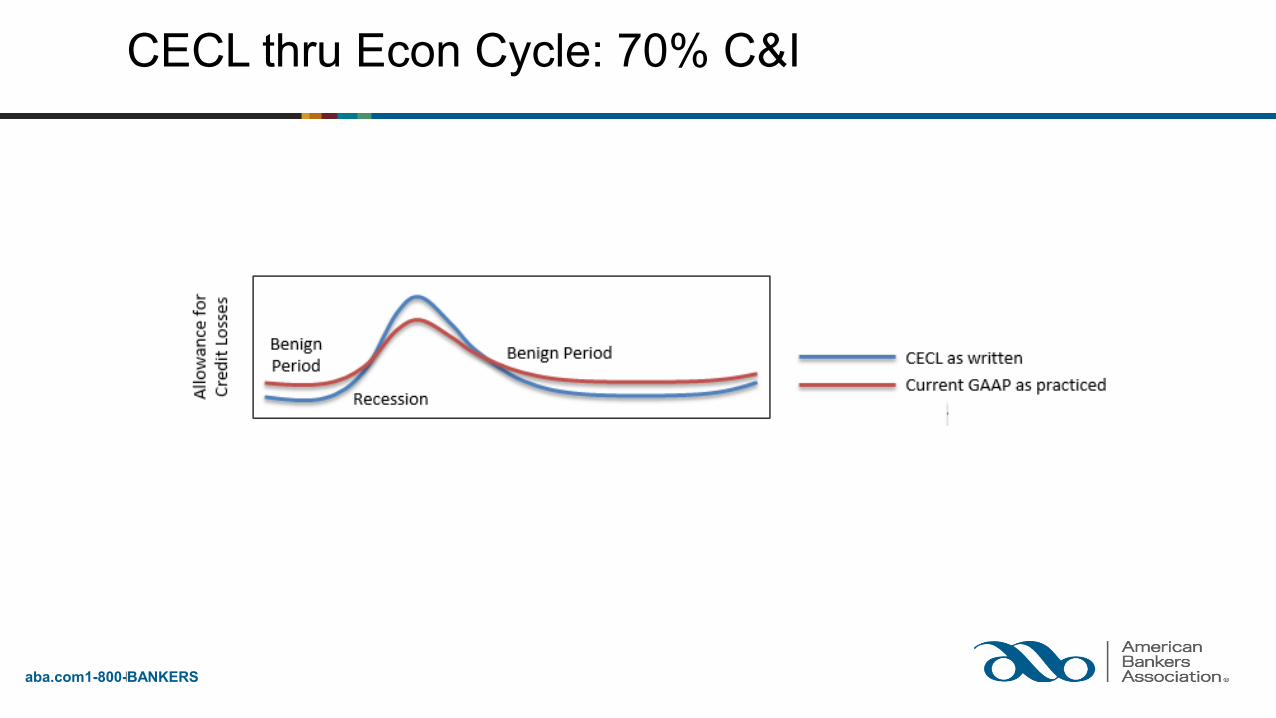
CECL thru Econ Cycle: 70% C&I
aba.com1-800-BANKERS
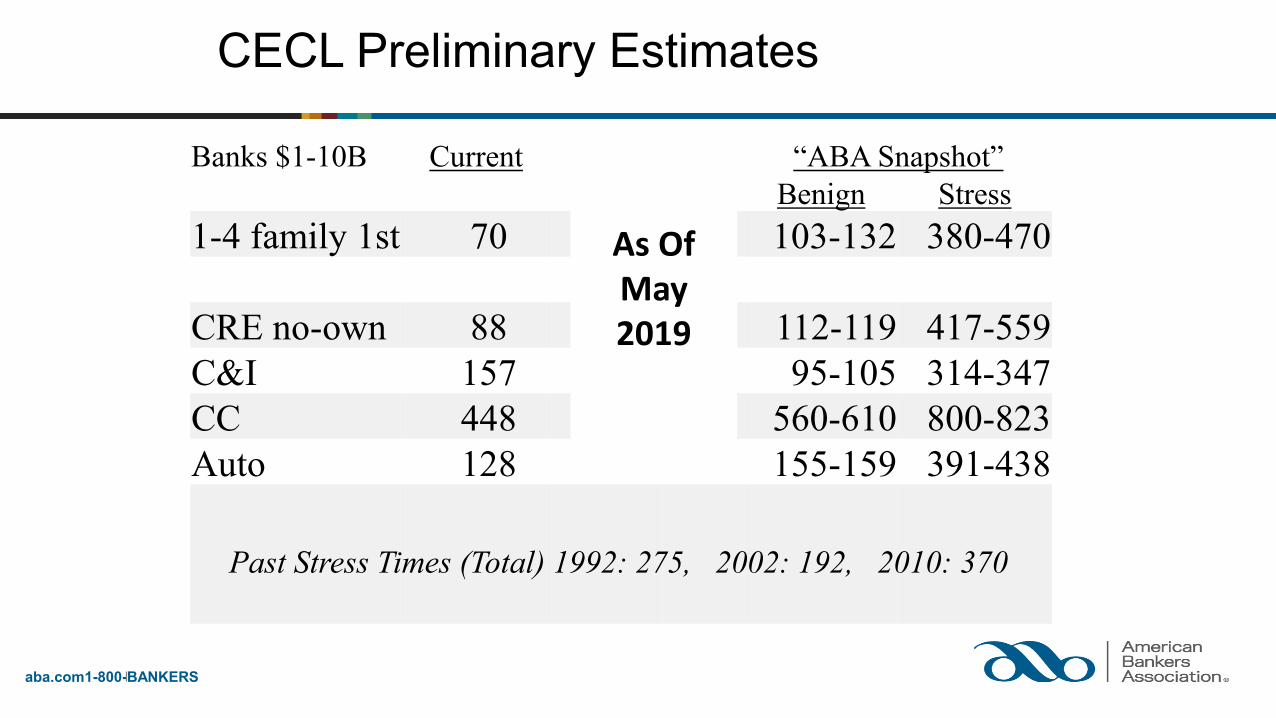
CECL Preliminary Estimates
Banks $1-10B Current WARM % “ABA Snapshot”Low High Benign Stress
1-4 family 1st 70 12 69 103-132 380-470
CRE no-own 88 4 18 112-119 417-559C&I 157 1 3 95-105 314-347CC 448 365 601 560-610 800-823Auto 128 80 135 155-159 391-438
Past Stress Times (Total) 1992: 275, 2002: 192, 2010: 370
As Of May 2019
CECL RoundtableJoshua Ronen
October 28, 2019
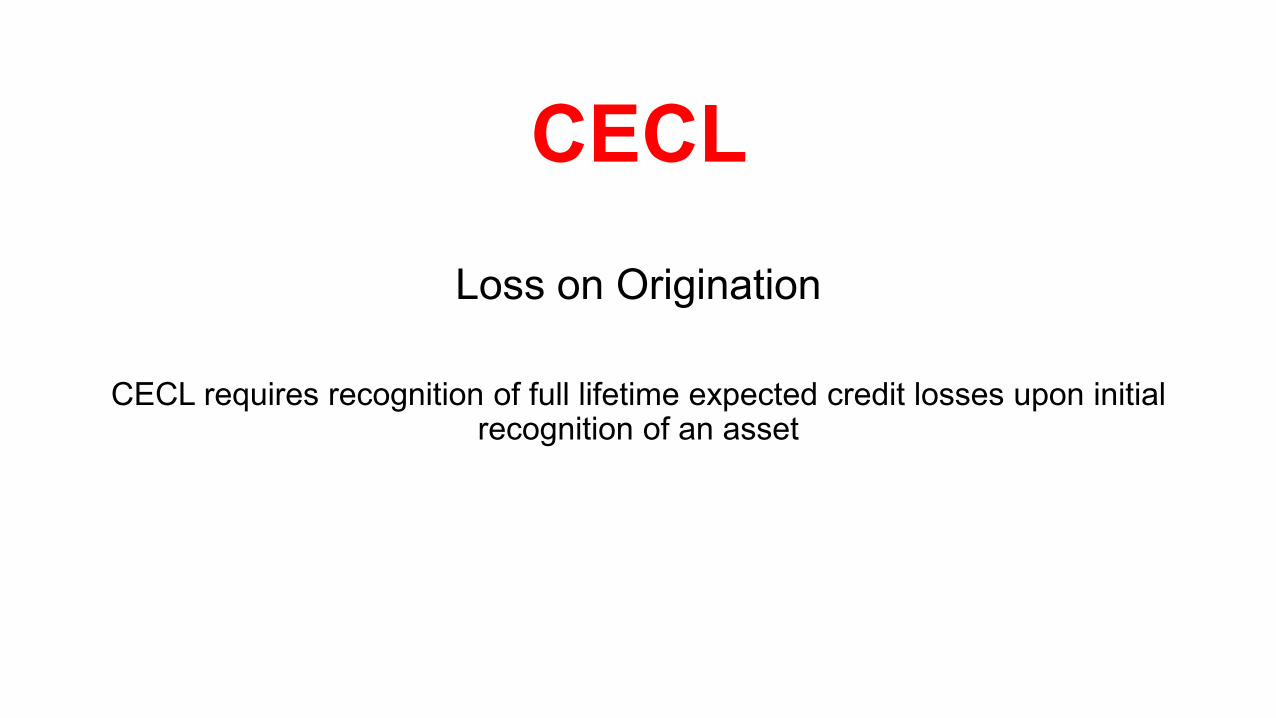
CECL Loss on Origination
CECL requires recognition of full lifetime expected credit losses upon initial recognition of an asset
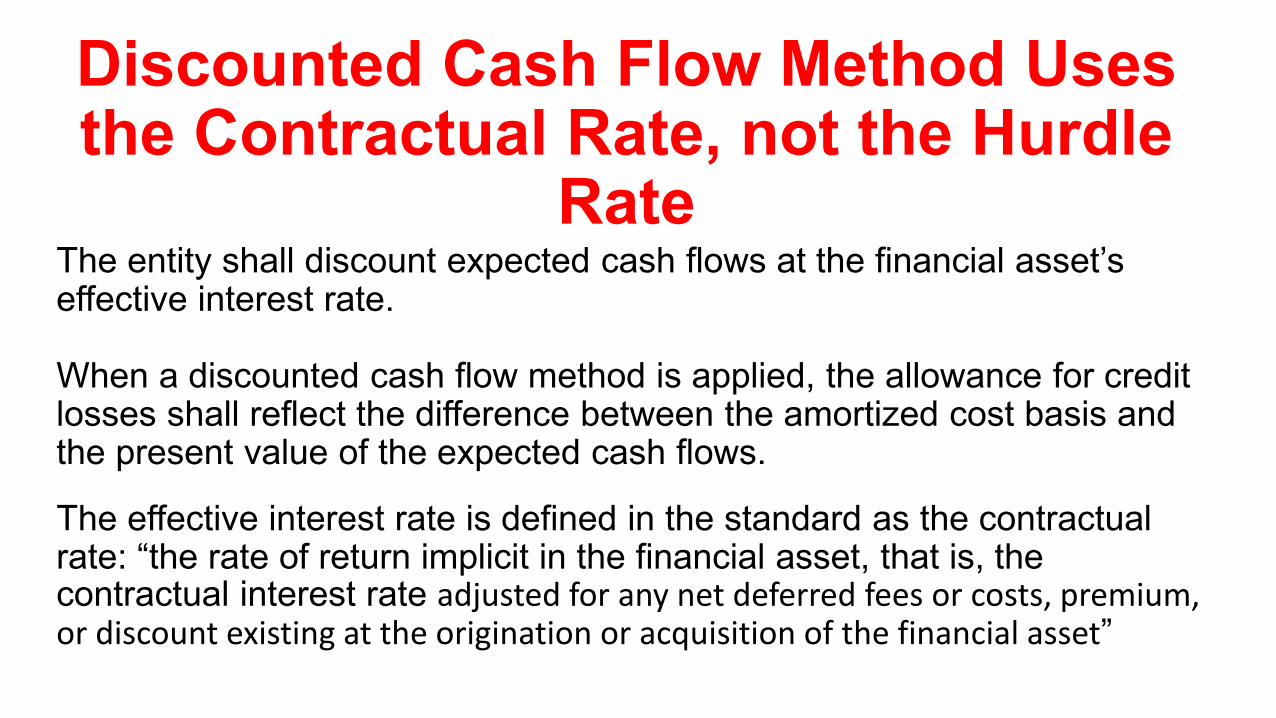
Discounted Cash Flow Method Uses the Contractual Rate, not the Hurdle
RateThe entity shall discount expected cash flows at the financial asset’s effective interest rate.
When a discounted cash flow method is applied, the allowance for credit losses shall reflect the difference between the amortized cost basis and the present value of the expected cash flows.
The effective interest rate is defined in the standard as the contractual rate: “the rate of return implicit in the financial asset, that is, the contractual interest rate adjusted for any net deferred fees or costs, premium, or discount existing at the origination or acquisition of the financial asset”
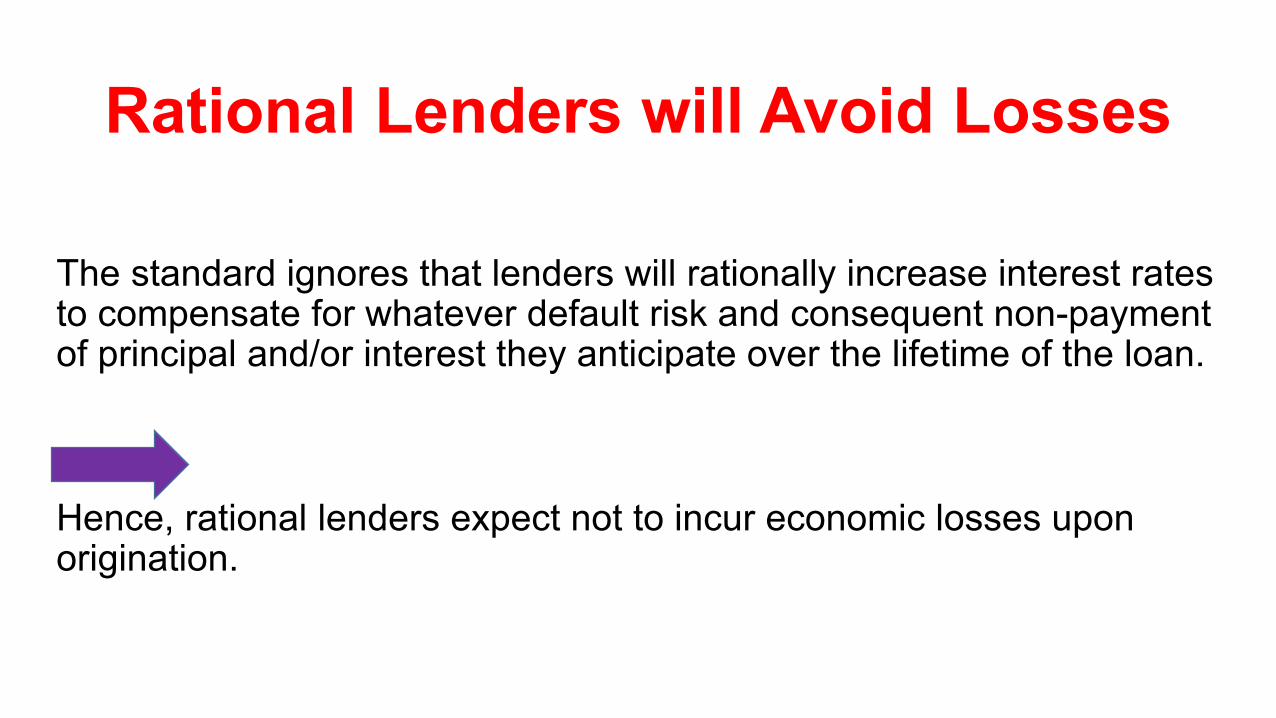
Rational Lenders will Avoid Losses
The standard ignores that lenders will rationally increase interest rates to compensate for whatever default risk and consequent non-payment of principal and/or interest they anticipate over the lifetime of the loan.
Hence, rational lenders expect not to incur economic losses upon origination.

Hypothetical Loan ExampleLoan of $1000 with 3-year maturity, a face value of $1000 and annual interest payments:
● Hurdle rate assuming no expected non-collections: 10%
● Expect non-collection of $100 of principal on maturity
● Contractual rate: 13.0213% to make lender whole
● Annual interest expected to be fully received over the 3 years
PV at 10% discount rate = $1000, the amount of loan extended.
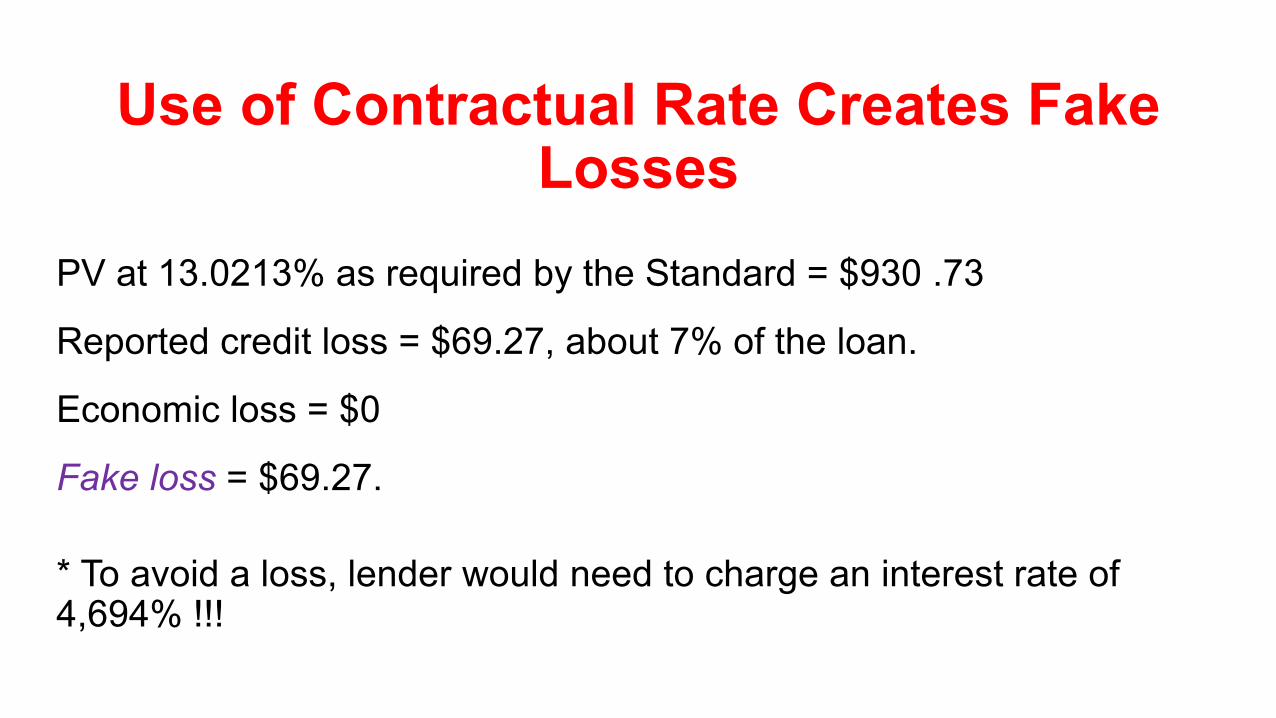
Use of Contractual Rate Creates Fake Losses
PV at 13.0213% as required by the Standard = $930 .73
Reported credit loss = $69.27, about 7% of the loan.
Economic loss = $0
Fake loss = $69.27.
* To avoid a loss, lender would need to charge an interest rate of 4,694% !!!
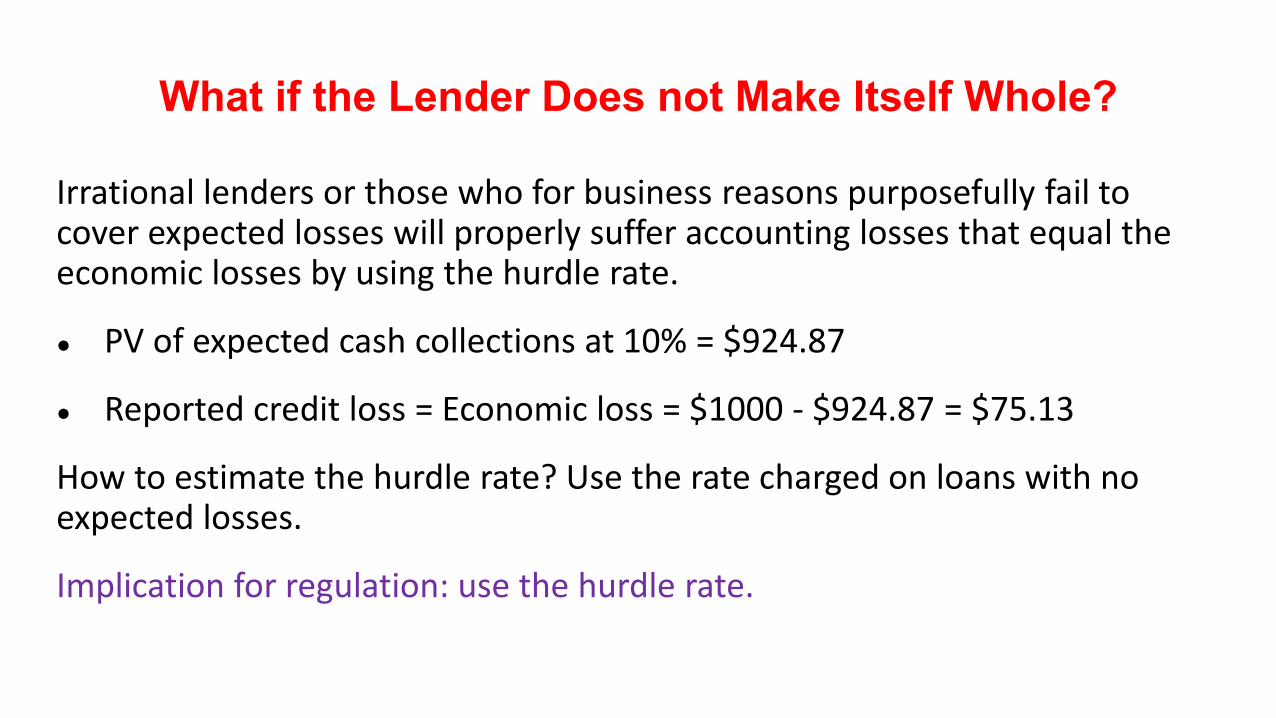
What if the Lender Does not Make Itself Whole?
Irrational lenders or those who for business reasons purposefully fail to cover expected losses will properly suffer accounting losses that equal the economic losses by using the hurdle rate.
● PV of expected cash collections at 10% = $924.87
● Reported credit loss = Economic loss = $1000 - $924.87 = $75.13
How to estimate the hurdle rate? Use the rate charged on loans with no expected losses.
Implication for regulation: use the hurdle rate.
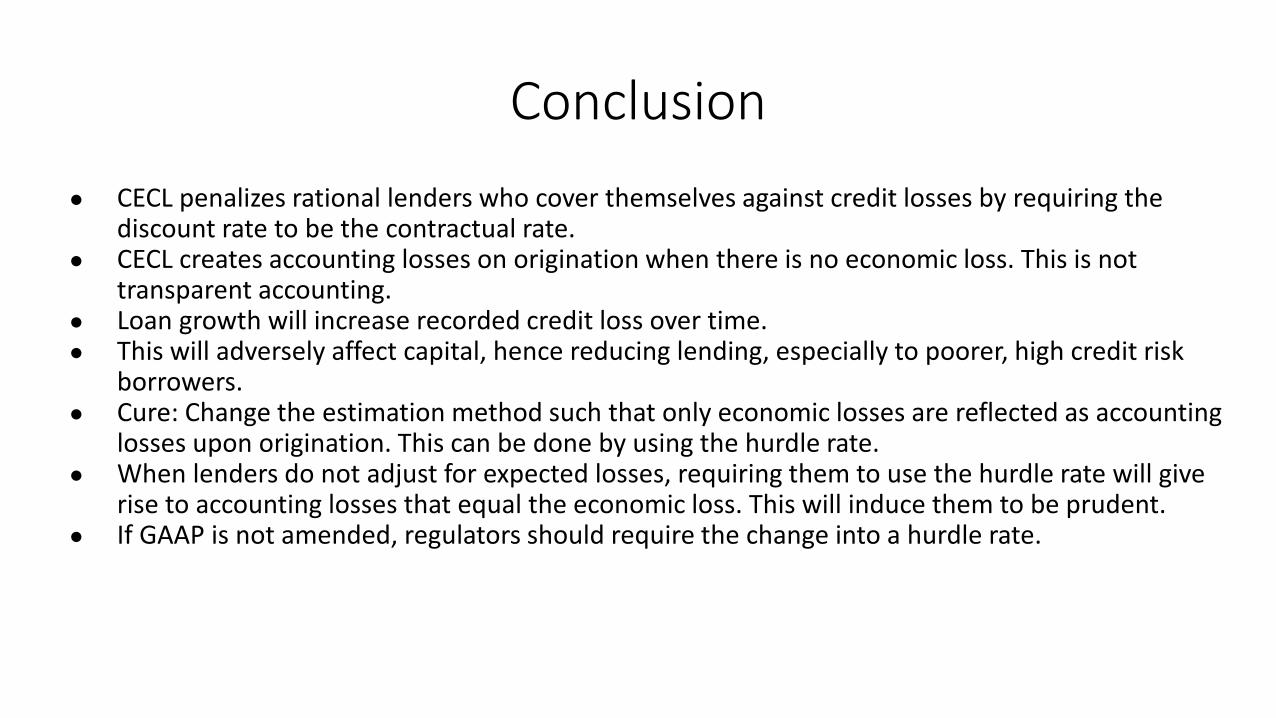
Conclusion● CECL penalizes rational lenders who cover themselves against credit losses by requiring the
discount rate to be the contractual rate.● CECL creates accounting losses on origination when there is no economic loss. This is not
transparent accounting.● Loan growth will increase recorded credit loss over time.● This will adversely affect capital, hence reducing lending, especially to poorer, high credit risk
borrowers.● Cure: Change the estimation method such that only economic losses are reflected as accounting
losses upon origination. This can be done by using the hurdle rate.● When lenders do not adjust for expected losses, requiring them to use the hurdle rate will give
rise to accounting losses that equal the economic loss. This will induce them to be prudent.● If GAAP is not amended, regulators should require the change into a hurdle rate.

NYU CECL Roundtable
October, 2019Maria Mazilu, VP, Senior Accounting Analyst
NYU CECL Roundtable, October 2019 28
» Earlier
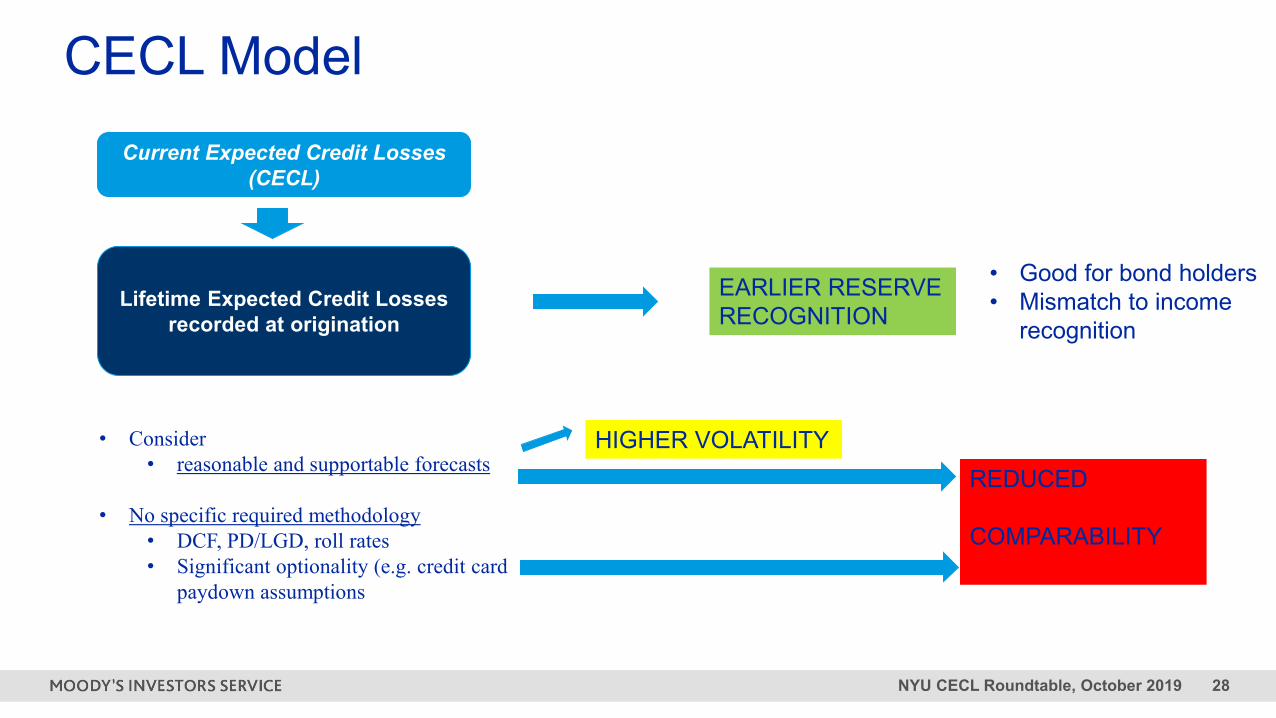
CECL ModelCurrent Expected Credit Losses
(CECL)
Lifetime Expected Credit Losses recorded at origination
• Consider • reasonable and supportable forecasts
• No specific required methodology • DCF, PD/LGD, roll rates • Significant optionality (e.g. credit card
paydown assumptions
EARLIER RESERVE RECOGNITION
REDUCED
COMPARABILITY
HIGHER VOLATILITY
• Good for bond holders• Mismatch to income
recognition

NYU CECL Roundtable, October 2019 29
Moody’s Banking Methodology – Financial Profile
NYU CECL Roundtable, October 2019 30
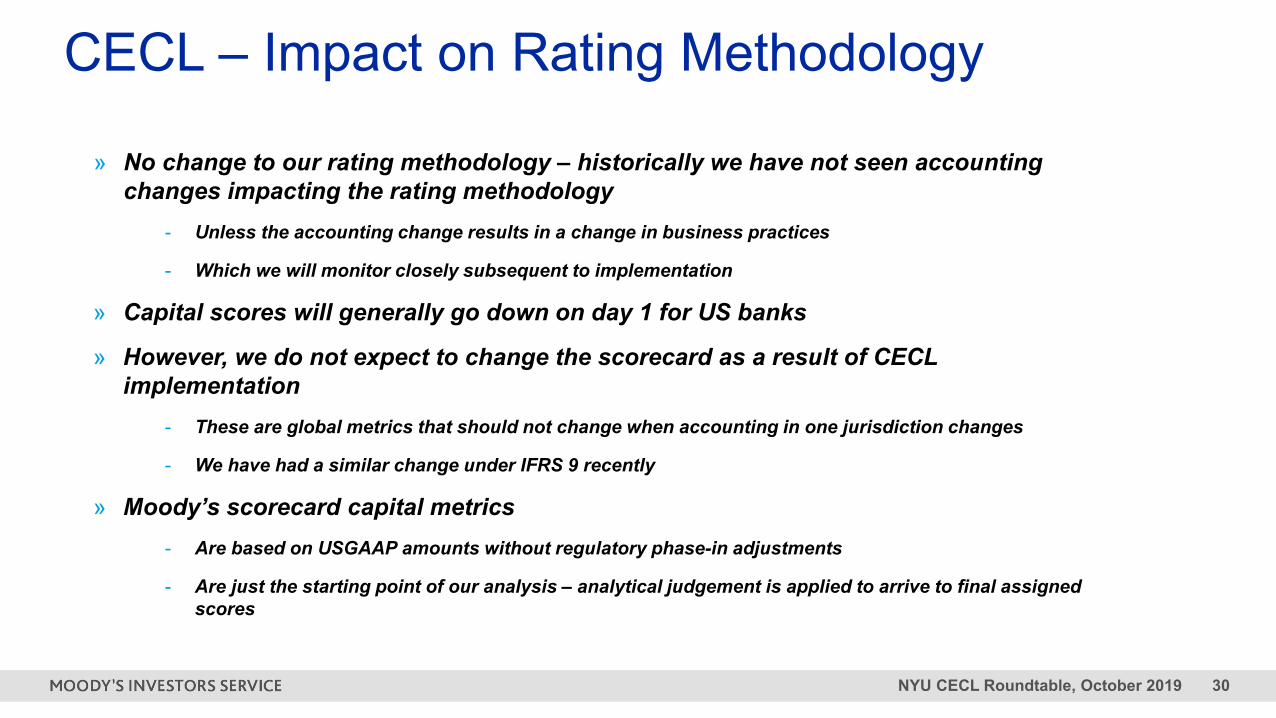
» No change to our rating methodology – historically we have not seen accounting changes impacting the rating methodology
- Unless the accounting change results in a change in business practices
- Which we will monitor closely subsequent to implementation
» Capital scores will generally go down on day 1 for US banks
» However, we do not expect to change the scorecard as a result of CECL implementation
- These are global metrics that should not change when accounting in one jurisdiction changes
- We have had a similar change under IFRS 9 recently
» Moody’s scorecard capital metrics - Are based on USGAAP amounts without regulatory phase-in adjustments
- Are just the starting point of our analysis – analytical judgement is applied to arrive to final assigned scores
CECL – Impact on Rating Methodology
NYU CECL Roundtable, October 2019 31
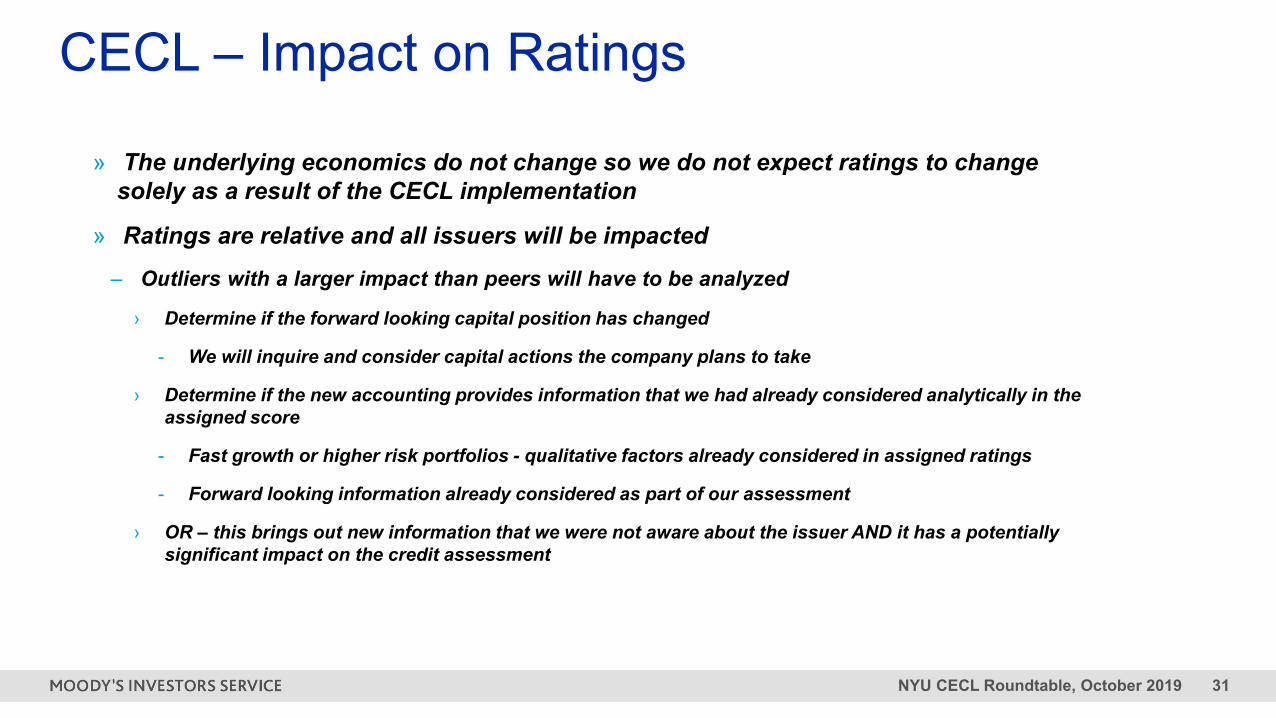
» The underlying economics do not change so we do not expect ratings to change solely as a result of the CECL implementation
» Ratings are relative and all issuers will be impacted
– Outliers with a larger impact than peers will have to be analyzed
› Determine if the forward looking capital position has changed
- We will inquire and consider capital actions the company plans to take
› Determine if the new accounting provides information that we had already considered analytically in the assigned score
- Fast growth or higher risk portfolios - qualitative factors already considered in assigned ratings
- Forward looking information already considered as part of our assessment
› OR – this brings out new information that we were not aware about the issuer AND it has a potentially significant impact on the credit assessment
CECL – Impact on Ratings

Global Credit Databy banks for banks
US Current Expected Credit Losses (CECL) Industry Benchmark Study
Project review for NYUNathaniel Royal, Global Credit Data

Global Credit Data
CECL Benchmarking: Methodology & ApproachTemplate: Hypothetical Portfolio
02/07/2019 34Confidential – CECL Benchmark Study Kick-off
The hypothetical portfolio is composed of a set of loans chosen to provide coverage of various types of asset classes/borrowers,exposures and facilities, fit to the US market.
ASSET CLASS / BORROWER TYPE
Residential MortgageHelocAuto
Personal UnsecuredCredit Cards
Large CorporatesMid Market
Business Banking CRE – IP, Construction
OBLIGOR
Credit QualityIndustry
Geography
EXPOSURE
EAD RangeAvg. Usage
O/SLimit
Revolver / TermReference Rate
Maturity
FACILITY
LGD RangeFacility Type
Secured / Unsecured
PERMUTATIONS BY ASSET CLASS / BORROWER
Residential Mortgage 64Heloc 16Auto 32
Personal Unsecured 18Credit Cards 64
Large Corporates 12Mid Market 12
Business Banking 12CRE – Income Producing,
Construction 4
Illustrative(Large Corporates)
Obs# Geography Credit Loan Secured Origination Revolver Loan Amortization Interest Rate Reference Interest Historical Annualized Loss Lifetime R&S Period Mean
Reversion PeriodQuality Term Type Exposure Utilization Type Method Type Curve Rate Loss Rate Prepayment Rate Estimate ECL ECL
1 U.S. A 1 Secured 1,000,000 0.5 Revolver Revolving Floating LIBOR 2.75%+50bps 5 bps
2 U.S. BB 1 Secured 1,000,000 0.5 Revolver Revolving Floating LIBOR 2.75%+100bps 30 bps
3 U.S. A 3 Secured 1,000,000 Term Linear Fixed 4.00% 5 bps
4 U.S. BB 3 Secured 1,000,000 Term Linear Fixed 5.00% 30 bps
5 U.S. A 5 Secured 1,000,000 Term Linear Fixed 4.50% 5 bps
6 U.S. BB 5 Secured 1,000,000 Term Linear Fixed 5.50% 30 bps
7 U.S. A 1 Senior Unsecured 1,000,000 0.5 Revolver Revolving Floating LIBOR 2.75%+50bps 5 bps
8 U.S. BB 1 Senior Unsecured 1,000,000 0.5 Revolver Revolving Floating LIBOR 2.75%+100bps 30 bps
9 U.S. A 3 Senior Unsecured 1,000,000 Term Linear Fixed 4.00% 5 bps
10 U.S. BB 3 Senior Unsecured 1,000,000 Term Linear Fixed 5.00% 30 bps
11 U.S. A 5 Senior Unsecured 1,000,000 Term Linear Fixed 4.50% 5 bps
12 U.S. BB 5 Senior Unsecured 1,000,000 Term Linear Fixed 5.50% 30 bps
Global Credit Data
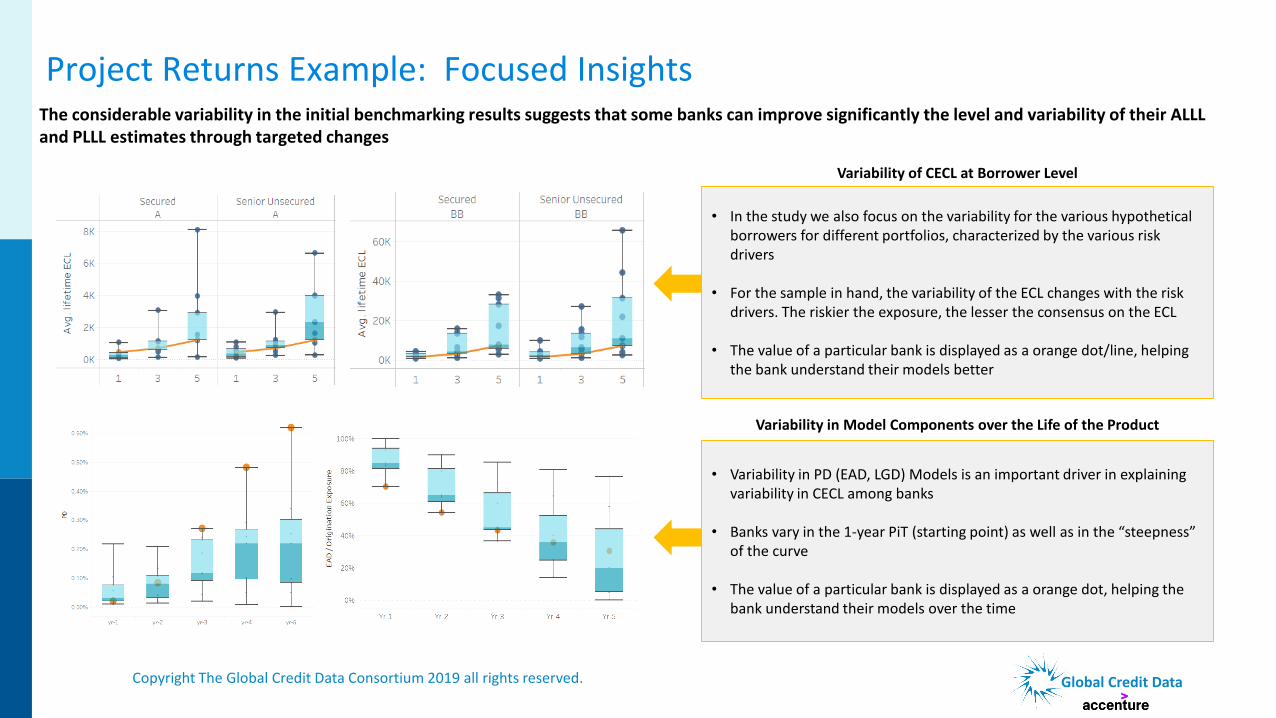
The considerable variability in the initial benchmarking results suggests that some banks can improve significantly the level and variability of their ALLL and PLLL estimates through targeted changes
Variability in Model Components over the Life of the Product
• Variability in PD (EAD, LGD) Models is an important driver in explaining variability in CECL among banks
• Banks vary in the 1-year PiT (starting point) as well as in the “steepness” of the curve
• The value of a particular bank is displayed as a orange dot, helping the bank understand their models over the time
Variability of CECL at Borrower Level
• In the study we also focus on the variability for the various hypothetical borrowers for different portfolios, characterized by the various risk drivers
• For the sample in hand, the variability of the ECL changes with the risk drivers. The riskier the exposure, the lesser the consensus on the ECL
• The value of a particular bank is displayed as a orange dot/line, helping the bank understand their models better
Copyright The Global Credit Data Consortium 2019 all rights reserved.
Project Returns Example: Focused Insights

Global Credit Data
• There is variability amongst banks on their losses; sometimes a great deal
• So what
• Oh no!
• The overall effect CECL will have on banks bottom lines
• No sure
• Modelers and their models
• But will the models be effective?
• Model use will depend on bank management.
• Are the parameters and scenarios used close enough to enough?
• Outlook: A post CECL returns future: examining each bank’s the methodology
• Who did it “better”
• Will cross-evaluation be effective in achieving better models?
The News
Copyright © 2019 Accenture. All rights reserved.
CECL RoundtableBobby Bean
Associate DirectorFDIC
FEDERAL DEPOSIT INSURANCE CORPORATIONOctober 28, 2019
The Effect of the Current Expected Credit LossStandard (CECL)
on the Timing and Comparability of Reserves
Sarah Chae, Robert Sarama, Cindy Vojtech, and James Wang
New York University, Stern School of Business
October 28, 2019
Chae, Sarama, Vojtech, and Wang (FRB) 10/28/19
Disclaimer
The views expressed in this presentation represent those of the authors,and are not necessarily those of the Federal Reserve Board or the Federal
Reserve System.
Chae, Sarama, Vojtech, and Wang (FRB) 10/28/19
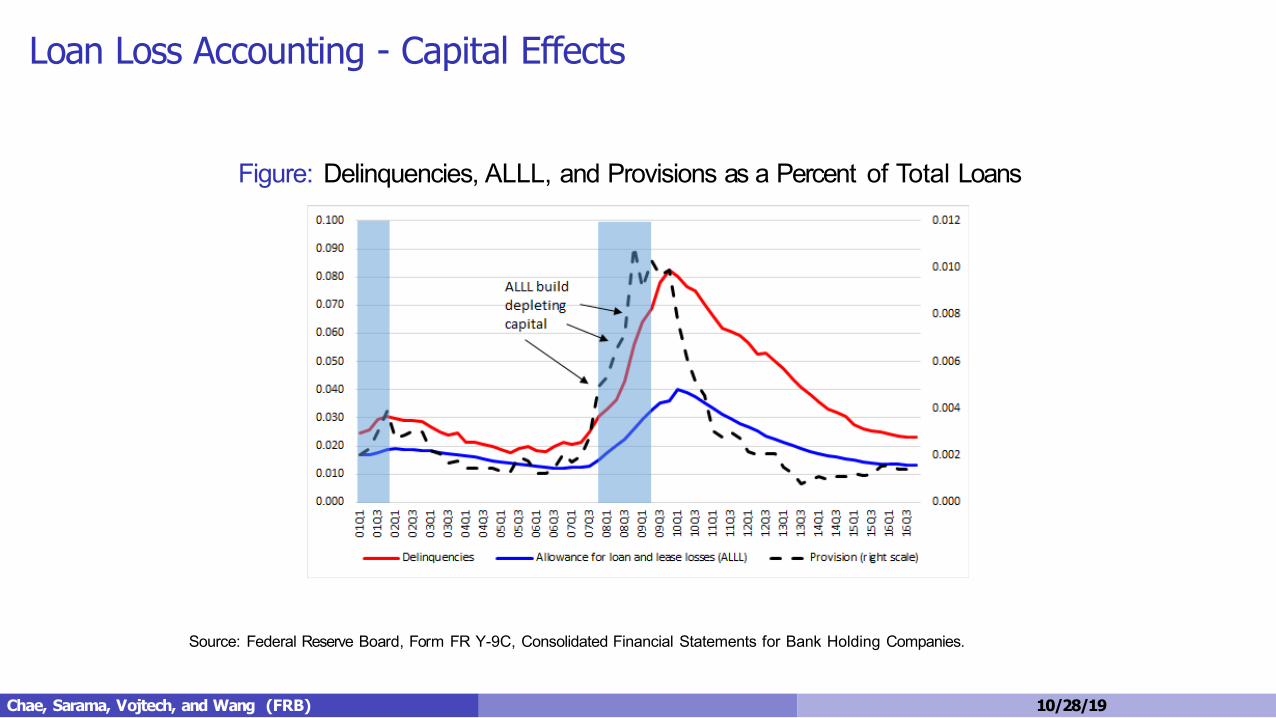
Loan Loss Accounting - Capital Effects
Figure: Delinquencies, ALLL, and Provisions as a Percent of Total Loans
Source: Federal Reserve Board, Form FR Y-9C, Consolidated Financial Statements for Bank Holding Companies.
Chae, Sarama, Vojtech, and Wang (FRB) 10/28/19

Empirical Design - OverviewCompare CECL to incurred in a simple stylized model
When and how fast are reserves built under CECL vs incurred?Examine the timing of peaks and the volatility of provisioning
What is the impact of different forecast assumptions on CECL?Ideal: Perfect forecast of the HPI pathOptimist: Constant 0.5% monthly HPI growthAR: HPI forecast using an autoregressive trendHybrid: 6 months of perfect forecast and then revert to flat
What is the impact of more frequently updating macro forecasts?24, 12, 6, 3 month scenario update cycles
Chae, Sarama, Vojtech, and Wang (FRB) 10/28/19
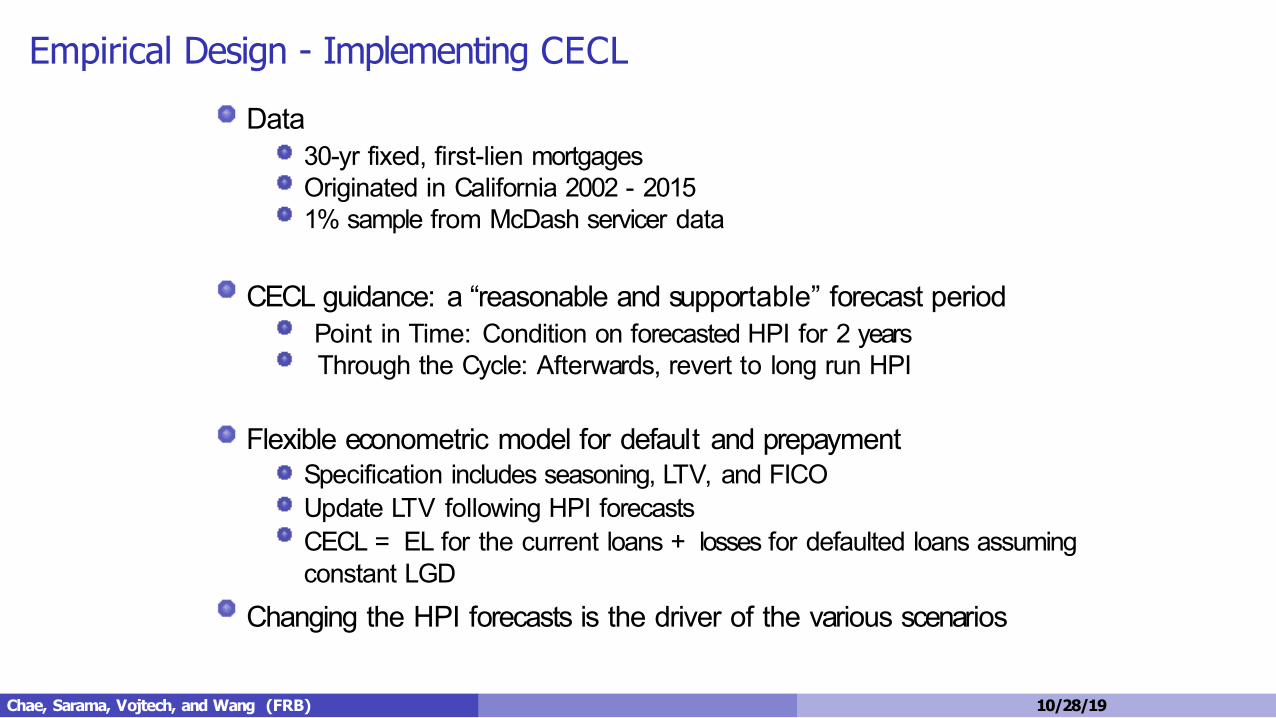
Empirical Design - Implementing CECLData
30-yr fixed, first-lien mortgagesOriginated in California 2002 - 20151% sample from McDash servicer data
CECL guidance: a “reasonable and supportable” forecast periodPoint in Time: Condition on forecasted HPI for 2 yearsThrough the Cycle: Afterwards, revert to long run HPI
Flexible econometric model for default and prepaymentSpecification includes seasoning, LTV, and FICOUpdate LTV following HPI forecastsCECL = EL for the current loans + losses for defaulted loans assumingconstant LGD
Changing the HPI forecasts is the driver of the various scenarios
Chae, Sarama, Vojtech, and Wang (FRB) 10/28/19

Interpolated Reserves and Idealized CECL - Perfect Foresight
Reserves under CECL are less procyclical and less volatile.
What if forecasts are not perfect?Chae, Sarama, Vojtech, and Wang (FRB) 10/28/19
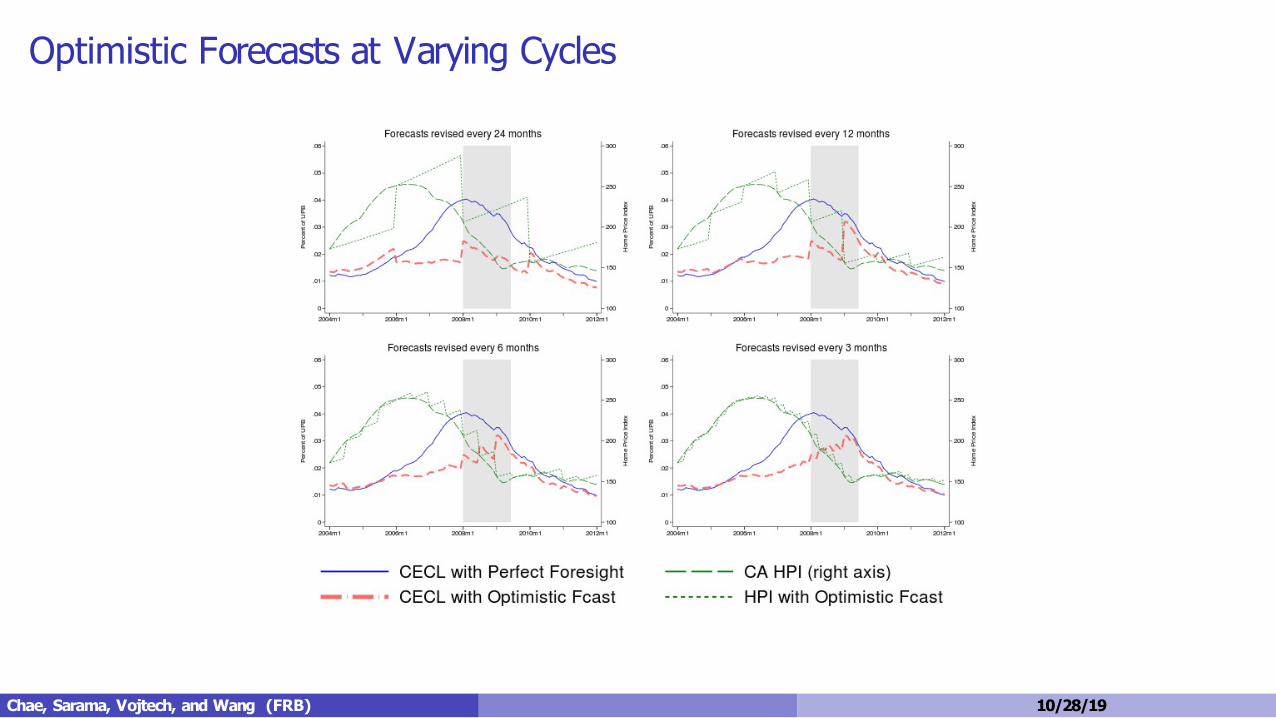
Optimistic Forecasts at Varying Cycles
Chae, Sarama, Vojtech, and Wang (FRB) 10/28/19
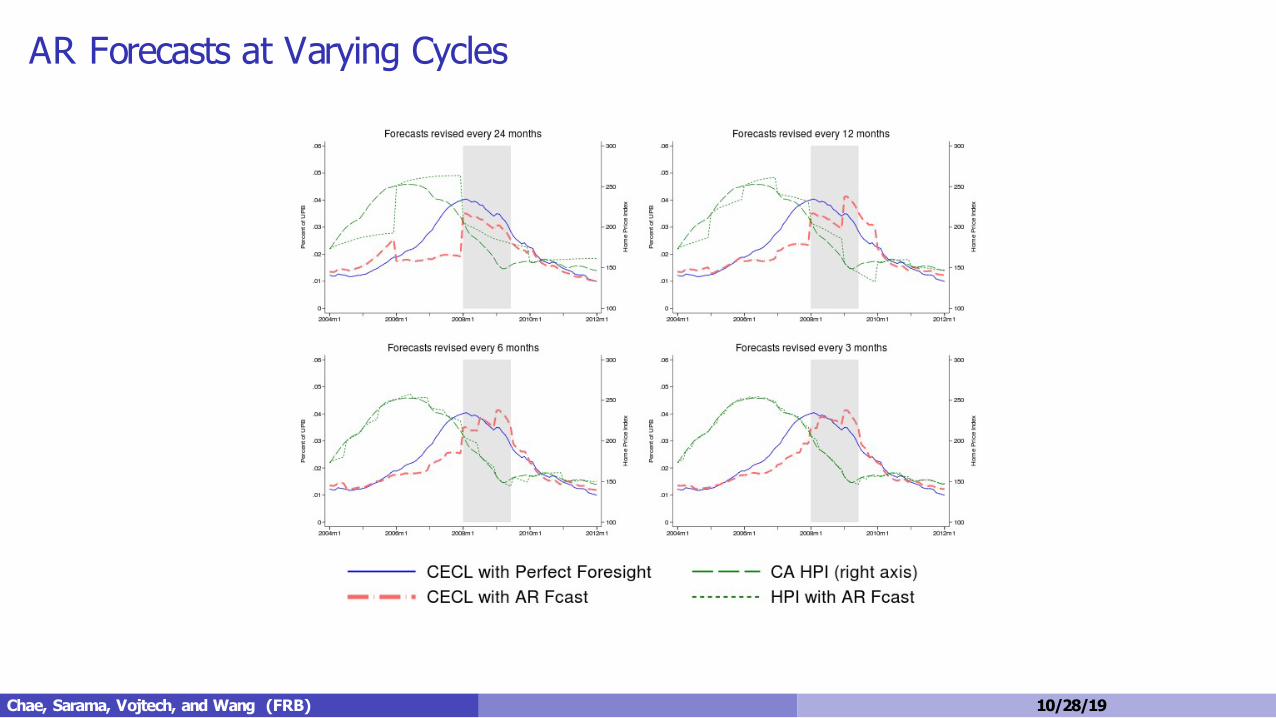
AR Forecasts at Varying Cycles
Chae, Sarama, Vojtech, and Wang (FRB) 10/28/19
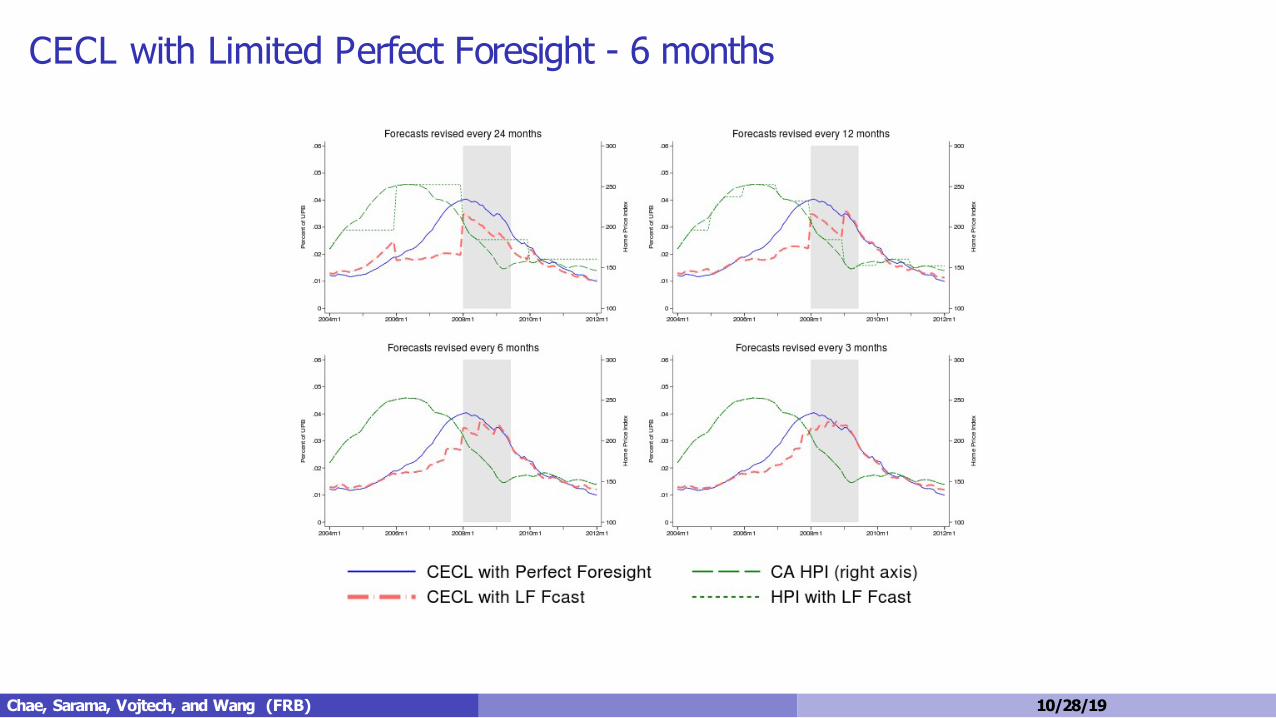
CECL with Limited Perfect Foresight - 6 months
Chae, Sarama, Vojtech, and Wang (FRB) 10/28/19

Forecast ComparisonNot too surprisingly, the optimistic forecast leads to the most delayedALLL build.
Chae, Sarama, Vojtech, and Wang (FRB) 10/28/19
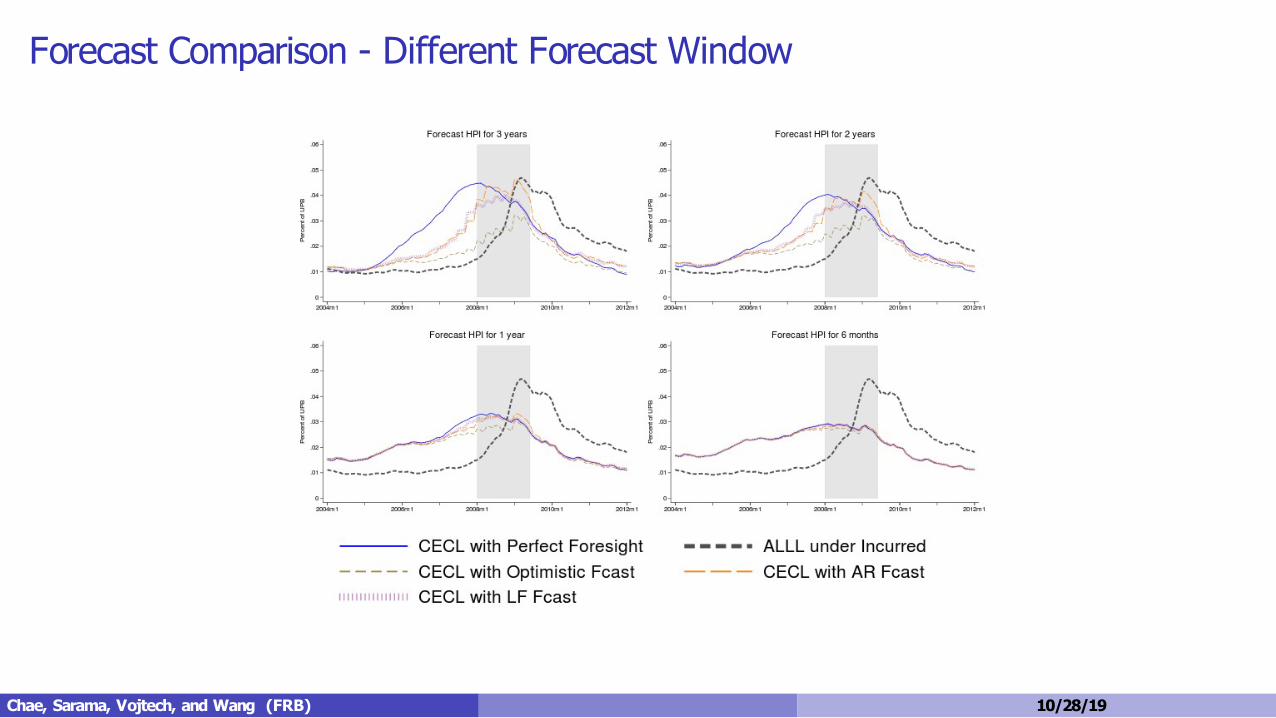
Forecast Comparison - Different Forecast Window
Chae, Sarama, Vojtech, and Wang (FRB) 10/28/19
Big PictureWhen setting provisions under CECL, risk managers need to becognizant of the importance of the scenario projections, models, andupdate cycles
With inaccurate forecasts (optimistic), CECL can lead to undesiredreserve buildup behavior even at frequent update frequenciesIf forecasts are relatively accurate, CECL seems to be less procyclicaland less volatile than ALLL under incurred losses
CaveatsMortgages have a fairly long loss emergence window, results may differfor loan losses that are quicker to deteriorate given stressModel was estimated through the cycle i.e. sensitivities based on moreinformation than risk managers would have had in 2006Results on procyclicality have ignored the impact on loan originationsLoss given default was assumed constant
Chae, Sarama, Vojtech, and Wang (FRB) 10/28/19

CECL RoundtableJason Jacobs
Head of Office of Accounting PolicyAIG
October 28, 2019

CECL RoundtableRobert Hetu
Head of US Private DebtCaisse de dépôt et placement du Québec
October 28, 2019