nyakeriga am and mcdonald m tennessee department of health
TRANSCRIPT
Nyakeriga AM and McDonald M
Tennessee Department of Health
Division of Family Health and Wellness
A Note to the Reader:
In some cases (particularly in looking at data at the regional level), the counts included in
this report are small and therefore may be statistically unreliable. Therefore, readers
should interpret all findings with caution. We especially encourage caution in interpreting
findings and comparing differences across regions.
If you have questions about particular data points or need assistance in interpreting the
data, please contact Alice M. Nyakeriga, PhD, MPH.
Phone: (615) 253-2655
Email: [email protected]

Table of Contents
List of Tables ......................................................................................................................................... i
List of Figures ....................................................................................................................................... ii
Executive Summary ............................................................................................................................. 1
Introduction ......................................................................................................................................... 2
Statewide Data ..................................................................................................................................... 3
Case Reports .................................................................................................................................... 3
Number and Rate of Cases ............................................................................................................ 3
Source of Exposure for NAS Infants ................................................................................................. 5
Source of Exposure ......................................................................................................................... 5
Regional Data .................................................................................................................................... 10
NAS Incidence by Region ............................................................................................................. 10
Exposure Source by Region ........................................................................................................ 10
Non-Residential NAS Cases............................................................................................................. 18
Conclusion ......................................................................................................................................... 20
Acknowledgements .......................................................................................................................... 20
References ......................................................................................................................................... 21
Technical Notes ................................................................................................................................ 22
Suggested Citation ........................................................................................................................... 22

i
List of Tables
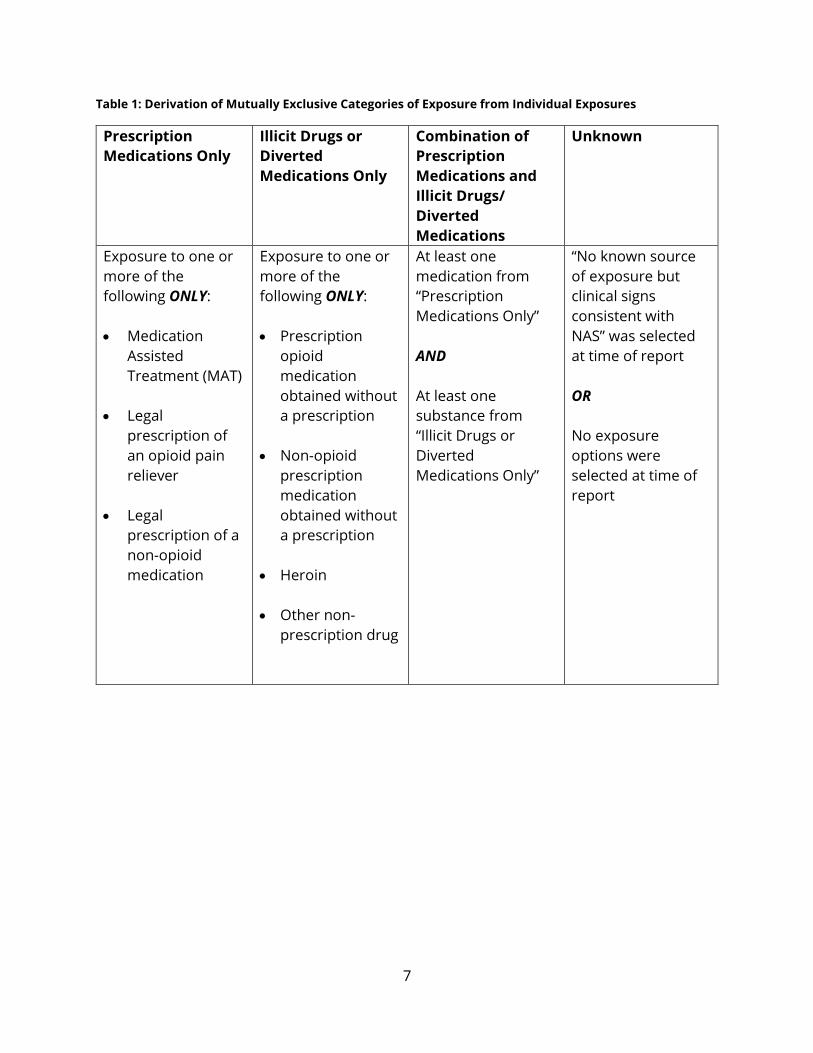
Table 1: Derivation of Mutually Exclusive Categories of Exposure from Individual Exposures
................................................................................................................................................................ 7
Table 2: State of Residence for Non-Resident Cases of Neonatal Abstinence Syndrome
Reported in Tennessee, 2019 ......................................................................................................... 19
ii
List of Figures
Figure 1: Number of Cases of Neonatal Abstinence Syndrome as a Percentage of Live
Births, Tennessee 2013-2019. ........................................................................................................... 4
Figure 2: Non-mutually Exclusive Sources of Exposure for NAS Cases, 2017-2019. ................. 6
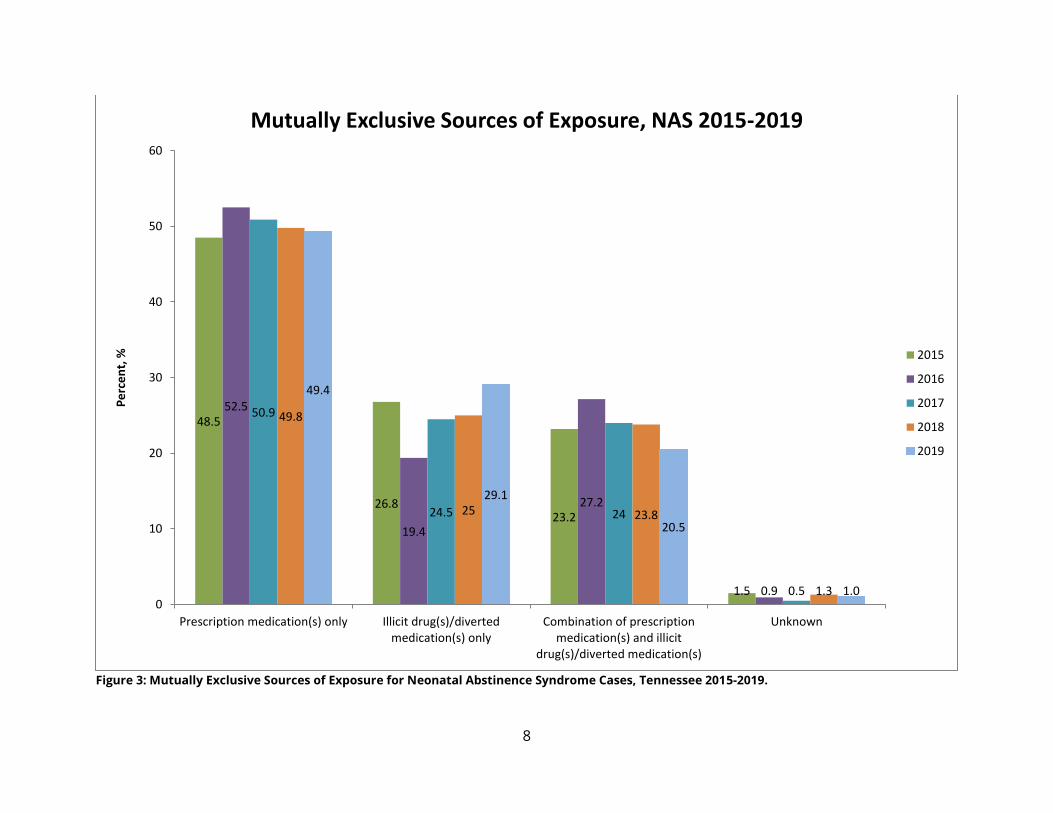
Figure 3: Mutually Exclusive Sources of Exposure for Neonatal Abstinence Syndrome Cases,
Tennessee 2015-2019. ........................................................................................................................ 8
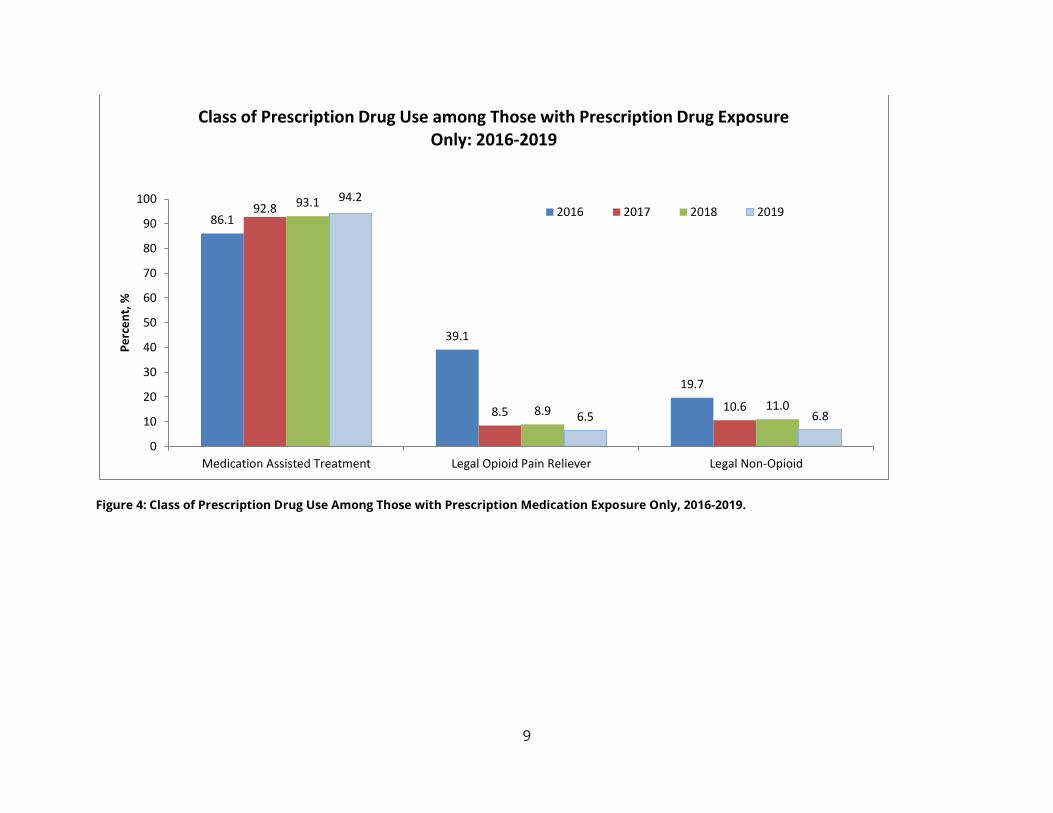
Figure 4: Class of Prescription Drug Use Among Those with Prescription Medication
Exposure Only, 2016-2019. ................................................................................................................ 9
Figure 5: Rate per 1,000 Live Births of NAS Cases by TDH Health Region, 2019 .................... 11
Figure 6: NAS Rates by TDH Health Region, 2015-2019.............................................................. 12
Figure 7: Rate of NAS Cases by County, 2016 .............................................................................. 13
Figure 8: Rate of NAS Cases by County, 2017 .............................................................................. 13
Figure 9: Rate of NAS Cases by County, 2018 .............................................................................. 14
Figure 10: Rate of NAS Cases by County, 2019 ............................................................................ 14
Figure 11: Distribution of Mutually Exclusive Sources of Exposure by Health Region for
Neonatal Abstinence Syndrome Cases, 2019 .............................................................................. 15
Figure 12 A-D: Prevalence of Exposure to Mutually Exclusive Sources among NAS Cases by
Region, 2016-2019 ............................................................................................................................ 16
Figure 13: Prevalence of Exposure to Medication Assisted Treatment among NAS Cases by
Region, 2019 ...................................................................................................................................... 17
iii
Figure 14: Prevalence of Exposure to Legally Obtained Prescription Medications among NAS
Cases by Region, 2019 ..................................................................................................................... 17
Figure 15: Prevalence of Exposure to Diverted Prescription Medications among NAS Cases
by Region, 2019 ................................................................................................................................ 17
Figure 16: Prevalence of Exposure to Illicit Drugs among NAS Cases by Region, 2019 ......... 17

1
Executive Summary
The dramatic increase in maternal opioid use in the US and Tennessee from 2000-2017
paralleled a ten-fold increase in incidence of babies born with Neonatal Abstinence
Syndrome (NAS) in Tennessee. NAS is a group of conditions caused when a newborn
withdraws from certain drugs, often opioids, used during pregnancy. The Tennessee
Department of Health (TDH) established NAS as a reportable condition on January 1, 2013.
Since then Tennessee had seen annual increases in the number of cases of NAS until
CY2018, which marked the first decrease in the number of cases.
During the CY2019 surveillance period, 808 cases of NAS were reported to the TDH
surveillance portal. This marked a decrease in the rate of cases of NAS per 1,000 live births
for a second consecutive year. This encouraging observation highlights the statewide
collaborative efforts to curb the opioid epidemic and the associated number of cases of
NAS. TDH will continue to monitor NAS, with the hope that rates will continue to drop.
Key Findings
The number of cases of NAS decreased 15.0% from 949 in 2018 to 808 in 2019.
The rate of cases of NAS per 1,000 live births decreased from 11.7 in 2018 to 10.0 in
2019.
The proportion of cases of NAS remained higher in males (55.3%) than females
(44.7%) in 2019.
The majority of cases of NAS (65%) involved Medication Assisted Treatment (MAT).
The geographic distribution of cases of NAS varied across the counties of
Tennessee. Counties in the east of Tennessee had the highest rate (68.6 cases of
NAS per 1,000 live births).
Exposure to various substances varied across geographic regions:
o Exposure to prescription medication was highest in East Tennessee (with
71.9% of NAS cases) being lowest in West Tennessee at 15.1% in Shelby
county. On the other hand, over 50% of NAS cases were exposed to illicit
substances in Shelby county compared to less than 30% in East Tennessee.
o There was an increase in NAS cases exposed to illicit substances from 25% in
2018 to 29% in 2019.
The high percentage of infants diagnosed with NAS with exposure to prescribed
medications still points to the ongoing need for primary prevention of NAS—preventing
substance misuse/abuse among women of childbearing age, and preventing unintended
pregnancies among women at risk of misusing/abusing substances. Further, this report
underlines the need for continued targeted preventive measures in counties/regions with
the highest burden of cases of NAS.
2
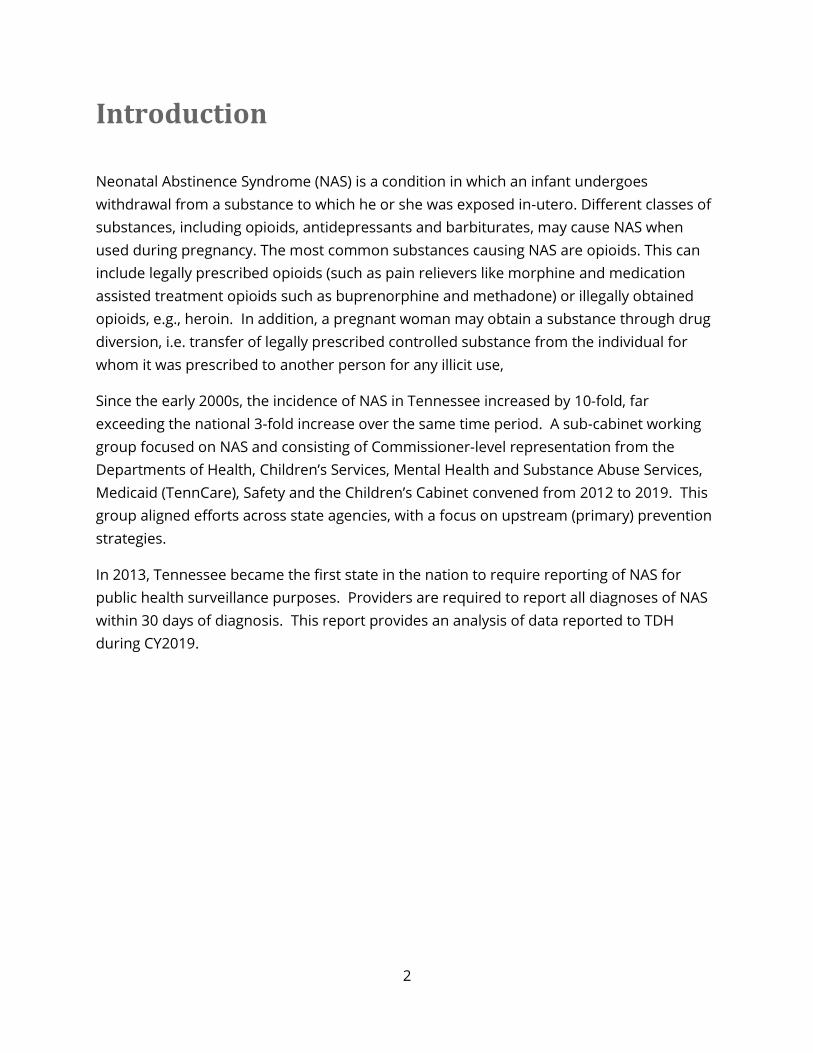
Introduction
Neonatal Abstinence Syndrome (NAS) is a condition in which an infant undergoes
withdrawal from a substance to which he or she was exposed in-utero. Different classes of
substances, including opioids, antidepressants and barbiturates, may cause NAS when
used during pregnancy. The most common substances causing NAS are opioids. This can
include legally prescribed opioids (such as pain relievers like morphine and medication
assisted treatment opioids such as buprenorphine and methadone) or illegally obtained
opioids, e.g., heroin. In addition, a pregnant woman may obtain a substance through drug
diversion, i.e. transfer of legally prescribed controlled substance from the individual for
whom it was prescribed to another person for any illicit use,
Since the early 2000s, the incidence of NAS in Tennessee increased by 10-fold, far
exceeding the national 3-fold increase over the same time period. A sub-cabinet working
group focused on NAS and consisting of Commissioner-level representation from the
Departments of Health, Children’s Services, Mental Health and Substance Abuse Services,
Medicaid (TennCare), Safety and the Children’s Cabinet convened from 2012 to 2019. This
group aligned efforts across state agencies, with a focus on upstream (primary) prevention
strategies.
In 2013, Tennessee became the first state in the nation to require reporting of NAS for
public health surveillance purposes. Providers are required to report all diagnoses of NAS
within 30 days of diagnosis. This report provides an analysis of data reported to TDH
during CY2019.

3
Statewide Data
Highlights: Statewide Reporting
In CY 2019:
The number of cases decreased from 949 in 2018 to 808.
More males were diagnosed with NAS than females.
The rate of cases of NAS decreased from 11.7 in 2018 to
10.0 per 1,000 live births.
Case Reports
During CY2019, providers reported 808 cases of NAS to the surveillance portal. An
additional 72 cases of infants with in-utero drug exposure but no clinical signs of
withdrawal were also reported; these infants are not included in this analysis as clinical
withdrawal is the definitive characteristic of NAS.
The majority of cases (94.6%; n=764) were reported by the baby’s birth hospital, and 5.4%
(n=44) were reported after the baby was transferred to another facility.
Reported cases of NAS were more likely to be male than female (55.3% versus 44.7%;
p<.01). This finding is consistent with previous years of NAS Surveillance data, as well as
published literature.1, 2
The Tennessee Department of Health (TDH) requires that all cases of NAS be reported
within 30 days of diagnosis. In 2019, the average length of time between the date of birth
and date of reporting was 30.6 days (range 0-230 days), with 62.0% of cases being reported
within 30 days of birth.
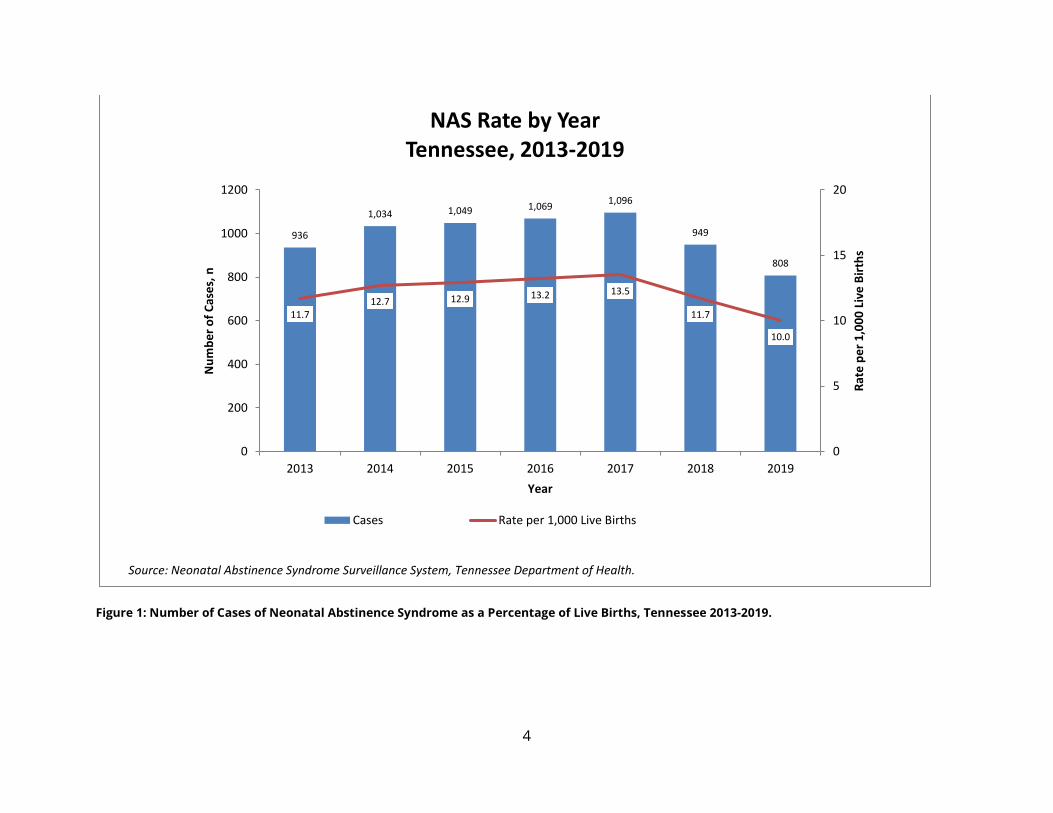
Number and Rate of Cases In 2019, 1.0% (n=808) of live births were diagnosed with NAS, a slight decrease from 1.2%
of live births (n=949) in 2018 (See Technical Note) (Figure 1). This is the second consecutive
year with a decrease in the number of cases reported since surveillance began in 2013.
4
Figure 1: Number of Cases of Neonatal Abstinence Syndrome as a Percentage of Live Births, Tennessee 2013-2019.
936
1,034 1,049 1,0691,096
949
808
11.712.7 12.9 13.2 13.5
11.7
10.0
0
5
10
15
20
0
200
400
600
800
1000
1200
2013 2014 2015 2016 2017 2018 2019
Rat
e p
er
1,0
00
Liv
e B
irth
s
Nu
mb
er
of
Cas
es,
n
Year
NAS Rate by YearTennessee, 2013-2019
Cases Rate per 1,000 Live Births
Source: Neonatal Abstinence Syndrome Surveillance System, Tennessee Department of Health.
5
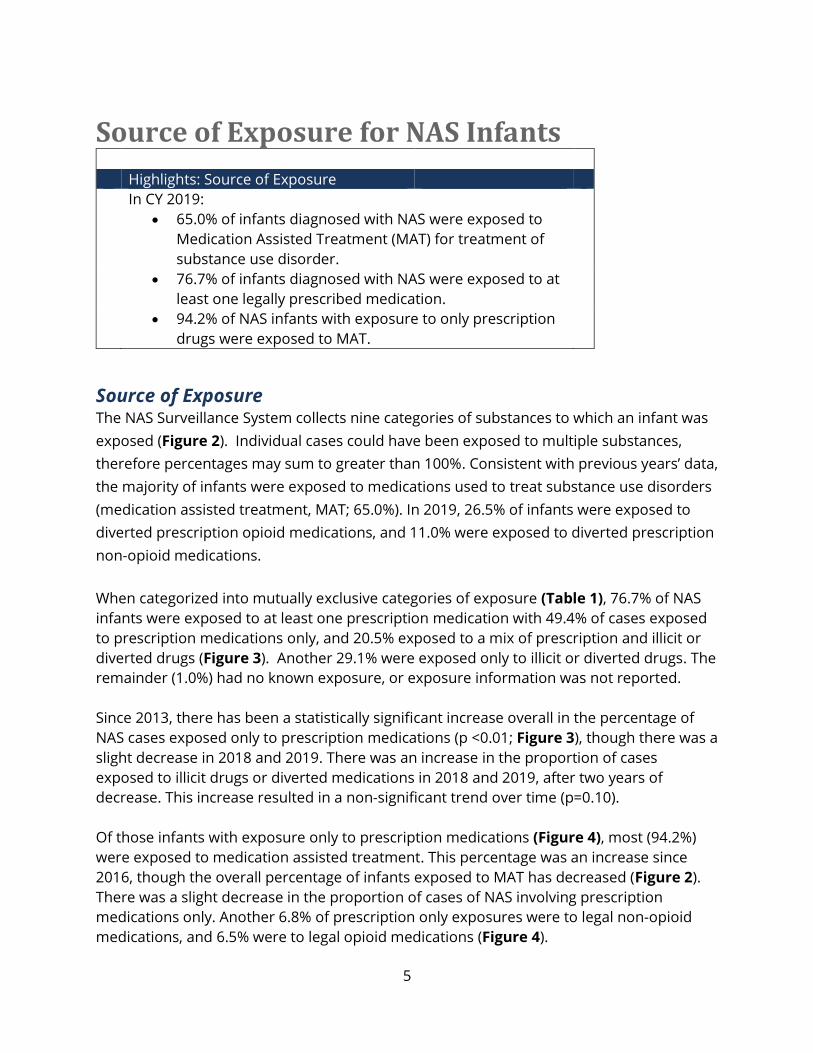
Source of Exposure for NAS Infants
Highlights: Source of Exposure
In CY 2019:
65.0% of infants diagnosed with NAS were exposed to
Medication Assisted Treatment (MAT) for treatment of
substance use disorder.
76.7% of infants diagnosed with NAS were exposed to at
least one legally prescribed medication.
94.2% of NAS infants with exposure to only prescription
drugs were exposed to MAT.
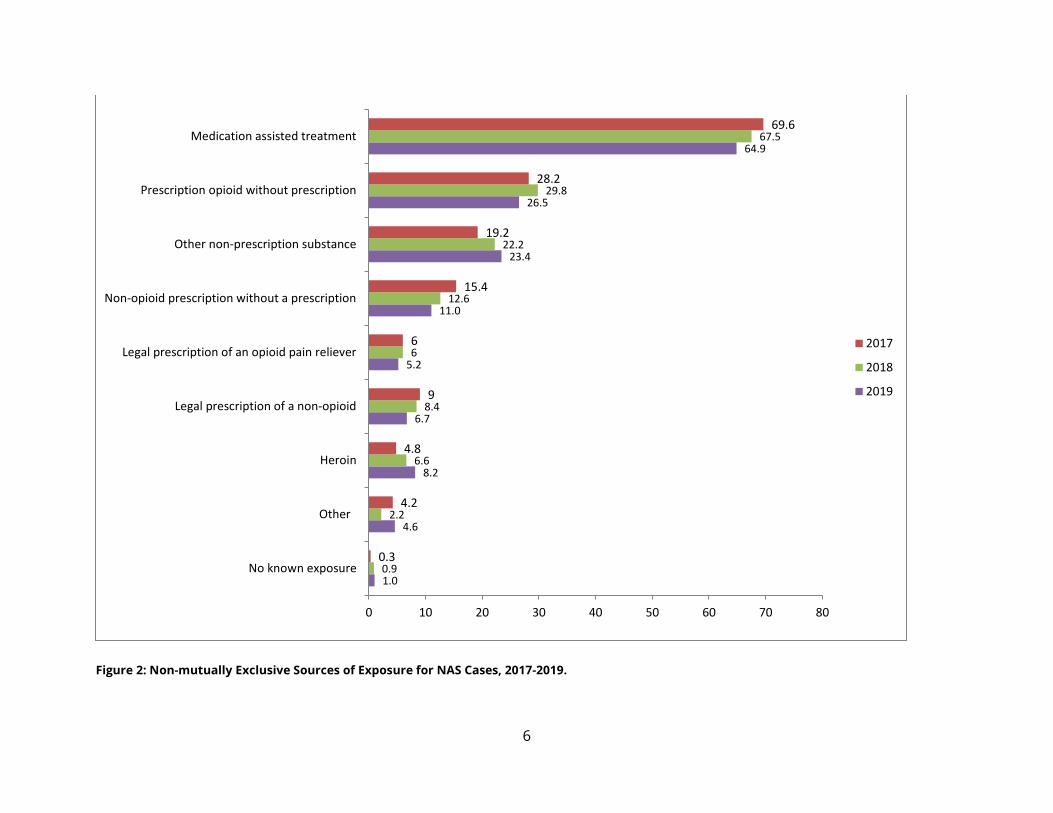
Source of Exposure The NAS Surveillance System collects nine categories of substances to which an infant was
exposed (Figure 2). Individual cases could have been exposed to multiple substances,
therefore percentages may sum to greater than 100%. Consistent with previous years’ data,
the majority of infants were exposed to medications used to treat substance use disorders
(medication assisted treatment, MAT; 65.0%). In 2019, 26.5% of infants were exposed to
diverted prescription opioid medications, and 11.0% were exposed to diverted prescription
non-opioid medications.
When categorized into mutually exclusive categories of exposure (Table 1), 76.7% of NAS
infants were exposed to at least one prescription medication with 49.4% of cases exposed
to prescription medications only, and 20.5% exposed to a mix of prescription and illicit or
diverted drugs (Figure 3). Another 29.1% were exposed only to illicit or diverted drugs. The
remainder (1.0%) had no known exposure, or exposure information was not reported.
Since 2013, there has been a statistically significant increase overall in the percentage of
NAS cases exposed only to prescription medications (p <0.01; Figure 3), though there was a
slight decrease in 2018 and 2019. There was an increase in the proportion of cases
exposed to illicit drugs or diverted medications in 2018 and 2019, after two years of
decrease. This increase resulted in a non-significant trend over time (p=0.10).
Of those infants with exposure only to prescription medications (Figure 4), most (94.2%)
were exposed to medication assisted treatment. This percentage was an increase since
2016, though the overall percentage of infants exposed to MAT has decreased (Figure 2).
There was a slight decrease in the proportion of cases of NAS involving prescription
medications only. Another 6.8% of prescription only exposures were to legal non-opioid
medications, and 6.5% were to legal opioid medications (Figure 4).
6
Figure 2: Non-mutually Exclusive Sources of Exposure for NAS Cases, 2017-2019.
1.0
4.6
8.2
6.7
5.2
11.0
23.4
26.5
64.9
0.9
2.2
6.6
8.4
6
12.6
22.2
29.8
67.5
0.3
4.2
4.8
9
6
15.4
19.2
28.2
69.6
0 10 20 30 40 50 60 70 80
No known exposure
Other
Heroin
Legal prescription of a non-opioid
Legal prescription of an opioid pain reliever
Non-opioid prescription without a prescription
Other non-prescription substance
Prescription opioid without prescription
Medication assisted treatment
2017
2018
2019
7
Table 1: Derivation of Mutually Exclusive Categories of Exposure from Individual Exposures
Prescription
Medications Only
Illicit Drugs or
Diverted
Medications Only
Combination of
Prescription
Medications and
Illicit Drugs/
Diverted
Medications
Unknown
Exposure to one or
more of the
following ONLY:
Medication
Assisted
Treatment (MAT)
Legal
prescription of
an opioid pain
reliever
Legal
prescription of a
non-opioid
medication
Exposure to one or
more of the
following ONLY:
Prescription
opioid
medication
obtained without
a prescription
Non-opioid
prescription
medication
obtained without
a prescription
Heroin
Other non-
prescription drug
At least one
medication from
“Prescription
Medications Only”
AND
At least one
substance from
“Illicit Drugs or
Diverted
Medications Only”
“No known source
of exposure but
clinical signs
consistent with
NAS” was selected
at time of report
OR
No exposure
options were
selected at time of
report
8
Figure 3: Mutually Exclusive Sources of Exposure for Neonatal Abstinence Syndrome Cases, Tennessee 2015-2019.
48.5
26.823.2
1.5
52.5
19.4
27.2
0.9
50.9
24.5 24
0.5
49.8
25 23.8
1.3
49.4
29.1
20.5
1.00
10
20
30
40
50
60
Prescription medication(s) only Illicit drug(s)/divertedmedication(s) only
Combination of prescriptionmedication(s) and illicit
drug(s)/diverted medication(s)
Unknown
Pe
rce
nt,
%Mutually Exclusive Sources of Exposure, NAS 2015-2019
2015
2016
2017
2018
2019
9
Figure 4: Class of Prescription Drug Use Among Those with Prescription Medication Exposure Only, 2016-2019.
86.1
39.1
19.7
92.8
8.5 10.6
93.1
8.9 11.0
94.2
6.5 6.8
0
10
20
30
40
50
60
70
80
90
100
Medication Assisted Treatment Legal Opioid Pain Reliever Legal Non-Opioid
Pe
rce
nt,
%Class of Prescription Drug Use among Those with Prescription Drug Exposure
Only: 2016-2019
2016 2017 2018 2019
10
Regional Data
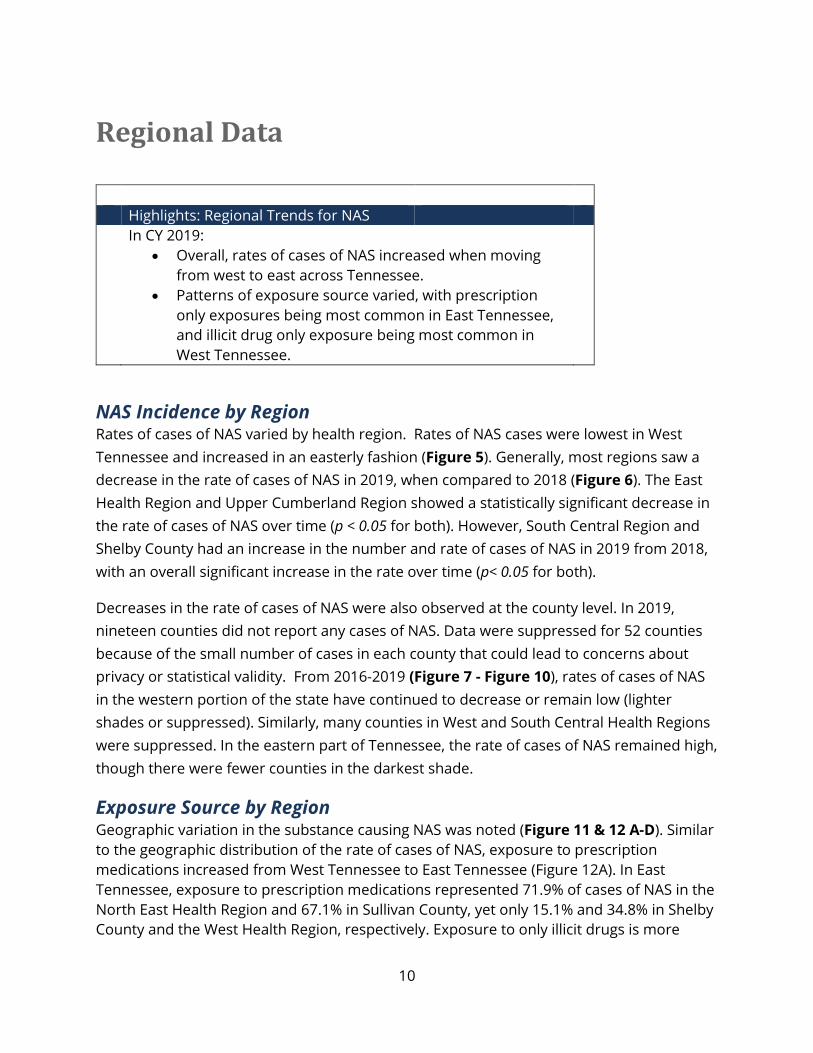
Highlights: Regional Trends for NAS
In CY 2019:
Overall, rates of cases of NAS increased when moving
from west to east across Tennessee.
Patterns of exposure source varied, with prescription
only exposures being most common in East Tennessee,
and illicit drug only exposure being most common in
West Tennessee.
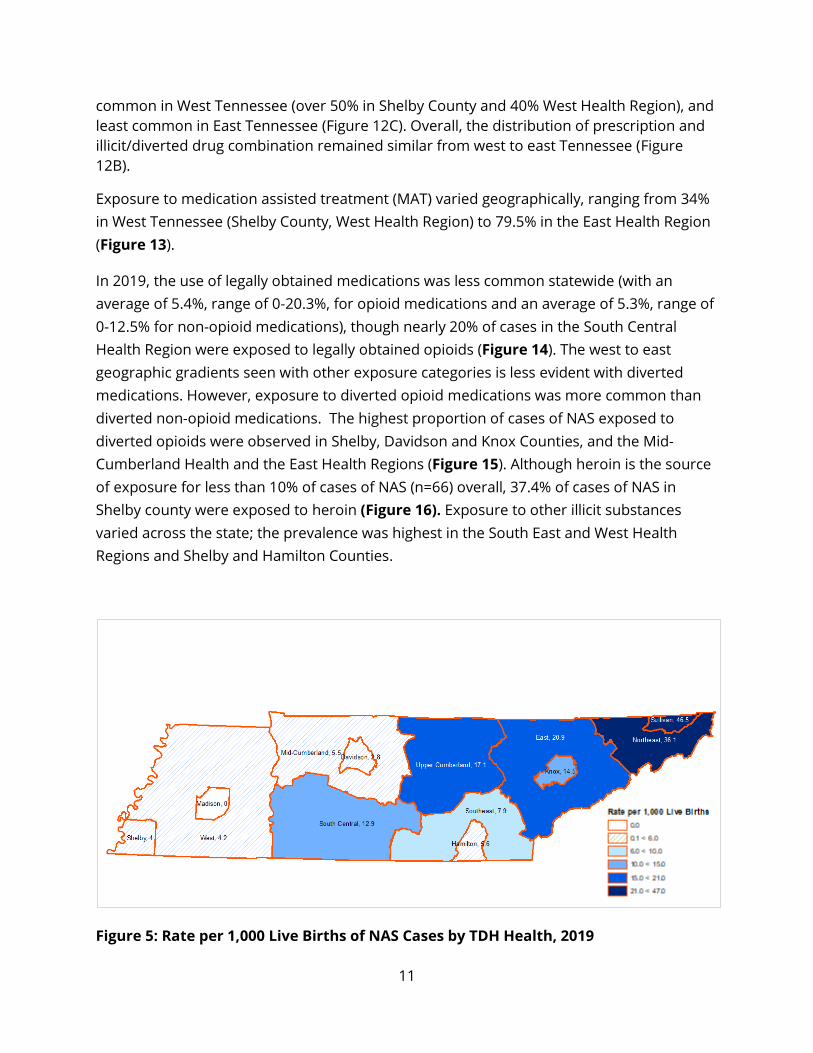
NAS Incidence by Region Rates of cases of NAS varied by health region. Rates of NAS cases were lowest in West
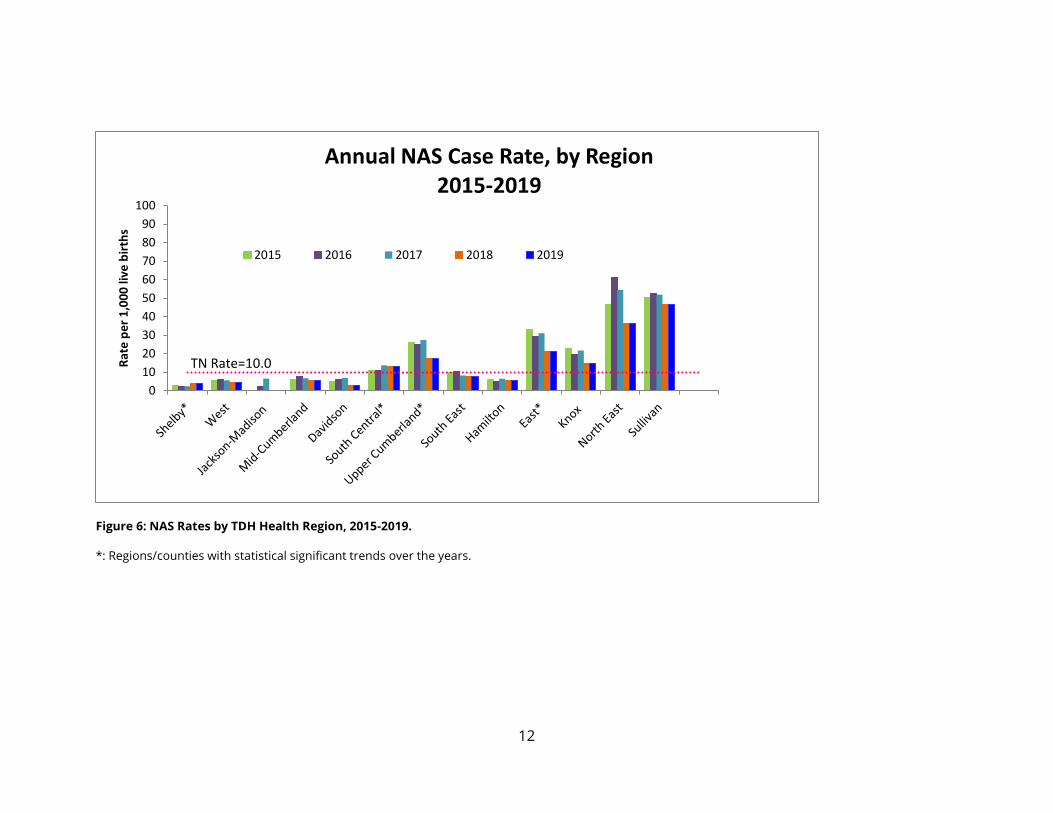
Tennessee and increased in an easterly fashion (Figure 5). Generally, most regions saw a
decrease in the rate of cases of NAS in 2019, when compared to 2018 (Figure 6). The East
Health Region and Upper Cumberland Region showed a statistically significant decrease in
the rate of cases of NAS over time (p < 0.05 for both). However, South Central Region and
Shelby County had an increase in the number and rate of cases of NAS in 2019 from 2018,
with an overall significant increase in the rate over time (p< 0.05 for both).
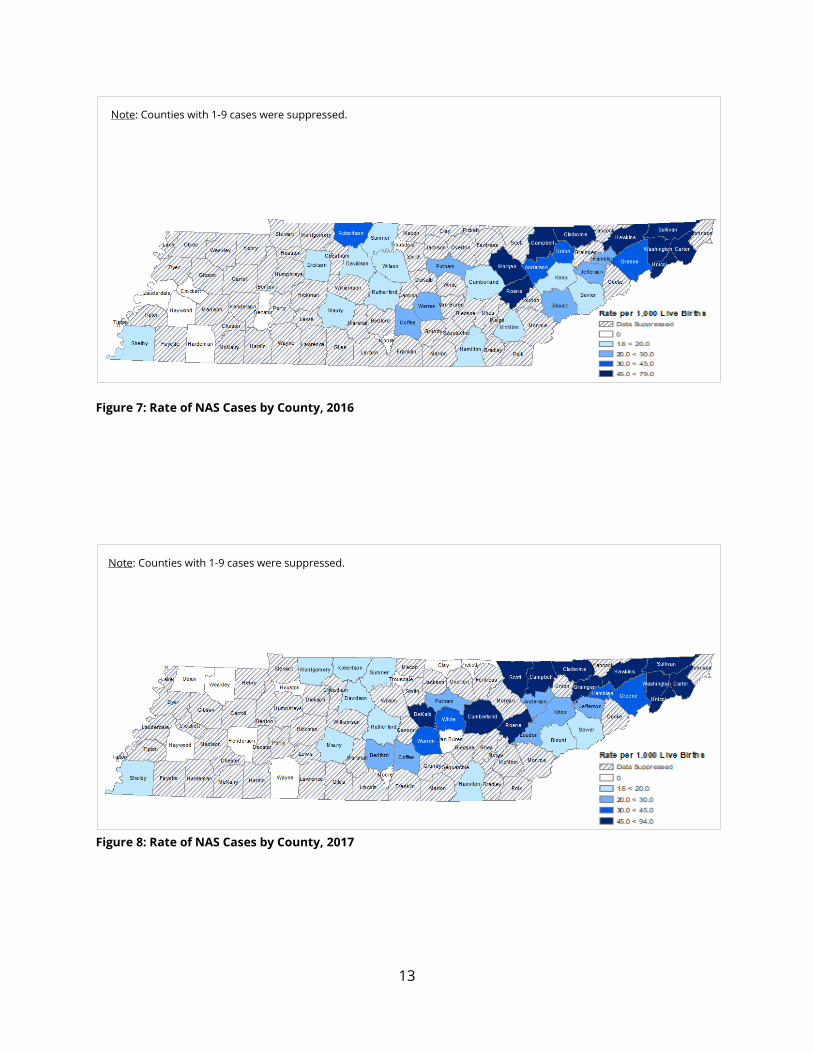
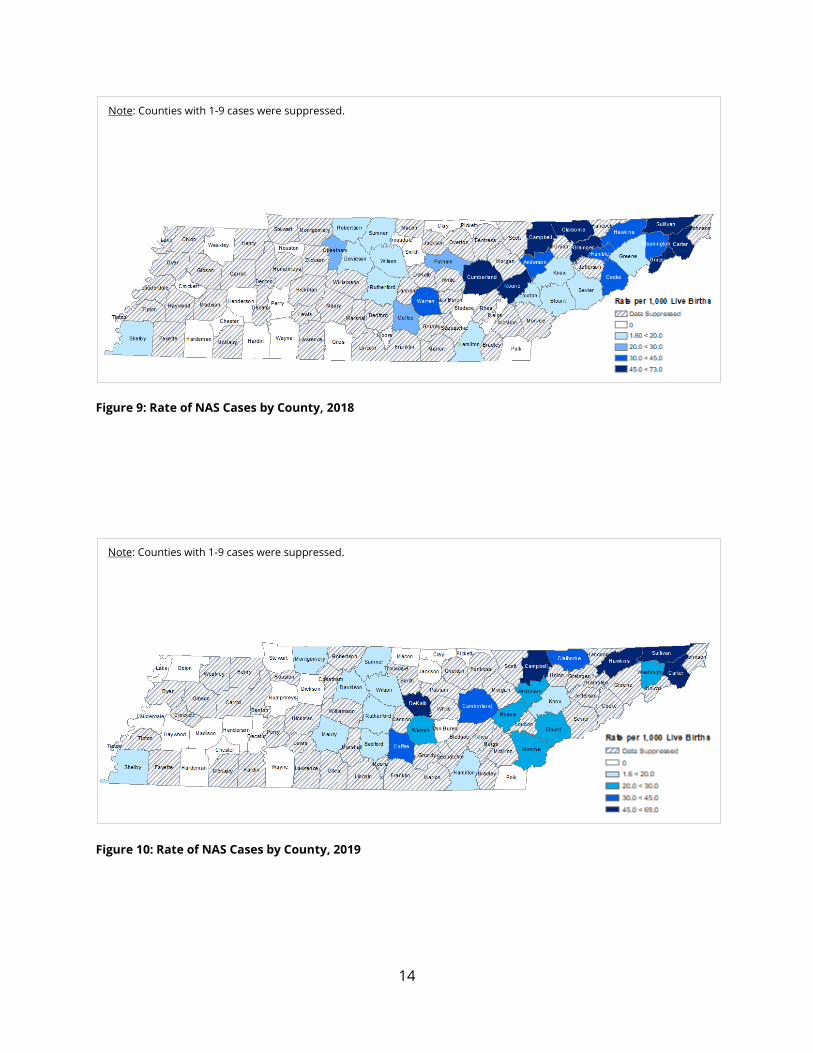
Decreases in the rate of cases of NAS were also observed at the county level. In 2019,
nineteen counties did not report any cases of NAS. Data were suppressed for 52 counties
because of the small number of cases in each county that could lead to concerns about
privacy or statistical validity. From 2016-2019 (Figure 7 - Figure 10), rates of cases of NAS
in the western portion of the state have continued to decrease or remain low (lighter
shades or suppressed). Similarly, many counties in West and South Central Health Regions
were suppressed. In the eastern part of Tennessee, the rate of cases of NAS remained high,
though there were fewer counties in the darkest shade.
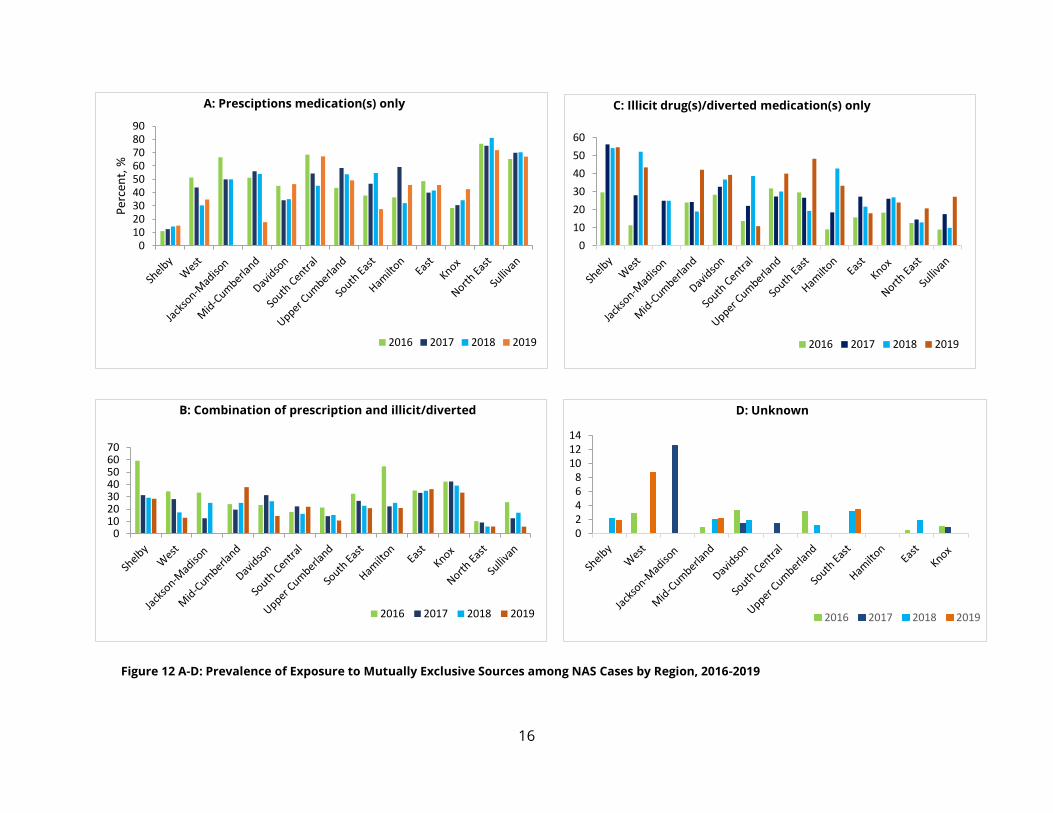
Exposure Source by Region Geographic variation in the substance causing NAS was noted (Figure 11 & 12 A-D). Similar
to the geographic distribution of the rate of cases of NAS, exposure to prescription
medications increased from West Tennessee to East Tennessee (Figure 12A). In East
Tennessee, exposure to prescription medications represented 71.9% of cases of NAS in the
North East Health Region and 67.1% in Sullivan County, yet only 15.1% and 34.8% in Shelby
County and the West Health Region, respectively. Exposure to only illicit drugs is more
11
common in West Tennessee (over 50% in Shelby County and 40% West Health Region), and
least common in East Tennessee (Figure 12C). Overall, the distribution of prescription and
illicit/diverted drug combination remained similar from west to east Tennessee (Figure
12B).
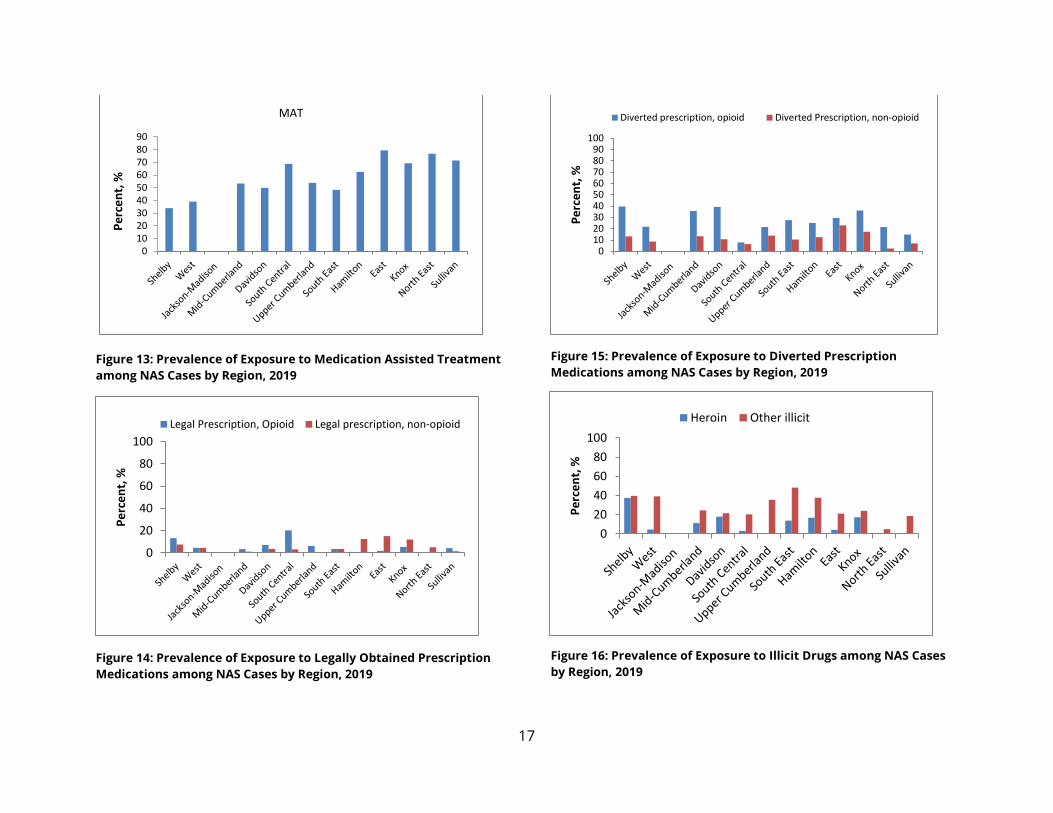
Exposure to medication assisted treatment (MAT) varied geographically, ranging from 34%
in West Tennessee (Shelby County, West Health Region) to 79.5% in the East Health Region
(Figure 13).
In 2019, the use of legally obtained medications was less common statewide (with an
average of 5.4%, range of 0-20.3%, for opioid medications and an average of 5.3%, range of
0-12.5% for non-opioid medications), though nearly 20% of cases in the South Central
Health Region were exposed to legally obtained opioids (Figure 14). The west to east
geographic gradients seen with other exposure categories is less evident with diverted
medications. However, exposure to diverted opioid medications was more common than
diverted non-opioid medications. The highest proportion of cases of NAS exposed to
diverted opioids were observed in Shelby, Davidson and Knox Counties, and the Mid-
Cumberland Health and the East Health Regions (Figure 15). Although heroin is the source
of exposure for less than 10% of cases of NAS (n=66) overall, 37.4% of cases of NAS in
Shelby county were exposed to heroin (Figure 16). Exposure to other illicit substances
varied across the state; the prevalence was highest in the South East and West Health
Regions and Shelby and Hamilton Counties.
Figure 5: Rate per 1,000 Live Births of NAS Cases by TDH Health, 2019
12
Figure 6: NAS Rates by TDH Health Region, 2015-2019.
*: Regions/counties with statistical significant trends over the years.
0
10
20
30
40
50
60
70
80
90
100
Rat
e p
er
1,0
00
live
bir
ths
Annual NAS Case Rate, by Region2015-2019
2015 2016 2017 2018 2019
TN Rate=10.0
13
Figure 7: Rate of NAS Cases by County, 2016
Figure 8: Rate of NAS Cases by County, 2017
Note: Counties with 1-9 cases were suppressed.
Note: Counties with 1-9 cases were suppressed.
14
Figure 9: Rate of NAS Cases by County, 2018
Figure 10: Rate of NAS Cases by County, 2019
Note: Counties with 1-9 cases were suppressed.
Note: Counties with 1-9 cases were suppressed.

15
Figure 11: Distribution of Mutually Exclusive Sources of Exposure by Health Region for Neonatal Abstinence Syndrome Cases, 2019
15.1
34.8
0.0
17.8
46.4
67.2
49.2
27.6
45.8 45.8 42.7
71.967.1
0%
10%
20%
30%
40%
50%
60%
70%
80%
90%
100%
Unknown
Prescription medication(s) only
Combination of prescription medication(s) and illicit drug(s)/diverted medication(s)
Illicit drug(s)/diverted medication(s) only
16
010203040506070
B: Combination of prescription and illicit/diverted
2016 2017 2018 2019
0102030405060708090
Per
cen
t, %
A: Presciptions medication(s) only
2016 2017 2018 2019
Figure 12 A-D: Prevalence of Exposure to Mutually Exclusive Sources among NAS Cases by Region, 2016-2019
0
10
20
30
40
50
60
C: Illicit drug(s)/diverted medication(s) only
2016 2017 2018 2019
02468
101214
D: Unknown
2016 2017 2018 2019
17
Figure 13: Prevalence of Exposure to Medication Assisted Treatment
among NAS Cases by Region, 2019
Figure 14: Prevalence of Exposure to Legally Obtained Prescription
Medications among NAS Cases by Region, 2019
Figure 15: Prevalence of Exposure to Diverted Prescription
Medications among NAS Cases by Region, 2019
Figure 16: Prevalence of Exposure to Illicit Drugs among NAS Cases
by Region, 2019
0102030405060708090
Pe
rce
nt,
%MAT
0
20
40
60
80
100
Pe
rce
nt,
%
Legal Prescription, Opioid Legal prescription, non-opioid
0102030405060708090
100
Pe
rce
nt,
%
Diverted prescription, opioid Diverted Prescription, non-opioid
0
20
40
60
80
100
Pe
rce
nt,
%
Heroin Other illicit
18
Non-Residential NAS Cases
Highlights: Non-Residential NAS Cases
In CY2019:
Tennessee hospitals reported 81 NAS cases in which the
infant was from another state.
More than 60% of non-residential NAS cases were from
Virginia.
Effective July 1, 2014, reporting hospitals were asked to report cases of NAS treated at
Tennessee hospitals that were residents of states that border Tennessee. These states
include Alabama, Arkansas, Georgia, Kentucky, Mississippi, Missouri, North Carolina and
Virginia.
In 2019, eighty-one cases of NAS from other states were treated in Tennessee. The
distribution of out of state cases, by maternal state of residence, is shown in Table 2. The
majority of non-resident cases are from Virginia (69.14%).
A majority (69.1%, n=56) of out of state NAS cases were born in Tennessee (for example,
the baby’s mother was from North Carolina but delivered in Tennessee). The remainder
(30.9%) were born in out of state hospitals and transferred to a Tennessee hospital for care
(for example, the baby was born in Virginia but transferred to Tennessee for care).
19
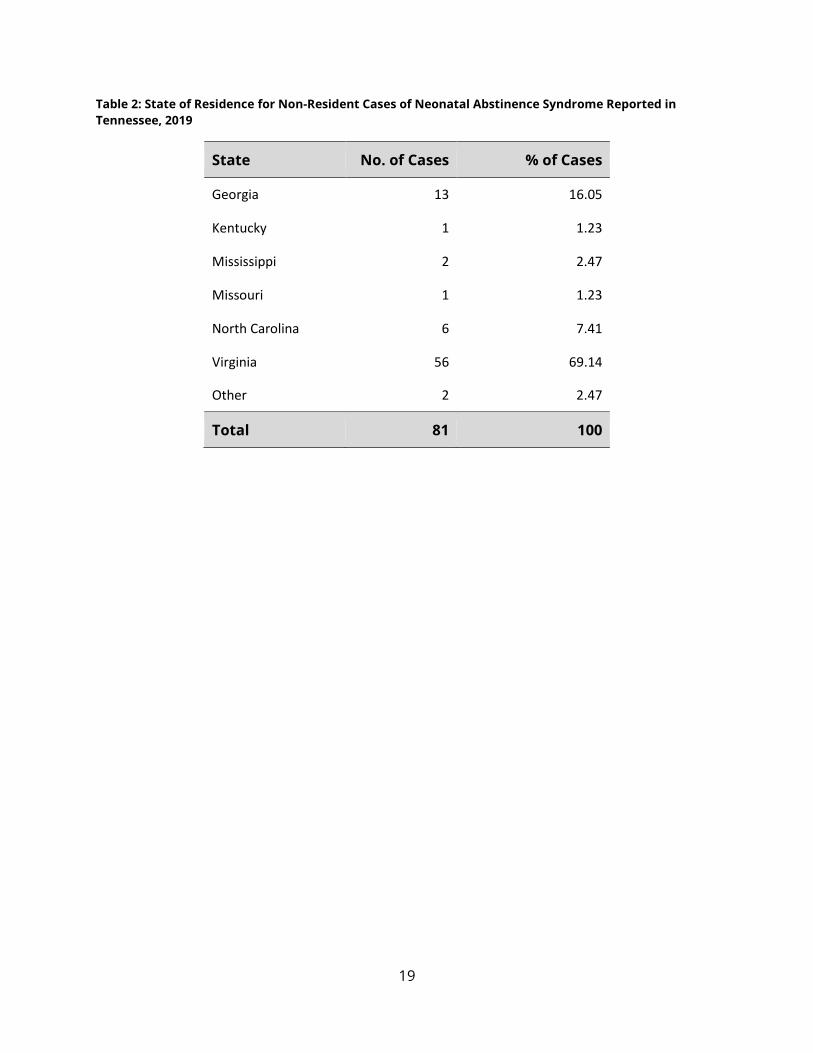
Table 2: State of Residence for Non-Resident Cases of Neonatal Abstinence Syndrome Reported in
Tennessee, 2019
State No. of Cases % of Cases
Georgia 13 16.05
Kentucky 1 1.23
Mississippi 2 2.47
Missouri 1 1.23
North Carolina 6 7.41
Virginia 56 69.14
Other 2 2.47
Total 81 100
20
Conclusion
Since becoming a reportable condition in 2013, the proportion of births affected by
Neonatal Abstinence Syndrome each year increased through 2017, with the first decrease
seen in 2018. CY2019 is the second consecutive year that Tennessee saw a decrease in the
number of cases. The largest decreases were seen in the East and the Upper Cumberland
Health Regions and Davidson County. East and Upper Cumberland Health Regions showed
both a decrease in the rate of cases of NAS from 2018 and a statistically significant
decrease over time since 2013. On the other hand, the largest increase in the rate of cases
of NAS occurred in the South Central Health Region and Shelby County, which had a
statistically significant increase in the rate of cases of NAS over time. In addition,
geographic differences persist, with less than 40% of infants exposed to MAT in West
Tennessee, compared to over 75% in some regions of East Tennessee. Conversely, more
than 50% of infants were exposed to illegal substances in West Tennessee vs less than 30%
in the East, with an overall statewide increase in exposure to illegal substances.
Since 2013, there has been a shift in the exposure sources associated with NAS, with more
mothers of NAS infants taking medications prescribed by a provider. The high proportion
of cases of NAS involving medication assisted treatment suggest that women with a history
of substance use disorder are becoming more engaged with medical providers during
pregnancy. Notably, there was decrease in the percent of infants exposed to MAT from
67.5% in 2018 to 64.9% in 2019.
The patterns of exposure (with nearly 77% of cases being exposed to at least one
substance prescribed by a healthcare provider) highlight opportunities for primary
prevention. Healthcare providers should be encouraged to explore non-opioid treatment
modalities in women of childbearing age and should promote effective contraceptive
methods to prevent unintended pregnancies among women who use opioids. Additionally,
this report highlights areas that may be targeted to prevent NAS cases in Tennessee.
Acknowledgements
The Tennessee Department of Health would like to acknowledge the reporting hospitals
and providers across the State of Tennessee and TDH Staff.
21
References 1. Charles MK, Cooper WO, Jansson LM, et al. Male Sex Associated with Increased Risk
of Neonatal Abstinence Syndrome. Hosp Pediatr 2018 Jun: 7(6):328-334.
DOI:10.1542/hpeds.2016-0218.
2. O’Connor AB, O’Brien L, Alto WA. Are there gender related differences in neonatal
abstinence syndrome following buprenorphine during pregnancy?. J Perinat Med
2013 Sep1;41(5):621-3. DOI: 10.1515/jpm-2012-0288.
22
Technical Notes
1. At publication of the 2018 Neonatal Abstinence Syndrome Surveillance Annual Report,
927 cases with a birth year of 2018 had been reported. After publication of the 2018 report,
an additional 22 cases were reported and are included here.
2. All rates for 2019 were calculated using the 2018 Birth Statistical File as the denominator.
Suggested Citation
This report was prepared by Alice M Nyakeriga, PhD, MPH, and Morgan McDonald, MD.
Suggested citation: Nyakeriga AM, McDonald M (2019). Neonatal Abstinence Syndrome
Surveillance Annual Report 2019. Tennessee Department of Health, Nashville, TN.