nutritional status and risk factors associated with …
TRANSCRIPT
NUTRITIONAL STATUS AND RISK FACTORS
ASSOCIATED WITH WOMEN PRACTICING
GEOPHAGIA IN QWAQWA, SOUTH
AFRICA
ANNETTE VAN ONSELEN
2013

i
Nutritional status and risk factors associated with women practising geophagia
in QwaQwa, South Africa
by
Annette van Onselen
BSc (Dietetics) (UFS)
MSc (Dietetics) (UFS)
Thesis submitted in fulfilment of the requirements for the degree
Philosophia Doctor in Dietetics
Ph.D. (Dietetics) (360 credits)
in the
Faculty of Health Science
Department of Nutrition and Dietetics
University of the Free State
December 2013
Promotor: Prof. CM Walsh (Ph.D.)
Co-Promotor: Dr. CE Brand (D-Tech)
Co-Promotor: Prof. FJ Veldman (Ph.D.)

ii

iii
Dedicated to
my husband Charl, my daughter Charné, my mother Stella, my sister Corrette, my
father in law Sam, my mother in law Rita and my father Kalie, for their
encouragement and support.

iv
ACKNOWLEDGEMENTS
I would like to thank the following people:
Prof. CM Walsh my promoter, for her support, guidance, encouragement and editing
of my work.
Prof. FJ Veldman for statistical analysis, support, guidance, encouragement and
valuable advice during my studies.
Dr. M Brand for her support, guidance and editing of my work.
Profs. GIE Ekosse and L de Jager for financial support and the opportunity to be
involved in the larger study.
My husband Charl, for support and words of encouragement.
My daughter Charné, for support and her unconditional love.
My mother Stella with her support and assistance with my family.
My sister Corrette for her support and assistance with Charné.
My colleagues at the University of KwaZulu-Natal for their support.
Marie van Wyk for the analysis of the blood.
Field workers FR Mokoena, MV Raphuthing and LF Mogongoa for continuous
assistance and support.

v
My friends Elmien Putter, Riana de Klerk and Linda Walters for accommodation,
support and encouragement.
Participants who agreed to participate in the study and patience to answer all the
questions.
The editor: Annette Viljoen, for her assistance.
My Heavenly Father for giving me the strength and ability to complete this study.

vi
TABLE OF CONTENTS
CONTENTS PAGE
DECLARATION OF OWN WORK
DEDICATION
ACKNOWLEDGEMENTS
LIST OF TABLES
LIST OF FIGURES
LIST OF ANNEXURES
LIST OF ABBREVIATIONS
ii
iii
iv
xiii
xv
xvi
xvii
CHAPTER 1: INTRODUCTION
1.1
1.1.1
1.1.2
1.2
1.2.1
1.3
Problem statement
Geophagia
Iron deficiency
Aim of the study
Objectives
Structure of the thesis
1
1
3
5
5
5
CHAPTER 2: LITERATURE REVIEW
2.1
2.2
2.2.1
2.2.2
2.2.2.1
2.2.2.2
2.2.2.3
2.2.3
2.2.3.1
Introduction
Pica
Classification of pica
Aetiology of pica
Hunger
Micronutrient deficiency
Protection from toxins and pathogens
Prevalence of pica
Worldwide
6
7
8
9
9
10
11
12
12

vii
2.2.3.2
2.2.3.3
2.2.4
2.2.4.1
2.2.4.2
2.2.4.3
2.2.4.4
2.3
2.3.1
2.3.2
2.3.2.1
2.3.2.2
2.3.2.3
2.3.3
2.3.3.1
2.3.3.2
2.3.3.3
2.3.4
2.3.4.1
2.3.4.2
2.4
2.4.1
2.4.1.1
2.4.1.2
2.4.1.3
2.4.2
2.4.2.1
2.4.2.2
2.4.2.3
2.4.2.4
2.5
Africa
South Africa
Conditions associated with pica
Iron deficiency anemia
Psychiatric conditions
Pregnancy
Social and cultural orientation
Geophagia
History of geophagia
Aetiology of geophagia
Physiological factors
Psychological factors
Environmental factors
Prevalence of geophagia
Worldwide
Africa
South Africa
Composition of geophagic soil
Texture of soil
Mineralogy of soil
Geophagia and Human Health
Advantages to human health
Mineral supplementation
Creates a barrier
Relieving gastro-intestinal distress
Disadvantages to human health
Binding with minerals and toxic reactions
Gastro-intestinal problems
Organisms in soil
Dental damage
Conclusion
PAGE
13
13
13
13
14
15
15
16
16
16
17
17
17
18
18
19
19
20
20
21
22
22
22
23
23
24
24
25
25
26
26

viii
PAGE
CHAPTER 3: METHODS AND TECHNIQUES
3.1
3.2
3.2.1
3.2.1.1
3.2.1.2
3.3
3.3.1
3.3.2
3.3.3
3.3.4
3.3.5
3.3.6
3.4
3.5
3.5.1
3.5.2
3.5.3
3.5.4
3.5.5
3.5.6
3.5.7
3.5.8
3.5.9
3.5.10
3.6
3.7
3.8
3.9
Introduction
Study design
Sample selection
Population
Sample
Measurements
Variables and operational definitions
Geophagic status (Annexure B)
Socio-demographic status (Annexure C)
Anthropometric nutritional status (Annexure D)
Dietary intake (Annexure E)
Physical activity (Annexure F)
Blood parameters (pathology)
Techniques
Questionnaires
Anthropometry
Laboratory Analyses
Validity and reliability
Socio-demographic Questionnaire
Food Frequency Questionnaire (FFQ)
Anthropometry
Physical activity
Blood sampling
Methodological limitations
The role of the researcher
Training of fieldworkers
Pilot Study
Study procedure
28
29
29
29
29
31
31
31
32
32
32
33
34
35
35
35
36
37
38
38
38
39
39
39
40
40
41
41

ix
3.10
3.11
3.12
Statistical Analysis
Intervention
Ethical Considerations
PAGE
43
44
45
CHAPTER 4: INTERVENTION
4.1
4.2
4.2.1
4.2.2
4.2.2.1
4.2.2.2
4.2.2.3
4.2.2.4
4.2.2.5
4.3
4.3.1
4.3.2
4.3.2.1
4.3.2.2
4.3.2.3
4.3.3
4.3.4
Introduction
Background information
Communication
Behaviour change
Behaviour learning
Humanistic approach
Integrated Theory of Health Behaviour Change (ITHBC)
Motivational Interviewing with Acceptance and Commitment
Therapy
The Health believe model
The intervention phase
Conceptualization-Phase 1
Formulation- Phase 2
Setting of objectives
Choosing media and multimedia communication
Designing messages
Implementation-Phase 3
Monitoring and evaluation – Phase 4
47
48
48
50
50
51
52
52
53
53
54
55
55
57
58
59
62
x
PAGE
CHAPTER 5: RESULTS
5.1
5.2
5.3
5.3.1
5.3.2
5.3.2.1
5.3.2.2
5.4
5.5
5.6
5.7
5.8
5.9
5.9.1
5.9.1.1
5.9.2
5.9.3
5.9.4
Introduction
Socio-demographic status
Dietary intake
Total energy and macronutrient intake
Micronutrient intake
Minerals
Vitamin intake of geophagia and control groups
Anthropometric nutritional status
Activity levels
Blood results
Correlation between dietary intake and blood results of
geophagia and control groups pre- and post-intervention
Iron status and geophagia
The geophagia knowledge and habits pre- and post-
intervention, as well as the food based dietary guidelines
compliance post- intervention will be presented in tables
Geophagia knowledge and habits before intervention
Knowledge and habits related to geophagia group before
intervention
Geophagia knowledge and habits after the intervention
Food-based Dietary Compliance after the intervention
Differences between Geophagia and Control group pre- and
post- intervention
63
63
68
68
70
70
70
72
73
74
77
78
79
79
79
85
88
89

xi
PAGE
CHAPTER 6: DISCUSSION
6.1
6.2
6.3
6.4
6.4.1
6.4.2
6.4.2.1
6.4.2.2
6.5
6.6
6.7
6.8
6.9
6.10
6.11
Introduction
Limitation of the study
Socio-demographic status
Dietary intake
Total energy and macronutrients
Micronutrient intake
Minerals
Vitamin intake of geophagia and control groups
Anthropometric nutritional status
Activity levels
Blood results(Pathology)
Correlation between dietary intake and blood(pathology) results
Iron status and geophagia
Knowledge and habits related to geophagia in participants
practicing geophagia and the knowledge of geophagia in the
control group before intervention
The knowledge and habits related to geophagia after the
intervention
92
92
94
97
97
98
98
99
101
102
102
103
104
108
109

xii
PAGE
CHAPTER 7: CONCLUSIONS AND RECOMMENDATIONS
7.1
7.1.1
7.1.2
7.1.3
7.1.4
7.1.5
7.2
7.2.1
7.2.2
7.3
Conclusions
Socio-demographic status
Dietary intake
Anthropometric nutritional status and the activity levels
The relationship between geophagia and iron status
Knowledge and habits related to geophagia and the
impact of the intervention
Recommendations
Implications for practice
Future research
Benefits of the research and implementation of the
findings
112
112
112
113
114
114
115
115
116
117
REFERENCES
SUMMARY
118
209

xiii
LIST OF TABLES
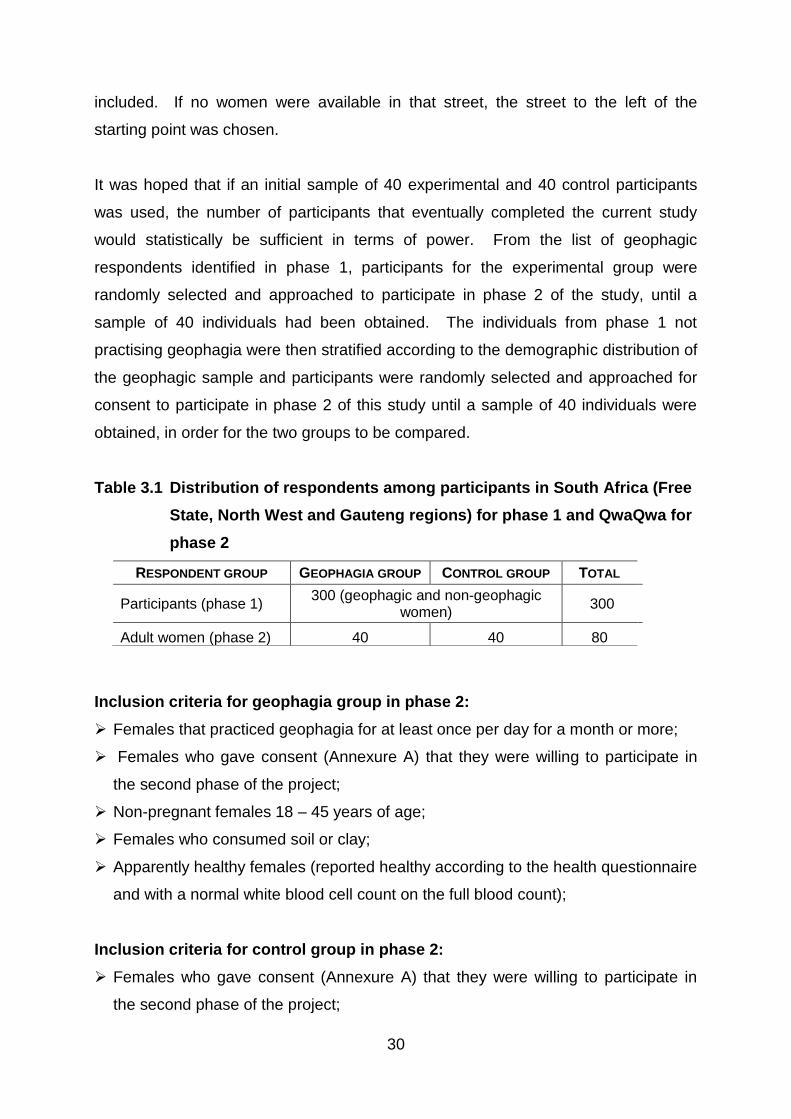
PAGE Table 3.1 Table 4.1 Table 4.2 Table 5.1 Table 5.2 Table 5.3 Table 5.4 Table 5.5 Table 5.6 Table 5.7 Table 5.8 Table 5.9 Table 5.10 Table 5.11 Table 5.12 Table 5.13 Table 5.14 Table 5.15
Distribution of respondents among participants in South Africa (Free State, North West and Gauteng regions) for phase 1 and QwaQwa for phase 2 The advantages and disadvantages of different communication methods and materials Baseline results used for the development of the brochure Socio-demographic information of Geophagia and Control groups Final model of socio-demographic factors that were significantly associated with the practice of geophagia Mean, energy macronutrient and cholesterol intake of Geophagia and Control group Mean mineral and trace elements intake of Geophagia and Control groups Mean vitamin intake of Geophagia and Control groups Mean anthropometric values of Geophagia and Control groups Categorical Body Mass Index (BMI) Values Final model of anthropometric factors associated with geophagia Continuous activity level Categorical activity level Mean blood levels The correlation between the dietary intake and blood results of the Geophagia and Control group before intervention Final model of blood (pathology) associated with geophagia Geophagia knowledge and habits of the Geophagia group pre-intervention The geophagia knowledge and habit compliance post-intervention
30 49 60 65 67 69 71 72 73 73 73 74 74 75 77 79 81 86

xiv
Table 5.16 Table 5.17
The Food Based Dietary Guidelines compliance post-intervention Significant Differences between the Geophagia and Control group after the intervention
89 90
xv
LIST OF FIGURES
PAGE Figure 2. 1 Figure 2.2 Figure 3.1 Figure 4.1
Diagram showing the soil layers Illustration of the path of soil ingested by humans Study procedures A scheme for programme planning, including conceptualization, formulation, implementation and evaluation
20 24 42 54

xvi
LIST OF ANNEXURES
PAGE Annexure A Annexure B Annexure C Annexure D Annexure E Annexure F Annexure G Annexure H Annexure I Annexure J Annexure K
Consent and information form Geophagic Status Questionnaire Socio-demographic Questionnaire Anthropometric Status Questionnaire Food Frequency/Dietary Intake Questionnaire Physical Activity Questionnaire Brochure in English Brochure in Sesotho Intervention Quesionairre Referral Letter Fieldworker Manual
161 167 174 177 178 195 197 199 201 204 205
xvii
LIST OF ABBREVIATIONS
BBC BC BMI CI cm CRD CUT DRI DALYs DHS EAR EDTA EER ESR FAO FBC FBDG FFQ g GBD GLP ICSH ITHBC kg/m2
kJ m MCV mg mg/L ml mmol/L mm µg/L µmol/L MRC N ND NHLS PAL PDPAR pH pmol/L RDW RLS SADHS SANAS
British Broadcasting Corporation Before Christ Body Mass Index Confidence Interval Centimeters C-reactive Protein Central University of Technology Dietary Reference Intake Disability Adjusted Life Year Demographic and Health Survey Estimated Average Requirements Ethylenediaminetetra-acetic Acid Estimated Energy Requirement Estimated Sedimentation Rate Food and Agriculture Organisation Full Blood Counts Food Based Dietary Guidelines Food Frequency Questionnaire Grams Global Burden of Disease Good Laboratory Practice International Council for Standardization in Haematology Integrated Theory of Health Behaviour Change Kilograms per Meter Squared Kilojoules Meter Mean Corpuscular Volume Milligram Milligram per Liter Milliliters Millimole per Liter Millimeter Microgram per Liter Micromoles per Liter Medical Research Council Number of Subjects Not Determined National Health Laboratory Services Physical Activity Level Previous Day Physical Activity Recall Power of Hydrogen (Reference: Carlsberg Laboratory) Picomole per Liter Red Blood Cell Distribution Width Restless Leg Syndrome South African Demographic and Health Survey South African National Accreditation System

xviii
SAFBDG SANHANES-1 STATS SA THUSA UCSF UFS USA WHO WHR Zn
South African Food Based Dietary Guidelines South African National Health and Nutrition Examination Survey Statistics South Africa Transition, Health and Urbanisation in South Africa University of California, San Francisco University of the Free State United States of America World Health Organization Waist to Hip Ratio Zinc

1
CHAPTER 1
INTRODUCTION
1.1 PROBLEM STATEMENT
1.1.1 Geophagia
Geophagia is the practice of eating earthy soil-like substances such as clay (Erick,
2012: 363) which can be red, white or gray (Ekosse & Junbam, 2010), and chalk or
coals (Walker et al., 1985). In humans who practice geophagia, the daily intake is
around 40-50 g/day (Geissler et al., 1999; Sheppard, 1998). Geophagia is closely
related to pica, a classified eating disorder characterized by abnormal cravings for
nonfood items (Young et al., 2008; Erick, 2012: 363). As early as 1821, soil eating
was associated with an attempt to correct chlorosis, or "green sickness" which is a
form of anemia that affects adolescent girls (Woywodt & Kiss, 2002). Geophagia
among children and pregnant women was first described medically in a book in 1563
(Rose et al., 2000). Since that time a limited amount of literature on the topic has
been published and few recent studies are available, most of which are associated
with poor socioeconomic background, which is common in developing countries
(Simon, 1998). The practice is more common in women than in men (Rose et al.,
2000).
Geophagia has been related to nutritional, psychological, cultural, medical (Danford,
1982), social, taste (Geissler et al., 1999), spiritual, religious, ritual (Sudilovsky, 2007;
Hunter & de Kleine, 1984) and physiological needs (Katz, 2008; Vermeer, 1966).
Culture and beliefs also play a role in the practice of geophagia (Hooda & Henry,
2009; Abrahams & Parsons, 1996). It has been reported that women eat soil to draw
attention during and after pregnancy (Izugbara, 2003). In addition, clays are eaten
by pregnant and lactating women as a calcium source. These clays are believed by
some to be invaluable, especially where individuals are lactose intolerant (Hunter,

2
1973) or have an iron deficiency (Woywodt & Kiss, 2002; Louw et al., 2007). In
Turkey geophagia was a common finding among Turkish children and women in
villages associated with severe iron deficiency anemia in addition to zinc depletion
(Cavdar et al., 1983). Young (2010) found that pica is a consequence of
micronutrient deficiency, but not necessarily an attempt to remedy it.
Clays have been used to reduce abdominal pain caused by hookworms, to reduce or
ease hunger pangs, to soothe heartburn and nausea and to satisfy cravings since
soils are supposed to taste good (Hunter & de Kleine, 1984). There is also evidence
that supports the usefulness of the flora found in soil. Some researchers have even
suggested that it is useful in the establishment of healthy bacteria within the digestive
tract, claiming that it can improve the symptoms experienced during Crohn's Disease
and Leaky Gut Syndrome (Dominy et al., 2004). A study done in the late 1970s by
Vermeer & Frate (1979) showed that geophagia contributed to hypertension but did
not correlate with hunger, anaemia or helminthic problems in rural areas in
Mississippi. In some parts of the world, for example in Haiti and China, rising food
prices have driven many of the nation's poor to consume clay cookies on a regular
basis to ward off hunger (Wilson, 2003).
Despite the claimed benefits, geophagia may also be harmful to humans in terms of
microbiological and environmental health aspects. Geophagia has been criticised as
unhygienic, exposing consumers to toxic constituents such as heavy metals and
parasites (Reilly & Henry, 2000), and has been reported to contribute to the helminth
load when soils with infective stages of parasites are consumed (Harvey et al., 2000;
Geissler et al., 1999). Saathoff et al. (2002) showed that geohelminth infections were
a major health problem of children from rural areas in developing countries and that,
in addition to high prevalence rates, there were high re-infection rates.
Significant differences in hookworm intensity have been observed between
geophagous and non-geophagous women (Luoba et al., 2005). Women who ate
termite mound earth were more often and more intensely infected with hookworms at
delivery than those eating other kinds of earth. (Luoba et al., 2004). In South Africa,
Saathoff et al. (2002) demonstrated that Ascaris lumbricoides was more prevalent in
children who regularly ate soil from termite mounds (28%) compared to non-

3
geophagous children (19%) and it was less common in groups that preferred tree
termite soil (13%) compared to soil from other sources (8%). Young et al. (2007)
found that geophagia is not a source of Trichuris or hookworm infection among
pregnant women in Pemba (insufficient power to evaluate the effect of Ascaris),
which is in contrast to other reported findings of helminth infection and geophagia.
Geophagia could also cause constipation (Dickins & Ford, 1942) as well as bowel
impaction, dental injury and inadequate nutrient intake (Gonyea, 2007).
In contrast to the reported negative consequences of soil consumption, soil plays a
pivotal role in both human and animal nutrition in many cultures as a means of
supplying essential mineral nutrients through the soil-plant-human and soil-plant-
animal food chains. Soil may contain large quantities of both macro- and micro
mineral nutrients that could possibly be important in human nutrition in some
populations. In this regard, Abrahams & Parsons (1997) have suggested that
geophagia could be a source of supplementing nutrients.
Contrary to this, a study by Hooda et al., (2004) showed that instead of releasing
mineral nutrients for supplementation, the soils generally removed nutrients that were
already bio-available in the solution. A study by López et al., (2007b) also indicated
that the daily intake of iron and zinc in pregnant women with pica was lower than in
pregnant women without pica.
Wilson (2003) and Young et al. (2008) have suggested that research into geophagia
requires a strong interdisciplinary approach. Despite the possible advantages and
disadvantages of geophagia and taking into account that this practice occurs
commonly, limited research has been undertaken in this regard. Although a couple
of studies have focused on geophagia related to enzootic aspects, there are no
documented studies addressing the mineralogy, geochemistry, chemistry,
microbiology, ecology and environmental health of geophagic soils in South Africa.
1.1.2 Iron deficiency
Approximately one third of the world population (2 billion) suffer from iron deficiency
(Nojilana et al., 2007). Iron deficiency can be caused by a number of pathways, of

4
which one is insufficient dietary intakes of iron, protein, folate and vitamin C (World
Health Organization (WHO), 2004). Approximately two-thirds of total body iron is
found in haemoglobin of red blood cells and the remaining body iron is stored as
ferritin. Haemoglobin and ferritin levels are documented to be the most significant
diagnostic indicators of iron deficiency anaemia (Ioannou et al., 2002). Anaemia is
the final indicator of chronic long term iron deficiency and many symptoms are
reflected in several physiological abnormalities. Examples hereof include poor
muscle function which leads to a decreased in productivity and muscle function and
abnormal cognitive development even before anaemia is present in children (Stopler
& Weiner, 2012: 727). Restless leg syndrome (RLS) is also associated with iron
deficiency (Spencer et al., 2013). Progressive untreated anaemia leads to
cardiovascular and respiratory changes which can cause cardiac failure, which
demonstrated the importance of treating iron deficiency in individuals who are at risk
of cardiovascular disease (Pereira & Sarnak, 2003).
Globally, 10% of maternal deaths are caused by iron deficiency anaemia (Nojilana et
al., 2007). In South Africa 4.9% of maternal deaths were attributed to iron deficiency
anaemia in 2000 (Nojilana et al., 2007). In 2012, 9.7% of South African women
between the ages of 16 -35 years had iron deficiency and 12.2% of men and 22% of
women were anaemic (South African National Health and Nutrition Examination
Survey, (SANHANES-1), 2013).
Iron deficiency anaemia has been shown to be the cause of significant health and
economic loss (Saeed et al., 2013). Iron deficiency anaemia causes 1.3% of global
total Disability Adjusted Life Year (DALYs), with South-East Asia contributing 40%
and the Africa region about 25% towards the burden of the disease (WHO, 2006).
Stephenson et al. (2000) have reported that the total cost per annum of productivity
loss in South Asia due to iron deficiency was $5 billion dollars. In the year 2000 an
estimated 1.3% of all DALY’s in South Africa were due to iron deficiency anaemia
(Nojilana et al., 2007).
5
1.2 AIM OF THE STUDY
The main aim of this study was to determine the nutritional status and risk factors
associated with women practising geophagia in QwaQwa, South Africa and to
subsequently develop a nutrition education intervention in order to address the
nutritional and health implications of the practice of geophagia.
.
1.2.1 OBJECTIVES
Objectives of this study were to determine:
The nutritional status of a group of participants that practiced geophagia and a
control group that did not practice geophagia:
Nutrient intake.
Anthropometric status.
Physical activity.
Blood parameters.
Associations between the practice of geophagia and nutrient intake,
anthropometric status and blood parameters.
The factors (odds ratios) that have an influence on parameters of nutritional
status of women practicing geophagia and not practicing geophagia (including
nutrient intake, anthropometric status, physical activity and blood parameters).
To develop a nutrition education intervention to address the nutritional and
health implications of the practice of geophagia.
To determine the impact of the intervention on the practice of geophagia.
1.3 STRUCTURE OF THE THESIS
The first chapter of the thesis includes the problem statement and motivation for the
study and outlines the main aim and objectives of the study. In Chapter 2 a literature
review related to the practice of geophagia is given. The methodology applied in the
study is discussed in Chapter 3, while the intervention is described in Chapter 4. The
results are reported in Chapter 5. The results are discussed in Chapter 6, followed
by conclusions and recommendations in Chapter 7. The summary of the study is
bound at the back of the thesis.

6
CHAPTER 2
LITERATURE REVIEW
2.1 INTRODUCTION
According to Young et al. (2010a), pica is defined as "the craving and purposive
consumption of substances that the consumer does not define as food." As early as
1930 the occurrence of pica was documented by Laufer (1930) when he reported on
geophagia in his Anthropological Series. Pica has been described in almost every
culture (Halsted, 1968; Reid, 1992). Geophagia is the most common type of pica
described in the literature and refers to the "deliberate eating of soil" (Young et al.,
2010a; Njiru et al., 2011). This practice is said to be related to poverty and famine
but can also be observed in the absence of hunger. Although the practice is more
common under pregnant women, lactating women, schoolchildren and people with
psychiatric disorders (Bisi-Johnson et al., 2010) there are groups in which the
practice is common in the whole community.
According to González-Turmo (2009: 43) "food is what people eat and non-food is
that which people do not or should not eat." The understanding of what constitutes
food can differ from one culture to another and thus this statement is a subjective
one. The concept of food and non-food items is cross-cultural and biased (González
et al., 2004) and is explained by González –Turmo (2009: 43) as "each person
asserts his/her taste in food with an unquestionable right to do this, and the assertion
inevitably contains a categorization of what is and what is not food"
Food practices and habits are distinguished by the terms "not edible" or "inedible"
and "edible". As mentioned, these terms are also interpreted differently in different
cultures (MacClancy et al., 2009: 3). The human being chooses foods based on
sensory, psychological and nutritional properties (Messer, 2009: 54).
Chagga women in Tanzania use the term Tamaa to describe feelings of why they
consume clay. The smell of the soil arouses Tamaa (which means the desire for rare

7
things). Starehe is linked to personal taste, satisfaction, ego and fantasy. These
terms have been used to describe the practice of consuming non-foods such as soil
eaten by women on the slopes of Mount Kilimanjaro (Knudsen, 2004). Allport (2002)
has suggested that a craving for salt can also be considered a form of geophagia.
In the Southwest of America, Indians mix geophageous clays with acorn-based
dough, and then bake it as a food item (Sing & Sing, 2010). In Sardinia and northern
California traditional breads are made of acorn flour, water and clay (Hunter, 2004, p.
72).
Food is consumed because of human nature and cultural requirements and
influences. According to MacClancy and Macbeth (2004: 5-6), food is divided into
the two sub-categories of "substance" and "symbol" and therefore contributes to the
body’s physical and social well-being.
Medical Geology is the study of the impact of geologic materials and processes on
human health. This is a new emerging field which interacts with different disciplines
such as geoscience, biomedical science and nutrition (Bunell et al., 2007).
Geophagia is an area of concern in medical geology.
In the following section a discussion of pica in general, followed by a more detailed
overview of the practice of geophagia, will be given.
2.2 PICA
The word "pica" originates from the magpie bird named Pica Pica (Latin) by Linnaeus
due to their vigorous appetite. Pica is characterized by the deliberate consumption of
non-food items for more than one month (Young, 2009: 17; American Psychiatric
Association, 2000). Consumption of non-food items during pregnancy often involves
geophagia or amylophagia (Erick, 2012: 363).

8
2.2.1 Classification of pica
According to Uher & Rutter (2012), pica is classified as a form of eating disorder
which may include the deliberate intake of large quantities of plastics
(plasticophagia), faeces (coprophagia), lead (plumbophagia), starch or dough
(amylophagia) and clay or soil (geophagia). Other forms of pica include amylophagy
(eating of raw starches) and pagophagy (eating large quantities of ice) (Danford,
1982).
Pagophagia is seen as an unusual manifestation of pica which appeared
predominantly in the USA (Sayetta, 1986). The practice of pagophagia was first
described by a French royal doctor, in women and young girls suffering from
chlorosis (Parry-Jones, 1992). Although very limited data about this practice is
available, craving for ice has been associated with iron deficiency in a case series
(n=3) of Caucasian women and men as well as a Hispanic woman (Khan & Tisman,
2010).
Plasticophagia is the frequent nibbling and sucking of plastics (Tayie, 2004), while
plumbophagia is the consumption of lead (Mensah et al., 2010) often eaten in the
form of lead paint chips (Lacey, 1990). Coprophagia is reportedly practiced for
cultural reasons. Miller (1998) reports that the Zunis (an Indian population in South
America), eat human faeces as part of their rituals. Cultures in West Africa also
believe that this behavior is an act of trust and dependence (Cantarero, 2009).
Amylophagy is one of the more frequently types of pica practiced (Young et al.,
2010b) and refers to the consumption of uncooked rice (Young et al., 2010a), laundry
starch (Rainville, 1998) and corn starch (Corbett et al., 2003).
During pregnancy, pica can include different kinds of materials that are craved.
These can include starch (Young, 2010; Tayie & Lartey, 1999; Taylor, 1979;
Snowdon, 1977; Keith et al., 1968; O’Rourke et al., 1967; Sage, 1962; Gladfelter et
al., 1960; Posner et al., 1957), ice (Corbett et al., 2003; Simpson et al., 2000;
Rainville, 1998; Coles et al., 1995; Schwab & Axelson, 1984), ash (Nyaruhucha,
2009;) chalk (Walker et al., 1985) and paper (Mikkelsen et al., 2006; Al-kanhal &
Bani, 1995; Edwards et al., 1954).

9
2.2.2 Aetiology of pica
The aetiology of pica is unclear, but factors involved in the development of pica may
include hunger, micronutrient deficiencies, gastrointestinal distress, and protection
from pathogens and toxins (Young et al., 2008; Gonyea, 2007). Psychosocial and
biochemical related causes are also suggested to contribute to pica behaviour (Ellis
& Pataki, 2012). Psychological, cultural, medical, social, spiritual, religious, and ritual
needs have also been related to the practice of geophagia (Geissler et al., 1999;
Hunter & De Kleine, 1984; Danford, 1982). According to Young et al. (2010c), the
three main causes of pica include hunger, micronutrient deficiency and protection
from toxins and pathogens.
2.2.2.1 Hunger
Pica is often practiced where poverty and famine are prevalent to decrease appetite
and fill the empty stomach (Hawass et al., 1987). Young explains this hypothesis
"that hunger motivates pica" in her book, "Craving Earth" (Young, 2011: 92) and
suggests that there are four possible explanations for this practice:
* People who practice pica do not have enough food available;
* People who practice pica do so to fill their stomachs in an attempt to stave off
feelings of hunger;
* Non-food substances would not be craved if other food was available;
* People practicing pica would then not choose specific non-food substances, but
would eat any available non-food substances.
Literature as far back as the eighteen centuries has shown that a small percentage of
people practice pica due to hunger (Von Humboldt et al., 1814). The Indians in
Otamac only eat clay for two months of the year when food is not available, but not
for the rest of the year when food is more plentiful. This finding contradicts the
findings of Young et al. (2010a), who state that pregnant and non-pregnant women
do not eat soil because of hunger. Early reports of pica do not indicate the amount of
non-food substances consumed (Maupetit, 1911; Morel-Fatio & Tobler, 1896), but
only used terms such as "small quantities" and "size of a nut." Young (2011: 95)
state that "if hunger motivated pica, people would not expect the substances to be

10
strongly desired, but rather eaten as a desperate remedy for hunger." Some authors
have also indicated that pica is associated with terms such as "a devouring passion"
(Galt, 1872) and "I went wild over it" (Spencer, 2002). In Pemba, Zanzibar, people
choose their pica substances very carefully (Young et al., 2010b) and are thus
particular about the type of non-food substance that they choose to eat.
2.2.2.2 Micronutrient deficiency
Malnutrition has also been suggested as a reason for practicing pica (Sugita, 2001).
Pregnant women and children are at the greatest risk for developing micronutrient
deficiencies such as iron, zinc and calcium. According to Young (2011: 58; 2010)
pagophagy may occur during iron deficiency and pica is also related to zinc and
calcium deficiencies. The authors estimate that "there are twenty case reports of
anaemia associated with pica for every one report of any other negative health
outcome." A cross-sectional study undertaken in Kenya found that 56% of pregnant
women that practiced pica had low iron status (Geissler et al., 1998).
Individuals who had zinc and iron deficiencies have been reported to abstain from the
practice of pica after receiving iron and zinc supplements (Moore & Sears, 1994;
Nicoletti, 2003). In contrast, Young (2011: 108) reports that there is no evidence that
micronutrient supplementation affects pica behaviour.
(i) Association between pica and iron deficiency
As mentioned, a number of studies have shown an association between the
practice of pica and iron deficiency (Kettaneh et al., 2005; Khan & Tisman,
2010). Bushara et al. (2010) identified pica as a risk factor for anaemia in
pregnant women in a cross-sectional study in Central Sudan. In addition, Poy
et al. (2012) reported that 39% of pregnant women (n=42) consuming non-food
items, showed lower blood levels for iron than pregnant women not practicing
pica (n=69) attending the Florito Hospital in Argentina. In contrast, Barton et al.
(2010) did not find any difference in iron deficiency or iron deficiency anaemia
between women with pica and without pica in their study undertaken among
262 non-pregnant adult outpatients. Ellis & Schnoes (2006) found that pica is
linked with significantly lower maternal haemoglobin levels at birth.

11
(ii) Association between pica and zinc deficiency
A few studies have shown an association between pica and zinc deficiency. A
cross-sectional study in Chandigarh, Northern India showed that children
between 18 and 48 months with pica had lower mean plasma levels of Zn
(Singhi et al., 2003).
(iii) Association between pica and calcium deficiency
In a study amongst urban African American pregnant women, those who
engaged in pica had a lower calcium intake than those who did not (75% vs.
60.3% respectively) (Edwards et al., 1994). However, the calcium intake was
measured indirectly. Wiley & Katz (1998) have indicated that the consumption
of dairy products is inversely related to geophagia during pregnancy.
(iv) Pica in populations with high micronutrient requirements
On the one hand, it is speculated that pica is an adaptive reaction to
micronutrient deficiency, while on the other hand the practice of pica may cause
micronutrient deficiencies. According to Young (2011: 113) the practice of pica
does not contribute to micronutrient deficiencies. Johns and Duquette (1991a)
speculate that pica is the cause of micronutrient deficiency, because the
micronutrients bind with the ingested substance and thus make them less likely
to be absorbed.
2.2.2.3 Protection from toxins and pathogens
The detoxification and protection hypothesis that is described by Young et al.
(2010a), attributes protection from pathogens or plant chemicals by either binding
with them directly or by binding with the mucin layer (thereby preventing their
passage into the bloodstream) to the practice of pica.
The Pomo Indians in California and native Sardinians in Italy make bread of acorn
flour (Johns and Duquette, 1991a; 1991b). Acorn is dangerous because of the high
tannin content. These communities use clay to neutralize the tannin level which
apparently makes consumption safer and tastier. Indians of the American Southwest
and Mexico used clay with wild potatoes, while some communities in Peru and
Bolivia still neutralize solanine in wild potatoes with soil to prevent absorption thereof

12
(Johns, 1986; Johns 1996). In contrast, Young (2011: 129) explain that the
abovementioned form of using soil is not a craving, but is part of a recipe.
2.2.3 Prevalence of pica
The practice of pica is more common amongst persons with mental disorders, during
pregnancy, and amongst certain cultural groups (Sugita, 2001; Ellis & Pataki, 2012).
Pica has been shown to occur between 5.7% and 25.8% of persons with mental
disabilities (Ashworth et al., 2009; Danford et al., 1982) and is more likely to be
prevalent in persons diagnosed with autism (Kinell, 1985).
Cravings for non-food items are not exclusive to one geographic area, race, sex,
culture or social status; and are also not limited to pregnancy (Erick, 2012: 363).
Other risk factors for pica include epilepsy, mental retardation and brain damage
(Ellis & Pataki, 2012). The actual prevalence of pica is not known, because it is often
a practice that occurs in secret and is not reported (Ellis & Pataki, 2012).
2.2.3.1 Worldwide
In rural areas of Southern America some women crave non-food items such as clay
and laundry starch while British women are more likely to crave coal during
pregnancy (Trupin, 2012). Golden et al. (2012) have reported that the practices of
geophagia and amylophagy were very common amongst men and women from the
Malagasy population. Women attending antenatal clinics on Pemba Island, Tanzania
(n=2361) showed a 40.1% prevalence of any pica substances (Young, 2010). This
was also found in Southern California and Ensenada, Mexico (n=225); Texas, USA
(n=281); Denmark (n=70,000); Argentina (n=327) and Norway (n=84) (López et al.,
2007a; Mikkelsen et al., 2006; Corbett et al., 2003; López et al., 2001; Simpson et al.,
2000; Rainville, 1998; Mansfield, 1977; Khanum & Umapathy, 1976). In 1958 the
British Broadcast Coorporation (BBC) reported the intake of non-food items in 187
listeners that sent letters related to the topic (Harries & Hughes, 1958). A study done
in Saudi Arabia showed that 8.8% of pregnant women attending health centres
(n=321) practice pica (Al-kanhal & Bani, 1995) and 13.6% of pregnant women
(n=416) in Sudan craved non-food items (Osman, 1985). A high percentage of

13
pregnant women in Iran (60.9%) were reported to practice pagophagia (Mortazavi &
Mohamadi, 2010).
2.2.3.2 Africa
In a study undertaken in Tanzania by Nyaruhucha (2009), 63.7% of pregnant women
experienced pica, eating soil, ice and ash. A study by Koryo-Dabrah et al. (2012)
reported that more than fifty percent of pregnant women in Ghana practiced pica in
the first trimester of pregnancy, 42.3% in the second trimester and 42.1% in the last
trimester.
2.2.3.3 South Africa
In a small descriptive study undertaken in Bloemfontein, South Africa, by Louw et al.
(2007), the authors reported a higher prevalence of pica in black people compared to
other races in their study amongst non-pregnant women younger than 18 years with
low ferritin levels (less than 40 mg/L). In another study undertaken by Walker et al.,
(1985), twenty four percent of women (n=1771) from 5 different racial groups with
infants younger than one year, reported practicing pica.
2.2.4 Conditions associated with pica
Conditions and factors associated with pica include iron deficiency anaemia,
psychiatric conditions, epilepsy, pregnancy and social- and cultural orientation.
2.2.4.1 Iron deficiency anemia
Iron deficiency affects one-third of the world’s population and is often associated with
pica (Yadav & Chandra, 2011). A number of cross-sectional studies have reported
that iron deficiency and/or anaemia are associated with pica (Young, 2011: 161). In
109 pregnant women attending the Fiorito Hospital, Argentina, 38% were practicing
pica and showed lower iron and zinc levels compared to the other pregnant women
without pica (Poy et al., 2012). Similarly, women in Argentina with pica (n=327) had
a higher incidence of iron deficiency-anaemia than their control group (López et al.,
2007b; López et al., 2001).

14
A study by Dickinson et al. (2009) also showed that iron deficiency in pregnant
women was higher in the Chikwaya district than the Chiradzulu district in Malawi,
possibly due to differences in the soil samples that are eaten (Dickinson et al., 2009).
Similarly, an association between pica and low haemoglobin levels was found in
women in Tanzania (n=2361) (Young et al., 2010a). Anaemia was also present in
37% of women consuming clay in a cross-sectional study conducted in an east
Anatolian Province in Turkey (Karaoglu et al., 2010).
In contrast, other studies could find no relationship between pica and haemoglobin
levels. Randomly selected postnatal inpatients from urban and rural areas of
Georgia, USA showed no difference in haemoglobin levels between pica and non-
pica groups (O’Rourke et al., 1967). Similarly, women in North Carolina attending
antenatal clinics (n=128) did not show a difference in haemoglobin levels due to the
practice of pica (Corbett et al., 2003).
There is controversy about the practice of geophagia and its relationship with iron
deficiency. On the one hand some researchers report that geophagia results in iron
deficiency, while others feel that iron deficiency triggers geophagia (Hooda & Henry,
2009: 90). Pregnant women in Malawi who suffer from iron deficiency believe that
the soil will provide a valuable source of iron (Lakudzala & Khonje, 2011). Some
studies have also illustrated that iron supplementation helps geophagists to improve
their iron status and to stop the practice of geophagia (Arbiter & Black, 1991). In
contrast, Nchito et al. (2004) found that where geophagia was practiced among
Zambian schoolchildren in Lusaka, iron supplementation did not impact on the
practice of geophagia.
2.2.4.2 Psychiatric conditions
In adults, pica is often associated with mental retardation and psychosis (Bhatia &
Gupta, 2009). The American Dietetic Association considers pica, and specifically
geophagia, as a psychobehavioural disorder (Hunter, 2004: 70). Literature has
demonstrated that people with intellectual disability and other developmental
disabilities are more prone to developing behavioural problems (McIntyre et al.,
2006). A population-based survey conducted in the rural area of Bangladesh

15
showed that behavioural impairments, which included nocturnal enuresis and pica,
occurred more commonly amongst children between the ages of two and nine
(n=4003). These behavioural impairments were significantly linked to cognitive and
motor disabilities (Khan et al., 2009).
2.2.4.3 Pregnancy
Pica occurs more commonly amongst pregnant women from low socio-economic
communities (Rose et al., 2000). In a study undertaken amongst pregnant women in
Tanzania, appetite changes that included cravings, aversions and pica were reported
(Patil, 2012). Women practicing pica during pregnancy range from 0–68%,
depending on the patient population (Smulian et al., 1995). Ahmed et al. (2012)
found a significant correlation between age and family history with the practice of
pica under pregnant women in Khartoum, Sudan, with younger women being more
likely to practice geophagia than older women.
In countries such as Malawi (Hunter, 1993) and Nigeria (Vermeer, 1966), pica and
pregnancy are synonymous with each other. Pregnant women visiting antenatal
clinics in North America (Corbett et al., 2003; Edwards et al., 1994), South America
(Simpson et al., 2000), Africa (Young et al., 2010c; Karimi et al., 2002; Tayie &
Lartey, 1999) and Europe reported practicing pica.
2.2.4.4 Social and cultural orientation
In a study about pregnant women in Argentine, López et al. (2012) reported that
nearly half of the women of a sample of 1,014 reported a family history of pica. In
another study by Ashworth et al. (2009), undertaken in three special institutions in
Ontario for people with intellectual disabilities, the authors reported that pica was
strongly associated with disrupted parent-child relationships, lack of social contact
and low involvement in recreational activities.
According to Geissler et al. (1999), some cultures learn pica from their cultural
beliefs. Certain occupations such as potters and gardeners have always been
reported to be more prone to pica (Hochstein, 1968). In contrast, Cooksey (1995)
has reported that African American women who engage in pica feel alone and do not
engage in pica due to cultural reasons.

16
2.3 GEOPHAGIA
As previously mentioned, geophagia is the practice of consuming clay, dirt and other
parts of the earth’s crust, and is practiced worldwide (Ghorbani, 2008). Geophagia is
the most common type of pica practiced in Southern Africa and South Africa (Brand
et al., 2009) and has been categorized as a medical condition by the World Health
Organization (WHO, 1996).
2.3.1 History of geophagia
The earliest documentation related to geophagia was written by Hippocrates (460 –
380 BC) who said that "if pregnant women eat earth or charcoal, the child that enters
the world will be marked on its head with these substances" (Hippocrates 1839: 487).
In his journey reports, Von Humboldt documented that mothers from the Otomac
tribe in Peru feed their children large amounts of clay to keep them quiet (Halsted,
1968). A midwife called Trotula of Salerno also reported the practice of eating clay,
chalk or coal, and suggested that beans cooked with sugar should be eaten with it
(Salerno 2001, p. 96). Reference to geophagia also dates back to the 18th century
when people from the Sultan of Turkey were reported to consume a certain type of
clay from the island of Lemos. This clay was reportedly considered to be a "healthy
food" by Europeans (Starks & Slabach, 2012). Travellers and missionaries in Africa
also reported the practice of geophagia during the 18th to the 20th century in countries
like Nigeria, Ghana and Sierra-Leone (Hunter, 1993). Hawass et al. (1987)
documented that miners in Austria made "stone butter" from clay and mountain
tallow, which was used instead of butter on bread.
2.3.2 Aetiology of geophagia
The practice of geophagia varies in different cultures according to the local soil types
and cultural motivation for the behaviour (Sing & Sing, 2010; Brand et al., 2009). The
dominant reasons for practicing geophagia are related to medical reasons (Reid,
1992), cultural and religious purposes (Vermeer & Ferrell, 1985) and because of
mental illness (Hunter, 1973).

17
From a survey of historical references, Parry-Jones & Parry-Jones (1992) found that
black slave populations in the southern United States were also more likely than
other Americans to practice geophagia.
2.3.2.1 Physiological factors
Geophagia is reported to be a reaction to a physiological need and is associated by
some with growth periods such as pregnancy and childhood (Cavdar et al., 1983).
According to Zedlitz (2010), the craving for clay usually occurs when the demand for
nutrients is higher, such as during pregnancy and childhood. As far back as 1959,
Lanzkowsky suggested that iron deficiency causes geophagia, but the evidence is
not conclusive. Young et al. (2010a) found that iron deficiency-anaemia occurred
significantly more often in pregnant amylophagists in Tanzania. Geophagia is also a
risk factor for diarrhea in Kenyan children (Shivoga & Moturi, 2009) and anaemic
pregnant women in the community of eastern Sudan (Adam et al., 2005). In Uganda
soils are ingested for medical purposes to absorb harmful substances such as tannin
and to reduce the bitterness of certain foods (Abrahams, 1997).
2.3.2.2 Psychological factors
As previously mentioned in the section on pica, the compulsive ingestion of soil is
linked to numerous psychological abnormalities (Callahan, 2003). Young urban
geophagic women that practice geophagia in South Africa believe that clay improves
ones natural beauty (Songca et al., 2010) and pregnant women in Nairobi, Kenya,
choose soft stone because they believe it is safer and makes the baby and mother
stronger during labour (Ngozi, 2008).
2.3.2.3 Environmental factors
Geophagia is often practiced in populations where poverty is severe and famine is
present (Ghorbani, 2008) as well in traditional societies where cultural change or
transitions in lifestyle are common (such as in sub-Saharan Africa). Although
geophagia is sometimes practiced as a treatment for diarrhoea, geophagia is also a
risk factor for developing diarrhoea as a result of poor sanitation (Shivoga & Moturi,
2009). This finding was confirmed in a study undertaken in Kenya amongst children
18
under five years of age who were exposed to environmental health risks in the home
environment such as animal waste in the yard (Shivoga & Moturi, 2009).
2.3.3 Prevalence of geophagia
2.3.3.1 Worldwide
An in-depth study undertaken in villages around Shiraz city in the Fars province of
Iran, showed that children and pregnant women were more likely to practice
geophagia than other members of the community (Karimi et al., 2002). The
Aboriginal people in Australia also eat white clay for medicinal reasons (Bateson &
Lebroy, 1978). In Mexico, eating deep red dirt of Chimayo, "an old adobe-brick and
stucco structure", is practiced daily since it is believed that the clay is sacred
(Callahan, 2003). In the United States of America, a significant percentage of
pregnant women (31.1% of 225) in Southern California, and Ensenada in Mexico,
practiced geophagia (Simpson et al., 2000), while 23% - 44% of the Latin-American
population practice geophagia (López et al., 2004). The percentage of women in
urban areas of Washington DC that practiced geophagia was found to be low (8%)
(Edwards et al., 1994), while women in Texas reported a high incidence (76%) of
consuming clay (Rainville, 1998). In urban and rural areas of Augusta, Georgia,
32.5% of postnatal inpatients practiced geophagia (Sage, 1962) and in women
(n=211) attending antenatal clinics in Georgia, 21% consumed soil during pregnancy
(Edwards et al., 1954). Pregnant and lactating women (n=204) attending two health
facilities in Dar es Salaam, Tanzania, showed a 60% incidence of eating soil
(Nyaruhucha, 2009). Pagophagy occurs more often than geophagy in Brazil (Kim &
Nelson, 2012) and in New Jersey 53% of pregnant women (n=1334) between 13-24
years of age consumed ice (Coles et al., 1995). Geophagia is also prevalent where
4.8% of 125 women in private and public antenatal clinics in Kingston, Jamaica
reported consuming soil (Landman & Hall, 1992). In another Jamaican study,
children who practiced soil eating were more prone to malnutrition (Shivoga & Moturi,
2009). Several studies have also reported that children of school-going age practice
geophagia. These include children from Lusaka, Zambia (74.4%) (Nchito et al.,

19
2004), Senegal (58.7%) (Diouf et al., 2000) and Mississippi in the USA (26%)
(Ferguson & Keton, 1950).
2.3.3.2 Africa
African countries have the highest incidence of practicing geophagia (Ngozi, 2008)
ranging from 56% in Kenya under pregnant women (n=275) to 73% of schoolchildren
(n=285) in western Kenya (Geissler et al., 1998). Clay eating has been reported to
be common in five African countries, namely Malawi, Zambia, Zimbabwe, Swaziland
and South Africa (Walker et al., 1997). In Malawi, pregnant women commonly
practice geophagia, but women who are not pregnant do not practice geophagia
because they believe that it is a sign of pregnancy (Hunter, 1993). Geophagia has
also been reported to be high amongst scholars in Nigeria where hookworm infection
was identified in 58% of primary schoolchildren in Anambra State (Chumkwuma et
al., 2009). The Chagga women of Tanzania believe that geophagia is sacred to
women and defines their femininity (Knudsen, 2004). HIV-infected women in Dar es
Salaam, Tanzania enrolled in a Vitamin A trial (n=327), reported a 29% prevalence of
geophagia (Kawai et al., 2009). In Swaziland the majority of geophagists were
women in the Hhoho and Manzini areas (Peter, 2011). In a literature review by Njiru
et al. (2011), the prevalence of geophagia in pregnancy was found to be as high as
84% under women in Uganda. In Kinshasa, Zaire a high prevalence of soil eating
(71.3%) was reported at antenatal and postpartum clinics at university hospitals
(Tandu-Umba & Paluku, 1988). Women (n=171) attending antenatal clinics in the
eastern Caprivi region of Namibia also consumed soil and 41.5% of the women were
found to be anaemic (haemoglobin <11 g/dl) (Thomson, 1997).
2.3.3.3 South Africa
In South Africa ingestion of clay is mainly practiced by pregnant women. In a study
undertaken by Walker et al. (1997) amongst South African women, the prevalence of
geophagia was found to be 38.3% in urban women and 44.0% in rural women. In
Indian, Coloured and White women the prevalence was much lower at 2.2%, 4.4%
and 1.6% respectively (Walker et al., 1997). Studies undertaken in the rural area of
QwaQwa in the Free State region (Mogongoa et al., 2011) and in Limpopo region
(Songca et al., 2010) have shown that the practice of geophagia is still prevalent
under persons from rural areas in Southern Africa. Saathoff et al. (2004) also

20
reported the prevalence of soil eating under rural schoolchildren from the Northern
parts of KwaZulu-Natal. In a survey conducted under 240 people in the Oliver
Tambo district of the Eastern Cape, 75% reported practicing geophagia (George &
Ndip, 2011).
2.3.4 Composition of geophagic soil
In the following section the texture and minerology of geophagic soil will be
discussed briefly.
2.3.4.1 Texture of soil
Soil consists of air, water, minerals, organic matter and biota that cover the terrestrial
earth in layers above the underlying bedrock (Skinner, 2007). Soils collected by
geophagists are most commonly collected from banks of rivers or adjacent to
freshwater seeps and springs (Sing & Sing, 2010). The soil profile is determined by
the depth from the surface, which is divided into soil layers or horizons (Figure 2.1)
described generally as A, B and C (Fey, 2010).
FIGURE 2.1. DIAGRAM SHOWING THE SOIL LAYERS (University Corporation for Atmospheric Research)
Horizon C refers to bedrock and is the origin of the minerogenic material in all layers
of a developed soil. Horizon A is commonly known as the topsoil and horizon B the
layer below horizon A. Layer A consists mostly of a mixture of biota, organic
materials and broken-down minerogenic particles (Fey, 2010).

21
2.3.4.2 Mineralogy of soil
Clay is largely made up of clay minerals, but quartz, feldspar, carbonates,
ferruginous material and other non-clay material can also be present and are in the
highest concentrations in the B horizon. Types of clay includes Ball clay, Fire clay,
Flint clay and Kaolin (which largely consist of kaolinite); Bentonite and Bleaching
earth (consisting mainly of montmorillonite). Common clays consist of a combination
of layers of illite/smectite and montmorillonite (Bergaya & Lagaly, 2006).
Geophagic clayey soil properties such as colour, texture, smell and taste all play a
role in the type of clay that geophagists choose to eat (Reilly & Henry, 2000; Wilson,
2003; Nchito et al., 2004; Young et al., 2007; Ekosse & Junbam, 2010; Ngole et al.,
2010; Young et al., 2010d). Bentonite clay is available worldwide as a digestive aid,
while kaolin is also widely used as a digestive aid and as the base for some
medicines. Attapulgite is an active ingredient in many anti-diarrheal medicines
(Ziegler, 1997). In Tanzania geophagic soil samples consist of 56% sand and 33%
clay. Kaolinite is the main component of the clay called pemba, with minor
components of illite, goethite and hematite (Yanai et al., 2009). Ekosse & Junbam
(2010) have reported that clays from Swaziland used for geophagia purposes were
dominantly greyish to reddish and had a pH value of 6.33. Rural women in Zambia
and Zimbabwe preferred soils from large termite mounds (Diamond, 1998), while
pregnant and lactating women in western Kenya prefer to ingest soft stone known as
"odowa" and earth from termite mounds (Luoba et al., 2004).
South African geophagists usually prefer clayey soils consisting of clay and sand
have a soft, smooth and powdery consistency (Ekosse & Junbam, 2010). Clayey soil
from the Free State Province is silky, whilst those from Limpopo Province are gritty
and powdery (Ekosse & Junbam, 2010). The geophagic clays in QwaQwa contain
mostly quartz and kaolinite (Ekosse et al., 2008). A study undertaken among rural
black women in QwaQwa showed that these women preferred white clay, while some
ate yellowish geophagic clays (Ekosse & Junbam, 2010). This is also seen in other
provinces such as the Limpopo Province (Ekosse & Junbam, 2010).

22
2.4 GEOPHAGIA AND HUMAN HEALTH
Many geophagists consume soil because they believe in the beneficial qualities of
clayey soil, which include reported relief of gastro-intestinal distress (Wilson, 2003),
detoxification (Walker et al., 1997), anti-microbial treatment and immune-booster
properties (Callahan, 2003), and mineral supplementation (e.g. calcium) (Hooda et
al., 2004). Some studies have also suggested that calcium in the soil reduces the
risk of pregnancy-induced hypertension (Wiley & Katz, 1998).
2.4.1 Advantages to human health
Advantages of soil consumption to human health have been reported and include
mineral supplementation, creating a barrier to toxins and relief from gastro-intestinal
distress.
2.4.1.1 Mineral supplementation
It has been suggested that soil consumption may increase the mineral content of the
diet. Some people believe that zinc and iron are acquired from the eating of clay.
Many soil samples contain iron and zinc, but bioavailability studies of iron and zinc
have, however, indicated that the clay does not actually provide additional zinc and
iron but in fact binds with the iron in foods ingested at the same time, reducing the
total amount of available dietary iron (Hooda et al., 2004; Hooda & Henry, 2009: 94).
Red soil may have properties that might prevent iron deficiency-anaemia, but may
also affect the bioavailability of the non-haem component and thus restrict iron
bioavailability (Dreyer et al., 2004). An in vitro study undertaken by Hooda et al.
(2004) showed that soils from Uganda, Tanzania, Turkey and India removed
minerals from the soil which is already bioavailable in the soil before consumption. In
an old study amongst 348 adult Black patients from the “Outpatient Department of
the Johannesburg” Non-European Hospital in South Africa, mean iron absorption
decreased by 12.4% after consuming soil with meals (Sayers et al., 1974).
Clays contain high levels of calcium and the bioavailability thereof has also been
claimded to be high, which makes it possible that calcium intake, can be increased
through soil consumption (Hooda et al., 2004). The continuous practice of geophagia

23
may thus be a way of calcium supplementation (Lakudzala & Khonje, 2011). Clays
also have a high citation exchange capacity which might have the beneficial
properties of binding with chemical toxins that plants produce, such as tannins and
glycoalkoloids (Dominy et al., 2004; Johns, 1996). This binding property of clay may
explain why people consume soil during periods of famine to counteract the toxins in
the plants and roots that they eat to survive (Hooda and Henry, 2009: 68). The
cation exchange capacity also has an effect on microbes. Clays such as attapulgite,
kaolin-pectin, diatomaceous earth, bentonite, and termite earth may reduce the
harmful effect of fungi, bacteria and viruses (Young, 2009: 71).
Smith et al. (2000) have reported that a number of studies have illustrated that soil
eating is considered good for health, because it "strengthens the blood and promotes
growth and physical strength." These authors have also suggested that pregnant
women consuming soil improve their immunity due to antigens that are produced in
response to the live organisms that are ingested.
2.4.1.2 Create a barrier
According to Hooda & Henry (2009: 69), geophagia may also create a barrier for the
invasion of toxins in three ways. Firstly, it may help the intestinal mucosa separate
ingested food from the rest of the body until it is suitable to be absorbed in the
bloodstream; secondly, it may slow down the movement of food through the gut and
lastly, increase the time of waste excretion. An example is smectite which is a large
component of soil (Mahaney et al., 2000) that binds with mucous in the gut to
increase the barrier effect (Leonard et al., 1994).
2.4.1.3 Relieving gastro-intestinal distress
Geophagia is also well known for its reported beneficial properties in relieving gastro-
intestinal distress (Wilson, 2003). Koalin and smectite (which is commonly found in
clay) has the potential to reduce nausea and gastro-intestinal upset (Hooda & Henry,
2009, p. 70). Clinical trials have shown that smectite reduces the severity and
duration of diarrhoea (Guarino et al., 2001; Narkeviciute et al., 2002). The pH of
clays is higher than hydrochloric acid in the stomach and because of the alkaline
properties of the clays, it could play a role in reducing heartburn (Nyaruhucha, 2009).

24
In Third World countries clay is reported to be consumed to line the stomach before
eating yam or fish which may be poisonous (Ghorbani, 2008).
2.4.2 Disadvantages to human health
2.4.2.1 Binding with minerals and toxic reactions
Some clay contains excessive and harmful amounts of minerals such as potassium
and zinc (Garg et al., 2004). The type of soil a geophagist chooses to consume
determines the possibility of nutrient-release in the gastro-intestinal tract (Figure 2.2)
(Aufreiter et al., 1997). Adsorptive clays are more likely to cause iron or zinc
deficiency (Simon, 1998). Abrahams (2012) has shown that soil containing mostly
kaolinite and micas (illite and muscovite) enter the stomach with a pH of 7-10.
Nutrient-ions retention is increased which can result in a higher incidence of nutrient
deficiency.
FIGURE 2.2: ILLUSTRATION OF THE PATH OF SOIL INGESTED BY HUMANS (Aufreiter et al., 1997)
As far back as 1961, a syndrome occurring in males in Iran was observed with
severe iron deficiency anaemia, Zn-deficiency, hypogonadism, hepatosplenomegaly

25
and dwarfism related to the geophagia syndrome (Arcasoy et al., 1978; Prasad et al.,
1961).
The first description of zinc deficiency associated with geophagia was made by
Prasad et al. (1961) in adolescent boys in Iran who had been clay eaters since
childhood. The phosphate in clay binds with Zinc, which explains why it is not
absorbed (Elmes, 2002). Geophagia was practiced by these males, but the
relationship between the syndrome and geophagia is unclear (Prasad, 2001). The
World Health Organization (WHO, 1996) suggested that the zinc deficiency was due
to "calcareous soil-type and leached arenaceous soils of low Zn content that may
lead to irregularities in human food chains."
Other health hazards include the toxic reactions to soils contaminated by lead or with
pollutants. Lead environmental pollution is common worldwide and pica has been
identified as a cause of lead poisoning (Khan et al., 2011). Soils may contain high
levels of lead, which can be absorbed into the bloodstream. High levels of exposure
to lead may contribute to lower intelligence quotient of children and be detrimental to
the foetus in pregnant women (Lakudzala & Khonje, 2011). As early as 1975 Hussey
reported that geophagists eating soil high in potassium may develop hyperkalaemia
(Ghorbani, 2008).
2.4.2.2 Gastro-intestinal problems
Mechanical bowel problems, constipation, ulcerations and intestinal obstruction, and
perforation and maternal death have been reported in cases where clay consumption
was common (Ellis & Pataki, 2012; Key et al., 1982). In addition, it can also be life-
threatening in patients with renal failure (Gelfand et al., 1975). Some geophagists
have experienced severe constipation (Woywodt & Kiss, 1999) and even intestinal
obstruction (Ye et al., 2004). Abdominal pain and diarrhoea occur more often in
pregnant Pemba women in which amylophagy and geophagy is a common practice
than in those without (Young et al., 2010a).
2.4.2.3 Organisms in soil
Geophagia is also associated with geohelminth infection. Geohelminth infections
affect 3.8 million people worldwide, and cause an estimated 135,000 deaths each

26
year (WHO, 2012). Eating soil may increase infection with endoparasitic organisms
such as geohelminths and Clostridium tetnai (Bethony et al., 2006; Flohr, 2003;
Abrahams, 2002). Worldwide, geohelminth infection is a health risk with
approximately two billion people infected, two million clinical cases and 60,000
deaths occurring every year (Glickman et al., 1999). In a study undertaken by
Sumbele et al. (2011), geophagists from the Mdantsane district in the Eastern Cape
also showed high incidence of geohelminth infection. Epidemiological and biological
studies have, however, shown that hookworm is not transmitted by geophagia
(Geissler et al., 1998; Saathoff et al., 2002). In contrast to other studies, Van Eijk et
al. (2009) could not find a correlation between geohelminth infections and soil eating
in a cross-sectional study among pregnant women in Tanzania.
Fungi, protozoa, viruses, prions and the archaebacteria are also commonly found in
soil and contribute to the musty smell of freshly turned soil. Microalgae are
photosynthetic and are mostly found in topsoil (Bisi-Johnson et al., 2010). Soil
microorganisms can be beneficial or harmful to mankind depending on their functions
and their impact on soil quality.
2.4.2.4 Dental damage
Geophagists can be identified by dentists by the wear on their teeth (Young, 2011:
64). Case reports showed evidence of tooth abrasion, cracks and erosion (Johnson
et al., 2007; Djemal et al., 1998), tooth decay (Abbey & Lombard, 1973) and a rare
pattern of damage to the tooth surface (Barker, 2005).
2.5 CONCLUSION
Pica is characterized by the deliberate consumption of non-food items for more than
one month (Young, 2009: 17; American Psychiatric Association, 2000). The
aetiology of pica is unclear, but factors involved in pica may include hunger,
micronutrient deficiencies, gastro-intestinal distress, and protection from pathogens
and toxins (Young et al., 2008; Gonyea, 2007).
Cravings for non-food items are not exclusive to one geographic area, race, sex,
culture or social status; and are also not limited to pregnancy (Erick, 2012: 363).

27
Other risk factors for pica include epilepsy, mental retardation and brain damage
(Ellis & Pataki, 2012). The actual prevalence of pica is not known, because it is often
a practice that occurs in secret and is not reported (Ellis & Pataki, 2012).
Geophagia is the most common type of pica described in the literature and refers to
the deliberate eating of soil (Young et al., 2010; Njiru et al., 2011). Geophagia has
been reported to be more likely to occur in a population that is at greater risk for iron
deficiency, for instance malnourished pregnant women (Izugbara, 2003; Hooda &
Henry, 2009: 90) and populations which rely on the intake of heavily toxin plants.
Geophagia often leads to mineral deficiencies such as iron, zinc or potassium (Reid,
1992). Iron deficiency is the most prevalent single deficiency documented worldwide
and is present in all populations which include rich and poor countries (WHO, 2008).
Anaemia is an indicator of iron deficiency, which can lead to behavioural and
cognitive dysfunctions (Yadav & Chandra, 2011).
Many geophagists consume soil because they believe in the beneficial qualities of
clayey soil, which include reported relief of gastro-intestinal distress (Wilson, 2003),
detoxification (Walker et al., 1997), anti-microbial treatment and immune-booster
properties (Callahan, 2003), and mineral supplementation such as calcium (Hooda et
al., 2004). The reported positive effects of geophagia on human health include
mineral supplementation, creating a barrier to toxins and relief of gastro-intestinal
distress. Disadvantages of geophagia include dental caries, binding of soil with
minerals which are important to human health and gastro-intestinal problems such as
diarrhoea. Geophagia is also associated with geohelminth infection.
28
CHAPTER 3
METHODS AND TECHNIQUES
3.1 INTRODUCTION
This study formed part of a larger study which investigated the practice of geophagia
in Africa. The larger study was divided into two phases. In phase one of the larger
study, mineralogy, geochemistry, ecology and environmental health factors of
geophagic soils were investigated. Specifically this part of the study (phase 2) was
related to determining the health and nutritional implications associated with the
practice of geophagia in women in QwaQwa and to develop an intervention to
address any adverse findings associated with the practice of geophagia.
During phase one, information about the attitudes, knowledge and beliefs of
individuals (practicing geophagia and not) regarding the practice of geophagia were
obtained using questionnaires. Furthermore, information regarding the geochemistry
and mineralogy of the soils that are utilised for geophagia was gathered.
The current study comprised phase 2 in which the health and nutritional implications
of geophagia were evaluated. A blood sample of geophagic individuals (40) as well
as 40 subjects who did not practice geophagia (control group) identified during phase
one of the larger study, were included in phase 2. Questionnaires were administered
to determine dietary intake, anthropometric measurements and blood samples were
obtained from both groups of individuals (Figure 3.1).
The intervention study followed in which a nutrition education intervention was
developed and implemented after the nutritional risk factors that needed to be
addressed had been identified. This intervention was offered to all those who
participated in phase 2 of the study as well as other members of the community who
were interested in receiving the intervention. After the three month intervention
period, a questionnaire related to geophagic practices was repeated in both the
geophagia and control groups to evaluate the impact of the intervention.
29
3.2 STUDY DESIGN
The study design comprised of an observational epidemiological study which
included an exposed (geophagia) and non-exposed (non-geophagia) group followed
by an intervention phase. An assessment of the impact of the intervention was also
conducted.
3.2.1 Sample selection
3.2.1.1 Population
According to the mid-year population estimate of the Free State Province, the total
amount of women between the ages of 15 and 44 were 740 983 for 2008. The
population of Thabo Mofutsanyane (Phuthaditjaba) consisted of 352 847 people
between the ages of 15 and 44, and this town had the highest non-urban population
(59.8%), in 2001. The Maluti, a Phofung population, consisted of 193 409 women in
2001 and showed equal proportions of males and females in the age groups up to
age 19, after which there were higher proportions of females up to the age of 85 and
above. According to STATS SA, there was only a 2.4% change in the population for
the period 2001 to 2008. Due to the fact that the practice of geophagia had not been
studied widely and the incidence of the practice was largely unknown, the population
included the broad population of women in QwaQwa, South Africa.
3.2.1.2 Sample
A random sample of 300 women in South-Africa was interviewed in phase 1 (Table
3.1) of the study which has already been completed but has not been reported in this
thesis (research not published yet).
For the larger study (from which the current study (phase 2) followed), random
samples of streets (starting at a fixed point) were selected by the biostatistician
specifically by using maps of the QwaQwa area. From each of the selected points,
the closest street was identified. In each of those streets all women that met the
inclusion criteria were approached and all women that gave informed consent were
30
included. If no women were available in that street, the street to the left of the
starting point was chosen.
It was hoped that if an initial sample of 40 experimental and 40 control participants
was used, the number of participants that eventually completed the current study
would statistically be sufficient in terms of power. From the list of geophagic
respondents identified in phase 1, participants for the experimental group were
randomly selected and approached to participate in phase 2 of the study, until a
sample of 40 individuals had been obtained. The individuals from phase 1 not
practising geophagia were then stratified according to the demographic distribution of
the geophagic sample and participants were randomly selected and approached for
consent to participate in phase 2 of this study until a sample of 40 individuals were
obtained, in order for the two groups to be compared.
Table 3.1 Distribution of respondents among participants in South Africa (Free
State, North West and Gauteng regions) for phase 1 and QwaQwa for
phase 2
Inclusion criteria for geophagia group in phase 2:
Females that practiced geophagia for at least once per day for a month or more;
Females who gave consent (Annexure A) that they were willing to participate in
the second phase of the project;
Non-pregnant females 18 – 45 years of age;
Females who consumed soil or clay;
Apparently healthy females (reported healthy according to the health questionnaire
and with a normal white blood cell count on the full blood count);
Inclusion criteria for control group in phase 2:
Females who gave consent (Annexure A) that they were willing to participate in
the second phase of the project;
RESPONDENT GROUP GEOPHAGIA GROUP CONTROL GROUP TOTAL
Participants (phase 1) 300 (geophagic and non-geophagic
women) 300
Adult women (phase 2) 40 40 80

31
Non-pregnant females 18 – 45 years of age;
Apparently healthy (reported healthy and normal full blood count).
3.3 MEASUREMENTS
3.3.1 Variables and operational definitions
The variables in phase 1 assisting phase 2 included information regarding the
attitude, knowledge and beliefs of individuals (practicing geophagia and not)
regarding the practice of geophagia, as well as the geochemistry and mineralogy of
the soils that were utilized for geophagia. The variables which were determined to
meet the objectives of phase 2 included socio-economic status, anthropometric
measurements, dietary intake, physical activity and a selection of relevant blood
parameters.
3.3.2 Geophagic status (Annexure B)
The geophagic status (phase 1) was determined using a questionnaire that
consisted of sections that addressed geophagic habits; extent and practices;
demographic and biological data; and medical history of individuals who practiced
geophagia; reasons for geophagic practices; soil/clay type (based on traditional
knowledge description); general profile and social and personal history of geophagic
individuals (Annexure B) for phase 1. University students from the Central University
of Technology (CUT) who spoke the local (indigenous) languages were recruited and
trained by the research team working from the CUT at that time. These university
students administered the questionnaires under the supervision of the fieldworkers
and research team. A total of 300 questionnaires were administered at the following
six study sites in four different provinces in South Africa:
o Free State: QwaQwa and Manguang.
o Northern Province: Duiwelskloof, including Burgersfort and Sekhukhune.
o North West: Ga-Rankuwa.
o Gauteng: Soshanguve.
32
The data regarding their geophagic status collected during phase 1(Annexure B),
was used as background information for phase 2 together with socio-demographic
status (Annexure C).
3.3.3 Socio-demographic status (Annexure C)
For the purpose of this study (phase 2) socio-demographic information included age,
language, pregnancy status, household composition, level of education, employment
status, type of dwelling, fuel used for cooking and household supplies.
3.3.4 Anthropometric nutritional status (Annexure D)
For the purpose of this study, anthropometric information included height, weight and
waist circumference. These measurements were used to calculate body mass index
(BMI) and waist circumference.
BMI refers to current weight in kilograms divided by height in m2. According to
international recommendations, underweight is defined as a BMI of less than 18.5
kg/m2; normal weight is 18.5 kg/m2 to 24.9 kg/m2; overweight is defined as a BMI of
25.0 kg/m2 - 29.9 kg/m2 and obesity is defined as a BMI of ≥30 kg/m2 (Hammond &
Litchford, 2012: 166).
When waist circumference was used as an independent predictor of risk for chronic
diseases of lifestyle, the cut-off for waist circumference in women is >80 cm (Alberti
et al., 2006).
3.3.5 Dietary intake (Annexure E)
Dietary intake for the purpose of this study, referred to nutrient intake determined
through amount and frequency of food consumption per day, per week, or per month.
The nutrients included energy, macro- and micronutrient intake. Macronutrient
intakes were interpreted using the recommended intakes as stipulated by the
Institute of Medicine (2002):

33
Total energy intake indicated in kilojoules compared to the Estimated Energy
Requirement (EER) ranges for women of different ages;
Total amount of energy from carbohydrates in diet between 45% – 65% of total
energy;
Total amount of energy from protein in the diet between 10% – 35% of total
energy; and
The amount of energy from fat in the diet between 25% – 35% of total energy.
The micronutrient intake was interpreted as follows:
The term Dietary Reference Intake (DRI) is a collective name and refers to a set of at
least four nutrient-based reference values, each with a specific application. In the
case of groups, the Estimated Average Requirements (EAR) was used as cut-off
points to determine the adequacy of intakes for each nutrient (Murray et al., 2012:
275). Intakes below 100% of the EAR were used to indicate an inadequate intake.
3.3.6 Physical activity (Annexure F)
For the purpose of this study, physical activity was defined as any form of muscular
activity or metabolic equivalents that resulted in the expenditure of energy (Ireton-
Jones, 2012: 26). The amount of time spent on sport and leisure activities were
established using the previous day physical activity recall (PDPAR) (Annexure F) as
validated by Weston et al. (1997). Patients were asked to list all the activities they
performed during a weekday. From this information the researcher calculated
physical activity level (PAL) for each patient as follows: the PAL value for the various
activities performed throughout the day was determined by adding the PAL for each
activity.
PAL refers to those activities structured around the household, as well as extramural
activities. PAL values are categorised as follows (Ireton-Jones, 2012: 26):
Sedentary: 1 - 1.4 PAL
Low activity: 1.4 - <1.6 PAL
Active: 1.6 - <1.9 PAL
Very active: 1.9 - 2.5 PAL

34
3.4 BLOOD PARAMETERS (PATHOLOGY)
The following blood parameters and international cut-off points were used to evaluate
or compare the results against (Lewis, 2006: 14):
VARIABLE NORMAL VALUES
Haematology
Red blood cell count 3.8-4.8x10¹²/l Haemoglobin 12-15g/dl Packed cell volume (haematocrit) 0.41 ± 0.05 (l/l) Mean cell volume 83-101fl Mean cell haemoglobin 29.5 ± 2.5 pg Platelet count 150-410 x 109/l White blood cell count 4.0 – 11.0 x 10⁹/l ESR 03 – 12 mm/h Clinical pathology
S-Total Protein 60 - 78 g/L Albumin 35 – 52 g/l Urea 2.6 – 7.6 mmol/l Serum iron 10 - 30 μmol/l Ferritin 10 – 291 μg/l Calcium 2.15 – 2.50 mmol/l Magnesium 2.3 – 2.6 mmol/l Potassium 3.5 – 5.1 mmol/l Phosphorus 0.8 – 1.45 mmol/l Chloride 98 – 107 mmol/L Sodium 136 – 145 mmol/L
C - reactive protein <10 mg/L S-Cholesterol <5.0 mmol/L S-ALT 10 – 40 IU/L S-AST 13 – 35 IU/L

35
3.5 TECHNIQUES
3.5.1 Questionnaires
Questionnaires (socio-demographic status (Annexure C), dietary intake (Annexure E)
and physical activity (Annexure F) were used to collect information from participants
during individual interviews with the researcher. The geophagic status questionnaire
(Annexure B), however was completed by trained fieldworkers during phase 1 and
not by the researcher. Appointments were made with participants beforehand and
interviews took place at the participant’s home. Where participants could not
understand English, trained interpreters assisted the researcher.
Dietary intake was determined using a validated Food Frequency Questionnaire
(FFQ) (Annexure E) and completed by the researcher with each participant. ). The
FFQ was validated for the Transition, Health and Urbanisation in South Africa
(THUSA) study by comparing the FFQ against a seven-day weighed record
completed by 74 respondents (MacIntyre et al., 2001a;2001b). Standardised food
models were used to estimate portion sizes. Food intake reported in household
measures was converted to weight in grams using the MRC (Medical Research
Council) Food Quantities Manual (Langenhoven et al., 1991a). Each FFQ was
summarised by the researcher (specific food code and weight in grams per day).
Intakes of macro- and micronutrients were determined using the Food Finder
Programme which included the MRC Food Composition Tables (Langenhoven et al.,
1991b).
3.5.2 Anthropometry
Anthropometric measurements (Annexure D) involve assessing the physical
measurements of an individual and relating these measurements to standards that
reflect health and nutritional status (Hammond & Litchford, 2012: 165). All
measurements were taken by the researcher.
Body weight was measured according to standard methods described by Hammond
& Litchford (2012: 166) with a calibrated Seca digital electronic scale to the nearest
0.1 kg. Participants wore light clothing and no shoes and stood in the middle of the
scale without touching anything, with their body evenly distributed on both feet. The

36
electronic scale was zeroed before weighing a participant and calibrated after every
20th participant measured by the researcher using a known weight.
Standing height of subjects were measured wearing light clothing and no shoes and
was measured to the nearest 0.5 cm using a stadiometer as recommended by
Hammond & Litchford (2012: 165). Participants stood with heels together, arms to
the side, legs straight, and shoulders relaxed, and the head in the Frankfort
horizontal plane (looking straight ahead) as described by Hammond & Litchford
(2012: 165). Participants placed their heels, buttocks, scapulae and the back of the
head against the vertical board of the stadiometer. Participants were asked to take a
deep breath and hold their breath just before the measurement was taken. This
ensured that an erect posture was maintained, while the headboard was lowered with
pressure to compress the hair on the highest point of the head. The researcher was
trained and the technique were standardized which contributed to the reliability of the
research result.
Waist circumferences were measured in duplicate, around the smallest part of the
waist to the nearest 0.1 cm, using a tape measure. The measurements in
centimetres (cm) were taken at the narrowest area below the rib cage and above the
umbilicus as viewed from the front. The measurements were taken at the end of a
normal expiration. These techniques were standardized which contributed to
consistency and reliability of the calculated waist circumference values (Hammond &
Litchford, 2012: 169).
3.5.3 Laboratory Analyses
Peripheral venous blood from the cubital vein (15 ml blood) was drawn for
pathological analyses. Blood was drawn by registered Biomedical Technologists with
training in phlebotomy. The following blood samples were drawn: 1 x 5 ml EDTA
plasma-specimens and 1 x 10 ml clotted serum-specimens. Blood samples for the
pilot study were analysed using standard laboratory techniques by Van Rensburg
Laboratory and data was sent electronically to the Department of Biostatistics at
Central University of the Free State. Five millilitres of blood from each participant
was collected into ethylenediaminetetra-acetic acid (EDTA) tubes for full blood

37
counts (FBC), sedimentation rate (ESR) and reticulocyte counts while ten millilitres of
clotted blood samples were used for parameters of iron status (total serum-iron and
ferritin). The SEDIPLAST® was used to measure the ESR which is a closed system
based on the Westergren method. The Westergren method is considered the gold
standard and is recommended by the International Council for Standardization in
Haematology (ICSH). Haematology specimens were done at the temporary
laboratory at the hotel and the rest at Central University of Technology (CUT) and
blood samples for chemical profile analyses for phase 2 (the current main study)
were analysed by the National Health Laboratory Services (NHLS), Universitas
Hospital, Bloemfontein, accredited with SANAS. Special authorization was given by
the hotel management in QwaQwa to run the temporary laboratory at their facilities
because some of the laboratory analysis needed to be done within four hours after
blood collection. The South African National Accreditation System (SANAS) is
recognised by the South African Government as the single National Accreditation
Body that gives formal recognition that Laboratories, Certification Bodies, Inspection
Bodies, Proficiency Testing Scheme Providers and Good Laboratory Practice (GLP)
test facilities are competent to carry out specific tasks in terms of the Accreditation for
Conformity Assessment, Calibration and Good Laboratory Practice Act (Act 19 of
2006). All tests were performed using commercially available reagents, standards
and controls for both normal and abnormal physiological concentrations. Serum iron
and transferrin were done on the Beckman Coulter CX9 and the transferrin saturation
automatically calculated. The Siemens Advia Centaur was used to determine ferritin
by using the method described by the UCSF Clinical Labs-Chemistry.
3.5.4 Validity and reliability
All issues addressed by the questionnaires were directly related to the aim and
objectives of the study. All data was collected by the researcher except for the
questionnaire related to human geophagia (Annexure B), where the trained
fieldworkers collected data in phase 1 as well as the collection of blood samples.

38
3.5.5 Socio-demographic Questionnaire
To ensure validity, the indicators included in the socio-demographic questionnaire
were done in accordance with recommended indicators of socio-demographic factors
described in scientific literature and assessed in other relevant studies to comply with
the aim and objectives of the study.
To ensure reliability, the socio-demographic questionnaire was re-administered by
the researcher to 10% of the original sample to determine the reliability of the
questionnaire. The reliability interviews took place one month after the main study.
None of the questions related to socio-demographic status were found to be
unreliable.
3.5.6 Food Frequency Questionnaire (FFQ)
A FFQ validated for black populations, adapted from the THUSA (Transition and
Health during Urbanisation of South Africans) study was used (MacIntyre et al.,
2001a). The frequency of food consumption was categorized as 'consumes it daily',
'weekly' and 'monthly' or 'does not consume it', according to Nelson (2000: 366). The
questionnaire concentrated on food items commonly consumed by African people as
indicated in the THUSA study. The FFQ was further adapted for the purpose of the
research study. By using the already validated questionnaires adopted from the
THUSA study, the techniques used in the present study and reliability of results was
obtained. To improve reliability, only one person, namely the researcher, interpreted
and coded the FFQ.
3.5.7 Anthropometry
All anthropometric measurements were measured according to standard methods as
recommended by Hammond & Litchford (2012: 165). The researcher was trained in
methods and techniques were standardized to determine accurate anthropometry.
Scales were zeroed before each measurement and the weight recorded by the scale
compared with a known weight, a 2.5kg packet of flour was used to ensure that the

39
reading on the scale reflected the same reading when measuring the standard weight
after every 20th subject measured by the researcher.
3.5.8 Physical activity
The amount of time spent on sport and leisure activities was established using the
previous day physical activity recall (PDPAR) (Appendix F) as validated by Weston et
al. (1997). The activity recall was conducted by the trained researcher and a
standardised activity recall was used. All activities were recorded for every half hour
of the day and the physical activity level was calculated accordingly.
3.5.9 Blood samples
Full blood counts were performed using the ABX PENTRA 60 which uses current
impedance changes, spectrophotometry, and double hydrodynamic sequential
system coupled with cytochemistry and measuring of transmitted light, to measure
the different parameters of the full blood count (Nakamine, 2004). The iron studies
were performed on the serum specimens. The total serum-iron and transferrin were
analysed on the Beckman Coulter CX9 and the transferrin saturation automatically
calculated. The ferritin values were calculated by the Siemens Advia Centaur using
a method as described by UCSF Clinical Labs-Chemistry (UCSF Clinical Labs-
Chemistry, 2010). The FBC were performed using the ABX PENTRA 60 which uses
current impedance changes, spectrophotometry; double hydrodynamic sequential
system coupled with cytochemistry and measuring transmitted light to measure the
different parameters of FBC. The reliability of these tests was scrutinised using
commercially available standards and controls, as well as the recommended tubes
and needles for each test.
3.5.10 Methodological limitations
Regular meetings were held with the research team to ensure that methodology
faults were limited, e.g. the planning and execution of the study as well as how the
supervision in the field was conducted. The planning and execution of follow-up
visits to the different sites within QwaQwa were co-ordinated with the research team.

40
Important information such as the responsibilities of each member of the research
team was also discussed with the fieldworkers.
The community in QwaQwa was regularly visited by the fieldworker during phase 1
and phase 2 to ensure participation of participants and to answer any questions
regarding the study. The fieldworker explained the importance of the study and their
involvement in the study to ensure participation during the intervention period and to
limit drop-outs.
3.6 The role of the researcher
The researcher was responsible for the following:
Compilation and adaption of questionnaires used in phase 2 of the study (the FFQ
was adapted from the validated questionnaire compiled for the THUSA study);
Collection of all nutritional data (socio-demographic questionnaire, dietary intake,
anthropometry) from all participants from January 2009 to December 2009;
Determination of associations between the practice of geophagia and nutrient
intake, anthropometric status and blood parameters (with the assistance of a
biostatistician);
Determination of the risk of the practice of geophagia on parameters of nutritional
status including nutrient intake, anthropometric status and blood parameters (with
the assistance of a biostatistician);
Design, implementation and evaluation of the nutrition intervention.
Design and composition of brochure in English (Annexure G) and Sotho
(Annexure H).
3.7 Training of fieldworkers
The fieldworkers were trained regarding the completion of questionnaires used in the
study as indicated in the instruction manual for the fieldworkers (Annexure K).

41
3.8 PILOT STUDY
A pilot study for phase 2 (questionnaires and anthropometric measurements) was
undertaken by the researcher on a sample of 20 persons (in QwaQwa) who were
similar to the target group before the main survey in order to determine whether
questionnaires would be easily understood and to determine the amount of time
needed to complete each questionnaire and to perform the anthropometric
measurements. The two fieldworkers assisted the researcher in completing the
questionnaires. Since no changes were made to any questionnaires, similar blood
samples were collected and specific laboratory tests were done as in the main study,
the results of the participants in the pilot study were included in the main study.
3.9 STUDY PROCEDURE
The process that was followed in carrying out the study is summarized in Figure 3.1
below.
Before commencement of the study, the protocol was submitted for evaluation to an
Evaluation Committee at the School of Allied Health Professions, Faculty of Health
Sciences, University of the Free State (UFS), and approved. The main study was
approved by the Ethics Committee at the Faculty of Health Sciences (ETOVS no.
104/08). The protocol specifically related to this part of the study was re-submitted
as an amendment and also approved.
The study was conducted after the pilot study as mentioned in paragraph 3.5.3. The
procedures for the pilot and the main study were as follows:
Transport and accommodation arrangements were made to visit the different
areas and permission was obtained in setting up a temporary laboratory;
A list of females from phase 1 (bigger study) who regularly practised geophagia
and had completed a consent form (Annexure A), was compiled. A separate list of
women who did not practice geophagia was compiled. From these lists, a random
sample of participants was selected to participate in phase 2 (n=40 for geophagic
group and n=40 for control group);

42
Figure 3.1: Study procedures
PHASE 1
Protocol and geophagia questionnaire development
Recruitment for larger study (n=300)
Informed consent by participants
QwaQwa
Pilot study (n=20)
PHASE 2
Nutrition Study
Participants in QwaQwa selected from larger study
Geophagia group
n=40
Control group
n=40
Collection of data by researcher
Socio-
demographic
questionnaire.
Interviewing
± 10participants
per day per visit
Dietary intake
questionnaire.
Interviewing ± 5
participants per
day for 3 days per
visit over period of
6 months
Anthropometric
measurements -
± 5 participants per
day for 3 days per
visit over a period of
6 months
Physical Activity
questionnaire -
± 5 participants
per day for 3
days per visit
over a period of
6 months
Blood sampling
in the field.
Analysis
according to
standard
procedures in the
laboratory
Analysis of data
Interpretation and documentation of data
INTERVENTION
Geophagia questionnaire / Pre- and post-test (Annexure I)
Development of Brochure
Evaluation of impact of intervention
Interpretation of data

43
Collection of data (questionnaires, anthropometric measurements and blood
sampling) was undertaken at the participant’s home by the researcher and all
blood analyses were completed in the laboratory by trained laboratory personnel
at CUT;
Reliability interviews were done within a month of the main study;
Data of phase 2 was analysed statistically by Prof F.J. Veldman, Department of
Dietetics and Human Nutrition, University of KwaZulu-Natal;
Intervention was designed and implemented by the researcher and fieldworkers.
A brochure was developed to educate the participants and a questionnaire was
designed to determine their geophagic knowledge and habits as well as
compliance to the food based dietary guidelines before and after the intervention;
Drop-outs and withdrawals were noted by the researcher for each group as well as
the reasons for each drop-out or withdrawal.
3.10 STATISTICAL ANALYSIS
Ten percent of social demographic questionnaires were repeated to determine the
reliability of data. Where answers to questions differed with more than 20%, the
question was considered unreliable and the results not reported.
Descriptive statistics, namely frequencies and percentages for categorical data and
means, standard deviations or medians, and percentiles for continuous data were
calculated. Comparisons between groups for continuous data were assessed using
independent t-tests. For categorical data, the Chi-square test was used.
Comparison within groups, between baseline and end of intervention results, were
measured using the paired t-test. A logistical regression analysis was performed in
order to identify those factors measured in this study that can be used to predict
whether a person would be more likely to practice geophagia or not in this specific
target population. In all instances, a p-level of ≤0.05 was considered to be
significant. All analyses were performed using Statistical Programme Social
Sciences 21 by Professor F.J. Veldman at the Department of Dietetics and Human
Nutrition of the University of KwaZulu-Natal.

44
3.11 INTERVENTION
As mentioned above, an intervention was designed by the researcher after risk
factors of the practice of geophagia and nutritional status of participants were
determined. The intervention aimed to address the problems and risks identified in
phase 2. Participants were followed-up to evaluate the impact of the intervention
regarding their geophagia practices.
The intervention consists of the following:
Development of the brochure (Annexure G);
Implementation of nutrition education to counsel participants and interested
members of the community regarding risks and problems identified during the
study;
The following procedures were followed during the intervention:
After phase 2 risk factors associated with the practice of geophagia were identified,
the researcher visited QwaQwa again to discuss these factors with the participants of
both the geophagia and control groups. The participants and members of the
community were informed by means of the brochure developed by the researcher.
Two follow-up visits (focus groups) were planned and co-ordinated with the
participants by the researcher and were confirmed in advance telephonically to
ensure that as many participants as possible would be present. Two translators were
used to address the participants and members of the community to minimize any
communication issues. These translators were also trained by the researcher before
the implementation of the intervention.
The first visit to the participants and members of the community after the
development of the brochure involved the following:
To explain to the participants the risk factors involved in the practice of geophagia;
To explain the relationship between geophagia and nutritional status;
To discuss the importance of healthy eating habits with reference to geophagia.
45
After the first visit two follow-up visits to the participants took place where they were
assessed in terms of:
Making informed decisions regarding the practice of geophagia which included:
Disadvantages of eating soil.
Risk-groups (children and pregnant women) who should not consume soil at
all.
Know the effect of geophagia on their nutritional status with reference to the
following:
The effect of the different kinds of clay to health.
Make informed decisions regarding a healthy diet namely:
The Food Based Dietary Guidelines.
What steps can be taken when soil is eaten to improve their health.
Once the participants had been exposed to the intervention a three month period was
allowed to apply these recommendations. Thereafter, the impact of the intervention
on their geophagia habits and knowledge was assessed right after the intervention
period ended.
3.12 ETHICAL CONSIDERATIONS
Approval of the research has been obtained from the Ethics Committee of the Faculty
of Health Sciences at the University of the Free State (ETOVS no. 104/08 (July
2008).
Informed consent (Annexure A) has been obtained from participants in the language
of their choice (English, Afrikaans, Sotho) and all the procedures were explained to
them in detail.
All subjects received a light snack after the blood samples have been drawn. Results
of blood tests were available to participants and the researcher had referred
participants for relative management. (Referral letter – Annexure J)

46
The blood which was not used was destroyed. Participants were informed what will
happen to unused blood (Annexure A).
Confidentiality of information was maintained by ensuring that no names were made
known or written on questionnaires. Furthermore, codes were used in data analysis
and results. Participants were specifically informed that they could withdraw from the
study at any time. Participants will have access to the final report. Participants will
be informed that the results of the study will be published.

47
CHAPTER 4
INTERVENTION
4.1 INTRODUCTION
In the baseline survey risk factors associated with geophagia and nutritional status of
persons engaging in geophagia were determined. The results obtained during the
baseline were used to design a nutrition education intervention to address these
factors.
According to Contento (2008) nutrition education is defined as "any combination of
educational strategies, accompanied by environmental supports, designed to
facilitate voluntary adoption of food choices and other food and nutrition- related
behaviours conducive to health and well-being." Behaviour change is the appropriate
outcome criteria for evaluating the effectiveness of nutrition education. The Food
and Agriculture Organisation (2005) has stated that "in order to be effective, nutrition
education should be linked with the means to adapt or adopt new practices." The
aim of nutrition education is thus to change nutrition-related habits or behaviours
which contribute to poor health (Chapman-Novakofski, 2012: 325; Smith & Smitarisi,
2005).
In the following section, a brief overview of theories of behaviour change and how
they apply to the development of the current intervention are given. As described
earlier in chapter one, the objectives of the current study included determining the
nutritional status of women practicing geophagia and to subsequently develop a
nutrition education intervention in order to address the nutritional and health
implications of the practice of geophagia.
48
4.2 BACKGROUND INFORMATION
Baronowski (2006) proposes that interventions change behaviours indirectly through
psychosocial, behavioural, environmental and biological factors. Nutrition education
is a complex process and should consider factors affecting food choices such as
sensory taste, beliefs, culture, perceptions and environmental factors (Contento,
2008). The effective use of educational theory results in assisting people to change
their eating practices and environments (Holli et al., 2009: 215). A number of
researchers (Hawthorne et al., 2008; Glazier et al., 2006; Ammerman et al., 2002)
have noted that customising health education to the social, economic and cultural
needs of the community increase effectiveness. Nutrition education is more likely to
be effective when it is behaviourally focused. Several studies on health and related
behaviours have indicated that people make rational decisions about such
behaviours when they are aware of, and have some knowledge about the risks
associated with particular actions (Redmond & Griffith, 2003; Levy et al., 2002).
Noordman et al. (2012) and Stead et al. (2008) have suggested that simple advice is
more effective than intensive advice in order to accelerate behaviour change. A
study by Harnack et al. (1997) showed that the most dominant reason for dietary
behaviour change was a health-related problem.
Factors which contribute to the effectiveness of nutrition education include
communication and behaviour change. These two factors will briefly be discussed in
the following section.
4.2.1 Communication
According to Mitchell & Courtney (2005) communication is the transmission of
thoughts and information using different media. Excellent communication can be
identified when the desired results are achieved and all parties benefit from it.
Communication can be divided into non-verbal, verbal and written communication
(Snetselaar, 2009: 38). In intercultural settings, nonverbal communication becomes
especially important as successful interaction between communicators from different
cultures to steer both the verbal and nonverbal messages in such a way that both
communicators understand the message (Okon, 2011).

49
Communication is most effective if combinations of methods are used to address the
different stages of behavioural change (Burgess et al., 2009: 165). The advantages
and disadvantages of the different communication methods and materials can be
seen in Table 4.1.
Health literacy is a person's skill to understand and process primary health
information and services required to make relevant health choices (Institute of
Medicine, 2004). Poor health literacy may also contribute to poor health status.
Literacy is a stronger predictor of a person's health status than income, educational
level and racial or ethnic group (Baker et al, 1997; Sudore et al., 2006; Davis et al.,
1998). Research also showed that literacy is directly linked to different dietary habits,
(Silk et al., 2008) with a positive association between healthy eating practices and
higher nutrition literacy skills (Lino et al., 1998).
Table 4.1 The advantages and disadvantages of different communication methods and materials (Burgess et al., 2009, p.165)
METHOD / MATERIAL ADVANTAGES DISADVANTAGES
1. Face to face methods Counselling Helps a person to make his/her
own decision Develops life skills Confidential
Time consuming
Discussions with small groups
Share the same problems Individuals can dominate
2. Popular media Role-playing, stories,
pictures Enjoyable and popular Often wide coverage
Need skilled facilitator
3. Mass media: print Pamphlets/brochures,
flyers and hand-outs Provide knowledge Flexible; Well accepted Good local coverage
Short life span Can be expensive
The World Health Organisation (WHO) has stated that literacy is very important in
identifying the inequities in health in both rich and poor countries (WHO Commission
on the Social Determinants of Health, 2007). Factors contributing to a person's
health literacy are the ability to read and write; difficulty of the message to be
50
understood; and the medium of communication used to communicate during the
communication process (Weiss, 2009).
In a study undertaken in the Western Cape, South Africa, 580 patients were
interviewed concerning the method of communication they preferred when receiving
information from health care workers at a primary health care setting. The results
showed that the first choice of patients were one on one counselling as method of
communication, while booklets were their second choice of receiving information.
The reason was that they can take the booklets home to read (Parker et al., 2012).
4.2.2 Behaviour change
Many theories illustrate how and why change in behaviour occurs. Examples of
these theories are the following: behavioural learning, humanistic approach,
integrated theory of health behaviour change (ITHBC) and the Health Belief Model.
In a later section the application of these theories in terms of planning and
development of educational material in the current intervention will be discussed.
4.2.2.1 Behaviour learning
Behaviour learning theories are restricted to observable changes in behaviour, where
external events on the individual play a major role towards learning (Shaughnessy,
2004). Teaching requires initiating stimulus and response events, which means that
traditional training is a teacher centred approach including passive learners in the
process (Holli et al., 2009: 216). The association between stimuli and subsequent
responses or behaviours are strengthened or weakened by the consequences of
behaviour. Three kinds of responses can follow behaviour, namely neutral
responses, reinforcers and punishers (Mcleod, 2007; Skinner, 1938). Meyer et al.
(2003: 278) explains that Skinner's theory is also known as programmed instruction,
which means that the information needed to be learned is subdivided into different
small sections to ease the process of learning. Behavioural approaches are often
used in conjunction with cognitive approaches (Corey, 2009: 289).

51
Since the 1970's Albert Bandura was considered the inventor of the modelling theory.
This theory shows that people not only learn from external causes, but also from
observing other people and creating mental images; analysing; evaluating and
remembering, which in turn influences their decision making and own learning (Holli
et al., 2009: 218). Social-cognitive theory highlights the significance of factors
around people that influence the social environment, which is interpreted differently
by each individual. How a person interprets behavioural outcomes determines the
ability to achieve these outcomes and to maintain them (Snetselaar, 2009: 13;
Margetts, 2004: 126).
The way in which social cognitive learning motivates an individual in interaction with
the situation, determines an individual's motivation level and human behaviour. The
human behaviour is, therefore, determined by peoples' own specific motives (Meyer
et al., 2003: 298). There are elements contributing to the social cognitive learning
process, namely learning through direct experience, observational learning and
learning through self-regulation (Meyer et al., 2003: 303). Information regarding
health risks and benefits of behaviour, stimulate the need for change (Bandura,
2004).
Cognitive learning theories focus on internal, unobservable mental processes that
individuals use to learn and remember new knowledge or skills (Corey, 2009: 297).
The cognitive approach suggests that what the learner knows before learning,
invariably influences or affects the scope of what the person will learn, remember and
forget in future. Cognitive learning focuses on mental activities such as thinking,
remembering and solving problems (Holli et al., 2009: 220 - 221).
4.2.2.2 Humanistic approach
Transfer of learning is accomplished when a person can use their own learned
knowledge or skills to solve problems. Transfer of learning is not spontaneous.
Knowledge transfer inspires a process involving cognitive resources as well as an
interpersonal process where the knowledge or information is transferred between
individuals or groups (Holli et al., 2009: 227; Aita et al., 2005).

52
Health training, and public health programmes, together with modern research and
care, has led to changes in morbidity and mortality in some of the adults (Centres for
Disease Control and Prevention, 2009a). Nutrition education strategies should thus
enhance awareness by using messages and materials that can influence behaviour
change. Dodd (2012: 435) states that adults are the perfect target group for health
promotion education aimed at preventing nutrition-related diseases through nutrition
advice.
4.2.2.3 Integrated Theory of Health Behaviour Change (ITHBC)
The ITHBC is built on the fact that behaviour change is a self-motivating process,
which is driven by motivation and the need to change (Ryan, 2009). Person-centred
intervention focusses on increasing knowledge and beliefs and improving self-
regulating skills and capabilities. Knowledge and beliefs influence the effectiveness
of behaviour change and goal settings (Glasgow et al., 2002). Knowledge and health
beliefs are associated with the desire to change behaviour and with motivation to
enhance the ability to change with the support of a knowledgeable person to drive
the process in the correct direction (Ryan, 2009).
The outcomes of this theory have a direct and indirect effect on a person. Directly
when a specific outcome is associated with a specific health behaviour, and indirectly
if the outcome is related to the long-term effect of personal activities on health status
(Ryan, 2009).
4.2.2.4 Motivational Interviewing with Acceptance and Commitment Therapy
Motivational Interviewing (Miller & Rollnick, 2012) and Acceptance and Commitment
Therapy (Hayes et al., 1999) are two theories focussing on commitment which leads
to behaviour change by concentrating on a person's values and communicating in his
or her relevant language to achieve change (Miller & Rollnick, 2012). Walker et al.,
(2011) also found that client language was a determining factor in the outcomes of
their study using motivational interviewing to determine the influence of client
behaviour on the outcome of marijuana treatment.

53
Walitzer et al. (1999) suggested that Motivational Interviewing combined with
cognitive and behavioural strategies enhance the effectiveness of treatment.
4.2.2.5 The Health belief model
The Health belief model is frequently applied in health education and health
promotion (Glanz et al., 2002: 47). The Health belief model emphasises the views of
individuals regarding the severity of a health problem, as well as the proposed
benefits when changing of behaviour. The health problem and the individual's belief
and ability to successfully change the action(s) causing certain health problems lead
to changes in behaviour (Shikany et al., 2009: 21; Champion & Skinner, 2008).
Sharifirad et al. (2013), have explained that the health belief model forms part of the
intrapersonal health education models and has four characteristics, namely:
The proposed behaviour holds many benefits for an individual such as social,
family, cultural and economy.
Health educators plan the interventions around the barriers known by them.
Participants who need to change their behaviour must know the consequences
that if they do not change, it will have a negative impact on their health.
Specific actions are necessary for change, for example educating individuals and
educational media (Sharifirad et al., 2008; Sharifirad et al., 2006; Morowati-
Sharifabad et al., 2007).
4.3 THE INTERVENTION PHASE
As mentioned earlier, the baseline results were used to structure the intervention
phase. The intervention phase for the process of program planning as applied in the
development of educational material for the current study is divided into four different
phases. The different phases in planning nutrition education interventions are
schematically represented in Figure 4.1. These include conceptualization,
formulation, implementation and evaluation. Each phase will now be discussed in
more detail.

54
The first step was to develop educational material to use in presenting nutrition
education to the participants as well as other members of the community who were
interested in receiving the information. Davidson et al. (2003) recommends that it is
important to be clear on the message used, which medium was used and who
conveyed the message to explain the outcomes of behaviour change.
Figure 4.1: A scheme for programme planning, including conceptualization, formulation, implementation and evaluation (International Federation of Red Cross and Red Crescent Societies, 2011; FAO, 1997)
4.3.1 Conceptualization – Phase 1
Conceptualization involves the identification of nutritional problems identified in a
community; defining the causes of the problems and establishing the educational
framework for the nutrition education process (França et al., 2004).
After completion of the baseline phase of the study, nutritional problems and causes
from it were identified and the following educational framework was compiled.

55
This study showed that the geophagia group had significantly lower serum iron
levels than the control group.
Materials such as harmful bacteria, lead, parasites and worms are found in soil
(Sumbele et al., 2011; Glickman et al., 1999).
The study also indicated a low physical activity level and a high body mass index
(BMI) in both the geophagia and control groups.
4.3.2. Formulation – Phase 2
Formulation includes the setting of objectives, designing of messages, choosing of
media and the communication method. Literature emphasises the importance of
clear objectives, understandable messages and the selection of particular media as
communication channel to the target group (Mitchell & Courtney, 2005; FAO, 1997).
4.3.2.1 Setting of objectives
The objective of the nutrition intervention brochure was to bring about behaviour
change in the target group through:
Informing the participants about the risk factors involved in the practice of
geophagia;
Describing the impact of geophagia on health, and
Educating the participants about healthy eating habits in general.
An instruction manual (Annexure K) was developed by the researcher which the
fieldworkers could use in explaining each objective in a more understandable
language, which is important to ensure that the same message is conveyed to the
participants throughout the intervention phase. Role play was used to practice the
translation of the brochure to ensure that the translators knew the objectives and for
the standardization of communication methods used to explain the brochure to the
participants.
(i) Objective 1
According to the results obtained in the baseline phase of this study, geophagia may
be a risk factor for micronutrient deficiencies (specifically iron deficiency and

56
anaemia). Vulnerable groups include pregnant women and children where
micronutrient needs are greater.
In the brochure it was documented as "Soil binds important minerals such as iron,
calcium and zinc which are important for the body" and "Pregnant women and
children should not eat soil."
The above information was explained and elaborated on by using the instruction
manual. The dangers and health consequences of eating soil was explained in easy
terms to be understood easily.
(ii) Objective 2
The literature review in Chapter 2 showed that geophagists are very particular about
the content and colour of the soil they eat. Some consume clay from termitaria,
which is rich in calcium and iron. However, the clays found in South Africa mainly
consist of quarts, which could be abrasive to the human intestinal tract. It could also
contain heavy metals such as lead. The high content of organic substance in some
black clay could host a wide range of microbes, bacteria and geohelminthes, which
could be a health risk to geophagists. Soil can also bind with important minerals
which lead to micronutrient deficiencies and cause erosion, abrasion and damage to
the teeth (Young, 2011: 64).
In the brochure it was documented as: "The soil may contain dangerous items such
as: bacteria, parasites, worms and heavy metals such as lead."
The above statement was explained by means of pictures as indicated in the manual.
In the pictures they could see what bacteria, parasites and worms look like.
(iii) Objective 3
The South African Department of Health together with other stake holders, have
developed the food-based dietary guidelines for healthy eating for adults and children
over the age of five years. The food-based dietary guidelines are used to endorse
healthy lifestyles and eating practices among all South Africans and to address

57
nutrition challenges (Vorster et al., 2013). The SA Food Based Dietary Guidelines
(SAFBDG) which were applicable for the period in which the current study was
conducted, before the new SA FBDG (2012) were implemented, included the
following:
In the brochure the following words were used to attract reader attention by asking
"What food is GOOD for you" which was followed by the Food Based Dietary
Guidelines:
Eat a variety of foods;
Make starchy foods the basis of most meals;
Chicken, fish, meat, milk or eggs could be eaten daily;
Eat plenty of vegetables and fruit every day;
Eat dry beans, peas, lentils and soya regularly;
Use salt sparingly;
Use fats sparingly;
Drink lots of clean, safe water;
If you drink alcohol, drink it sensibly;
Use food and drinks containing sugar sparingly and not between meals;
Be active.
These guidelines were used to educate the participants on healthy eating practices
and to be active (Annexures G & H).
4.3.2.2 Choosing media and multimedia communication
As mentioned earlier in this chapter, the communication media plays a vital role in
the outcome of nutrition education messages. The communication method for this
study was chosen to be interpersonal communication which was strengthened by the
use of a brochure that could be taken home. Parker et al. (2012) recommends that
educational material such as posters, pamphlets and booklets should be used in
conjunction with counselling or during support group sessions. The consumer
information processing theory states that people have a restricted ability to process,
store and retrieve information at any point of time. Therefore information presented

58
should be organized, limited and on the comprehension level of the individual (Holli
et al., 2009: 222). The successful memorising of information depends on the level of
interest shown by the individual regarding the particular topic. Therefore the
communication media should be colourful, while questions can be asked to keep the
reader's attention (Holli et al., 2009: 223).
4.3.2.3 Designing messages
The brochure was chosen as medium of communication and was developed into a
tri-fold brochure based on the literature reviews and data collected during the
baseline phase of the current study. The interests and needs of the readers of
brochures is a fundamental element in the process of construction of this educational
material.
The quality of the brochure as well as adequacy of language and illustrations are
relevant (Wilkinson & Miller, 2007). According to Wuzowski et al. (2008: 100) "A high
quality educative material requires reliable information and the use of clear
vocabulary in order to permit an easy understanding of its contents." Scientific data
is imperative in constructing the brochure content to ensure credibility. Furthermore,
key points should be identified and clearly showed in the brochure (Margetts, 2004:
120). The design and layout of a brochure plays a vital role in helping the reader to
understand the key message, and thus contributes to the readability level (Kools et
al., 2006; Houts et al., 2006). The National Literacy Work Group on Literacy and
Health (1998) suggested that all low-literacy health education material be written at
or below a 6th grade reading level. According to Bastable (2008: 108) "Brochures
that are conversational and easy to read increase the comfort level of women." The
use of ordinary language and cautious use of medical vocabulary increases the
readability of the health material. In addition, using short sentences and words
increase the readability decrease the reading level and improve understanding. The
ability (or lack thereof) of the reader to understand the language as set out in the
brochure, can cause a significant barrier in communicating health information. This
can lead to readers obtaining confusing and inaccurate health messages (Kreps &
Spark, 2008). There are no specific rules to font size and colour of the brochure, but
clearly understandable messages should be easily readable (Haute Autorité de

59
sante, 2008). Bastable (2008: 269) has suggested that a simple type style and
headers should be used and both capital letters and small letters should be used to
increase word recognition.
Literature showed that low literacy education should take place at a grade 6 literacy
level (Canadian Public Health Association, 2008). Although the educational level of
the participants was between grade 10 and 12, the message was written at a lower
literacy level to ensure that the message could not only be understood by the
participants but also the rest of the community which could have a lower educational
level than the participants. The body mass index of above the normal range of 18.5
kg/m2 – 24 kg/m2 indicated an unbalanced intake of nutrients and energy expenditure
which was addressed by including the Food Based Dietary Guidelines.
4.3.3 Implementation – Phase 3
The implementation phase comprised the development of the brochure.
The brochure was developed by the researcher in collaboration with academics of
the Universities of the Free State and KwaZulu-Natal (information and layout). A
graphic designer was also consulted to assist in the layout of the brochure. Factors
to be considered in planning nutrition education messages include nutrition-related
health concerns, socio-economic status, lifestyle and cultural eating habits, and the
ability to understand and apply the information in the education material (Love,
2002). The results of the baseline phase of the intervention information which
included socio-economic statuses, level of education, the food frequency
questionnaire (Annexure E) as well as blood results, were taken into account while
designing the messages for the brochure (Table 4.2). Although the macronutrient
intake was sufficient in terms of percentages of total energy intake in the geophagia
group, the micronutrient intakes were of concern because of the strong association
between pica and micronutrient deficiencies. Foods rich in calcium and iron were
specifically specified in the brochure in order to educate the reader about the
importance thereof, specifically when practicing geophagia.

60
After the development of the brochure, the literacy level of the content was tested by
using the Coleman Liau Index, which indicated the content of the brochure to
accomplish a grade 6 level (Wilson & Wauson, 2010: 123).
The brochure was colour printed and in two languages, namely English and Sotho to
ensure that everyone could understand the information in the brochure. Plain text,
different fonts, and pictures were used to enhance the desire to read the brochure
and to make the brochure easy to understand. The fieldworkers and a Sotho-
speaking lecturer at the University of the Free State were consulted during the
translation process of the brochure from English to Sotho, to ensure that information
was translated correctly.
Table 4.2 Baseline results used for the development of the brochure
SOURCE BASELINE RESULTS USED FOR
DESIGNING MESSAGES APPLICATIONS AND INFORMATION
INCLUDED IN BROCHURE
Socio-demographic questionnaire
Highest level of education: grade 11 - 12
Content of brochure on grade 6 level
Dominant language: Sotho Brochure developed in English and Sotho
More than half of geophagia group did not know that the soil can be harmful
Included the possible dangers of eating soil
Food Frequency Questionnaire
Large number of participants in geophagia group didn't have a refrigerator
Sun-drying of soil included in brochure
Low calcium intake Examples of calcium rich food included in brochure
Blood results Iron deficiency Examples of iron rich food included in brochure
Activity Questionnaire
Low activity levels Used food-based dietary guidelines to address inactivity
After the formulation, development and design of the nutrition education brochure
was completed, the brochure was ready to be implemented. This included the
implementation or application of the brochure, followed by the evaluation and
monitoring of it as illustrated in Figure 4.1.
The following steps were taken to implement the brochure during the implementation
period:
61
Step 1
• Preparing visits to QwaQwa with the fieldworkers (translators) and the Central
University of Technology. Three planned visits that consisted of three days
each to implement the brochure and follow-up visits. Before the implementation
phase both translators were tutored by the researcher to clearly explain the
aims, objectives and outcomes of the brochure.
Step 2
Visits to participants were confirmed by the fieldworkers who also engaged with them
in phase 1. Appointments were made to ensure that every participant was available
and to ensure adequate time for the education process. Demographic data such as
cell phone number, area in QwaQwa and number of houses were documented by the
fieldworker during previous visits to participants. Participants were educated one on
one, or in pairs at their homes. A total of 42 participants in the geophagia group and
27 in the control group were educated. Members of the community were also
informed regarding the information in the brochure.
Step 3
• After the education process a waiting period of three months allowed
participants time to adapt to the recommendations made, before the evaluation
took place. Two follow-up visits were also made during this period to ensure
that the brochure was fully understood and to address any uncertainties
regarding the information in the brochure.
• During this period 1-2 members of the community were also educated during
each home visit.
The two fieldworkers were used to address the community to minimize any
communication issues. The fieldworkers were fluent in both languages (English and
Sotho), as recommended in literature, which is an important contributor to the
success of nutrition education. In addition, the translators were also involved in the
project during phase 1 (recruitment and pilot study) and phase 2 which included the
intervention phase. The one fieldworker was familiar with the community's culture
and preferences, which made the implementation process much easier and more

62
effective. The other fieldworker was also involved in the study as one of the
researchers. Both fieldworkers were in the same age group as the participants, to
ensure effective communication.
A two-way communication process was used, in order for the participants to ask
questions at any time to prevent any misperceptions during the explanation process
of the brochure. The translators' services proved invaluable in making sure that any
communication barriers were eliminated. The information in the brochures was
explained in English or Sotho, depending on the language preferred by the
participants.
The participants were asked to read through the brochure again during the three
month waiting period and to contact the researcher or translator if in need of any
further information. The researcher's contact details could be found on the brochure
and the fieldworker’s cell phone number was also made available to the participants.
During this period one telephonic interview with each participant in the geophagia
group was done by the fieldworkers in conjunction with the researcher. The purpose
of these telephonic interviews, as indicated in the manual, was to ensure that the
participants understood the brochure and to explain any issues which were unclear
or not fully understood.
4.3.4 Monitoring and evaluation – Phase 4
Once the participants were informed and educated regarding the information in the
brochure, a three month period was given to apply these recommendations. The
intervention questionnaire was developed (Annexure I) to see if participants
understood the information in the brochure and to determine if the intervention
resulted in any changes. A total of 28 participants in the geophagia group and 15
participants in the control group were available to be evaluated. The results of the
evaluation of the intervention are presented in the results chapter.
63
CHAPTER 5
RESULTS
5.1 INTRODUCTION Descriptive statistics, namely frequencies and percentages for categorical data, and
means and standard deviations or medians and percentiles for continuous data, were
calculated. Comparisons between groups for continuous data were assessed using
independent t-tests. For categorical data, the Chi-square test was used.
Comparison within groups between baseline and end of intervention results were
measured using the paired t-test. A logistical regression analysis was performed in
order to identify those factors measured in this study that can be used to predict
whether a person practices geophagia or not in this specific target population. The
sample was selected from the population of Thabo Mofutsanyane (Phuthaditjaba)
and the Maluti, a Phofung population in the QwaQwa area. Before the intervention,
the sample consisted of 69 participants, of whom 42 were in the geophagic group (G)
and 27 in the control group (C). After the intervention 28 participants from the
geophagia group and 15 participants from the control group were followed up to
evaluate the impact of the intervention.
5.2 SOCIO-DEMOGRAPHIC STATUS
The socio-demographic data of both the geophagia and control groups are presented
in Table 5.1. The median number of people living in the households was five and
four for the geophagia and control group, respectively. The number of adults per
household ranged from one to eight in the geophagia group and from one to six in
the control group.
The majority of participants in the geophagia group (77.5%) and control group
(70.4%) were unmarried. Sotho was the prominent spoken language in both groups
(G = 95.2% and C = 92.6%). None of the participants were pregnant (part of

64
Table 5.1 Socio-demographic information of Geophagia and Control groups
GEOPHAGIA GROUP CONTROL GROUP P-VALUE FOR
DIFFERENCES
BETWEEN
GROUPS
N (42) % of total
group N (27)
% of total
group
Mean Age 25 100 26 100 N/A
42 100 27 100
Marital Status
* Unmarried 33 77.5 19 70.4 NS
* Married 8 20.0 5 18.5 NS
* Divorced 0 0.0 0 0.0 N/A
* Widowed 0 0.0 3 11.1 N/A
* Living together 0 0.0 0 0.0 N/A
* Separated 0 0.0 0 0.0 N/A
* Traditional Marriage 1 2.5 0 0.0 N/A
* Other 0 0.0 0 0.0 N/A
42 100.00 27 100
Language
* Sotho 40 95.2 25 92.6 NS
* Tswana 1 2.4 0 0.0 N/A
* English 0 0.0 0 0.0 N/A
* Afrikaans 0 0.0 0 0.0 N/A
* Xhosa 0 0.0 1 3.7 N/A
* Swazi 0 0.0 0 0.0 N/A
* Zulu 0 0.0 1 3.7 N/A
* Other 1 2.4 0 0.0 N/A
42 100 27 100
Are you pregnant?
Yes 0 0 0 0
No 42 100 27 100 NS
42 100 27 100
Are you breastfeeding?
Yes 0 0 0 0
No 42 100 27 100 NS
42 100 27 100
How many persons live in the house
permanently?
Adults (≥ 18 years)
1-2 23 55 19 70 NS
3-4 16 38 7 26 NS
5-6 2 5 1 4 NS
7-8 1 2
9-10 0
42 100 27 100
* Statistically significant p≤0.05; NS = no significant difference; N/A not applicable

65
Table 5.1 Socio-demographic information of Geophagia and Control groups
(cont.)
GEOPHAGIA GROUP CONTROL GROUP P-VALUE FOR
DIFFERENCES
BETWEEN
GROUPS
N (42) % of total
group N (27)
% of total
group
Children (< 18 years)
0 9 21 4 14 NS
1-2 14 34 10 37 NS
3-4 10 24 8 30 NS
5-6 7 17 3 11 NS
7-8 1 2 2 8 NS
9-10 1 2 0 0
42 100 27 100
What is your highest level of education?
* None 0 0.0 0 0.0
* Primary school 2 4.8 3 11.1 NS
* Grade 8 - 10 15 35.7 6 22.2 NS
* Grade 11 - 12 18 42.9 14 51.9 NS
* Tertiary education 7 16.7 4 14.8
42 100 27 100
What is your employment status
* Housewife by choice 1 2.4 0 0.0 N/ A
* Unemployed 38 90.5 20 74.1 NS
* Self employed 1 2.4 0 0.0 N/A
* Full time wage earner 1 2.4 7 25.9 0.014*
* Other. Specify (part-time, piece job, etc.) 1 2.4 0 0 N/A
42 100 27 100
Husband's/partner's primary income
employment status
* Retired by choice 0 0.0 0 0.0
* Unemployed 8 19.1 3 11.1 NS
* Self employed 2 4.76 1 3.7 NS
* Full time wage earner 9 21.4 13 48.2 NS
* Other. Specify (part-time, piece job, etc.) 23 54.8 10 37.0 N/A
* Not applicable (dead) 0 0.0 0 0.0 NS
42 100 27 100
Who is the head of this household?
* Wife 3 7.1 0 0.0
N/A
* Husband 6 14.3 6 22.2 NS
* Child/children 0 0.0 0 0.0
* Parent 14 33.3 13 48.2 NS
* Grandparent 5 11.9 2 7.4 NS
* Friend 0 0.0 0 0.0
* Self 6 14.3 4 14.8 NS
* Other 8 19.1 2 7.4 NS
42 100 27 100
* Statistically significant p≤0.05; NS = no significant difference; N/A not applicable

66
Table 5.1 Socio-demographic information of Geophagia and Control groups
(cont.)
GEOPHAGIA GROUP CONTROL GROUP P-VALUE FOR
DIFFERENCES
BETWEEN
GROUPS
N (42) % of total
group N (27)
% of total
group
Type of dwelling
* Brick or concrete 36 85.7 26 96.3 NS
* Traditional mud 4 9.5 1 3.7 NS
* Tin 1 2.4 0 0.0 N/A
* Plank, wood 0 0.0 0 0.0 N/A
* Other 1 2.4 0 0 N/A
42 100 27 100.00
What fuel is used for cooking?
* Electric 35 83.3 23 85.2 NS
* Gas 1 2.4 2 7.4 NS
* Paraffin 5 11.9 2 7.4 NS
* Wood, coal 1 2.4 0 0.0 N/A
* Sun 0 0.0 0 0.0 N/A
* Open fire 0 0.0 0 0.0 N/A
42 100 27 100
Do you use cast iron pot for cooking?
* ≤ Once a week 16 38.1 13 48.2 NS
* > Once a week 0 0.0 1 3.7 NS
* Everyday 2 4.8 0 0.0 N/A
* No 24 57.1 13 48.2 NS
42 100.00 27 100
Does the home have a working refrigerator
and/or freezer?
* Yes 16 38.1 25 92.6
* No 26 61.9 2 7.4 0.028*
42 100.00 27 100
Does the home have a working stove (gas,
coal, electric or hot plate)
* Yes 36 85.7 25 92.6 NS
* No 6 14.3 2 7.4 NS
42 100 27 100
Does the home have a working primus or
paraffin stove?
* Yes 26 61.9 17 63.0 NS
* No 16 38.1 10 37.0 NS
42 100.00 27 100
Does the home have a working microwave?
* Yes 26 61.9 18 66.7 NS
* No 16 38.1 9 33.3 NS
42 100.00 27 100
* Statistically significant p≤0.05; NS = no significant difference; N/A not applicable
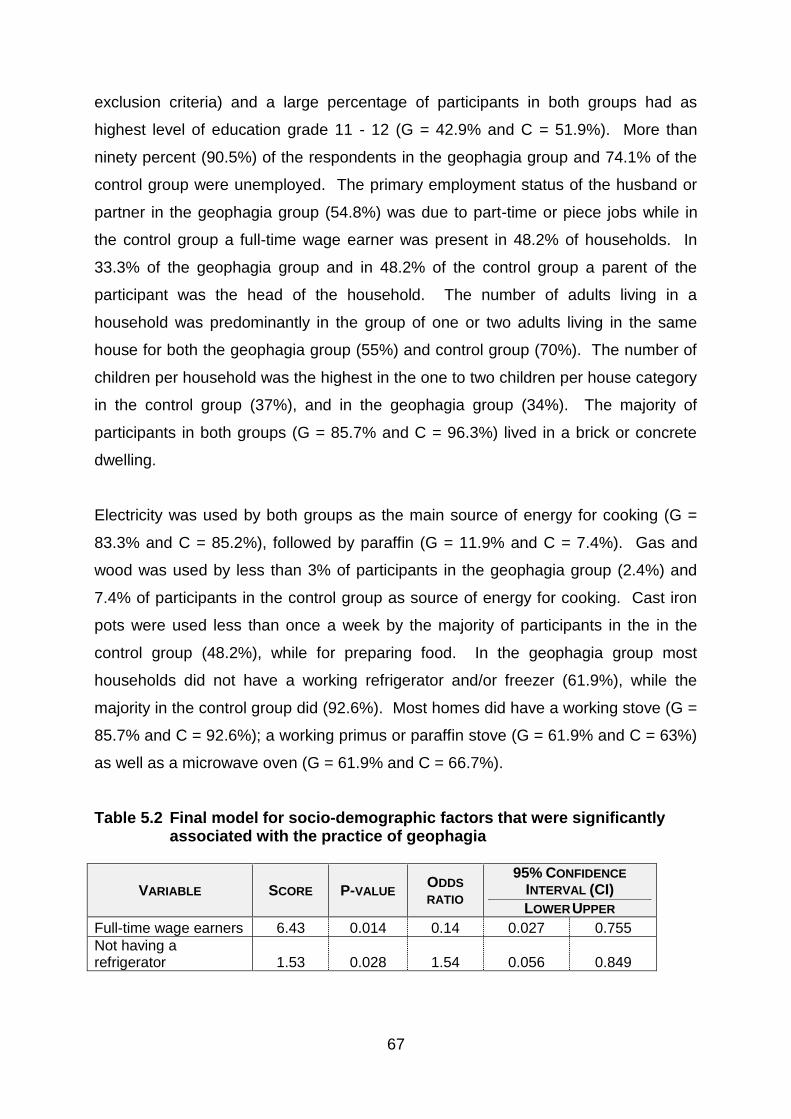
67
exclusion criteria) and a large percentage of participants in both groups had as
highest level of education grade 11 - 12 (G = 42.9% and C = 51.9%). More than
ninety percent (90.5%) of the respondents in the geophagia group and 74.1% of the
control group were unemployed. The primary employment status of the husband or
partner in the geophagia group (54.8%) was due to part-time or piece jobs while in
the control group a full-time wage earner was present in 48.2% of households. In
33.3% of the geophagia group and in 48.2% of the control group a parent of the
participant was the head of the household. The number of adults living in a
household was predominantly in the group of one or two adults living in the same
house for both the geophagia group (55%) and control group (70%). The number of
children per household was the highest in the one to two children per house category
in the control group (37%), and in the geophagia group (34%). The majority of
participants in both groups (G = 85.7% and C = 96.3%) lived in a brick or concrete
dwelling.
Electricity was used by both groups as the main source of energy for cooking (G =
83.3% and C = 85.2%), followed by paraffin (G = 11.9% and C = 7.4%). Gas and
wood was used by less than 3% of participants in the geophagia group (2.4%) and
7.4% of participants in the control group as source of energy for cooking. Cast iron
pots were used less than once a week by the majority of participants in the in the
control group (48.2%), while for preparing food. In the geophagia group most
households did not have a working refrigerator and/or freezer (61.9%), while the
majority in the control group did (92.6%). Most homes did have a working stove (G =
85.7% and C = 92.6%); a working primus or paraffin stove (G = 61.9% and C = 63%)
as well as a microwave oven (G = 61.9% and C = 66.7%).
Table 5.2 Final model for socio-demographic factors that were significantly associated with the practice of geophagia
VARIABLE SCORE P-VALUE ODDS
RATIO
95% CONFIDENCE
INTERVAL (CI)
LOWER UPPER
Full-time wage earners 6.43 0.014 0.14 0.027 0.755
Not having a refrigerator 1.53 0.028 1.54 0.056 0.849

68
Geophagia was negatively associated with being a full-time wage earner (odds ratio
0.14) and positively associated with not having a refrigerator (odds ratio 1.54) as
indicated in Table 5.2. The likelihood of practicing geophagia was thus lower in those
participants that were full-time wage earners (odds ratio 0.14) and in those that
owned a refrigerator (odds ratio 1.54)
5.3 DIETARY INTAKE
Dietary intake was assessed by determining the amount and frequency of food
consumed per day, per week, or per month. From this the energy intake, macro- and
micronutrient intake was determined.
5.3.1 Total energy and macronutrient intake
Mean energy, macronutrient and cholesterol intake is shown in Table 5.3. The mean
total energy intake for the geophagia group and control group were 10324.3 ± 2755.0
kJ and 10763.9 ± 2556.3 kJ respectively.
The mean total protein intake was almost similar in both groups (G = 74.6 ± 20.1 g; C
= 85.6 ± 29.1 g) at 12.5% (geophagia group) and 13.6% (control group) of the total
energy intake, which fell into the recommended range of 10 – 35% of total energy
intake. The average intake of carbohydrates was 308.5 g and 318.6 g for the
geophagia group and control group respectively which is threefold the EAR of 100 g
per day. The percentage of total energy from carbohydrate was similar in both
groups (G = 54.1%; C = 54.4%), which is within the recommendation of 45 – 65%.
The mean total fat intake in the geophagia group was 93.3g and in the control group
94.5g. The percentage total energy intake from fat was 33.1% for the geophagia
group and 31.5% for the control group, which was also within the recommended
range of 25 – 35%. The mean soluble dietary fibre (G = 3.7g; C = 3.6g) did not
different significantly between the groups (p=0.86) as well as the insoluble dietary
fibre intake (p=0.89) with a mean intake of 4.6g in the geophagia group and 4.7g in
the control group. As seen by the 95% CI for mean differences there were no
statistically significant differences between the reported energy and macronutrient
intake of the participants in the geophagia and control groups.
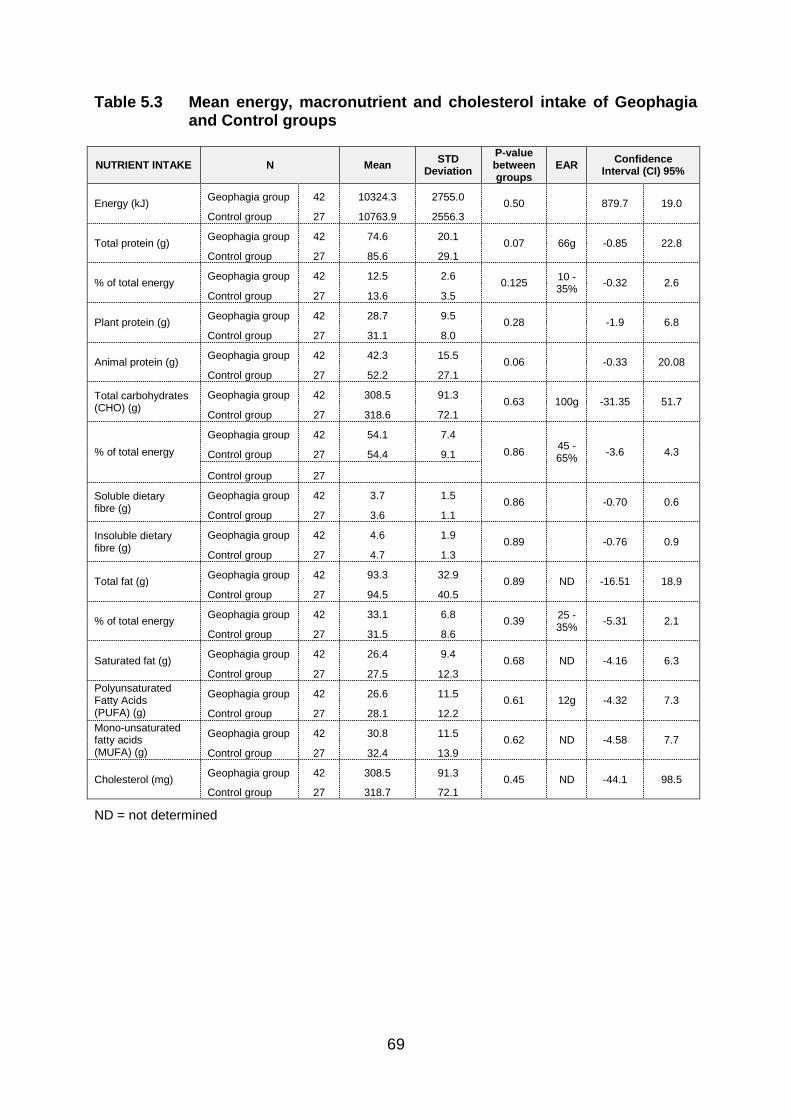
69
Table 5.3 Mean energy, macronutrient and cholesterol intake of Geophagia and Control groups
NUTRIENT INTAKE N Mean STD
Deviation
P-value between groups
EAR Confidence
Interval (CI) 95%
Energy (kJ) Geophagia group 42 10324.3 2755.0
0.50
879.7 19.0
Control group 27 10763.9 2556.3
Total protein (g) Geophagia group 42 74.6 20.1
0.07 66g -0.85 22.8
Control group 27 85.6 29.1
% of total energy Geophagia group 42 12.5 2.6
0.125 10 - 35%
-0.32 2.6
Control group 27 13.6 3.5
Plant protein (g) Geophagia group 42 28.7 9.5
0.28
-1.9 6.8
Control group 27 31.1 8.0
Animal protein (g) Geophagia group 42 42.3 15.5
0.06
-0.33 20.08
Control group 27 52.2 27.1
Total carbohydrates (CHO) (g)
Geophagia group 42 308.5 91.3 0.63 100g -31.35 51.7
Control group 27 318.6 72.1
% of total energy
Geophagia group 42 54.1 7.4
0.86 45 - 65%
-3.6 4.3 Control group 27 54.4 9.1
Control group 27
Soluble dietary fibre (g)
Geophagia group 42 3.7 1.5 0.86
-0.70 0.6
Control group 27 3.6 1.1
Insoluble dietary fibre (g)
Geophagia group 42 4.6 1.9 0.89
-0.76 0.9
Control group 27 4.7 1.3
Total fat (g) Geophagia group 42 93.3 32.9
0.89 ND -16.51 18.9
Control group 27 94.5 40.5
% of total energy Geophagia group 42 33.1 6.8
0.39 25 - 35%
-5.31 2.1
Control group 27 31.5 8.6
Saturated fat (g) Geophagia group 42 26.4 9.4
0.68 ND -4.16 6.3
Control group 27 27.5 12.3
Polyunsaturated Fatty Acids (PUFA) (g)
Geophagia group 42 26.6 11.5 0.61 12g -4.32 7.3
Control group 27 28.1 12.2
Mono-unsaturated fatty acids (MUFA) (g)
Geophagia group 42 30.8 11.5 0.62 ND -4.58 7.7
Control group 27 32.4 13.9
Cholesterol (mg) Geophagia group 42 308.5 91.3
0.45 ND -44.1 98.5
Control group 27 318.7 72.1
ND = not determined

70
5.3.2 Micronutrient intake
5.3.2.1 Minerals
Table 5.4 shows the mineral and trace element intake of the participants in the two
groups at baseline. Both the geophagia group and control group had a calcium
intake that was lower than the EAR of 800 mg calcium per day (G = 502.0 mg; C =
589.0 mg). Both groups had intakes that were higher than the EAR for the following
minerals: total iron (G = 11.6 mg; C = 13.5 mg); selenium (G = 50.4 mg; C = 54.5
mg); magnesium (G = 287.5 mg; C = 314.7 mg) and phosphorus (G = 1057.1 mg; C
= 1209.0 mg). Mean intakes of haem iron (G = 0.7mg; C = 1.2mg) and non-haem
iron (G = 4.2; C= 5.3) differed significantly between the two groups (0.005; 0.004
respectively). An EAR for potassium, sodium, haem iron and non-haem iron has not
been established. Intakes of sodium (G = 2438.1 mg; C = 2500.9 mg; p = 0.8) and
phosphorus (G = 1057.1 mg; 1209.0 mg; p = 0.06) did not differ significantly between
the two groups.
5.3.2.2 Vitamin intake of geophagia and control groups
Mean vitamin intakes of the two groups are shown in Table 5.5. Compared to the
geophagia group, the control group had a significantly higher intake of vitamin A (p =
0.005). In both groups the intake of vitamin A (G = 1078.8; C = 1731.0) was higher
than the EAR of 500 µg per day. Other vitamins that exceeded the RDA in both
groups were: thiamine (G = 1.3 mg; C = 1.6 mg); riboflavin (G = 1.5 mg; C = 2.1 mg);
niacin (G = 17.3 mg; C = 23.3 mg) and vitamin B6 (G = 1.5 mg; C = 1. 8 mg). For
vitamin C the control group had an intake that was higher (81.4 mg) than the RDA of
75 mg; while the intake of vitamin C in the geophagia group was lower than the RDA
at 51.1 mg. A significant difference between the two groups was observed as far as
niacin (p = 0.002) and riboflavin (p = 0.003) were concerned. In both groups, intakes
of vitamin D (G = 5.1 mg; C = 5.8 mg) and folate (G = 233.2 mg; C = 282.6 mg) were
lower than the RDA. Intake of vitamin E in the geophagia group (G = 13.9 mg) was
more than the EAR of 12mg.
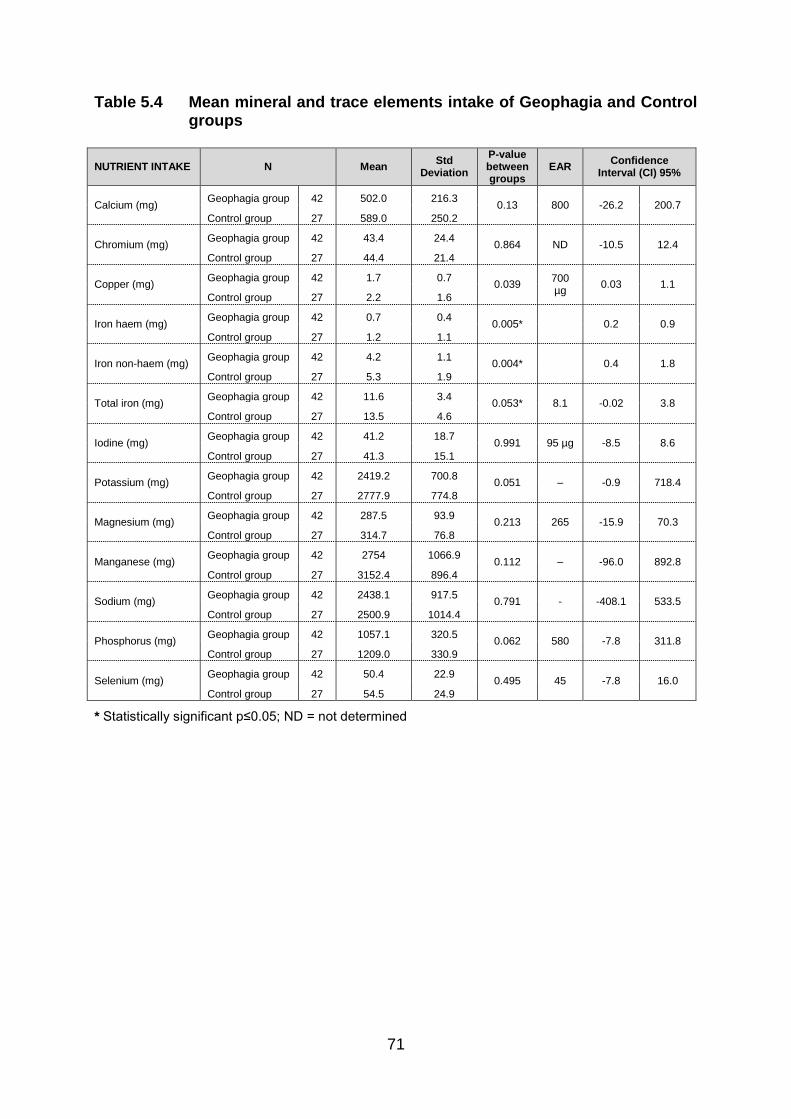
71
Table 5.4 Mean mineral and trace elements intake of Geophagia and Control groups
NUTRIENT INTAKE N Mean Std
Deviation
P-value between groups
EAR Confidence
Interval (CI) 95%
Calcium (mg) Geophagia group 42 502.0 216.3
0.13 800 -26.2 200.7
Control group 27 589.0 250.2
Chromium (mg) Geophagia group 42 43.4 24.4
0.864 ND -10.5 12.4
Control group 27 44.4 21.4
Copper (mg) Geophagia group 42 1.7 0.7
0.039 700 µg
0.03 1.1
Control group 27 2.2 1.6
Iron haem (mg) Geophagia group 42 0.7 0.4
0.005* 0.2 0.9
Control group 27 1.2 1.1
Iron non-haem (mg) Geophagia group 42 4.2 1.1
0.004* 0.4 1.8
Control group 27 5.3 1.9
Total iron (mg) Geophagia group 42 11.6 3.4
0.053* 8.1 -0.02 3.8
Control group 27 13.5 4.6
Iodine (mg) Geophagia group 42 41.2 18.7
0.991 95 µg -8.5 8.6
Control group 27 41.3 15.1
Potassium (mg) Geophagia group 42 2419.2 700.8
0.051 – -0.9 718.4
Control group 27 2777.9 774.8
Magnesium (mg) Geophagia group 42 287.5 93.9
0.213 265 -15.9 70.3
Control group 27 314.7 76.8
Manganese (mg) Geophagia group 42 2754 1066.9
0.112 – -96.0 892.8
Control group 27 3152.4 896.4
Sodium (mg) Geophagia group 42 2438.1 917.5
0.791 - -408.1 533.5
Control group 27 2500.9 1014.4
Phosphorus (mg) Geophagia group 42 1057.1 320.5
0.062 580 -7.8 311.8
Control group 27 1209.0 330.9
Selenium (mg) Geophagia group 42 50.4 22.9
0.495 45 -7.8 16.0
Control group 27 54.5 24.9
* Statistically significant p≤0.05; ND = not determined

72
Table 5.5 Mean vitamin intake of Geophagia and Control groups
Nutrient intake N Mean Std.
Deviation
P-value between groups
EAR
Confidence Interval (CI) 95%
Min Max
Vitamin A (mg) Geophagia group Control group
42 27
1078.8 1731.0
539.7 1284.1
0.005* 500 µg/d
206.9 1097.6
Vitamin D (mg) Geophagia group Control group
42 27
5.1 5.8
2.8 2.9
0.305 10
µg/d -0.7 2.1
Vitamin E (mg) Geophagia group Control group
42 27
13.9 15.8
7.8 8.4
0.34 12 -2.1 5.9
Vitamin K (mg) Geophagia group Control group
42 27
286.4 416.6
288.7 422.7
0.133 ND -40.6 301.0
Thiamine (mg) Geophagia group Control group
42 27
1.3 1.6
0.5 0.6
0.022 0.9 0.04 0.6
Riboflavin (mg) Geophagia group Control group
42 27
1.5 2.1
0.7 1.0
0.003* 0.9 0.2 1.0
Niacin (mg) Geophagia group Control group
42 27
17.3 23.3
5.9 10.0
0.002* 11 2.2 9.8
Vitamin B6 (mg) Geophagia group Control group
42 27
1.5 1.8
0.5 0.8
0.083 1.1 -0.03 0.6
Folate (mg) Geophagia group Control group
42 27
233.2 282.6
72.6 93.1
0.016 32 9.3 89.3
Vitamin B12 (mg) Geophagia group Control group
42 27
7.3 11.8
5.1 13.5
0.052 2.0 -0.3 9.1
Vitamin C (mg) Geophagia group Control group
42 27
51.1 81.4
18.5 79.8
0.02 60 4.8 55.8
* Statistically significant p≤0.05
5.4 ANTHROPOMETRIC NUTRITIONAL STATUS
The mean anthropometric results are summarized in Table 5.6 and the categorical
body mass index values in Table 5.7. Mean waist circumference of both groups fell
under the cutoff point for risk waist circumference in women which is >88 cm (G =
77.5; C = 73.2) (Alberti et al., 2006).
Although the majority of the participants in both the geophagia and control group fell
in the normal category for body mass index (BMI) of 18.5 – 24.9 kg/m2, the mean
BMI fell within the overweight category (G = 25.6 kg/m2; C = 25.1 kg/m2). Only one
participant in the geophagia group fell in the low BMI category.
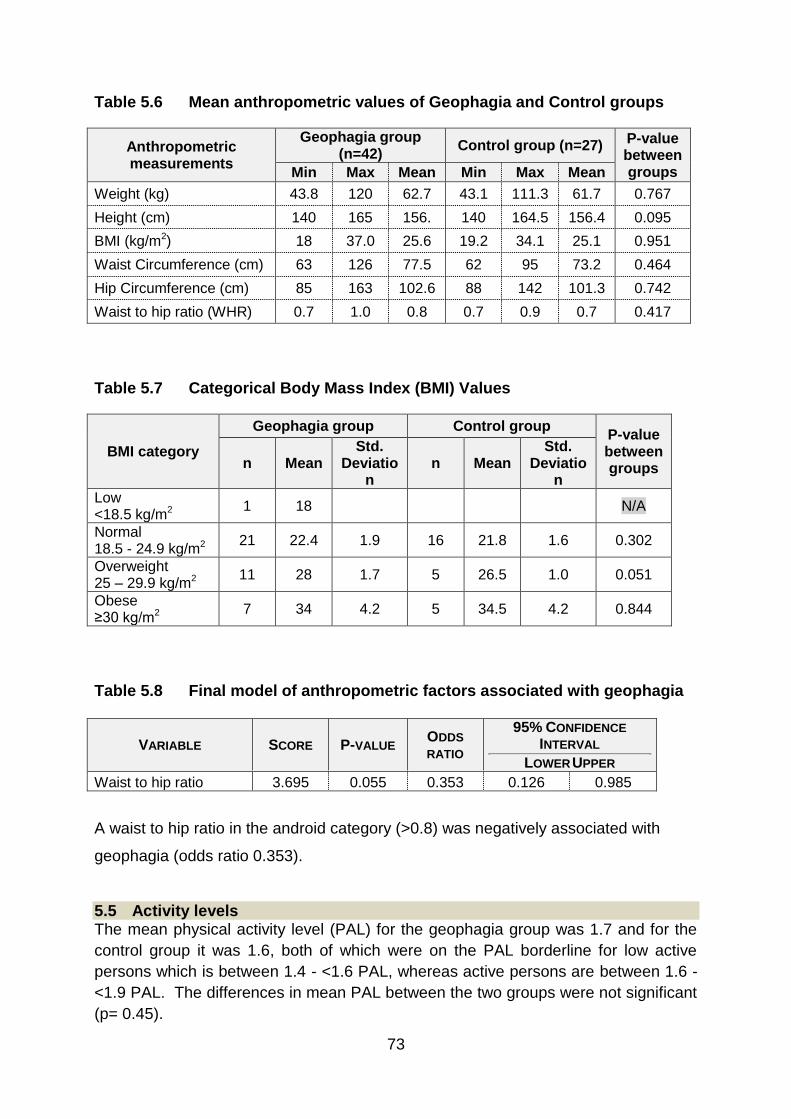
73
Table 5.6 Mean anthropometric values of Geophagia and Control groups
Anthropometric measurements
Geophagia group (n=42)
Control group (n=27) P-value between groups Min Max Mean Min Max Mean
Weight (kg) 43.8 120 62.7 43.1 111.3 61.7 0.767
Height (cm) 140 165 156. 140 164.5 156.4 0.095
BMI (kg/m2) 18 37.0 25.6 19.2 34.1 25.1 0.951
Waist Circumference (cm) 63 126 77.5 62 95 73.2 0.464
Hip Circumference (cm) 85 163 102.6 88 142 101.3 0.742
Waist to hip ratio (WHR) 0.7 1.0 0.8 0.7 0.9 0.7 0.417
Table 5.7 Categorical Body Mass Index (BMI) Values
BMI category
Geophagia group Control group P-value between groups n Mean
Std. Deviatio
n n Mean
Std. Deviatio
n
Low <18.5 kg/m2
1 18 N/A
Normal 18.5 - 24.9 kg/m2
21 22.4 1.9 16 21.8 1.6 0.302
Overweight 25 – 29.9 kg/m2
11 28 1.7 5 26.5 1.0 0.051
Obese ≥30 kg/m2
7 34 4.2 5 34.5 4.2 0.844
Table 5.8 Final model of anthropometric factors associated with geophagia
VARIABLE SCORE P-VALUE ODDS
RATIO
95% CONFIDENCE
INTERVAL
LOWER UPPER
Waist to hip ratio 3.695 0.055 0.353 0.126 0.985
A waist to hip ratio in the android category (>0.8) was negatively associated with
geophagia (odds ratio 0.353).
5.5 Activity levels The mean physical activity level (PAL) for the geophagia group was 1.7 and for the
control group it was 1.6, both of which were on the PAL borderline for low active
persons which is between 1.4 - <1.6 PAL, whereas active persons are between 1.6 -
<1.9 PAL. The differences in mean PAL between the two groups were not significant
(p= 0.45).

74
A large percentage of participants in the geophagia group (n=15) fell into the PAL
range for low activity, whilst a large percentage of the participants in the control
group (n=12) fell into the active PAL range of 1.6 - <1.9 as demonstrated in Table
5.10.
Table 5.9 Continuous activity level
Geophagia group (n=42) Control group (n=27) P-value between groups Min Max Mean
Std. Deviatio
n Min Max Mean
Std. Deviati
on
Total PAL 1.0 2.2 1.7 0.3 1.2 2.6 1.6 0.2 0.45
Table 5.10 Categorical activity level
PAL category
Geophagia group (n=42) Control group (n=27)
n Min Max Mean Std
Deviation
n Min Max Mean Std
Deviation
Sedentary: 1 - <1.4 PAL
5 1 1.4 1.30 0.1 4 1.2 1.4 1.3 0.1
Low activity: 1.4 - <1.6 PAL
15 1.5 1.6 1.5 0.1 7 1.5 1.6 1.5 0.0
Active: 1.6 - <1.9 PAL
9 1.7 1.9 1.8 0.1 12 1.7 1.9 1.7 0.1
Very active: 1.9 - 2.5 PAL
9 2.0 2.2 2.10 0.2 3 1.99 2.6 2.0 0.0
5.6 BLOOD RESULTS
The mean values for blood results are summarized in Table 5.11.
Participants in both the geophagia and control groups had normal mean blood values
for sodium (G = 138.8 mmol/L; C = 137.6 mmol/L), potassium (G = 4.4 mmol/L; C =
4.6 mmol/L) and calcium (G = 2.3 mmol/L; C = 2.3 mmol/L). Both groups had mean
serum magnesium values of 0.8 mmol/L and 0.9 mmol/L respectively, which fell
below the ideal range of 2.3 - 2.6 mmol/l. The mean serum iron levels of the
geophagia group were significantly lower (p = 0.000) than that of the control group (G
= 6.9 µmol/L; C = 13.8 µmol/L). There was also a significant difference in the serum
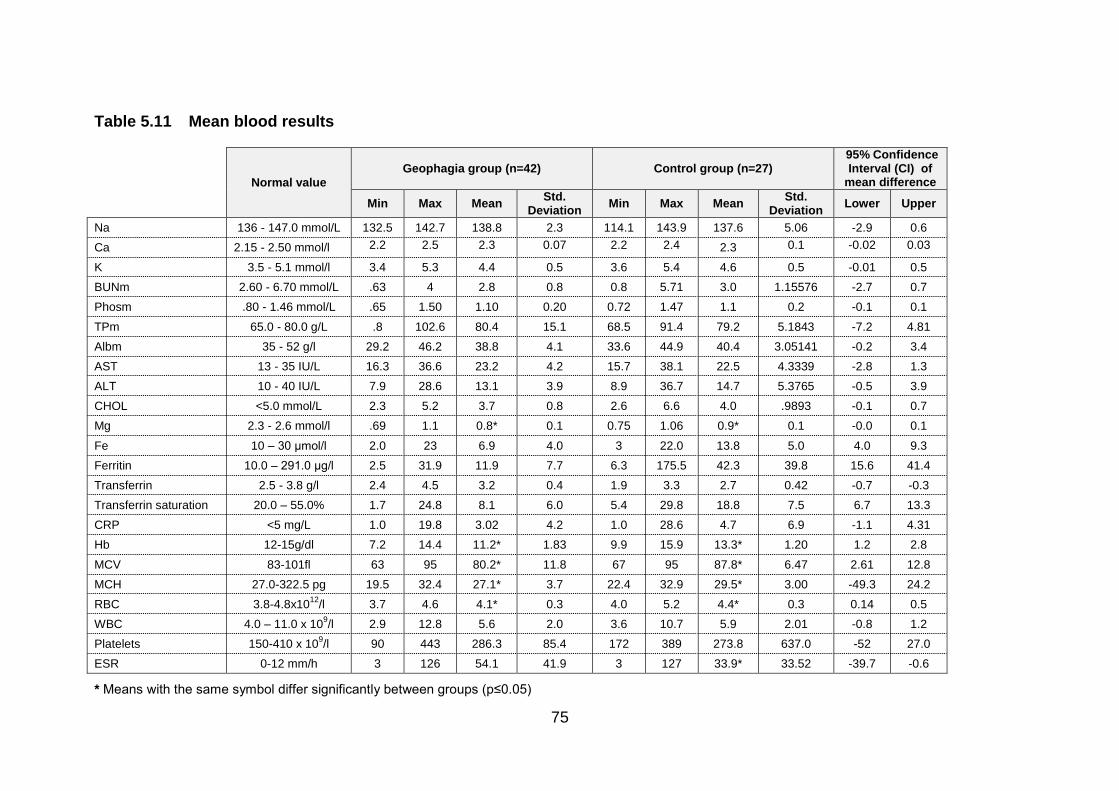
75
Table 5.11 Mean blood results
Normal value
Geophagia group (n=42) Control group (n=27) 95% Confidence Interval (CI) of
mean difference
Min Max Mean Std.
Deviation Min Max Mean
Std. Deviation
Lower Upper
Na 136 - 147.0 mmol/L 132.5 142.7 138.8 2.3 114.1 143.9 137.6 5.06 -2.9 0.6
Ca 2.15 - 2.50 mmol/l 2.2 2.5 2.3 0.07 2.2 2.4 2.3 0.1 -0.02 0.03
K 3.5 - 5.1 mmol/l 3.4 5.3 4.4 0.5 3.6 5.4 4.6 0.5 -0.01 0.5
BUNm 2.60 - 6.70 mmol/L .63 4 2.8 0.8 0.8 5.71 3.0 1.15576 -2.7 0.7
Phosm .80 - 1.46 mmol/L .65 1.50 1.10 0.20 0.72 1.47 1.1 0.2 -0.1 0.1
TPm 65.0 - 80.0 g/L .8 102.6 80.4 15.1 68.5 91.4 79.2 5.1843 -7.2 4.81
Albm 35 - 52 g/l 29.2 46.2 38.8 4.1 33.6 44.9 40.4 3.05141 -0.2 3.4
AST 13 - 35 IU/L 16.3 36.6 23.2 4.2 15.7 38.1 22.5 4.3339 -2.8 1.3
ALT 10 - 40 IU/L 7.9 28.6 13.1 3.9 8.9 36.7 14.7 5.3765 -0.5 3.9
CHOL <5.0 mmol/L 2.3 5.2 3.7 0.8 2.6 6.6 4.0 .9893 -0.1 0.7
Mg 2.3 - 2.6 mmol/l .69 1.1 0.8* 0.1 0.75 1.06 0.9* 0.1 -0.0 0.1
Fe 10 – 30 μmol/l 2.0 23 6.9 4.0 3 22.0 13.8 5.0 4.0 9.3
Ferritin 10.0 – 291.0 μg/l 2.5 31.9 11.9 7.7 6.3 175.5 42.3 39.8 15.6 41.4
Transferrin 2.5 - 3.8 g/l 2.4 4.5 3.2 0.4 1.9 3.3 2.7 0.42 -0.7 -0.3
Transferrin saturation 20.0 – 55.0% 1.7 24.8 8.1 6.0 5.4 29.8 18.8 7.5 6.7 13.3
CRP <5 mg/L 1.0 19.8 3.02 4.2 1.0 28.6 4.7 6.9 -1.1 4.31
Hb 12-15g/dl 7.2 14.4 11.2* 1.83 9.9 15.9 13.3* 1.20 1.2 2.8
MCV 83-101fl 63 95 80.2* 11.8 67 95 87.8* 6.47 2.61 12.8
MCH 27.0-322.5 pg 19.5 32.4 27.1* 3.7 22.4 32.9 29.5* 3.00 -49.3 24.2
RBC 3.8-4.8x10¹²
/l 3.7 4.6 4.1* 0.3 4.0 5.2 4.4* 0.3 0.14 0.5
WBC 4.0 – 11.0 x 10⁹/l 2.9 12.8 5.6 2.0 3.6 10.7 5.9 2.01 -0.8 1.2
Platelets 150-410 x 109/l 90 443 286.3 85.4 172 389 273.8 637.0 -52 27.0
ESR 0-12 mm/h 3 126 54.1 41.9 3 127 33.9* 33.52 -39.7 -0.6
* Means with the same symbol differ significantly between groups (p≤0.05)

76
ferritin levels between the geophagia and control group (G =11.9µg/L; C = 42.3 µg/L;
p = 0.00). Serum transferrin and serum transferrin saturation levels also differed
significantly between the groups (G = 3.2; 8.1 and C = 2.7; 18.8; p = 0.00).
The mean haemoglobin (G=11.2g/dl; C=13.3g/dl differed significantly while the mean
cell haemoglobin (G=27.1pg; C=29.5pg) and the mean cell volume (G=80.2fl;
C=87.8fl) were not significantly lower in the geophagia group in comparison to the
control group. The platelet count (G = 286.3; C = 273.8) in both groups were within
normal reference range ruling out bleeding. The white blood cell count (WBC) (G =
5.6 x 10⁹/l; C = 5.9 x 10⁹/l) and C-reactive protein (CRD) (G=3.0mg/L; C=4.7mg/L)
also fell within normal reference range for the geophagia and control groups, while
the erythrocyte sedimentation rate (ESR) (G= 54.1mm/h; 33.9mm/h) was higher than
the normal reference range in both groups.

77
5.7 CORRELATION BETWEEN DIETARY INTAKE AND BLOOD RESULTS OF GEOPHAGIA AND CONTROL GROUPS PRE- AND POST-INTERVENTION
The correlation between the dietary intake and blood results of the geophagia and
control groups before the intervention are provided in Table 5.12. In both the
geophagia group and control group serum iron correlated with albumin (p = 0.005; p
= 0.008) respectively and dietary iron did not correlate with serum iron in either of the
groups. Albumin in the geophagia group correlated with calcium (p = 0.000) and
phosphate (p = 0.004) and dietary iron intake correlated with energy intake
(p = 0.000).
Table 5.12 The correlation between the dietary intake and blood results of the Geophagia and Control group before intervention
Geophagia group (n=42) Control group (n=27)
Variable 1 Variable 2 R2 P-value Variable 1 Variable 2 R
2 P-value
Serum Iron Albumin
0.337 0.005* Serum Iron Albumin
0.315
0.008*
Albumin Calcium
Phosphate
0.762
0.342
0.000*
0.004*
Dietary iron Energy
0.710 0.000* Dietary iron Sodium
Potassium
Chloride
Calcium
Phosphate
Selenium
Mn
Dietary Cholesterol
Magnesium
Plantprotein
Animal protein
Haem-iron
NonHaem-iron
Copper
Dietary fat
0.705
0.776
0.504
0.577
0.792
0.498
0.538
0.547
0.737
0.500
0.618
0.565
0.726
0.648
0.511
0.555
0.000*
0.000*
0.000*
0.000*
0.000*
0.000*
0.000*
0.000*
0.000*
0.000*
0.000*
0.000*
0.000*
0.000*
0.000*
0.000*
* Statistically significant p≤0.05
78
5.8 IRON STATUS AND GEOPHAGIA
A logistic regression analysis with forward selection was performed in order to
establish a typical metabolic profile that could be associated with geophagia. It is
envisaged that from the variables included in the equation, one could establish
whether a given individual practices geophagia or not. Variables included in the
equation are presented in Table 5.13. Risk factors which can be significantly
associated with the practice of geophagia included: serum iron (p = 0.00), haem-iron
(p = 0.009), non-haem-iron (p = 0.004), ferritin (p = 0.00), transferrin (p = 0.000),
transferrin saturation (p = 0.000) and haemoglobin (p=0.000) as illustrated in Table
5.8. In addition the waist-to-hip-ratio was also identified as a risk factor with
geophagia (p=0.055).
A logistic regression analysis of the components of iron status as presented in Table
5.13, delivered the following equation:
Y = α + (-0.184) Serum iron (Fe) + (-1.456) HaemFe + (-0.008) NonHaemFe + (-
0.31) Ferritin + (0.538) Transferrin + (0.026) Transferrin saturation + (-0.441)
Haemoglobin + € (with € as the error).
It is evident from this analysis that a strong correlation exists between blood iron
status variables, and the practice of geophagia.
An additional logistic regression analysis was performed, using a cluster of variables
(Iron, Ferritin, Transferrin, Transferrin Saturation, and Haemoglobin) that collectively
relate to Iron Status. Each variable was divided into two categories, using the 50th
percentile as cut-off (using category 1 as non-desirable, rather than above or below
the 50th percentile and category 2 as desirable, rather than above or below the 50th
percentile). It is important to acknowledge that the 50th percentile was relative to
each group and not based on any standard clinical reference values.
Y = α + (0.431) Cluster + € (with € as the error).

79
Table 5.13 Final model of blood (pathology) associated with geophagia
VARIABLE SCORE P-VALUE ODDS
RATIO
95% CONFIDENCE
INTERVAL
LOWER UPPER
Iron (FE) 19.589 0.000* 9.80 2.99 32.11
Ferritin 15.434 0.000* 3.750 1.312 10.721
Transferrin 17.481 0.000* 6.923 2.243 27.929
Haemoglobin 18.425 0.000* 14.50 4.066 51.709
Haem-iron 6.888 0.009* 3.508 1.244 9.893
Non-haem-iron 8.134 0.004* 4.673 1.613 13.538
Transferrin saturation 23.697 0.000* 14.50 4.066 51.709
* Statistically significant p≤0.05
Based on this analysis, it is shown that the Odd Ratio for someone to practice
geophagia and to be classified below the 50th percentile is 27.632 (CI: 3.408 to
224.048; p = 0.000). The implication of this ratio is far-reaching.
5.9 THE GEOPHAGIA KNOWLEDGE AND HABITS PRE- AND POST-INTERVENTION, AS WELL AS THE FOOD-BASED DIETARY GUIDELINES COMPLIANCE POST-INTERVENTION WILL BE PRESENTED IN TABLES.
5.9.1 Geophagia knowledge and habits before intervention
The geophagia knowledge and geophagia habits of the participants were determined
during phase 1 when recruitment took place as well as during phase 2 for the
geophagia and control group. The geophagia group consisted of 42 people
practicing geophagia for at least more than one month.
The geophagia knowledge and habits for the geophagia group before intervention
are presented in Table 5.14
5.9.1.1 Knowledge and habits related to geophagia group before intervention
The majority of participants consumed soil more than once a day (42.9%) and 57.1%
practiced geophagia once a day. The amount of years that the participants had
practiced geophagia ranged from one year to 24 years. Cultural, traditional and
spiritual reasons were given as the main reason for consuming soil (65.9%) and the

80
craving for soil was also reported by most of the participants that practiced
geophagia (97.6%) and occurred daily (82.9%). The same number of participants
reported that craving most likely occurs during the day (n=14) as well as after
consuming a meal (n=14). Participants (53.7%) also indicated to crave soil during
pregnancy. The smell of the clay also triggered the craving for soil (30%). In a large
percentage, family members and friends (65.9%) knew that the participants were
consuming soil.
The main substance consumed by the geophagia group was soil (46.3%) and then
clay (29.3%), both preferably wet (78%). The most prominent clay used by the
geophagists in this study was whitish in colour (65.8%) because of its taste (68.3%).
The clay was collected either from a hill or mountain (19.5%) or was bought at a
market (12.2%). When the participants had collected the clay, only 26.8% processed
the substance before it was eaten, while 20 people indicated that they do use some
heat treatment. The geophagists in this study did not think that the substance can be
harmful to the human body (53.6%) and 46.3 % did think so. More than half of the
participants (58.5%) that answered 'Yes', however did not know the reason for saying
so, but did think that the clay or soil may contain harmful elements such as parasites
(61%). The majority also didn’t know which components could be found in the
substances.

81
Table 5.14 Geophagia knowledge and habits of the Geophagia group pre-intervention
Geophagia group (n=42)
N (42) % of group
Are you presently in the habit of eating soil?
Yes
No
42
0
100%
0%
Frequency of eating soil:
Once a day
More than once a day
24.0
18.0
57.1
42.9
How long have you been eating soil? (years)
1 - 5
6 - 10
11 - 15
16 - 20
20 - 24
19.0
14.0
7.0
1.0
1.0
39.1
34.1
17.0
2.4
2.4
Reasons for eating soil
No answer
Standard practice (cultural, traditional, spiritual)
When hungry
When pregnant
Standard practice and craving
Standard practice and when hungry
Standard practice and when pregnant
1.0
27.0
1.0
1.0
3,0
2,0
6.0
2.4
65.9
2.4
2.4
7.3
4.9
14.6
Do you ever crave soil?
Yes
No
40.0
2.0
97.6
4.8
If Yes, how often?
Regularly - monthly
Regularly - weekly
Regularly - daily
2.0
5.0
34.0
4.9
12.2
82.9
When do you crave soil?
Through the day
Need some taste
After eating
Smells it
After rain
See someone eating soil
Pregnant, smells it and after rain
Pregnant and away from home
Pregnant and after eating
Pregnant and smells it
Pregnant and see someone eating soil
Pregnant and before eating
Need some taste, and after rain
After eating, and after rain
Anytime
Smells it, and after rain
14.6
4.9
14.6
12.2
2.4
4.9
5.0
2.4
4.9
2.4
4.9
2.4
2.4
4.9
2.4
7.3
35.6
12.0
35.6
30.0
5.9
4.9
12.0
5.9
12.0
5.9
12.0
5.9
12.0
12.0
5.9
18.0

82
Table 5.14 Geophagia knowledge and habits of the Geophagia group pre-intervention (cont.)
Geophagia group (n=42)
N (42) % of group
When pregnant, how often do you eat soil?
Once a month
Once a week
Once a day
More than once a day
23
1
14
3
56.1
2.4
34.1
7.3
Do other people know that you eat soil?
Yes
No
35
7
85.4
16.6
If Yes, who knows about it?
No answer
Family members
Extended family members
Family members and friends
5
6
4
27
11.9
14.6
9.8
65.9
Which substances are eaten?
Soil
Clay
Soil and Clay
Other
19
12
7
4
46.3
29.3
17.1
11.9
How are the substances eaten?
With other food
Wet
Dry
3
32
7
7.1
78.0
17.1
What are the traditional names of the substances consumed and bought?
Moby
42
100
Where do you obtain your preferred substance?
From nature
Buy it
Get it from someone
Nature, and buy it
Hill/Mountain
Riverbed
Pit/Excavation
Market
No answer
11
9
2
18
8
1
9
5
1
26.8
22.0
4.9
43.9
19.5
2.4
22.0
12.2
2.4
If you buy it, indicate the price per handful (R/Pula):
<R1
R1
R2
R5
14
18
7
3
34.1
43.9
17.1
7.1
What is the colour of your preferred substance?
Reddish
Whitish
Yellowish
Khaki
Reddish and whitish
Reddish and yellowish
Reddish and khaki
Whitish and yellowish
Whitish and khaki
Reddish, whitish and khaki
2
27
1
3
1
1
1
2
3
1
4.9
65.8
2.4
7.3
2.4
2.4
2.4
4.8
7.3
2.4

83
Table 5.14 Geophagia knowledge and habits of the Geophagia group pre-intervention (cont.)
Geophagia group (n=42)
N (42) % of group
Why do you prefer to eat a substance of that specific colour?
Not indicated
Taste
Easily accessible
Taste and easily accessible
Taste, tradition and easily accessible
5
28
4
3
2
12.2
68.3
9.8
7.3
4.8
Where do you store the substance?
Do not store
Container
Plastic
Sun
9
13
16
4
21.4
31.7
39.0
9.8
For how long do you usually store the substance (days)?
No storage
1
2
3
57
14
20
30
9
6
8
3
5
3
1
2
21.4
14.6
19.5
7.3
12.2
7.3
2.4
4.9
Where can your preferred substance been found?
Hill/Mountain
Riverbed
Pit/Excavation
Market
Given by someone-else to you
Hill and pit/excavation
Hill and market
Riverbed and pit/excavation
Pit/excavation and market
Pit/excavation and given by someone
8
1
9
5
2
7
3
1
3
2
19.5
2.4
22.0
12.2
4.9
17.1
7.3
2.4
7.3
4.8
Is your preferred substance found close to rocks?
Yes
No
Not sure
24
2
9
58.5
4.8
22
If Yes, what type of rock?
Very hard
Hard
Soft
Both hard and soft
12
20
8
2
29.3
48.8
19.5
4.8
Substance-collection method
Not indicated
Digging
Buying
Given
Both digging and scooping handfuls
Both digging and scraping
5
26
5
2
2
1
12.2
64.4
12.2
4.9
4.8
2.4

84
Table 5.14 Geophagia knowledge and habits of the Geophagia group pre-intervention (cont.)
Geophagia group (n=42)
N (42) % of group
If digging, how deep (cm)?
0
10
11
20
30
50
60
14
7
2
8
2
5
4
34.1
17.1
4.8
19.5
4.9
12.2
9.8
How does the substance feel?
Gritty
Silky
Powdery
Does not matter
Don’t know
Both gritty and silky
5
17
2
2
9
7
12.2
41.5
4.9
4.8
21.9
17.1
In what condition is the substance collected?
Not sure
Wet
Dry
Both wet and dry
11
3
11
17
26.8
7.1
26.8
41.5
If collected wet, how does the substance feel?
Not sure
Very sticky
Sticky
Very soapy
Soapy
None of the above
Both sticky and soapy
14
2
4
3
12
5
2
34.1
4.9
9.8
7.3
29.3
12.2
4.8
Is the substance processed before being eaten?
Yes
No
Sometimes
11
27
4
26.8
65.9
9.5
If Yes, how is it processed?
Grinding
Pounding
4
7
9.5
17.1
Is there any heat treatment of the substance before it is eaten?
Yes
No
Sometimes
17
17
3
41.5
41.5
7.3
If Yes, specify the type of heat treatment:
Baking
Sun
Both baking and sun
11
8
1
26.8
19.5
2.4

85
Table 5.14 Geophagia knowledge and habits of the Geophagia group pre-intervention (cont.)
Geophagia group (n=42)
N (42) % of group
Do you think that the substance could be harmful?
Yes
No
Do not know
19
22
1
46.3
53.6
2.4
If Yes, in what way?
Do not know constipationAbdominal pains
Poisoning of the body
Blocked veins
Problem skin and pregnancy
Kidney problems
Both constipation and abdominal pains
Constipation and poisoning of the body
11
2
2
1
1
1
1
58.0
10.0
10.0
5.5
5.5
5.5
5.5
Do you think there are harmful elements / parasites present in the substance?
Yes
No
Don’t know
25
12
5
61.0
29.3
11.9
Do you know the components of the substance?
Yes
No
10
32
23.8
76.2
If Yes, name these components:
Calcium
Iron
Salt
Minerals
Iron and salt
2
0
4
3
1
4.9
0.0
9.8
7.3
2.4
5.9.2 Geophagia knowledge and habits after the intervention
In the geophagia group, the percentage of participants practicing geophagia after the
intervention was 60.7%. The frequency of eating soil was that 25.0% consume soil
more than once a day, 17.9% once a day and 10.7% once a week. The reasons for
eating soil were predominantly because of the craving for soil and standard practice.
Of the geophagia group, 75% thought that eating soil can be harmful due to worms in
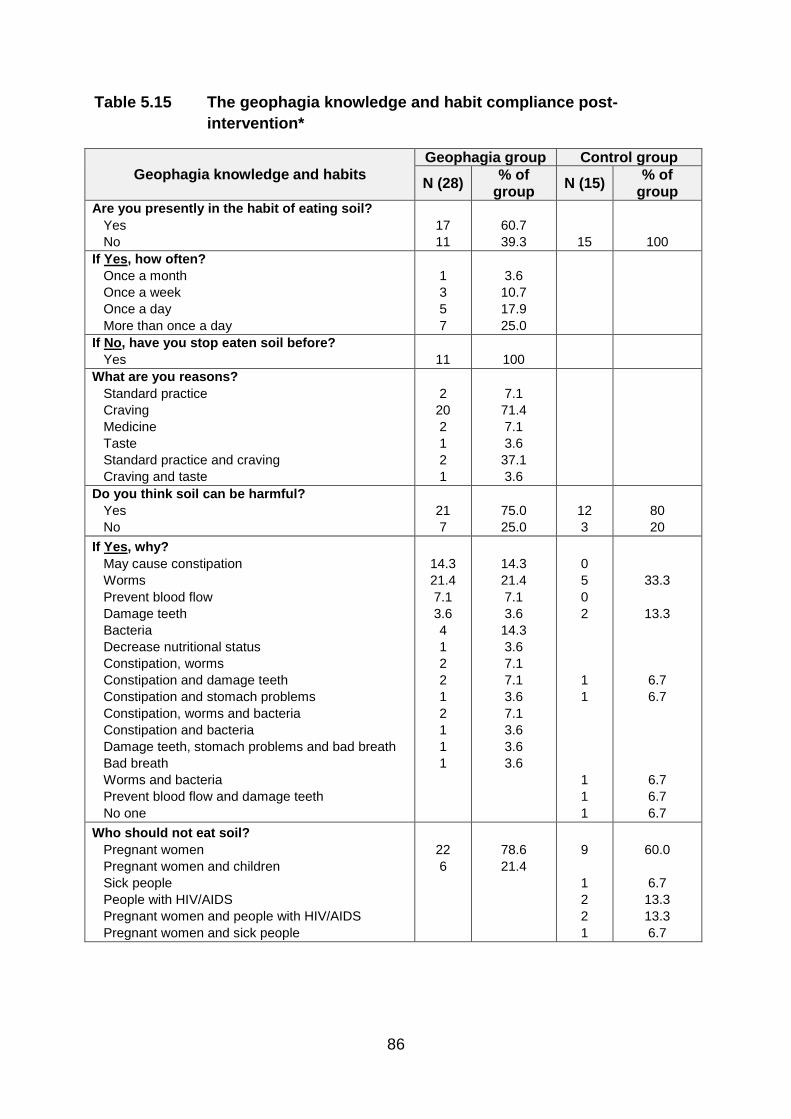
86
Table 5.15 The geophagia knowledge and habit compliance post-
intervention*
Geophagia knowledge and habits Geophagia group Control group
N (28) % of
group N (15)
% of group
Are you presently in the habit of eating soil?
Yes
No
17
11
60.7
39.3
15
100
If Yes, how often?
Once a month
Once a week
Once a day
More than once a day
1
3
5
7
3.6
10.7
17.9
25.0
If No, have you stop eaten soil before?
Yes
11
100
What are you reasons?
Standard practice
Craving
Medicine
Taste
Standard practice and craving
Craving and taste
2
20
2
1
2
1
7.1
71.4
7.1
3.6
37.1
3.6
Do you think soil can be harmful?
Yes
No
21
7
75.0
25.0
12
3
80
20
If Yes, why?
May cause constipation
Worms
Prevent blood flow
Damage teeth
Bacteria
Decrease nutritional status
Constipation, worms
Constipation and damage teeth
Constipation and stomach problems
Constipation, worms and bacteria
Constipation and bacteria
Damage teeth, stomach problems and bad breath
Bad breath
Worms and bacteria
Prevent blood flow and damage teeth
No one
14.3
21.4
7.1
3.6
4
1
2
2
1
2
1
1
1
14.3
21.4
7.1
3.6
14.3
3.6
7.1
7.1
3.6
7.1
3.6
3.6
3.6
0
5
0
2
1
1
1
1
1
33.3
13.3
6.7
6.7
6.7
6.7
6.7
Who should not eat soil?
Pregnant women
Pregnant women and children
Sick people
People with HIV/AIDS
Pregnant women and people with HIV/AIDS
Pregnant women and sick people
22
6
78.6
21.4
9
1
2
2
1
60.0
6.7
13.3
13.3
6.7

87
Table 5.15 The geophagia knowledge and habit compliance post-
intervention* (cont.)
Geophagia knowledge and habits Geophagia group Control group
N (28) % of
group N (15)
% of group
If eating soil, how can you improve your health?
Eat food rich in iron
Drink lots of water
Not sure
Eat healthy food
Exercise
Drink supplements
Bake soil in oven or sun
Eat fruit and vegetables
Drink lots of water and eat fruit and vegetables
Eat healthy foods
Eat healthy foods and exercise
Eat healthy foods and fruit and vegetables
Eat food rich in iron, healthy food, fruit and vegetables
Drink lots of water, eat healthy foods and exercise
Drink lots of water and eat healthy foods
5
1
2
2
7
1
1
3
1
1
1
2
2
1
1
17.9
3.6
7.1
7.1
25.0
3.6
3.6
10.7
3.6
3.6
3.6
7.1
7.1
3.6
3.6
3
6
1
3
1
1
20.0
40.0
6.7
20.0
6.7
6.7
Did you have access to the brochure
Yes
28
100
15
100
Did you change anything after you received the information?
Yes
No
22
6
78.6
21.4
11
4
73.3
26.7
If Yes what did you change?
No change
Reduce eating soil for more than once a day to only once a day
People should stop eating soil
Eat healthy foods
Bake soil
Stop eating soil with meals
Drink more water
Eat a variety of foods
Stop eating soil and eat healthy foods
Eat healthy foods and test blood iron levels at clinic
Exercise more and bake soil
Bake soil and stop eating soil with meals
Stop eating soil and drink more water
Reduce eating soil and drink more water
Eat healthy foods
Exercise more
People must stop eating clay to prevent damage to teeth
Eat more fruit and vegetables
6
2
5
2
1
1
1
–
–
–
1
1
2
1
1
1
1
1
21.4
7.1
17.9
7.1
3.6
3.6
3.6
–
–
–
3.6
3.6
7.1
3.6
3.6
3.6
3.6
3.6
4
–
–
1
2
–
–
–
–
–
1
–
–
–
–
4
1
2
26.7
–
–
6.7
13.3
–
–
–
–
–
6.7
–
–
–
–
26.6
6.7
13.3
* A relevant statistical analysis of this table will be provided in Table 5.17

88
the soil as well as getting constipation. In the control group, 80.0% of participants
agreed that the soil can be harmful to geophagists and 33.0% answered ‘Yes’
because of the worms which could be present in the substance geophagists
consume. Both the geophagia group (78.6%) and control group (60.0%) felt that
pregnant women should not be practicing geophagia.
In the geophagia group exercise and eating food rich in iron were the dominant
reasons geophagists' health can be improved (17.7%; 17.9% respectively). The
control group agreed that exercise can improve your health, as well as eating food
rich in iron (40%; 20% respectively).
5.9.3 Food-based Dietary Guidelines compliance after the intervention
The geophagia knowledge and habit compliance post-intervention is presented in
Table 5.15 and compliance towards the Food Based Dietary Guidelines in Table
5.16.
All the participants in the geophagia and control groups agreed that a variety of food
represented the food-based dietary guidelines and starchy foods should form the
basis of most meals (Table 5.16). The majority of participants in both groups
disagreed on the statement that chicken, milk and eggs cannot be eaten daily (G =
71.4%; C = 66.7%). Everyone in the geophagia group responded positively that fruit
and vegetables should be eaten every day, while 93.3% in the control group agreed.
The geophagia and control groups disagreed on the statement that dry beans, peas,
lentils and soya should not be eaten regularly (G = 64.3%; C = 60%). Both groups
agreed 100% that salt and fat should be used sparingly and disagreed that food and
drinks containing sugar can be eaten as often as one likes (G = 75%; C = 80%).

89
Table 5.16 The Food Based Dietary Guidelines compliance post- intervention
FOOD-BASED DIETARY GUIDELINES
Geophagia group
Control group
N (28) % of
group N (15)
% of grou
p
Eat variety of foods Agree
28
100
15
100
Starchy foods should form the basis of most meals Agree
28
100
15
100
Chicken, fish milk and eggs cannot be eaten daily Agree Disagree
8
20
28.6 71.4
5
10
33.3 66.7
Eat plenty of fruit and vegetables every day Agree Disagree
28
100
14 1
93.3 6.7
Dry beans, peas, lentils and soya should not be eaten regularly Agree Disagree
10 18
35.7 64.3
6 9
40.0 60.0
Salt should be used sparingly Agree Disagree
28
100
15
100
Fat should be used sparingly Agree
28
100
15
100
Use food and drinks containing sugar as often as you like Agree Disagree
7
21
25.0 75.0
2
12
13.3 80.0
5.9.4 Differences between the Geophagia and Control group pre- and post-intervention
After the intervention (Table 5.17), there was a significant (p=0.000) change of 17
(39.3%) in the total number of participants consuming soil. The consumption of soil
more than once a day also decreased significantly (p=0.000) from 42.9% to 25% of
the group as a whole. After the intervention, more participants (+14%) in the
geophagia group knew that soil contains harmful substances, whereas less
participants in the control group (-13%) reported 'Yes' to the answer. Both groups
showed a significantly positive difference in knowing that pregnant women and
children should not consume soil (G = +97.6%; C = +63.3%) (p=0.000).

90
Every participant had access to a brochure, which was distributed during the
intervention phase. In the geophagia group 17.1% changed their geophagic habit of
eating soil more than once a day to only once a day. The majority of participants did
Table 5.17 Significant Differences between the Geophagia and Control
group before and after the intervention
Geophagia group Control group
Before
intervention
After
intervention
Diffe-
rence
P-
value
within
groups
Before
intervention
After
intervention
Diffe-
rence
P-value
within
groups n=42 % n=28 % % n=27 % n=15 % %
Total
participants
practicing
geophagia
42 100 17 60.7 39.3 0.000* -- -- -- -- --
Change in
frequency of
soil
consumed:
18 42.9 7 25.0 18.9 0.000* -- -- -- -- --
Do you think
the
substance
can be
harmful? No
25 61.0 21 75.0 14 NS 28 93 12 80 -13 NS
Know that
pregnant
women and
children
should not
consume soil
1 24.0 28 100 97.6 0.000* 1 3.4 10 66.7 63.3 0.000*
Food Based Dietary Guidelines
Have heard
about the
FBDG before
the
intervention
7 16.6 28 100 83.4 0.000* 4 14.8 15 100 85.2 0.000*
Number of
questions
answered
correctly
-- -- 10 80.3 -- -- -- -- 10 87.5
* Statistically significant p≤0.05; NS= non-significant

91
change one or more habits after reading the brochure
(G = 78.5%; C = 73%).
The majority of participants in the geophagia and control groups (G = 80.3%; C =
87.5%) answered all of the questions from the Food-Based Dietary Guidelines
correctly. The number of participants not knowing what the FBDGs were, decreased
significantly after the intervention (p=0.000).
92
CHAPTER 6
DISCUSSION
6.1 Introduction
In this chapter the socio-demographic data, nutritional and anthropometric status,
physical activity as well as blood results of the study participants will be discussed.
The measured associations between the dietary intake and blood results; the
geophagic status of the geophagia and control groups before and after the
intervention, as well as the risk factors associated with geophagia will be elaborated
on. Where possible, the results will be discussed and compared to available
literature. The current study was the first of its kind in South Africa to determine the
nutritional status and risk factors associated with the practice of geophagia, which
made it difficult to compare data with other like studies in local communities.
6.2 Limitations of the study
The limitations of this study included the large geographical area in QwaQwa that
needed to be covered, which was exacerbated by the lack of directions and road
signs to follow. In some instances, no street names were available. This was
overcome by making use of a credible fieldworker who knew the area well. During
the recruitment phase one, the fieldworker became familiar with the geographical
details and surroundings of QwaQwa to ensure that the identified participants could
be found again when the study started. He made detailed notes on locations and
house numbers and a local person was identified in each area to contact for
directions.
The total sample consisted of 69 participants, of whom 42 were in the geophagia
group (G) and 27 in the control group (C), at baseline. After the intervention, 44
participants could be contacted, with 29 in the geophagia group and 15 in the control
group. The reasons for a lower availability of respondents were mainly that they had

93
either moved away to urban areas or had left the area to study further away from
home.
The fieldworker, who was also involved in the large study, was familiar with the
community. Initially, the fieldworker was responsible for meeting with community
leaders to obtain permission to work in the community. The fieldworker walked from
door to door to recruit participants for the study over a period of a year. In this way
he gained the participants' trust.
The fact that the practice of geophagia is a private matter (Woywodt & Kiss, 2002)
also made it very difficult to find participants to consent to participate in the study,
which contributed to the small sample size. Even though originally planned to see
participants in focus groups, participants were seen either alone or in pairs,
depending on their individual preferences. A high value was put on the protection of
privacy, because of the cultural beliefs associated with the practice of geophagia in
the community, which became obvious right from the beginning of the project. The
community, from which the study population was selected, is still relatively traditional
in their way of life. It was therefore, required of the researcher to take into
consideration cultural beliefs and practices, not only to prevent stigmatisation of
participants, but also for effective communication, and to maintain a high level of
ethical conduct.
The laboratory costs of the study to evaluate blood samples were enormous, which
limited the frequency of blood tests, and also the spectrum of laboratory analyses
covered, which could have included additional micronutrients (such as zinc,
selenium, etc. In this study blood samples were taken once during phase 2 before
the intervention period. It would have been valuable to repeat blood sampling after
the intervention period to compare values before and after the intervention. Due to
financial constraints, this was not possible.
Although the food frequency questionnaire was not repeated after the intervention
period. In future it might have value to determine the difference in dietary intake
before and after a longer intervention period. The relatively short period of time
between the pre-intervention and post-intervention (three months), was unlikely to

94
result in changes in dietary intake and thus dietary intake was only assessed once. It
did not influence the current study because the primary objective of this study was to
determine the overall nutritional status of the women in QwaQwa consuming soil, at
baseline. Also, a long-term follow-up would be recommended in order to evaluate
whether the impact of the intervention was sustainable in this population.
6.3 Socio-demographic status
All participants in the current study were female. The mean age of participants was
similar at 25 years in the geophagia group and 26 years in the control group. This
age group was also very comparable to that of participants in a study by Koryo-
Dabrah et al. (2012) at an antenatal clinic in Kenya, where 57.3% of 279 women
between the ages of 20 and 39 practiced pica. This age group represents a women's
reproductive years which is important since geophagia is strongly associated with
pregnancy (Young, 2010; Nyaruchucha, 2009; Corbett et al., 2003; Karimi et al.,
2002; Tayie & Lartey, 1999). Although participants in this study were not pregnant at
the time of the survey more than half, 53.7% reported that they had practiced
geophagia during pregnancy. It is also important to note that a large percentage of
younger participants (33%) did not have children yet and had thus not been pregnant
before. Abrahams et al. (2013) report that geophagia is not particularly restricted to a
certain age group, race, gender, geographic reason or time. These authors do,
however, report that it is more common amongst poorer populations (Abrahams &
Parsons, 1996).
Young et al. (2010a) found that formal education and marital status in pregnant
women practicing pica in Zanzibar, Tanzania, did not differ statistically from that of
women who did not engage in pica. Similarly, women with pica had similar
educational level, marital status and employment status as those without pica in
Argentina (López et al., 2007a). Women in Nigeria practicing geophagia were,
however, more likely to have a low income and no formal education than those that
did not practice geophagia (Izugbara, 2003). In 2012 the SANHANES-1 was
conducted to determine the health and nutritional status of South Africans.
Nutritional and demographic information (such as education and income) were
95
determined during the survey. In the current study 30% in the geophagia group and
37% of the participants in the control group completed grade 12 between the ages of
18 and 45 years, which compares with South Africans of the same age. In the
SANHANES-1 study (n= 19319), in which 27% between the ages of 15 and 24 years
and 40% between 25 and 34 years of the sample completed high school.
In this study there was no significant difference in marital status between the two
groups. More than two thirds in both groups were unmarried, which mirrored the
situation in the general population of South Africa where 68.6% of females in the age
group 18 – 34 years have never been married (Stats, 2013). Young, et al. (2010a)
also found no significant difference in marital status of women practicing pica
compared to those who did not practice pica attending eight different health clinics in
Tanzania.
According to Bhorat & Van der Westhuizen (2008) female-headed households are
more likely to live in poverty. In a study amongst black, white and mixed racial
patients from three public hospitals in Bloemfontein, in the Free State Province South
Africa; pica was more prevalent in black patients (Louw et al., 2007). Literature
reports from 1950 – 1990 also showed that pica seems to be prevalent in black
women in other parts of the world (Horner et al., 1991). Although the majority of
participants were unmarried, they were not necessarily the head of the household.
The majority of participants in the current study indicated that a parent was the head
of the household (Table 5.1), but the gender of the parent was not indicated.
There were no differences in socio-economic status, for type of house owned,
income and the owning of appliances such as a microwave and/or stove between the
geophagia and control groups. However, the control group did have more access to
a refrigerator compared to the geophagia group (p=0.02), with the probability of
practicing geophagia being lower in the group with a refrigerator (OR: 1.54; CI: 0.056;
0.849). In the current study 85.7% of participants in the geophagia group and 96.3%
in the control group lived in brick houses. These findings were slightly higher when
compared to the participants of the same age (15 – 34 years) in the SANHANES
study where 77.6% lived in formal housing (brick) (SANHANES-1, 2013).

96
In the current study, the majority of participants in both the geophagia- and control
group used electricity for cooking (83.3%; 85.2% respectively). Although more than
the majority of South Africans have access to electricity (87.1% in the 15 - 24 year
group and 86.1% in the 25 - 34 years of age group), alternative sources of energy
are still used for cooking in 18.1% of the population (SANHANES-1, 2013). These
statistics are similar to findings in the current study where less than ten percent of
participants used alternative energy sources which included paraffin, gas and wood
or coal.
As previously mentioned, female headed households in South Africa tend to have a
lower income than male headed households, regardless of race (SANHANES-1,
2013). As indicated in Table 5.1 of the results, a significant negative association
(p=0.014) was found between women who were wage-earners and those who were
not wage-earners and the practice of geophagia (OR: 0.143; CI: 0.027; 0.755).
These findings seem to indicate that a permanent income may decrease the
likelihood of practising geophagia.
The literature reports controversial information related to the practice of pica and the
prevalence of hunger. On the one hand it is hypothesised that geophagia is
practiced because little food is available and people eat soil to ward of hunger
(Young, 2011: 92). Woywodt & Kiss (2002) concluded that there is not enough
evidence, to confirm this hypothesis. Young et al. (2010a) found that pregnant and
non-pregnant women in Pemba did not practice geophagia because of hunger. In the
current study participants also indicated that they did not eat soil because of hunger,
but predominantly out of the craving for the soil and traditional reasons. The results
of the current study confirmed that in this sample soil is rather consumed due to
traditional reasons and cravings and not because of hunger or shortage of food.
In summary, in this study the socio-economic status of participants practising
geophagia appeared to be similar to that of participants in other studies regarding
some of the descriptive variables. However, the significant negative association
between women who owned a refrigerator and those who did not as well as those
who were wage earners and those who were not, and the practice of geophagia
indicates that income may be a predictor of the practice of geophagia.
97
6.4 Dietary intake
The dietary intake of participants was measured at baseline, in order to investigate
the possible link between the practice of geophagia and dietary intake. Although no
significant differences in energy and macronutrient intakes were seen in the
geophagia and control group at baseline, micronutrient intakes did differ. The dietary
intakes with reference to total energy, macronutrients and micronutrients will be
discussed in the following section.
6.4.1 Total energy and macronutrients
Energy and macronutrient intakes were similar in both groups. A study amongst
pregnant women in Zanzibar, Tanzania also indicated no difference in macronutrient
intake between women practising pica and those without pica. In that study, the
number of meals eaten per day also didn't differ between pregnant women practicing
pica or not (Young et al., 2010c). The total number of foods eaten in the last 7 days
was very similar at 11.1 for pregnant women that did not engage in pica and 10.8 for
those practising geophagia. The mean energy intake of the participants in the
current study (G: 10324.3kJ; C: 10763.9kJ) was higher than the mean energy intake
of Kenyan women aged 15 – 60 years from four primary regions in Kenya (non-
geophagic), and also higher than non-geophagic South African women (n=4481) 15
years and older collected from the Demographic and Health Survey (DHS) (Steyn et
al., 2012).
In the current study, energy contribution from carbohydrates in the geophagia and
control groups was very similar at 54.1% and 54.4% of total energy respectively. The
total protein intake for the geophagia- and control group was 74.6g and 85.6g
respectively; which contributed to 12.5% (G) and 13.6% (C) of the total energy
intake. The percentage total energy intakes from fat was 33.1% in the geophagia
group and 31.5% in the control group, which indicates a moderate dietary fat intake.
The SANHANES-1 survey also reported a moderate fat intake in rural women, using
mean fat scores (SANHANES-1, 2013).

98
The macronutrient intake in both the geophagia- and control group fell within the
recommended normal range for carbohydrates (45% - 65% of total energy), protein
(10% - 35% of total energy) and fat intake (20% - 35%) (Institute of Medicine, 2002).
The percentage energy from fat in the geophagia group tended to be slightly higher,
but still less than the upper limit of 35%.
A global nutrition transition has been reported with developing populations tending to
increase their intake of energy dense foods (Prentice, 2007; Popkin & Gordon-
Larson, 2004). Although a nutrition transition has been reported to be more
prevalent in urban areas of South Africa than rural areas (Steyn et al., 2012;
MacIntyre et al., 2002; Vorster et al., 2010), rural areas are also becoming more
westernised. Although the macronutrient intake in this study did not point to a
confirmed nutrition transition, the tendency towards a high dietary fat intake might be
an indication that it is in the process of developing. This hypothesis is strengthened
by the results related to the anthropometry and physical activity levels of participants.
6.4.2 Micronutrient intake
Factors such as age, level of education, ethnicity and area of residence have a direct
impact on the nutrient intake and consumption of South Africans (Puoane et al.,
2002) and many South Africans do not meet their requirements for micronutrients
(Vorster, 2010; Steyn et al., 2006; Vorster et al., 1997).
6.4.2.1 Minerals
The dietary calcium intake in both the geophagia- and control group was lower than
the recommended estimated average requirements (EAR), but did not show in the
blood levels which fell into the normal range in both groups. However, blood calcium
levels are not a reliable indicator of calcium status, because 99% of calcium is stored
in the bone (Charney, 2012: 183). Although geophagia is commonly practiced
amongst pregnant women with low calcium intakes, experimental evidence does not
show that treating micronutrient deficiencies decreases the consumption of non-food
items (Young, 2011, p.109). In South African women low calcium intakes were also
identified in the South African Demographic and Health Survey (Steyn et al., 2006).

99
Several studies as far back as the 1960s and 1970s have investigated the effect of
soil on mineral absorption. Clay in Turkey has been shown to decrease iron
absorption in humans (Arcasoy et al., 1978; Cavdar & Arcasoy1983; Minnich et al.,
1968). In South Africa, iron absorption also decreased from 17.4% to 5% after soil
consumption (Sayers et al., 1974). Calabash chalk in Nigeria and Undongo
geophagic materials in Kenya were investigated and showed the soils were not a
good source of minerals, especially iron (Abrahams et al., 2013). Hooda et al. (2004)
also share the view of Abrahams et al. (2013) that geophagia can potentially reduce
the absorption of micronutrients such as iron, copper and zinc.
The significant difference in blood iron levels between the two groups in the current
study may indicate that an interaction between iron status and the practice of
geophagia exists. A possible mechanism is that the intestinal mucosa is covered
with the soil substances which decreases the absorption of iron (Young, 2009, p.73)
especially the whitish soil rich in kaolin which was commonly eaten by this sample.
The mean platelet counts of participants in this study were normal in both the
geophagia- and control group. In general, a normal platelet count indicates that
bleeding is not present in an individual, which eliminate bleeding as a possible cause
of iron deficiency in this study (Kuku et al., 2009).
As mentioned, indicators of iron status in women practicing and not practicing
geophagia yielded important differences. These differences were confirmed when
parameters of iron status were clustered to represent overall iron status. This will be
discussed in a later section.
6.4.2.2 Vitamin intake of geophagia- and control groups
The intake of some vitamins of the geophagia group tended to be lower than that of
the control group in the current study. The participants with geophagia, had a lower
mean intake of vitamin A than the control group (G= 1078.8mg; C = 1731.0mg)
(p=0.005), but vitamin A intake was still higher than the estimated average
requirement (EAR) in both groups.

100
The prevalence of vitamin A deficiency in South Africa has decreased by 50% among
females of reproductive age, since vitamin A supplementation (2002) and food
fortification (2003) was implemented in South Africa (SANHANES-1, 2013). Vitamin
A deficiency has a direct effect on iron utilization and the prevalence of anaemia
(Gallagher, 2012, p. 60) and thus it is an important parameter to investigate.
Because both the geophagia and control groups showed an intake of vitamin A that
was higher than the EAR, it is unlikely that the iron deficiency seen in the geophagia
group was associated with vitamin A deficiency. It is important to mention, however
that blood values of vitamin A status were not determined.
Significant differences in the intake of certain other nutrients were also observed in
the two groups. Although the intake of niacin (p=0.002) and riboflavin (p=0.003)
differed significantly between the two groups, participants in both groups had intakes
of niacin and riboflavin that were higher than the EAR. Intakes of vitamin D (G =
5.1mg; C = 5.8mg) and folate (G = 233.2mg; C = 282.6mg) were, however, lower
than the EAR. Similarly, folate intake of pregnant women in Ghana with or without
pica did not meet the daily requirements (Koryo-Dabrah et al., 2012). Intakes of
vitamins E and C of the two groups did not differ significantly (p=0.34; p= 0.02,
respectively), but mean intake of vitamin C in the geophagia group were lower than
the EAR, a finding that was also reported in South African women that participated in
the most recent South African Demographic and Health Survey (Steyn et al., 2006)
These findings suggest that low intakes of folate and vitamin C are not limited to
women with pica, but are associated with South African women in general. Vitamin
C intake is of importance in the utilization of iron in the body (Gallagher, 2012: 88).
Thus, insufficient intake of vitamin C may also play a role in the development of iron
deficiency. In addition, iron deficiency may be exacerbated by insufficient intakes of
folate (Gallagher, 2012: 111).
To summarize, participants with geophagia had significantly lower dietary intakes of
vitamin A, niacin and riboflavin than the control group but these were still higher than
the EAR for those nutrients. Both groups had intakes below the EAR for vitamins D
and folate and vitamin C in the geophagia group. Deficiencies of these nutrients may
complicate iron deficiency, since nutrient-nutrient interactions are common.

101
6.5 Anthropometric nutritional status
There were no significant differences in BMI and weight circumference between the
geophagia- and control groups. These findings in the current study are similar to
those of other studies. Women with and without pica in Argentina also had similar
BMI (López et al., 2007a). In contrast, Baig-Ansari et al. (2008) found that non-
anaemic women in an urban community area in Pakistan had a higher BMI than
anaemic women who practiced pica.
The mean BMI of participants in both groups of the current study fell within the
overweight category of 25 - 30kg/m2 (Lysen & Israel 2012: 470; Thomas & Bishop,
2007: 853). This finding mirrors the female population of South Africa. The recent
SANHANES study reported a mean BMI of 28.9kg/m2 for women aged 25 – 34 years
(SANHANES-1, 2013). According to the International Obesity Task Force: Global
Burden of Disease Analyses 2002 as referred to by Goedecke et al. (2006: 66), the
mean BMI of South African women between the ages of 15 - 29 and 30 – 44 were
24.4 kg/m2 and 28.5 kg/m2 respectively. These findings seem to indicate that the
problem of overweight has not changed in the last ten years in South Africa and
suggest that a nutrition transition has developed in South Africa over an extended
period of time. Karl et al. (2009) found that obese women (n=207) have a lower risk
of iron deficiency, while overweight women are more likely to be iron deficient. In a
study by Qin et al. (2013) women with central obesity, which is indicated by waist
circumference of more than 88cm, were less likely to have anaemia. Overweight
and an increased intake of dietary fat were associated with an increased risk of
developing non-communicable diseases (WHO, 2003).
In the current study the mean waist circumference of both groups fell in the healthy
range of ≤0.88m (Hammond & Litchford, 2012, p. 169).
A waist-to-hip ratio (WHR) above 0.8m indicates an android fat distribution, and is
associated with a higher risk for cardiovascular disease and other lifestyle-associated
diseases (Lysen & Israel, 2012: 470). Although WHR is less widely used than waist
circumference on its own as a measure of health outcome, it was significantly
associated with the practice of geophagia in this study (OR: 0.353; CI: 0.126; 0.985).

102
These results seem to indicate that women with geophagia are less likely to have a
WHR in the android category.
In summary, BMI and waist circumference seem to be similar in women with and
without geophagia. However, WHR was significantly associated with geophagia, with
women with a high WHR being less likely to practice geophagia.
6.6 Activity levels
Globally low physical activity is an increasing public health concern (Vuori, 2004). A
sedentary lifestyle is an independent risk factor for obesity, Type 2 diabetes, heart
disease and dementia (Lӧvdén et al., 2013; O'Donovan et al., 2005). According to
Carter-Parker et al. (2012) physical activity levels are decreasing in America and
middle aged African American women have the lowest rates of physical activity. In
South Africa, low levels of physical activity are also prevalent in 43.4% of Black
African women (Stats, 2013). In a cross-sectional population study, Smit et al.
(2011) also found that 83% of black South African women (n=1357) between 30 and
60 years of age were inactive. Low activity levels were also characteristic of the
current study population as a whole, without any significant differences between the
two study groups. The low levels of physical activity of participants, together with
BMI in the overweight category could indicate that the participants are at risk of
developing lifestyle diseases (Raymond & Couch, 2012, p. 751).
6.7 Blood results (Pathology)
A number of abnormalities related to blood levels of micronutrients in persons
practicing pica have been reported in the literature. From this study also, it is evident
that the practice of pica induces a physiological response, which is measurable by
means of blood analyses. Case studies in women have reported an association
between hypokalemia and pica during pregnancy (McKenna, 2006; Ukaonu et al.,
2003). Hypernatremia has been reported in children (Kupiec et al., 2006; Shapiro &
Linas, 1985) and young women (Morgan et al., 2010) addicted to salt . Yet, results of

103
the current study indicated that participants in both the geophagia and control groups
had normal mean serum values for sodium (136 - 147.0 mmol/L), potassium (3.5 -
5.1 mmol/l) magnesium (2.3 - 2.6 mmol/l) and calcium (2.15 - 2.50 mmol/l). Young
(2011, p.113) concluded that not enough scientific evidence to confirm the
hypothesis that geophagic soil can provide enough calcium to prevent its deficiency.
In contrast to the listed micronutrients, the mean serum iron levels of the geophagia
group were significantly lower (p=0.000) when compared to that of the control group.
There was also a significant difference in the serum ferritin levels between the
geophagia and control group, with serum ferritin being significantly lower in the group
practicing geophagia (p=0.00). Serum transferrin and serum transferrin saturation
levels also differed significantly between the groups (p=0.00). The results of this
study identified these blood variables as the most important risk factors associated
with geophagia and this association will be discussed in more detail later in this
chapter in the section pertaining to iron status and geophagia.
6.8 Correlation between dietary intake and blood (pathology) results
Significant correlations between serum iron, -albumin and dietary fibre intake have
been documented in women practicing geophagia (Zimmerman et al., 2008;
Madhaven et al., 2004; Thane et al., 2003). This correlation between serum iron and
–albumin was confirmed in this study (Table 5.12), with a significant linear positive
correlation between serum iron and albumin levels (p=0.005), in the participants
practicing geophagia. Thus, if serum albumin levels were low, serum iron levels also
tended to be low. Serum-albumin is a recognised marker for protein status in
humans (Litchford, 2012: 419), which might explain the normal albumin levels in the
geophagia group who reported adequate protein intake. Although transferrin is also
an indication of protein status, low iron-levels increase transferrin levels, as shown in
the geophagia group. The increase in transferrin levels in the geophagia group is
evident of a negative iron balance or iron-deficiency.
104
In this study a significant correlation was also identified between serum albumin and -
calcium (p<0.001) and -phosphate levels (p=0.004). Low albumin levels are often
associated with low calcium- and phosphate levels, a finding that has been reported
in the literature (Peacock, 2010).
A significant correlation between dietary iron and energy intake (p<0.001) was
measured in both the geophagia and control group, with a higher dietary iron intake
being associated with higher energy intakes. As expected, low dietary intake of iron
was also associated with iron deficiency anaemia among Tunisian women practicing
pica (El Ati et al., 2008).
Insufficient food intake and the lack of resources to consume iron rich food is known
to contribute to risk for anaemia. In the current study, however, energy and total iron
intakes were adequate. Despite this, the geophagia group suffered from iron
deficiency. This would seem to indicate that dietary intake of iron was not the only
factor affecting iron status in women practicing geophagia.
6.9 Iron status and geophagia
The devastating effects of iron deficiency on human health have been well
documented (Beard, 2005; Algarin et al., 2003; Saloojee & Pettifor, 2001; Lozoff et
al., 2000). In addition to their own health, iron deficiency could also be detrimental
for the offspring of the geophagist (Lambert et al., 2013). Iron deficiency can also be
fatal in severely anaemic women suffering from post-partum haemorrhage and may
be harmful to the neurological development of the child (Lambert et al., 2013).
Despite the negative effects of iron deficiency on health, the relationship between
geophagia and iron deficiency is still not well understood. Geophagia has been
documented as both a cause (Chaushey et al., 2003; Reid, 1992) and consequence
(Antelman et al., 2000; Reid, 1992; Sayetta, 1986) of anaemia.
105
Iron status is determined by the amount of iron present in serum and red blood cells
(Hughes-Jones et al., 2004, p.57). Iron status is diagnosed by investigating a
number of parameters, including haemoglobin, serum iron, ferritin, transferrin and
transferrin saturation. Iron deficiency is diagnosed by evaluating indicators such as
ferritin, transferrin and transferrin saturation to determine the presence and degree of
anaemia (Mogongoa et al., 2011). When iron stores are adequately depleted to
reduce erythropoiesis then iron deficiency anaemia develops (Bermejo & García-
López, 2009). Low haemoglobin levels alone are, however, not a reliable indicator for
iron deficiency anaemia, because of the fluctuation of haemoglobin levels in healthy
individuals. One cannot differentiate iron deficiency anaemia from other anaemia's
based on haemoglobin levels alone, because low haemoglobin levels are only
recognizable in a very late stage of iron deficiency.
A strong association between geophagia and iron deficiency was identified in non-
pregnant women in this study. This association has been confirmed in other studies
(George and Abiodun, 2012; Louw et al., 2007). Similar results have also been
reported in 79 women from European and non-European countries of which 44%
practiced pica (Kettaneh et al., 2005). Fifty six percent of pregnant women attending
antenatal clinics in Coastal Kenya with geophagia also had low iron levels (Geissler
et al., 1998). Argentinian women practicing geophagia were also more likely to suffer
from iron deficiency anaemia (López et al., 2007a). In pregnant women of Eastern
Sudan soil eating was significantly associated with anaemia (Adam et al., 2005).
Similar results have been reported in Tanzania (Young et al., 2010a; Kawai et al.,
2009). In another study in the Eastern Cape, South Africa, undertaken amongst
pregnant women from three primary health care antenatal clinics, the prevalence of
anaemia was significant higher in pregnant women practicing geophagia when
compared to the group of pregnant women not practicing geophagia (George &
Abiodun, 2012).
In contrast with our findings and the mentioned other studies, no significant
difference was found in the prevalence of iron deficiency and iron deficiency anaemia
between women with pica (ice) and without pica in a study by Barton et al. (2010)
amongst women attending an oncology practice. Although no differences were found
in iron status (defined by both SF <45 pmol/L and TS <10%) amongst these women,

106
those with ice pica had lower haemoglobin and ferritin levels than those without ice
pica. It is important to acknowledge that cancer and cancer treatment could also
have impacted on these variables.
A significant association between geophagic pica and haemoglobin levels were found
among pregnant women practicing pica in Zanzibar, Tanzania (Young et al., 2010a).
These findings concur with those of a study by Janbabai et al. (2011) where 68.1% of
partcipants (260) practiced one or more form of pica associated with low
haemoglobin and ferritin levels. These findings were also confirmed in pregnant and
non-pregnant European and non-European women where pica was also associated
with iron deficiency anaemia (Kettaneh et al., 2005). In the East Anatolian Province
in Turkey, 50% of anaemic women (n=823) had a transferrin saturation of less than
10% and 11.2% of the sample population practiced pica (Karaoglu et al., 2010).
Malenganisho et al. (2007) also found an association between geophagia and
haemoglobin.
Low ferritin levels were significantly associated with the practice of geophagia in the
current study. Low ferritin levels are considered to be an indicator of iron deficiency
without anaemia. Serum ferritin is not influenced by the current intake of iron, but
rather by the size of the total body iron stores in the absence of inflammation
(Umbreit, 2005). A serum ferritin level of less than 12µg/l indicates that iron stores
are depleted (Thomas et al., 2013). Malenganisho et al. (2007) also confirmed an
association between geophagy and serum ferritin levels.
Serum transferrin levels are often increased in iron deficiency (Hughes-Jones et al.,
2004, p.59), but this parameter does not confirm iron deficiency anaemia when used
in isolation. In the current study serum transferrin levels were increased, together
with serum transferrin saturation of less than 16%. Transferrin saturation indicates
the percentage of transferrin that transports iron in the body to macrophages for
production of erythroblasts in the bone marrow (Hoffbrand et al., 2011: 37).

107
AlQuaiz et al. (2013) also found that women between aged 15 – 49 years with a high
BMI have a 5% less chance of developing anaemia than those of a low BMI. In
contrast no significant association could be established between BMI and iron
deficiency (p<0.001) in this study, but it is suspected that the sample size was too
small for the association to reach significance.
As discussed in the previous sections, the practice of geophagia had an impact on
more than one of the measured variables of iron status in this study. As a result, it
was decided to cluster the variables and to investigate whether it is possible to build
a model that could be used to predict whether an individual in this cohort of subjects,
practices geophagia or not by means of regression analysis. The following variables
that significantly contributed to the model were included in the final equation: history
of practicing geophagia, haemoglobin, serum-iron, -ferritin and –transferrin, haem
iron, non-haem iron and transferrin saturation. These factors differed significantly
between the geophagia- and control group and significantly affected the iron status of
the geophagists in the current study.
In the current study low serum ferritin levels, an increase in serum transferrin levels
and serum transferrin saturation less than 16% in the geopyhagia group confirmed
the presence of iron deficiency. Mogongoa et al. (2011) also found in a sub-sample
(17) of this study low haemoglobin, transferrin saturation, ferritin and transferrin
levels in the geophagia group (n=12). From this, it is evident the practice of
geophagia affects not only one single blood parameter, but rather a cluster of
parameters, that collectively and comprehensively represent individual iron status
(Table 5.17). Single blood parameters can diagnose iron deficiency which occurs
before anaemia, while the cluster of parameters can diagnose iron deficiency
anaemia (Huges-Jones et al., 2004: 17).
Significant predictors of pica identified by Barton et al. (2010) were mean corpuscular
volume (MCV), platelet count and red blood cell distribution width (RDW). . In the
current study additional significant predictors were associated with geophagia and
iron deficiency, but whether iron deficiency develops because of geophagia or iron
deficiency causes women to start practicing geophagia is still unclear. In this study
108
the effect of geophagia on a cluster of blood parameters, indicates the significant
effect of soil eating on iron homeostasis. Risk factors associated with iron deficiency
are thus also linked to the likelihood of practicing geophagia.
6.10 Knowledge and habits related to geophagia in participants practicing
geophagia and knowledge of geophagia in the control group before
intervention
In participants practicing geophagia, the frequency of consuming soil was high at
more than once a day (43.9%) and once a day (34.1%). This indicates an intake of
about 30g or more than 30g per day (sample of soil shown was 30g and participants
needed to indicate frequency accordingly). This intake is similar to that reported in
other studies related to geophagia in Africa where daily intake of 30 – 40g of soil
have been reported (Luoba et al., 2005; Saathoff et al., 2002; Geissler et al., 1998).
A study among Argentine women with pica showed that the majority of the women
ate soil on a daily basis, with the prevalence of 39.5% during the first semester of
pregnancy (López et al., 2012).
The urge or craving for soil was the main reason for geophagists (97.6%) to practice
geophagia in the current study, which is also documented as one of the main
reasons among pregnant women practicing geophagia in Tamil Nadu, India (Placek
& Hagen, 2013). In a study reported by Songca et al. (2010: 221) amongst women
aged 17 – 60 years that practiced geophagia in South Africa, the researchers also
found that the Sotho and Pedi speaking geophagists craving for soil was the main
reason to ingest soil on a daily basis. These cravings are reported to be more
prevalent during certain stages of the life cycle when an increased amount of
nutrients are required such as during pregnancy (Reeuwijk et al., 2013; Njiru et al.,
2011; Young et al., 2010a; Kawai et al., 2009). Golden et al. (2012), have however,
reported that the prevalence of geophagia was not higher in pregnant women than in
non-pregnant women that ate soil during a population based survey in Madagascar.
This prevalence of geophagia in pregnancy is often underestimated. Research from
Latin America indicated a prevalence of 23.2% among pregnant Argentine mothers

109
(López et al., 2012). In Africa the prevalence of pica in pregnancy was reported to be
higher, with 50% of women in Nigeria, 63% in Tanzania and 74% in Kenya practicing
pica (Sule & Madugu, 2001; Nyaruhucha, 2009; Luoba et al., 2004, Ngozi, 2008). In
contrast Mikkelsen et al. (2006) found that only 0.02% of Danish women practiced
pica. Although geophagists in the present study were not pregnant at the time of
the study, more than 50% reported that they have practiced geophagia during
pregnancy (53.7%). Our findings also suggest that cultural beliefs (Table 5.14), soil
colour and texture are important factors influencing the choice of clay (Ekosse et al.,
2011). Whitish soil was the preferred substance consumed by geophagists in the
current study. Similar findings were reported by Songca et al. (2010) for different
ethnic groups namely Pedis, Zulus, Tswana and Sothos in South Africa who also
preferred eating white clay. These whitish clays are commonly linked with kaolinite,
which is well known for the treatment of diarrhoea and other stomach ailments (Bisi-
Johnson et al., 2013). In other studies geophagists preferred red soils, (Songca et al.
(2010), which is believed to be richer in iron, although not bioavailable for human
consumption.
6.11 The knowledge and habits related to geophagia after the intervention
The aim of the intervention was to increase the participants' knowledge of geophagia
and to address risks and problems identified during the baseline phase of the study.
In general, a number of habits related to geophagia changed after the intervention.
In this study the nutrition education programme was effective in improving some
aspects of the participant's knowledge and practices related to geophagia, while
others remained unchanged.
Some questions were asked before and after the intervention to evaluate any
changes in the practice of geophagia and to determine if the brochure was
understood. Almost forty percent of the participants in the geophagia group reported
that they had stopped consuming soil after the intervention. The frequency of eating
soil more than once per day also declined after the intervention from 42.9% to only
25% in the geophagia group. After the intervention, most participants in both the
geophagia- and control group (100% and 66.7% respectively) agreed that pregnant
110
women and children should not consume soil because it can be harmful to them;
whereas before the intervention more than 50% of participants in the geophagia
group thought that soil was not harmful when consumed by human beings. These
changes in geophagic habits and knowledge indicate that the information given to the
participants in the three month intervention period was sufficient to motivate them to
make the decision to stop eating soil because it may be detrimental to their health.
The geophagia- and control group were adequately informed about the South African
Food Based Dietary Guidelines (FBDGs) during the intervention. Questions were
asked only after the intervention period to evaluate if the participants were familiar
with the content of the brochure and to see if they applied any of this information.
This was evidenced by the fact that participants answered more than 80% of the
questions related to the FBDGs correctly after the intervention. Participants were
asked to agree or disagree on statements regarding the FBDG. Both groups agreed
totally (100%) to the following: eat a variety of foods; starchy foods should form the
basis of most meals; eat plenty of fruit and vegetables per day and that salt and fat
should be used sparingly.
A minority of participants, (approximately one third in both groups), incorrectly
answered that chicken, fish, milk, eggs cannot be eaten daily. The same was seen
for dry beans, peas, lentils and soya. In a cross-sectional study amongst 333 women
in KwaZulu-Natal, South Africa, only 7% of participants indicated that legumes do not
have to be eaten because they can be substituted with meat (Love et al., 2008).
The majority of participants (G = 78.5%; C = 73%) indicated that they changed at
least one habit related to the FBDGs after reading the brochure. When what
geophagists asked can do to improve their health after the intervention, only 7% was
not sure. Love et al. (2008) also found that participants recognized the importance
of applying the FBDGs to improve their health status.
In summary the results showed that the aim of the intervention to change the
knowledge and practices related to geophagia were achieved as far as most aspects
are concerned. The geophagists either stopped eating soil or decreased their daily
consumption of soil and acknowledge that geophagia can be harmful to health.

111
These changes in geophagic habits may reduce the chances of developing iron
deficiency or experiencing the side-effects related to the ingestion of soil.

112
Chapter 7
CONCLUSIONS AND RECOMMENDATIONS
In this chapter the conclusions and recommendations related to the study are
discussed.
7.1 CONCLUSIONS
The overall aim of this study was to determine the nutritional status and risk factors
associated with geophagia amongst women in QwaQwa. The results showed how
the practice of geophagia can predispose those that practice it, to metabolic
disturbances, especially those that relate to iron metabolism. The results also
confirmed a link between socio-demographic factors and the practice of geophagia.
7.1.1 Socio-demographic status
The results confirmed that geophagia occurs most commonly amongst women of
child-bearing age. A significant association was found between earning a wage and
the practice of geophagia, with women that were wage earners being less likely to
practice geophagia. In addition women who owned a refrigerator were also less
likely to practice geophagia. These finding seem to suggest that socio-economic
status might be a predictor of the practice of geophagia and that it is more likely for
someone from a low socio-economic status to practice geophagia.
7.1.2 Dietary intake
No significant differences in energy and macronutrient intakes were found between
women practicing geophagia and those not practicing geophagia, with both groups
exhibiting a high energy intake. This may imply that hunger is not the factor
motivating women to practice geophagia.

113
However, for some micronutrients, intakes were different in women practicing
geophagia when compared to those not practicing geophagia. Intake of vitamin A
differed significantly between the experimental group and control group, with the
geophagia group having a significantly lower intake of vitamin A when compared to
the control group. Vitamin A deficiency is also linked to iron deficiency anaemia.
However, in this study, both groups had intakes above the EAR, suggesting that
vitamin A intake was unlikely to be related to iron deficiency in this sample.
The intake of niacin and riboflavin also differed significantly between the geophagia-
and control group, with the intake of these nutrients being significantly lower in the
group practicing geophagia. However, for these two nutrients, intakes were also
above the EAR for both groups.
For all women, the intake of vitamins D, C, and folate were lower than the EAR, but
did not differ significantly between the groups. It is unknown whether the inadequate
intake of these nutrients were related to geophagia (the control group also had low
intakes), but it is known that both folate and vitamin C metabolism are associated
with anaemia. In addition vitamin C intake improves absorption of non-haem iron,
thus indirectly affecting iron status.
7.1.3 Anthropometric nutritional status and activity levels
No significant differences occurred with regards to BMI and waist circumference
between the geophagia and control groups. However, a significant association was
identified between WHR and the practice of geophagia, with women that practice
geophagia being less likely to have a high WHR.
Mean BMI of participants in both groups fell in the overweight category, while levels
of physical activity were low. These finding are similar to other studies that show that
overweight and a sedentary lifestyle are becoming more common in African women
of a low socio-economic background, undergoing a lifestyle and nutrition transition.
Such a pattern increases the risk of developing lifestyle diseases. Both lifestyle
diseases and iron deficiency may have a detrimental impact on overall health of

114
those that practice geophagia. It is important to note, however, that no significant
associations could be found between BMI and iron deficiency (defined by the cluster
of variables in Table 5. 13 in this sample.
7.1.4 The relationship between geophagia and iron status
In the current study energy and dietary iron intakes were adequate, proposing that
dietary iron intake was not the only aspect influencing iron status in the geophagia
group, and that other factors such as the absorption of iron may be affected by the
practice of geophagia.
A major finding of this study was the difference in iron status of participants practicing
geophagia and the control group, with women that practiced geophagia being more
likely to suffer from iron deficiency and iron deficiency anaemia. A logistic regression
analysis indicated that a cluster of variables including haemoglobin, ferritin,
transferrin and transferrin saturation are all affected by the practice of geophagia.
Significantly lower haemoglobin and ferritin levels with elevated transferrin levels
were prevalent in the group with geophagia compared to the control group. These
results implicate that geophagia is a risk factor for iron deficiency and iron deficiency
anaemia, confirmed by the aforementioned cluster of metabolic indicators. The
precise mechanism that leads to this association requires clarification and further
investigation.
7.1.5 Knowledge and habits related to geophagia and the impact of the
intervention
The main reason for practicing geophagia in this sample was the urge or craving for
soil, which compares well with the findings of other studies undertaken in South
Africa. The intervention that was developed and applied in this research group was
successful in significantly reducing the number of participants that practiced
geophagia or the frequency of practicing geophagia. The intervention was also able
to bring about an improvement in the knowledge related to geophagia, indicating that
habits can be changed when knowledge is improved and that health can benefit.

115
To conclude, the results of this study showed that an interaction of factors, including
social, nutritional, cultural and physiological may influence the iron status of women
with geophagia. All of these need to be taken into account when planning
interventions to address the risk factors associated with geophagia.
7.2 RECOMMENDATIONS
Recommendations related to practice and research is made in the following section.
7.2.1 Implications for practice
The factors associated with geophagis in this study could be developed into a
possible tool to predict the likelihood of practicing geophagia. From the results
obtained in the regression analysis the factors that were strongly associated with
geophagia included being a wage earner, owning a refrigerator, a waist hip ratio
below 0.8 and a cluster of pathological factors that collectively represent a state of
iron deficiency.
The significantly strong association between geophagia and iron deficiency
emphasizes the importance of identifying the practice of geophagia in women,
especially during their child bearing years. From a public heaIth perspective it is
therefore recommended that pregnant women should be screened for the practice of
geophagia during their visits to clinics at primary health care centres in South Africa.
Kawai et al. (2009) and Young et al. (2010c) have also recommended that pregnant
women should be educated about the risk of developing iron deficiency anaemia and
other dangers related to the practice of geophagia. Health professionals involved in
counselling pregnant women should enquire about the practice of pica, especially
when iron deficiency is present (Kettaneh et al., 2005; Horner et al., 1991).
Dieticians may play a vital role in identifying pica during dietary counselling.
For those women who do practice geophagia, a relevant and applicable health
education programme needs to be made available. The results of this study have
indicated that health education can make a difference to the knowledge and habits
related to geophagia in such groups. Such programmes should focus on the impact

116
of geophagia on health; importance of healthy dietary practices to improve or prevent
iron deficiency; and discouraging women from practicing pica. The brochure that
was developed as an educational tool during the intervention period provides an
example of material that can successfully be applied in health education programmes
to both persons practicing geophagia and the broad public. Koryo-Dabrah et al.
(2012) also emphasized the importance of nutrition education to improve knowledge
of food and nutrition and therefore empower women to make better food choices to
improve their health during pregnancy and all other lifecycles.
In terms of the general public, health education related to geophagia and the impact
thereof on human health is necessary (El Ati et al., 2008). This can contribute to an
improved awareness of the condition and its implications for especially pregnant
women and children. George & Abiodun (2012) have documented the need and
importance of health promotion in the community at large. Health and nutrition
programmes have also been identified by Sedehi et al. (2013) as an important
method for combatting micronutrient deficiency in women of childbearing age.
7.2.2 Future Research
Further research related to both prevalence of geophagia and the impact of the
intervention on the practice of geopagia is recommended in larger sample groups.
The prevalence of geophagia in South Africa is still largely unknown. In view of the
major implications of this practice on health outcomes, a better understanding of the
prevalence, degree and mechanisms of the condition as well as the impact thereof
on various indicators is necessary.
The current study could be extended to investigate the effect of the intervention used
in the current study in other population groups and areas. The impact of the
intervention on other indicators, such as blood variables that were not included in this
study, could also be determined. An assessment of micronutrient status that goes
beyond dietary intake would be valuable.

117
Further research to establish whether the practice of geophagia is a cause of iron-
deficiency, or whether it is the consequence thereof, would give a clearer view on
how to recognise and treat the condition. Louw et al. (2007) suggest further research
related to the pathophysiological mechanisms involved, while Placek & Hagen (2013)
emphasise the importance of further investigation to determine the aetiology of
geophagia.
This study was the first in South Africa to investigate nutritional status and risk factors
associated with geophagia, and can be used as reference for further investigation.
7.3 BENEFITS OF THE RESEARCH AND IMPLEMENTATION OF THE FINDINGS
The importance of this study was to determine the relationship between geophagia
and nutritional status in women. The study is of great value to the population of
QwaQwa as well as the population of South Africa. To the best of our knowledge this
is the first study in this area to investigate the nutritional status and risk factors
associated with geophagia in South Africa.
Individual benefits included an assessment of health and nutritional status of
participants. All participants had access to the results and assessments were
done free of charge. In cases where health problems were identified, participants
were referred to relevant health professionals. Individuals have also benefited
from the nutrition education programme and counselling.
National benefits: A report related to the risks of geophagia and possible
recommendations to address these risks will be submitted to the Department of
Health after completion of the thesis;
Community: Feedback regarding the results and recommendations was given to
the community which formed part of the intervention process.
118
REFERENCES
Abbey L and Lombard JA. 1973. The etiological factors and clinical implications of
pica: report of a case. Journal of the American Dental Association, 87: 885-887.
Abrahams PW and Parsons J A. 1997. Geophagy in the Tropics: An appraisal of
three geophagical materials. Environmental Geochemistry and Health, 19(1):19-22.
Abrahams PW and Parsons JA 1996. Geophagy in the Tropics: A Literature Review.
The Geographical Journal, 162:63-72.
Abrahams PW, Davies TC, Solomon AO, Trow AJ, Wragg J. 2013. Human
geophagia, calabash chalk and undongo: mineral element nutritional implications.
PLoS One, 8((1), Available from:
http://www.ncbi.nlm.nih.gov/pmc/articles/PMC3538771/ Accessed Sept 15, 2013.
Abrahams PW. 1997. Geophagy (soil consumption) and iron supplementation in
Uganda. Tropical Medicine and International Health, 2: 617-623.
Abrahams PW. 2012. Involuntary soil ingestion and geophagia: A source and sink
of minerals, nutrients and potentially harmful elements to consumers of earth
materials. Applied Geochemistry, 27(5): 954-968.
Abrahams PW. 2002. Soils: their implications to human health. The Science of
Total Environment, 27(291): 1-32.
Adam I, Khamis AH and Elbashir MI. 2005. Prevalence and risk factors for anaemia
in pregnant women of eastern Sudan. Transaction of the Royal Society of Tropical
Medicne and Hygiene, 99(1): 739-743.
119
Ahmed S, Abduullahi H and Adam I. 2012. Practice of pica among pregnant women
in Khartoum, Sudan. International Journal of Gynaecology & Obstetrics, 118(1): 71-
71.
Aita V McIlvain H Backer E McVea K and Crabtree B. 2005. Patient-centered care
and communication in primary care practice: what is involved? Patient Education
and Counseling, 58(3): 296-304.
Alberti, K.G.M.M., Zimmet, P. and Shaw, J. 2006. Metabolic syndrome – a new
world-wide definition. A consensus statement from the International Diabetes
Federation. Diabetetic Medicine, 23(5): 476.
Algarin C, Peirano P, Garrido M, Pizarro F, Lozoff B. 2003. Iron deficiency anemia
in infancy: long-lasting effects on auditory and visual system functioning. Pediatric
Research, 52(2): 217-213.
Al-kanhal MA and Bani IA. 1995. Food habits during pregnancy among Saudi
women. International Journal for Vitamin and Nutrition Research, 65(3): 206-210.
Allport S. 2002. Women who eat Dirt. Gastrononomica: The Journal of Food and
Culture, 2(2):28-37
Alquaiz AM, Mohamed AG, Tawfik AM, Alsharif A, Shaikh SA, Al Mane H, Aldiris A,
Kazi A, Hammad D. 2013. Prevalence of Anemia and Associated Factors in Child
Bearing Bge Women in Riyadh, Saudi Arabia. Journal of Nutrition Metabolism.
[Internet] Available from: http://www.hindawi.com/journals/jnme/2013/636585/.
Accessed Dec 15, 2013.
American Psychiatric Association. 2000. DSM-IV-TR: Diagnostic and Statistical
Manual of Mental Disorders, Text Revision. American Psychiatric Press, pp. 103-
105.

120
Ammerman AS, Lindquist CH, Lohr KN and Hersey J. 2002. The efficacy of
behavioral interventions to modify dietary fat and fruit and vegetables intake: a review
of the evidence. Preventative Medicine, 35(1): 25-41.
Antelman G, Msamanga, GI, Spiegelman D, Urassa EJ, Narh R, Hunter DJ, Fawzi
WW. 2000. Nutritional factors and infectious disease contribute to anemia among
pregnant women with human immunodeficiency virus in Tanzania. Journal of
Nutrition, 130(8): 1950 -1957.
Arbiter EA and Black D. 1991. Pica and iron deficiency anaemia. Child Care Health
Development, 17(4):31-34.
Arcasoy A, Cavdar AO & Babacan E. 1978. Decreased iron and zinc absorption in
Turkish children with iron deficiency and geophagia. Acta haematology, 60 (2): 76-
84.
Ashworth M, Hirdes JP, Martin L. 2009. The social and recreational characteristics
of adults with intellectual disability and pica living in institutions. Research in
Developmental Disabilities, 30: 512-520.
Aufreiter S, Hancock RGV, Mahaney WC, Stambolic-Robb A, Sanmugadas K.
1997. Geochemistry and mineralogy of soils eaten by humans. International Journal
of Food Science and Nutrition, 48(5): 293-305.
Baig-Ansari N, Badruddin SH, Karmaliani R., Harris H, Jehan I, Pasha O, Moss N,
McClure EM, Goldenberg RL. 2008. Anemia prevalence and risk factors in pregnant
women in an urban area of Pakistan. Food and Nutrition Bulletin, 29(2)|; 132 – 139.
Baker DW, Parker RM, Williams MV, Clark WS and Nurss J. 1997. The relationship
of patient reading ability to self-reported health and use of health services. American
Journal of Public Health, 87(6): 1027-1030.

121
Bandura A. 2004. Health Promotion by Social Cognitive Means. Health Education
and Behavior, 31(2): 143-164.
Barker 2005. Tooth wear as a result of pica. British Dental Journal, 199(5): 272-273.
Baronowski T. 2006. Crisis and chaos in behavioral nutrition and physical activity.
International Journal of Behavioral Nutrition and Physical Activity, 3(27). Published
online 2006 September 14. Available from:
http://www.ncbi.nlm.nih.gov/pmc/articles/PMC1574342/ Accessed November 20th,
2012
Barton JC, Barton JC, Bertoli LF. 2010. Pica associated with iron deficiency or
depletion: clinical and laboratory correlates in 262 non-pregnant adult outpatients.
BMC Blood Disorders, 10(9):1-11.
Bastable SB. 2008. Literacy in the Client Adult Population. In Nurse as Educator:
Principles of Teaching and Learning for Nursing Practice. Jones and Bartlett
Publishers.
Bateson, E.M. and Lebroy, T. 1978. Clay eating by Aboriginals of the Northern
Territory. Medical Journal of Australia, 25(1): 1–3.
Beard JL, Hendricks MK, Perez EM, Murray-Kolb LE, Berg A, Vernon-Feagans L,
Irlam J, Isaacs W, Sive A, Tomlinson M. 2005. Maternal iron deficiency anemia
affects postpartum emotions and cognition. Journal of Nutrition, 135(2): 267-272.
Bergaya F and Lagaly G. 2006. General introduction: clays, clay minerals, and clay
science. In Handbook of Clay Science. Edited by F Bergaya, BKG Theng and G
Lagaly. Developments in Clay Science, vol.1, Elsevier Ltd, Amsterdam.
Bermejo F and Garcia-López S. 2009. A guide to diagnosis of iron deficiency
anemia in digestive diseases. World Journal of Gastroenterology, 15 (37): 4638-
4643.

122
Bethony J, Brooker S, Albonico M, Loukas A, Diemert D and Hotez PJ. 2006. Soil-
transmitted helminth infections: ascariasis, trichuriasis and hookworm. The Lancet,
367(9521): 1521-1532.
Bhatia MS and Gupta R. 2009. Pica responding to SSRI: and OPD spectrum
disorder? The World journal of biology psychiatry, 10(4): 936-938.
Bhorat H and van der Westhuizen C. 2008. “Economic growth, poverty and
inequality in South Africa. The first decade of democracy” Paper commissioned for
Presidency: 1-43. Available from:
http://npconline.co.za/MediaLib/Downloads/Home/Tabs/Diagnostic/Economy2/Econo
mic%20Growth,%20Poverty%20and%20Inequality%20in%20South%20Africa%20Th
e%20%20First%20Decade%20of%20Democracy.pdf. Accessed Dec 10, 2013.
Bisi-Johnson MA, Obi CL and Ekosse GE. 2010. Microbiological and health related
perspectives of geophagia: An overview. African Journal of Biotechnology, 9(19):
5784-5791.
Brand CE, De Jager L and Ekosse GIE 2009. Possible health effects associated with
human geophagic practise: an overview. Medical Technology South Africa, 23(1):
11-13.
Bunell JE, Finkelman, RB, Centento JA and Selinus O. 2007. Medical Geology, a
globally emerging discipline. Geologica Acta, 5(3): 273-281.
Burgess, A, Bijlsma, M and Ismael C. 2009. In Community Nutrition: A Handbook
for Health and Development Workers. Oxford: Macmillan Education.
Bushara M, Elhassan EM, Ali NI, Osman E, Bakheit KH et al. 2010. Anaemia, Zinc
and Copper Deficiencies Among Pregnant Women in Central Sudan. Biologial Trace
Elemements Research, 137(3): 255-261.
Callahan GN. 2003. Eating Dirt. Emerging Infectious Diseases, 9(8): 1016-1021.

123
Canadian Public Health Association. 2008. Annual Conference Public Health in
Canada: Reducing Health Inequalities through Evidence & Action. June 2008 Halifax,
Nova Scotia. Available from:
http://www.cpha.ca/en/conferences/archives/conf2008.aspx
Cantarero L. 2009. From Edible to Inedible: social construction, family socialisation
and upbringing. In Consuming the Inedible, Neglected Dimensions of Food Choice.
Edited by C MacClancy, J Henry and H Macbeth. 2nd Ed. Oxford: 205-214.
Carter-Parker K, Edwards KA and McCleary-Jones V. 2012. Correlates of physical
activity and the theory of planned behaviour between African American women who
are physically active and those who are not. Journal of the Association of Black
Nursing Faculty in Higher Education Inc , 23(3): 51-58.
Cavdar, AO, Arcasoy A, Cin S, Babacon E and Gözdasoğlu S. 1983. Geophagia in
Turkey: iron and zinc deficiency, iron and zinc absorption studies and response to
treatment with zinc in geophagia cases. Progress in Clinical and Biological Research,
129:71 -97.
Centres for Disease Control and Prevention, 2009a. Available from:
http://www.cdc.gov/StD/stats09/default.htm. Accessed Jun 10, 2012.
Champion VL and Skinner CS. 2008. The Health Belief Model. In Health Behavior
and Health Education. Edited by K Glanz, BK Rimer, KV Viswanath. 4th Ed. San
Francisco: Jossey-Bass Inc.
Chapmon-Navokaofski. 2012. Education and Counseling: Behavioral Change. IN
In Krause’s Food and and the Nutrition Care Process. Edited by LK Mahan, S Escott-
Stump and JL Raymond. 13th Ed. Philadelphia: WB Saunders Company: 325-336.

124
Charney P and Escott-Stump S. 2008. Overview of Nutrition Diagnosis and
Intervention. In Krause’s Food and and the Nutrition Care Process. Edited by LK
Mahan, S Escott-Stump and JL Raymond. 13th Ed. Philadelphia: WB Saunders
Company: 253-272.
Charney, P. 2012. Clinical: Water, Electrolytes, and Acid-Base Balance. In
Krause’s Food and the Nutrition Care Process. Edited by. LM Mahan, S Escott-
Stump, and JL Raymond. 13th ed. Philadelphia, Pennsylvania: W.B Saunders
Company, pp. 178 – 186.
Chaushey PG, Dryer MJ and Gledhill RE. 2003. Hypokalemic myopathy due to
ingestion of earth. Journal of Neurology, 250 (11):114-115.
Chumkwuma MC, Ekejindu IM, Agakoba NR, Ezeagwuna DA, Anaghalu IC and
Nwosu DC. 2009. The Prevalence and Risk Factors of Geohelminth Infections
among Primary School Children in Ebenebe Town, Amambra State, Nigeria. Middle-
East Journal of Scientific Research, 4(3): 211- 215.
Coles T, Schall M, Hediger M and Scholl T. 1995. Pica during pregnancy-
associations with dietary intake, serum micronutrients and pregnancy outcome.
Federation of American Societies for Experimental Biology Journal, 9(3): A443.
Contento IR. 2008. Nutrition education: linking research, theory, and practice. Asia
Pacific Journal of Clinical Nutrition. 17(Suppl 1): 176-179.
Cooksey N. 1995. Pica and olfactory craving of pregnancy. How deep are the
Secrets? Birth, 22:129-137.
Corbett R, Ryan C & Weinrich S. 2003. Pica in pregnancy: does it affect pregnancy
outcomes? The American Journal of Maternal Child Nursing (MCN), 28(3): 190-191.

125
Corey G. 2009. Cognitive Behavior Therapy. In Theory and Practice of Counseling
and Psychotherapy. 8th Edition. Brooks, Cole.
Danford D, Smith, JC and Huber A. 1982. Pica and mineral status in the mentally
retarded. American Journal of Clinical Nutrition, 35: 958-967.
Danford DE. 1982. Pica and Nutrition. Annual Review of Nutrition, 2: 303-322.
Davidson B, Worrall L, Hickson L. 2003. Identifying the communication activities of
older people with aphasia: Evidence from naturalistic observation. Aphasiology,
17(3): 243-264.
Davis TC, Fredrickson DD, Arnold C, Murphy PW, Herbst M, Bocchini JA. 1998. A
polio immunization pamphlet with increased appeal and simplified language does not
improve comprehension to an acceptable level. Patient Education and Counseling,
33(1): 25-37.
Department of Health. 2003. South African Guidelines for Healthy Eating.
Directorate: Nutrition, Pretoria. Available from:
http://www.kznhealth.gov.za/fbdgs.pdf Accessed April 10, 2009.
Diamond J. 1998. “Eat Dirt.” Discover, 19: 70 – 75.
Dickins D and Ford RN. 1942. Geophagy (Dirt eating) among Mississipi Negro
School children. American Sociological Review, 7(1): 59-65.
Dickinson N, Gulliver J, MacPherson G, Atkinson J, Rankin J, Cummings M, Nisbet
Z, Hursthouse A, Taylor A, Robertson C, Burghardt W. 2009. A Framework to
explore micronutrient deficiency in maternal and child health in Malawi, South Africa.
Environmental Health, 8(Suppl 1):S13.
126
Diouf SB, Camara MG, Sall I, Diagne O, Ndiaye O et al. 2000. Protein-energy
malnutrition in children less than five years old in rural zone in Senegal (Khombole).
Dakar Medical, 45:48-50.
Djemal S, Darbar UR, Hemmings KW. 1998. Case report: toot wear associated with
an unusual habit. The European Journal of Prosthodontics Restorative Dentistry, 6:
29-32.
Dodd JL. 2012. Nutrition in the Adult Years. In Krause’s Food and the Nutrition
Care Process. Edited by LK Mahan, S Escott-Stump and JL Raymond. 13th Ed.
Philadelphia: WB Saunders Company.
Dominy N, Davoust E, Minekus M. 2004. Adaptive function of soil consumption: an
in vitro study modelling the human stomach and small intestine. Journal of
Experimental Biology, 207(2):319-324.
Dreyer MJ, Chauskev, PG, Gledhill RF. 2004. Biochemical investigations in
geophagia. Journal of the Royal Society of Medicine, 97(1):48. Edited by Margetts
MB, Kearney JB and Arab L. Wiley-Blackwell, Oxford, UK.
Edwards CH, Johnson AA, Knight EM, Oyemade UJ, Cole OE et al. 1994. Pica in
an Urban Environment. Journal of Nutrition, 124(Suppl 6): 954S-962S.
Edwards CH, McSwain H, Haire S. 1954. Odd dietary practices of women. Journal
of the American Dietetic Association, 30(10): 976-981.
Ekosse EG and Junbam ND. 2010. Geophagic clay: Their mineralogy, chemistry
and possible human health effects. African Journal of Biotechnology, 9(40):6755-
6757.
Ekosse GE, Ngole VM, Longo-Mbenza B. 2011. Mineralogical and geochemical
aspects of geophagic clayey soils from the Democratic Republic of Congo.
International Journal of Physical Sciences, 31: 7302-7313.

127
Ekosse, G, De Jager L,Ngole, VM. 2008. X-ray Study of Geophagic Soils and Clays
form Southern Africa (abstract). In Ekosse, G., de Jager, L. (Eds). Books of
abstracts, 1st International Conference Geophagia in Southern Africa, Central
University of Technology, Bloemfontein, Free State, South Africa, 22 - 24 October
2008: 24 – 25.
El Ati J, Lefèvre P, Béji C, Rayana CB, Gaigi S, Delpauch F. 2008. Aetiology factors
and perception of anaemia in Tunisian women of reproductive age. Public Health
Nutrition, 11(7): 729-736.
Ellis CR and Pataki C. 2012. Pica: eMedicine Available from: www.emedicine.com.
Accessed: Jan 2013
Ellis, CR and Schnoes CJ. 2006. Eating Disorder: Pica. eMedicine Available from:
www.emedicine.com Accessed: Oct 2012
Elmes M. 2002. Earth eating. Journal of the Royal Society of Medicine 95(5):274.
Erick M. 2012. Nutrition during pregnancy and lactation. In Krause’s Food and the
Nutrition Care Process. Edited by LK Mahan, S Escott-Stump and Raymond JL. 13th
Ed. Philadelphia: WB Saunders Company: 340 – 365.
Ferguson JH and Keaton AG. 1950. Studies of the diets of pregnant women in
Mississippi. The ingestion of clay and laundry starch. New Orleans Medical and
Surgical Journal, 102: 460-463.
Fey, MV. 2010. A short guide to the soils of South Africa, their distribution and
correlation with World Reference Base soil groups. 19th World Congress of Soil
Science, Soil Solutions for a Changing World
Brisbane, Australia. [Internet]. Avaialable from:
http://www.iuss.org/19th%20WCSS/Symposium/pdf/2503.pdf. Accessed, Jan 11,
2012.

128
Flohr C. 2003. Dirt, worms and atopic dermatitis. British Journal Dermatology,
148(5):871-877.
Food and Agriculture Organization. 1997. Nutrition education for the public.
Discussion papers of FAO expert consultation (Rome, Italy) FAO Food and Nutrition
paper 62. FAO United Nations, Rome.
Food and Agriculture Organization. 2005. The State of Food and Agriculture. Rome.
Italy. Available from: http://www.fao.org/docrep/008/a0050e/a0050e00.htm
Accessed October, 2013
França S, D'Ivernois JF, Marchand C, Haenni C, Ybarra J and Golay A. 2004.
Evaluation of nutritional education using concept mapping. Patient Education and
Counseling, 52 (2): 183-192.
Gallagher NL. 2012. Intake. The Nutrients and Their Metabolism. In Krause’s
Food and the Nutrition Care Process. Edited by LK Mahan, S Escott-Stump and JL
Raymond. 13th Ed. Philadelphia: WB Saunders Company: 340-365.
Galt F. 1872. Medical notes on the upper Amazon. American Journal of Medical
Sciences, 128: 395-417.
Garg M, Shaver MJ, and Easom A. 2004. Pica. An underappreciated cause of
electrolyte abnormatilies. Nephrology News and Issues, 18:28-29, 33.
Geissler PW, Prince RJ, Levene M, Poda C, Beckerleg SE, Muteni W and Shulman
CE. 1999. Perceptions of soil-eating and anaemia among pregnant women on the
Kenyan coast. Social Science and Medicine, 48(8):1069-1079.
Geissler PW, Shulman CE, Prince RJ, Mutemi W, Mnazi C, Friis H, Lowe B. 1998.
Geophagy, Iron Status and anaemia among pregnant women in the coast of Kenya.
Transactions of the Royal Society of Tropical Medicine and Hygiene, 92 (5):793-796.

129
Gelfand MC, Zarate A and Knepshield JH. 1975. Geophagia-Cause of life-
threatening hyperkalemia in patients with chronic renal failure. Journal of American
Medical Association, 234(7): 738-740.
George G and Abiodun A. 2012. Physiological Effects of Geophagy (Soil Eating)
with Reference to Iron Nutritional Status in Pregnant women: - A study in Selected
Antenatal Clinics in KSD Municipal Area of the Eastern Cape, South Africa. 3rd
International Conference on Biology, Environment and Chemistry. IPCBEE, 46: 96-
98.
George G and Ndip E. 2011. Prevalence of geophagia and its possible implications
to health – A study in rural South Africa. 2nd International Conference on
Environmental Science and Development, IPCBEE, 4.
Ghorbani H. 2008. Geophagia, a Soil- Environmental Related Disease. International
Meeting on Soil Fertility, Land Management and Agro climatology, Turkey, 957-967.
Gladfelter J, Einspruch B and Black B. 1960. The study of pica and food
preferences in a post-partum general hospital population. Texas reports on Biology
and Medicine, 18: 202-204.
Glanz K, Rimer BK and Lewis FM. 2002. Health Behavior and Health Education.
Theory, Research and Practice. 3rd Ed. San Fransisco: Wiley & Sons.
Glasgow, RE, Funnel, MM, Bonomi, AE, Davis, C, Becham, V and Wagner EH.
2002. Self-management aspects of the improving chronic illness care breakthrough
series: implementation with diabetes and health failure teams. Annals of Behavior
Medicine, 27: 80-87.
Glazier RH, Bajcar J, Kennie NR and Willson K. 2006. A systematic review of
interventions to improve diabetes care in socially disadvantaged populations.
Diabetes Care, 29(7): 1675-1688.

130
Glickman LT, Camara AO, NW and McCabe GP. 1999. Nematode intestinal
parasites of children in rural Guinea, Africa: Prevalence and relationship to
geophagia. International Journal of Epidemiology, 28:169-174.
Goedecke JH, Jennings CL, Lambert EV. Obesity in South Africa. 2006. In Chronic
Diseases of Lifestyle in South Africa: 1995-2005. Edited by K Steyn, J Fourie, N
Temple. Medical Research Council, South Africa.
Golden CD, Rasolofoniaina BJ, Benjamin R and Young SL. 2012. Pica and
amylophagy are common among Malagasy men, women and children. PLos One,
7(10). Available from:
http://www.plosone.org/article/info%3Adoi%2F10.1371%2Fjournal.pone.0047129.
Accessed Oct 10, 2013.
Gonyea J. 2007. Do You Know What Your Patients Are Eating? Nephrology
Nursing Journal, 34(2): 230-231.
Gonzalez R, De Medina FS, Martinez-Augustin O, Nieto A, Galvez J, Risco S et al.
2004. Anti-inflammatory effect of diosmectite in hapten-induced colitis in the rat.
British Journal of Pharmacology, 141: 951-960.
González-Turmo I. 2009. The concept of food and non-food. Perspectives from
Spain. In Consuming the Inedible. Neglected Dimensions of Food Choice. Edited
by J MacClancy, J Henry and H Macbeth. Berghahn Books: 43-52.
Guarino A, Bisceglia M, Castellucci G, Iacono G, Casali LG, Bruzzese E, Musetta A
and Greco L. 2001. Smectite in the treatment of acute diarrhea: A nationwide
randomised controlled study of the Italian Society of Paediatric Gastroenterology and
Hepatology (SIGEP) in collaboration with primary care paediatricians. SIGEP study
group for Smectite in Acute Diarrhea. Journal of Paediatric Gastroenterology and
Nutrition, 32(1): 71-75.
131
Halsted JA. 1968. Geophagia in man, its nature and nutritional effects. American
Journal of Clinical Nutrition, 21:1384-1393.
Hammond, KA and Litchford DM. 2012. Clinical: inflammation, Physical, and
Functional Assessments. In Krause’s Food and the Nutrition Care Process. Edited
by LK Mahan, S Escott-Stump and JL Raymond. 13th Ed. Philadelphia: WB
Saunders Company: 163-172.
Harnack L, Block G, Subar A, Lane S and Brand R. 1997. Association of cancer
prevention-related nutrition knowledge, beliefs, and attitudes to cancer prevention
dietary behavior. Journal of the American Dietetic Association, 97(9): 957-965.
Harries J and Hughes T. 1958. Enumerations of the “cravings” of some pregnant
women. British Medical Journal, 5: 39-40.
Harvey WJP, Dexter PB and Darton-Hill I. 2000. The Impact of consuming iron from
non-food sources on iron status in Developing countries. Public Health Nutrition,
3(4):375-383.
Haute Autorité de santé (HAS). 2008. How to produce an information brochure for
patients and users of the healthcare system. Department of Health, France: 1-40.
Available from: http://www.has-sante.fr/portail/upload/docs/application/pdf/2009-
10/how_to_produce_an_information_brochure_-_methodology_guide.pdf. Accessed
Dec 16, 2013.
Hawass NED, Alnozha MM and Kolawole T. 1987. Adult Geophagia- report of three
cases with review of the literature. Tropical and Geographical Medicine, 39:191-195.
Hawthorne T, Krygier J and Kwan MP. 2008. Mapping ambivalence: exploring the
geographies of community change and rails-to-trails development using photo-based
Q method and PPGIS. Geoforum, 9(2): 1058-1078.

132
Hayes SC, Strosahl K and Wilson KG. 1999. Acceptance and Commitment Therapy:
An experiential approach to behavior change. Association for Contextual Behavioral
Science. Guilford Press, New York. [Internet]. Available from:
http://contextualscience.org/hayes
Hippocrates: 1839. OevresComplètes d’ Hippocrate, Hakkert, Amsterdam.
Hochstein G. 1968. Pica: A Study on Medical and Anthropological Explanation. In
Essays on Medical Anthropology, Southern Anthropological Society Proceedings,
No. 1, University of Georgia, Press, Athens, USA.
Hoffbrand AV, Hershko C, Camaschella C. 2011. Iron metabolism, iron deficiency
and disorders of haem synthesis. In Essential Haematology. 6th Ed. Edited by AV
Hoffbrand, D Carovsky, EGD Tuddenham and AR Green. Wiley-Blackwell: 26-46.
Holli, B, Maillet J, Beto J, Calabrese R. 2009. Communication and education
skills for dietetics professionals, Baltimore: Lippincott Williams and Wilkins.
Hooda P and Henry J. 2009. Geophagia and Human Nutrition. In Consuming the
Inedible: Neglected Dimensions of food choice. Edited by J MacClancy, J Henry,
and H Macbeth. 1st ed. USA: Berghahn Books.
Hooda PS, Henry CJ, Seyoum, TA, Armstrong, LD, Fowler MB. 2004. The potential
impact of soil ingestion on human mineral nutrition. Science of the Total
Environment, 333:75-87.
Horner RD, Lackey CJ, Kolasa K, Warren K. 1991. Pica practices of pregnant
women. Journal of the American Dietetic Association, 91(1) 34 -38.
Houts AC, Loh GA, Fortner BV, Kallich JD. 2006. Patient and caregiver time burden
associated with anaemia treatment in different patient populations. Support Care
Cancer, 14(12): 1195-1204.

133
Huges-Jones NC, Wickramasingha SN, Hatton, CSR. 2004. Basic Haematology
Techniques and References Ranges. In Haematology. 8th Ed. Wiley-Blackwell.
Hunter BT. 2004. Soil and your health: healthy soil is vital to your health. Edited by
T Hirsch. North Bergen: Basic Health Publication Inc.
Hunter J.M. 1973. Geophagy in Africa and the United States: A culture–nutrition
hypothesis. Geographical review, vol. 63, pp. 170-195.
Hunter JM and de Kleine R. 1984. Geophagy in Central America. Geographical
Review, 74:157-169.
Hunter JM. 1993. Macroterme geophagy and pregnancy clays in southern Africa.
Journal of Cultural Geography, 14(1): 69-92.
Ioannou GN, Spector J, Scott K and Rockey DC. 2002. Prospective evaluation of a
clinical guideline for the diagnosis and management of iron deficiency anemia.
American Journal of Medicine. 113(4):281-287.
Institute of Medicine, 2004. [Internet] Available from: http://www.iom.edu/
Institute of Medicine. 2002. Food and Nutrition Board: Dietary Reference intakes for
energy, carbohydrates, fiber, fat, protein and amino acids (macronutrients),
Washington, National Academics Press.
International Federation of Red Cross and Red Crescent Societies. 2011.
Project/programme monitoring and evaluation (M&E) guide. Geneva. [Internet].
Available from: https://www.ifrc.org/Global/Publications/monitoring/IFRC-ME-Guide-
8-2011.pdf. Accessed Jun 15, 2012.
Ioannou GN, Spector J, Scott K, Rockey DC. 2002. Prospective evaluation of a
clinical guideline for the diagnosis and management of iron deficiency anemia.
American Journal of Medicine. 113(4):281-287.

134
Ireton-Jones CS. 2012. Intake: Energy. In Krause’s Food and and the Nutrition
Care Process. Edited by LK Mahan, S Escott-Stump and JL Raymond. 13th Ed.
Philadelphia: WB Saunders Company: 19-29.
Izugbara CO. 2003. The Cultural context of geophagy among pregnant and lactating
Ngwa women of south eastern Nigeria. The African Anthropologist, 10(2):180-199.
Janbabai G, Azadeh, Hossein, Farazmandfar T, Sayadi S, Sharifian R, Taghipour M.
2011. The Prevalence of Pica and the Associated Factors in Women with Iron
Deficiency Anemia. Journal of Mazandaran University Medical Science, 21(85): 214-
26.
Johns T and Duquette M. 1991a. Detoxification and mineral supplementation as
functions of geophagy. American Journal of Clinical Nutrition, 53: 448-456.
Johns T and Duquette M. 1991b. Traditional detoxification of acorn bread with clay.
Ecology of Food and Nutrition, 25: 221-228.
Johns T. 1986. Detoxification function of geophagy and domestication of the potato.
Journal of Chemical Ecology, 12: 635-646.
Johns T. 1996. The origins of human diet and medicine, Tucson: University of
Arizona.
Johnson CD, Shynett B, Dosch R, Paulson R. 2007. An unusual case of tooth loss,
abrasion, and erosion. General Dentistry, 55(5): 445-448.
Johnston RA. 2011. All things Medieval. An Encyclopedia of the Medieval World.
Oxford England.

135
Karaoglu L, Pehlivan E, Egri M, Deprem C, Gunes G, Genc MF, Temel I. 2010. The
prevalence of nutritional anemia in pregnancy in an east Anatolian province, Turkey.
BMC Public Health, 10:329.
Karimi MR, Kadivar R, Yarmohammadi H. 2002. Assessment of the prevalence of
iron deficiency anemia, by serum ferritin, in pregnant women of Southern Iran.
Medical Science Monitor, 8: CR448-492.
Karl JP, Lieberman HR, Cable SJ, Williams KW, Glickman EL, Young AJ, McClung
JP. 2009. Poor iron status is not associated with overweight or over fat in non-
obese pre-menopausal women. Journal of the American College of Nutrition, 28(1):
37-42.
Katz J. 2008. National Geopgraphic News. Haitians resort to eating dirt. [Internet]
Available at http://news.nationalgeophrahic.com/news/2008/01/080130-AP-hait-
eatin.html. Accessed Aug, 15, 2011.
Kawai K, Saathoff E, Antelmann G, Msamanga G and Fawzi WW. 2009. Geophagy
(Soil-eating) in relation to anemia and helminth infection among HIV-infected
pregnant women in Tanzania. American Journal of Tropical Medicine and Hygiene,
80: 36 – 43.
Keith L, Evenhouse H and Webster A. 1968. Amylophagia during pregnancy.
Obstetrics and Gynecology, 32:415-418.
Kettaneh A, Eclache V, Fain O, Sontag C, Uzan M. et al. 2005. Pica and food
craving in patients with iron-deficiency anemia: A case-control study in France.
American Journal of Medicine, 118:185-188.
Key TJ, Jr, Horger, EO, 3rd and Miller JM, Jr. 1982. Geophagia as a cause of
maternal death. Obstetrics and Gynaecology, 60(4): 525-526.

136
Khan DA, Ansasri WM and Khan FA. 2011. Synergistic effects of iron deficiency
and lead exposure on blood lead levels in children. World Journal of Paeatrics, 7(2):
150-154.
Khan NZ, Ferdous S, Islam R, Sultana A, Durkin M and McConachie H. 2009.
Behaviour problems in young children in rural Bangladesh. Journal of Tropical
Paediatrics, 55(3):177-182.
Khan Y and Tisman G. 2010. Pica in iron deficiency: a case series. Journal of
Medical Case Reports, Mar 12, 4:86.
Khanum MP and Umapathy P. 1976. A survey of food habits and beliefs of pregnant
and lactating mothers in Mysore city. Indian Journal of Nutrition and Dietetics, 12:
208-217.
Kim HK and Nelson LS. 2012. Are You What You Eat? Pica in Pregnancy.
Emergency Medicine. Available from: www.emedmag.com. Accessed Dec 15, 2013.
Kinell HG. 1985. Pica as a feature of autism. British Journal of Psychiatry, 147:80-
82.
Knudsen JW. 2004. Akulu udongo (eart eating habits): A social and cultural
pratice among Chagga women on the slope of Mount Kilimanjaro. Indilinga:
African Journal of Indigenous Knowledge Systems, 1(1):19-26.
Kools M, Van De Wiel MW, Ruiter RA and Kok G. 2006. Pictures and text in
instructions for medical devices: effects on recall and actual performance. Patient
Education, 64: 104-111.
Koryo-Dabrah A, Nti CA and Adanu R. 2012. Dietary practices and Nutrient Intakes
of Pregnant women in Accra, Ghana. Current Research Journal Biological Sciences
4(4): 358-365.

137
Kreps GL, Sparks L. 2008. Meeting the health literacy needs of immigrant
populations. Patient Education and Counceling, 71(3): 328-32.
Kuku I, Kaya E, Yologlu S, Gokdeniz R and Baydin A. 2009. Platelet counts in adults
with iron deficiency anemia. Platelets, 20(6): 401-405.
Kupiec TC, Raj V and Vu N. 2006. Pharmacogenomics for the Forensic Toxicologist.
Journal of Analytical Toxicology, 30(2): 65-72.
Lacey EP. 1990. Broadening the perspective of pica: literature review. Public Health
Report, 105(1): 29-35.
Lakudzala D and Khonje JJ. 2011. Nutritive potential of some “edible” soils in
Blantyre city, Malawi. Malawi Medical Journal, 23(2):38-42.
Lambert V, Pouget K, Basurko C, Boukhari R, Dallah F and Carles G. 2013.
[Geophagy and pregnancy: Current knowledgement and management. Clinical
experiences of an obstetrical department in French Giuiana.] Journal of
Gynecolology and Obstetrics Biology Reproduction. Available from
http://www.ncbi.nlm.nih.gov/pubmed/23871612 Accessed Nov 05, 2013.
Landman JP and Hall JS. 1992. Dietary habits and knowledge of folklore of pregnant
Jamaican women. Ecology of Food and Nutrition, 12: 203-210.
Langenhoven ML, Conradie PJ, Wolmarans P and Faber M. 1991a. MRC Food
Quantities Manual, 2nd Edition. Parow: Medical Research Council: 213.
Langenhoven ML, Kruger M, Gouws E and Faber M. 1991b. MRC Food
Composition Tables. 3rd Edition. Parow: Medical Research Council: 245.
Lanzkowsky P. 1959. Investigation into the aetiology and treatment of pica.
Archives of Disease in Childhood, 34: 140-148.

138
Laufer B. 1930. Geophagy: Anthropological Series. Field Museum of Natural
History, Chicago, 18(2): 99-198.
Lee RD and Niemann DC. 2007. Nutritional assessment. 4th Ed. New York:
McGraw-Hill.
Leonard A, Droy-Lefaix MT and Allen A. 1994. Pepsin hydrolysis of the adherent
mucus barrier and subsequent gastric mucosal damage in the rat: Effect of
diosmectite and 16,16 dimethyl prostaglandin E2. Gastroeterologie Clinique et
Bioloque, 18: 609-616.
Levy BR, Slade M, Kunkel S and Kasl S. 2002. Longevity increased by positive self-
perceptions of aging. Journal of Personality and Social Psychology, 83: 261-270.
Lewis SM. 2006. Reference ranges and normal values. Dacie and Lewis Practical
Haematology. 10th Edition. Churchill Livingstone.
Lino M, Basiotis PP, Anand RS and Variyam JN. 1998. The diet quality of
Americans. Strong links with nutrition knowledge. Nutrition/Insights, 7: 1-2.
Litchford MD. 2012. Clinical: Biochemical Assessment. In Krause’s Food and the
Nutrition Care Process. Edited by LM Mahan, S Escott-Stump, and JL Raymond.
13th ed. Philadelphia, Pennsylvania: W.B Saunders Company: 191 – 202.
López L, Langini S, Fleichman S, Portela M and Ortega Soler, C. 2001. Iron
deficiency in pregnant women with pica. Journal of the American Dietetic Society, 9:
A-104.
López LB, de Portela, ML. and Soler CR. 2007a. Nutrient intake in women with
pagophagia and other forms of pica during the pregnancy. Nutrition Hospital,
22(6):641-647.

139
López LB, Langini SH, Pita de Portela ML. 2007b. Maternal iron status and neonatal
outcomes in women with pica during pregnancy. International Journal of
Gynaecology and Obstetrics, 98(2): 151 – 152.
López LB, Marigual M, Martín N, Mallorga M, Villagrán E, Zadorozne ME, Martín De
Portela ML, Ortega Soler CR. 2012. Characteristics of pica practice during
pregnancy in a sample of Argentine woman. Journal of Obstetrics & Gynecology,
32(2):150-153.
López LB, Ortega Soler CR and de Portela ML. 2004. Pica during pregnancy: a
frequently underestimated problem. Archivos Latinoamericanos Nutrición, 54(1):17-
24.
Louw VJ, Du Preez P, Malan A, Van Deventer L, Van Wyk D and Joubert, G. 2007.
Pica and food craving in adult patients with iron deficiency in Bloemfontein, South
Africa. South African Medical Journal, 97(11):1069-1071.
Lövdén M, Xu W, Wang HX. 2013. Lifestyle change and the prevention of cognitive
decline and dementia|: what is the evidence? Current opinion in Psychiatry, 26(3):
239-243.
Love P, Maunder EMW and Green JM. 2008. Are South African women willing and
able to apply the new food-based dietary guidelines? Lessons for nutrition educators.
South African Journal of Clinical Nutrition, 21(2): 17-24.
Love PV. 2002. Developing and assessing the appropriateness of the preliminary
food-based dietary guidelines for South Africans. PhD thesis. URI:
http://hdl.handle.net/10413/9422
Lozoff B, Beard J, Fleichman S, Connor J, Felt B, Georgieff M, Schallert T. 2006.
Long –Lasting Neural and Behavioural Effects of Iron Deficiency in Infancy. Nutrition
Reviews, 64: S72-S91.

140
Lozoff B, Jimenez E and Smith J. 2000. Double burden of iron deficiency in infancy
and low socio-economic status: a longitudinal analysis of cognitive test scores to 19
years. Archives of Pediatric and Addolescent Medicine, 160(11): 1608-113.
Luoba A, Geissler P, Estambale J, Ouma J, Alusala D et al. 2005. Earth-eating and
reinfection with intestinal helminthes among pregnant and lactating women in
western Kenya. Tropical Medicine and International Health, 10:220-227.
Luoba AI, Geissler PW, Estambale B, Ouma JH, Magnussen P, Alusala D, Ayah R,
Mwaniki D and Friis H. 2004. Geophagy among pregnant and lactating women in
Bondo District,western Kenya. Transactions of the Royal Society for Tropical
Medicine and Hygiene, 98(12):734-741.
Lysen LK and Israel DA. 2012. Nutrition in Weight management. In Krause’s Food
and the Nutrition Care Process. Edited by LK Mahan, S Escott-Stump and JL
Raymond. 13th Ed. Philadelphia: WB Saunders Company: 462-484.
MacClancy J and Macbeth H. 2004. Introduction: How to do Anthropologies of
Food. In Reaching Food Habits. Methods and problems. Edited by H Macbeth and
J MacClancy. Oxford: Berghahn Books.
MacClancy J, Macbeth H and Henry J. 2009. Introduction: Considering the inedible,
consuming the ineffable. In Consuming the Inedible: neglected Dimensions of Food
Choice. Edited by J MacClancy, H Macbeth and J Henry. Oxford: Berghahn Books:
1-16.
MacIntyre UE, Kruger HS, Venter CS, Vorster HH. 2002. Dietary intakes of an
African population in different stages of transition in the North West Province, South
Africa: The THUSA study. Nutrition Research, 22:230-256.
MacIntyre UE, Venter CS and Vorster HH. 2001b. A culture-sensitive- quantitative
food frequency questionnaire used in an urban African population: Relative

141
validation by 7 days weighed records and biomarkers. Public Health Nutrition,
4(1):63-71.
MacIntyre UE, Venter CS, Vorster HH, Steyn HS. 2001a. A combination of statistical
methods for the analysis of the relative validation data of the quantitative food
frequency questionnaire used in the THUSA study. Transition, Health and
Urbanisation in South Africa. Public Health Nutrition, 4(1):45-51.
Madhavan Nair K, Bhaskaram P, Balakrishna N, Ravinder P and Sesikeran B. 2004.
Response of haemoglobin, serum ferritin and serum transferrin, receptor during iron
supplementation in pregnancy: a prospective study. Nutrition, 20(10): 596-899.
Mahaney WC, Milner MW, Hs M, Hancock R, Aufreiter S, Reich M and Wink M.
2000. Mineral and Chemical analysis of soils eaten by humans in Indonesia.
International Journal of Environmental Health Research, 10: 93-109.
Malenganisho W, Magnussen P, Vennervald BJ, Krarup H, Kaestel P et al. 2007.
Intake of alcoholic beverages is a predictor of iron status and haemoglobin in adult
Tanzanians. Journal of Nutrition, 137: 2140-2146.
Mansfield F. 1977. Investigation of pica in Pitt Country, North Carolina. MS thesis,
East Caroline University, Greenville.
Margetts MB. 2004. An overview of Public Health Nutrition. In Public
HealthNutrition.
Maupetit. 1911. Le géophagisme au Laos Siamois. Bulletin de la Société medico-
chirurgicale de l’Indochine, :176-181.
McIntyre LL, Blacher J and Baker BL. 2006. Transition to school: Adaption in young
child with and without developmental delays. Journal of Intellectual Disability
Research, 50(5):349-361.
142
McKenna D. 2006. Myopathy, hypokalaemia and pica (geophagia) in pregnancy.
The Ulster Medical Journal, 75(2): 159 – 160.
McLeod SA. 2007. Skinner - Operant Conditioning. Available from:
http://www.simplypsychology.org/operant-conditioning.html
Medical Research Council – Technical Report. Tygerberg, W Cape: MRC, 2006: 65-
79.
Mensah FO, Twumasi P, Amenawonyo XK, Larbie C and Jnr AK. 2010. Pica
practice among pregnant women in the Kumasi metropolis of Ghana. International
Health, vol. 2, no. 4, pp. 282-286.
Messer E. 2009. Food Definitions and Boundaries. Eating Constrains and Human
Identities. In Consuming the Inedible: Neglected Dimensions of Food Choice.
Edited by J MacClancy, H Macbeth and J Henry. Oxford: Berghahn Books York: 53-
68.
Meyer W Moore C and Viljoen H. 2003. Personology: From individual to ecosystem.
3rd Edition. Heineman.
Mikkelsen TB, Andersen AM and Olsen SF. 2006. Pica in pregnancy in a privileged
population: Myth or reality. Acta Obstetricia et Gynecologica Scandinavica,
85(10):1265-1266.
Miller WI. 1998. Anatomía Del Aco, Taurus, Madrid. Miller WR and Rollnick S.
2012. Meeting in the middle : motivational interviewing en self-determination theory.
International Journal of Behavioral, Nutritional and Physical Activity, 9(25).
Available from: http://www.ncbi.nlm.nih.gov/pmc/articles/PMC3310779/ . Accessed
Dec 15, 2012.

143
Miller WR and Rollnick S. 2012. Meeting in the middle: motivationaol interviewing
and self-determinination theory. International Journal of Behavioral Nutrition and
Physical Activity 2012, 9:25. Available from: http://www.ijbnpa.org/content/9/1/25.
Accessed Dec 13, 2012.
Minnich V, Okcuoglu A, Tarcon Y, Arcasoy S, Cin S, Yorukogklu O, Renda F,
Demiraq B. 1968. Pica in Turkey. II. Effect of clay upon iron absorption. American
Journal of Clinical Nutrition, 21: 78-86.
Mitchell ML and Courtney M. 2005. Improving transfer from the intensive care unit:
the development, implementation and evaluation of a brochure based on Knowles’
Adult Learning Theory. International Journal of Nursing Practice, 11(6): 257-268.
Mogongoa LF, Brand CE, de Jager L and Ekosse GE. 2011. Hematological Status
of QwaQwa women who Ingest Clays. South Africa Medical Technology, 25(1):33-
37.
Moore DF and Sears DA. 1994. Pica and iron deficiency, and the medical history.
American Journal of Medicine, 97:633-635.
Morel-Fatio A and Tobler A. 1896. Corner Barro. In Mélanges de philologie romane
dédiés à Carl Wahlund à l’occasion du cinquantième anniversaire de sa naissance.
Macon: Protat Frères, Imprimeurs, pp. 41 – 49.
Morgan JF, Ahene P and Lacey JH. 2010. Salinophagia in anorexia nervosa: case
reports. International Journal of Eating Disorders, 43(2):190-192.
Morowati- Sharifabad MA, Rouhani Tonekaboni R and Baghianimoghadam MH.
2007. Predictors of Self-Care Behaviors among Diabetic Patients Referred to Yazd
Diabetes Research Centre Based on Extended Health Belief Model. The Journal of
Shahied Sadoughi University of Medical Sciences, 15(3): 85 – 96.

144
Mortazavi Z and Mohammadi M. 2010. Prevalence of pica in pregnant women
referred to health centers in Zahedan, Iran (2002 – 2003). African Journal of Food
Science, 4(10):642-645.
Murray D H, Holben DH, & Raymond JL. 2012. Food-Nutrient Delivery: Planning the
Diet with Cultural Competency. In Krause’s Food and and the Nutrition Care Process
Edited by LK Mahan, S Escott-Stump and JL Raymond. 13th Ed. Philadelphia: WB
Saunders Company: 274-285.
Nakamine A. 2004. ABX Pentra user manual. Product no. RAB080FA. Montpellier,
Horiba Group: 2-13.
Narkeviciute I, Rudzeviciene O, Leviniene G, Mociskiene K and Eidukevicius R.
2002. Management of Luthuanian children’s acute diarrhoea with Gastrolit solution
and dioctahedral smectite. European Journal of Gastroenterology and Hepatology,
14:419-424.
National Work Group on Literacy and Health. 1998. Communicating with patients
who have limited literacy skills. Report of the National Work Group on Literacy and
Health. Journal of Family Practice, 46(2): 168-76. Available from:
http://www.ncbi.nlm.nih.gov/pubmed/9487325 June, 2013
Nchito M, Geissler PW, Mubila L, Friss H and Olsen A. 2004. Effects of iron and
multi-micronutrient supplementation on geophagy: a two-by-two factorial study
among Zambian schoolchildren in Lusaka. Transactions of the Royal Society of
Tropical Medicine and Hygiene, 98(4): 218-227.
Nelson M. 2000. Methods and validity of dietary assessment. In Human Nutrition
and Dietetics. Edited by JS Garrow, WPT James, Ralph A. 10th Ed. Harcourt
Publishers, Limited, Edinburgh, UK: 311-331.

145
Ngole VM, Ekosse GE, de Jager L and Songca, SP. 2010. Physicochemical
characteristics of geophagic clayey soils from South Africa and Swaziland. African
Journal of Biotechnology, 9(36): 5929 – 5937.
Ngozi PO. 2008. Pica practices of pregnant women in Nairobi, Kenya. East African
Medical Journal, 85(2):72-79.
Nicoletti A. 2003. Pica when least expected it. Journal of paediatric and Adolescent
Gynecology, 16(3): 173-174.
Njiru H, Elchalal U, Paltiel O. 2011. Geophagy during pregnancy in Africa: A
literature review. Obsteterics and Gynecology Survey, 66(7):452-459.
Nojilana B, Norman R, Dhansay MA, Labadarios D, van Stuijvenberg ME, and
Bradshaw D. 2007. South African Comparative Risk Assessment Collaborating
Group. Estimating the burden of disease attributable to iron deficiency anaemia in
South Africa in 2000. South African Medical Journal, 97(8):741-746.
Noordman J, van der Weijden T, van Dulmen S. 2012. Communication-related
behaviour change techniques used in face-to-face lifestyle interventions in primary
care|: a systematic review of literature. Patient Education and Counseling, 89(2):
227-244.
Nyaruhucha CN. 2009. Food cravings, aversions and pica among pregnant women
in Dar es Salaam, Tanzania. Tanzania Journal of Health Research, 11(1): 29-34.
O, Donovon G, Kearney EM, Nevill AM, Woolf MK, Bird SF. 2005. The effect of 24
weeks of moderate- or high-intensity exercise on insulin resistance. European
Journal of Applied Physiology, 95(5-6): 522-528.
Okon JJ. 2011. Role of Non-Verbal Communication in Education. Mediterranean
Journal of Social Sciences, 2(5): 35-40.
146
O’Rourke DE, Qionn JG, Nicholson JO, Gibson HH. 1967. Geophagia during
pregnancy. Obstetrics and Gynaecology, 29:581-584.
Osman AK. 1985. Dietary practices and aversions during pregnancy and lactation
among Sudanese women. Journal of Tropical Paediatrics, vol. 31, pp. 16 – 20.
Parker R, Gazmararian J. 2003. Health literacy: essential for health communication.
Journal of Health Communication, 8:S116-118.
Parker W, Steyn NP, Levitt NS and Lombard CJ. 2012. Health promotions services
for patients having non-communicable diseases: Feedback from patients and health
care providers in Cape Town, South Africa. BMC Public Health, 12(503): Available
from: http://www.biomedcentral.com/1471-2458/12/503. Accessed April 10, 2013.
Parry-Jones B and Parry-Jones W. 1992. Pica: symptom of eating disorder? A
historical assessment. British Journal of Psychiatry, 160:341-354.
Parry-Jones B. 1992. Pagophagia, or compulsive ice consumption: a historical
perspective. Psychological Medicine, 22:561-571.
Patil CL. 2012. Appetite Sensations in Pregnancy among Agropastoral Women in
Rural Tanzania. Ecology of Food and Nutrition, 51(5):431-443.
Peacock, M. 2010. Calcium Metabolism in Health and Disease. Clinical Journal of
the American Society of Nephrology, 5: S23-S30.
Pereira AA and Sarnak MJ. 2003. Anemia as a risk factor for cardiovascular
disease. Kidney International, 64(87): S32-S39.
Peter G. 2011. Geophagia in Swaziland: Habits and Characteristics of Geophagic
Individuals. An Innovative Perspective on the Role and Clays and Clay Minerals and
Geophagia on Economic Development. In Book of abstracts, 1st International
conference on Human and Enzootic Geophagia, 22nd -24th October, 2008, e-books.

147
Placek CD and Hagen EH. 2013. A Test of Three Hypotheses of Pica and
Amylophagy Among Pregnant Women In Tamil Nadu, India. American Journal of
Human Biology, 25: 803 – 813.
Popkin BM and Gordon-Larsen P. 2004. The nutrition transition: worldwide obesity
dynamics and their determinants. International Journal of Obesity and Related
Metabolic Disordorders, Suppl 3: S2-S9.
Posner LB, Mccottry CM, Posner AC. 1957. Pregnancy craving and pica.
Obstetrics and Gynaecology, 9:270-272.
Poy MS, Weisstaub A, Iglesias C, Fernández S, Portela ML, López LB. 2012. Pica
diagnosis during pregnancy and micronutrient deficiency in Argentine women.
Nutrition Hospitalaria, 27(3):922-928.
Prasad AS, Halsted JA and Nadimi M. 1961. Syndrome of iron deficiency anemia,
hepatosplenomegaly, hypogonadism, dwardism and geophagia. American Journal of
Medicine, 31:532-546.
Prasad AS. 2001. Recognition of zinc-deficiency syndrome. Nutrition, 17: 67 – 69.
Prentice A. 2007. Mining the depths: metabolic insights into mineral nutrition. The
Proceedings of the Nutrition Society, 66(4): 512-521.
Puoane T, Steyn K, Bradshaw D, Laubscher R, Fourie J, Lambert V, Mbananga N.
2002. ‘Obesity in South Africa: The South African demographic and health
survey’, Obesity Research, 10: 1038-1048.
Qin Y, Melse-Boonstra A, Pan X, Yuan B, Dai Y, Zhao J, Zimmerman MB, Kok FJ,
Zhou M, Shi Z. 2013. Anemia in relation to body mass index and waist
circumference among Chinese women. Nutrition Journal, 12(10): 1-3.

148
Rainville AJ. 1998. Pica practices of pregnant women are associated with lower
maternal haemoglobin level at delivery. Journal of the American Dietetic Association,
98:293-296.
Raymond JL and Couch SC. 2012. Medical Nutrition Therapy for Cardiovascular
Disease. In Krause’s Food and the Nutrition Care Process. Edited by LK Mahan, S
Escott-Stump and JL Raymond. 13th Ed. Philadelphia: WB Saunders Company: 743-
777.
Redmond EC and Griffith CJ. 2003. Consumer food handling in the home: A review
of food safety studies. Journal of Food Protection, 66(1): 130-161.
Reeuwijk NM, Talidda A, Malisch R, Kotz,A, Tritscher, Fiedler H, Zeilmaker MJ,
Kooijman M, Wienk KJH, Traag WA, Hoogenboom LAP, 2013. Dioxins
(polychlorinated dibenzo-p-dioxins and polychlorinated dibenzo-furans) in traditional
clay products used during pregnancy. Chemosphere, 90(5): 1678-1685.
Reid RM. 1992. Cultural and medical perspective on geophagia. Medical
Anthropology, 13:337-351.
Reilly C and Henry J. 2000. Geophagia: why do humans consume soil? Nutrition
Bulletin, 25(2):141-144.
Rose EA, Porcerelli JH and Neale AV. 2000. Pica: Common but Commonly
Missed. Journal of the American Board of Family Practice, 13(5):353-358.
Ryan, P. 2009. Integrated Theory of Health Behavior Change. Background and
Intervention Development. Clinical Nurse Specialist, 23(3): 161-172.
Saathoff E, Olsen A, Kvalsvig JD and Geissler PW. 2002. Geophagy and its
association with geohelminth infection in rural schoolchildren from northern KwaZulu-
Natal, South Africa. Transactions of the Royal Society for Tropical Medicine and
Hygiene, 96(5): 485-490.

149
Saathoff E., Olsen A, Kvalsvig JD and Appleton CC. 2004. Patterns of geohelminth
infection, impact of albeeendazole treatment and re-infection after treatment in
school children from rural KwaZulu-Natal, South Africa. Infectious Diseases, vol. 4,
pp. 27
Saeed A, Ahmed A, Ahmad A, Ali Z, Riaz M and Ismail T. 2013. Iron status of the
Pakistani population-current issues and strategies. Asia Pacific Journal of Clinical
Nutrition, 22(3):340-347.
Sage JC. 1962. The practice, incidence and effect of starch eating on Negro women
at Temple University Medical Centre. MS thesis, Temple University, Philadelphia.
Salerno T. 2001. Trotula Major: A medieval Compedium of Women’s Medicine.
University of Pennsylvania Press, Philadelphia.
Saloojee H and Pettifor JM. 2001. Iron deficiency and impaired child development.
British Medical Journal, 15 (323): 1377-1378.
SANHANES-1: Shisana O, Labadarios D, Rehle T, Simbayi L, Zuma K, Dhansay A,
Reddy P, Parker W, Hoosain E, Naidoo P, Hongoro C, Mchiza Z, Steyn NP, Dwane
N, Makoae M, Maluleke T, Ramlagan S, Zungu N, Evans MG, Jacobs L, Faber M, &
SANHANES-1 Team. 2013. South African National Health and Nutrition Examination
Survey (SANHANES-1). Cape Town: HSRC Press.
Sayers GD, Lipschitz D, Sayers M, Sefterl H, Bothwell T, Charlton R. 1974.
Relationship between pica and iron nutrition in Johannesburg Black adults. South
African Medical Journal, 48:1655-1660.
Sayetta RB. 1986. Pica: an overview. American Family Physician, 33(5):181-185.
Schwab EB and Axelson ML. 1984. Dietary changes of pregnant women:
Compulsions and modifications. Ecology of Food and Nutrition, 14:143-152.

150
Sedehi M, Behnampour N, Golalipour MJ. 2013. Deficiencies of the microelements,
folate and vitamin B12 in women of the child bearing ages in gorgan, northern iran.
Journal of Clinical and Diagnostic Research, 7(6): 1102 – 1104.
Shapiro MD and Linas SL. 1985. Sodium chloride pica secondary to iron-deficiency
anemia. American Journal of Kidney Diseases, 5(1): 67-8.
Sharifirad GH, Entezari MS, Kamran A, Azadbackht L. 2008. Effectiveness of
nutrition education to type II diabetic patients: Application of Health Belief Model.
Iranian Journal of Diabetes and Lipid Disorders, 4: 379-386.
Sharifirad GH, Hazabehie SM, Mohebie S, Rahaimi MA, Hasanzadeh A. 2006.
The effect of educational program based on Health Belief Model (HBM) on the foot
care by type 11 diabetic patients. Iranian Journal of Endocrinology and Metabolism,
3: 231-239.
Sharifirad GR, Tol A, Mohebi S, Matlabi M, Shanazi H, Shahsiah M. 2013. The
effectiveness of nutrition education program based on health belief model compared
with traditional training. Journal of Education and Health Promotion, 2: 1-5.
Shaughnessy M F. 2004. An interview with Anita Woolfolk: The educational
psychology of teacher efficacy. Educational Psychology Review, 16(2): 153-175.
Sheppard SC. 1998. Geophagy: who eats the soils and where do possible
contaminants go? Journal of Environmental Geology, 33:109-114.
Shikany JM, Bragg CS, Ritchie CS. 2009. Behaviour Theories Applied to Nutritional
Therapies for Chronic Diseases in Older Adults. In Nutrition and Health: Handbook
of Clinical Nutrition and Aging. Edited by CW Bales and CS Ritchie. 2ndEd. Humana
Press, a part of Springer Science, Business Media, LLC: 19-31.
Shivoga WA and Moturi WN. 2009. Geophagia as a risk factor for diarrhoea. J
Infect Developing Countries, 3(2):94-98.

151
Silk KJ, Sherry J, Winn B, Keesecker N, Horodynski MA, Sayir A. 2008. Increasing
nutrition literacy: testing the effectiveness of print, website, and game modalities.
Journal of Nutrition Education and Behaviour, 40: 3-10.
Simon SL. 1998. Soil ingestion by humans: a review of history, data and aetiology
with application to risk assessment of radioactively contaminated soil. Soil Physics,
74:647-672.
Simpson E, Mull J, Longley E, East J. 2000. Pica during pregnancy in low-income
women born in Mexico. Western Journal of Medicine, 173:20-24.
Sing D and Sing CF. 2010. Impact of Direct Soil Exposures form Airborne Dust and
Geophagy on Human Health. International Journal of Environmental Research and
Public Health, 7(3):1205-1223.
Singhi S, Ravishanker R, Singhi P, Nath R. 2003. Low plasma zinc and iron in pica.
Indian Journal of Pediatrics, 70:139-143.
Skinner HCW. 2007. The Earth, source of health and hazards: An introduction to
medical geology. Annual Review Earth Planet Science, 35:177-213.
Skinner, BF 1938. The Behavior of Organisms: An Experimental Analysis. New York:
Appleton-Century.
Smit M, Wilders CJ, Strydom GL. 2011. Physical activity and physical fitness
profiles of South African women. African Journal for Physical, Health Education,
Recreation and Dance (AJPHERD), 17(3): 450-461.
Smith B and Smitasiri S. 2005. A framework for nutrition education programmes.
[Internet] Available from: http://www.fao.org/docrep/t0807e/t0807e03.htm. Accessed
Dec 15, 2012.
152
Smith B, Rawlins B, Cordeiro MJAR, Hutchins MG.2000. The bioaccessibility of
essential and potentially toxic trace elements in tropical soils from Mukono District,
Uganda. Journal of the Geological Society, 157:855- 891.
Smulian J, Motiwala S, Sigman R. 1995. Pica in a rural obstetric population.
Southern Medical Journal, 88:1236-1240.
Snetselaar L. 2009. Communication Skills. In Nutrition counselling skills for nutrition
care process. Jones and Bartlett Publishers.
Snowdon CT. 1977. A nutritional basis for lead pica. Physiology Bahavior,
18(5):885-893.
Songca SP, Ngole V, Ekosse G, De Jager L. 2010. Demographic characteristics
associated with consumption of geophagic clays among ethnic groups in the Free
State and Limpopo provinces South Africa. Indilinga African Journal of Indigenous
Knowledge Systems, 9(1):110-123.
Spencer T. 2002. Dirt-eating persists in rural south, Newhouse News Service,
Available from www.newhouse.com/archive/storyicoi250.html. Accessed Dec 15
2012
Spencer, BR, Kleinman S, Wright DJ, Glynn SA, Rye DB, Kiss JE, Mast AE, Cable
RG. 2013. Restless legs syndrome, pica, iron status in blood donors. Transfusion,
53(8):1645-1652. [Internet] Available from 10.1111/trf.12260.
Starks PTB and Slabach BL. 2012. The Scoop on Eating Dirt. Scientific American,
00368733, 306(6). Available from: http://web.ebsocohost.com
Stats SA. 2013. Statistics South Africa. Available from:
http://beta2.statssa.gov.za/publications/P0302/P03022013.pdf. Accessed: Oct 10,
2013.
153
Stead LF, Perera R, Bullen C, Mant D, Lancaster T. 2008. Nicotine replacement
therapy for smoking cessation. Cochrane Database Syst Rev, 23(1): Available from:
http://www.ncbi.nlm.nih.gov/pubmed/18253970. Accessed Dec, 20, 2012
Stephenson LS, Holland CV, Ottesen EA. 2000. Controlling intestinal helminths while
eliminating lymphatic filariasis. Parasitology, 121(suppl. 1): S1-S1.
Steyn NP, Nel JH, Nantel G, Kennedy G, Labadarios D. 2006. Food variety and
dietary diversity scores in children: are they good indicators of dietary adequacy?
Public Health Nutrition, 9: 644-650.
Steyn NP, Nel JH, Parker W, Ayah R, Mbithe D. 2012. Urbanisation and the nutrition
transition: a comparison of diet and weight status of South African and Kenyan
women. Scandanavian Journal of Public Health, 40 (3): 229-238.
Stopler T and Weiner A. 2012. Medical Nutrition Therapy for Anemia. In Krause’s
Food and the Nutrition Care Process. Edited by KL Mahan, S Escott-Stump and JL
Raymond. 13th Ed. Philadelphia: WB Saunders Company: 725-739.
Sudilovsky J. 2007. Catholic News Service: Bethlehem’s Milk Grotto brings faith,
hope and sometimes babies. [Internet] Available from
www.catholicnews.com/data/stories/cns/0707062.htm. Accessed Sept 10, 2010.
Sudore RL, Yaffe K, Satterfield S, Schillinger D. 2006. Limited Literacy and Mortality
in the Elderly: The Health, Age, and Body Composition Study. Journal of General
Internal Medicine, 21(8): 806 – 812.
Sugita K. 2001. “Pica: pathogenesis and therapeutic approach”. Nippon Rinsho,
59(3):561-565.
Sule S and Madugu HN. 2001. Pica in pregnant women in Zaria, Nigeria. Niger
Journal of Medicine, 10: 25-27.

154
Sumbele IUN, Ngole VM, Ekosse GE. 2011. Health Risks Associated with Ingestion
of some Geophagia Soil from Eastern Cape Province, South Africa. Book of
conference: 2nd International Conference on Geophagia in South Africa.
Tandu-Umba N and Paluku M. 1988. Risque nutrionnel de la population obstetricale
aux cliniques universitaires de Kinshasa. Medicine et nutrition 24:178- 180.
Tayie F. 2004. Pica. Motivating Factors and Health Issues. African Journal of
Food, Agriculture, Nutrition and Development, vol. 4, no. 1. [Internet] Available from
http://www.bioline.org.br/request?nd04010 Accessed April 20, 2012
Tayie FAK and Lartey A. 1999. Pica practice among pregnant Ghanaians:
Relationship with infant birth weight and maternal haemoglobin level. Ghana Medical
Journal, 33:67-76.
Taylor SH. 1979. Prevalence of earth and laundry starch consumption during
pregnancy. MA thesis, University of Texas, Houston.
Thane CW, Bates CJ, Prentice A. 2003. Risk factors for low iron intake and poor
iron intakes in a national sample of British young people aged 4 – 18 years. Public
Health Nutrition, 6(5): 485-496.
Thomas B and Bishop J. 2007. General dietetic principles and practices. In The
Manual of Dietetic Practice. 4th Ed. Wiley-Blackwell.
Thomas D Wayne, Hinchliffe Rod F, Briggs C, Macdougall Iain C, Littlewood Tim,
Cavill Ivor. 2013. Guideline for the laboratory diagnosis of functional iron deficiency.
British Journal of Haematology, 161: 639-648.
Thomson J. 1997. Anaemia in pregnant women in eastern Caprivi, Namibia. South
African Medical Journal, 87:1544-1547.

155
Trupin, R. 2012. Common Pregnancy Complaints and Questions. 05 Jun, retrieved
from: http://www.emedicine.medscape.com
UCSF Clinical Labs-Chemistry. Ferritin: Advia Centaur System. 2010. Available from:
http://labmed.ucsf.edu/labmanual/db/resource/Centaur_Ferritin.pdf
Uher R and Rutter M. 2012. ‘Classification of feeding and eating disorders: review
of evidence and proposals for ICD-11’. World Psychiatry, 11(2):80-92.
Ukaonu C, Hill DA, Christensen F. 2003. Hypokalemic myopathy in pregnancy
caused by clay ingestion. Obstetrics and Gynaecology, 102(5):1169–71.
Umbreit J. 2005. Iron deficiency: a concise review. American Journal of
Hematology, 78: 225 – 231.
University Corporation for Atmospheric Research. Available from:
http://www2.ucar.edu/ Accessed December, 2012
Van Eijk AM, Lindblade KA, Odhiambo F, Peterson E, Rosen DH, Karanja D, Ayisi
JG, Shi YP, Adazu K, Slutsker L. 2009. Geohelminth Infections among Pregnant
women in Rural Western Kenya; a Cross-Sectional study. www.plosntds.org, vol. 3,
no. e370.
Vermeer DE and Ferrell RE Jr. 1985. Nigerian geophagical clay: a traditional
antidiarrheal pharmaceutical. Science, 227:634-636.
Vermeer DE and Frate DA. 1979. Geophagia in rural Mississippi: environmental and
cultural contexts and nutritional implications. American Journal of Clinical Nutrition
32(10):2129-2135.
Vermeer DE. 1966. Geophagy among the TIV of Nigeria. Annals of the Association of
American Geographers, 56(2):197-204.

156
Von Humboldt A, Bonpland A, Williams HM. 1814. Personal narrative of travels to
the equinoctial regions of the new continent during the years 1799 – 1804. 2nd
Edition. Published by London, Longman, Hurst, Rees, Orme and Brown. Available
from: http://catalog.hathitrust.org/Record/010684780
Vorster H, Badham JB, Venter CS. 2013. An introduction to the revised food-based
dietary guidelines for South Africa. South African Journal of Clinical Nutrition, 3: S5-
S12.
Vorster HH. 2010. The link between poverty and malnutrition: A South African
perspective. Health SA Gesondheid 15(1) 1-6. Available from:
http://www.hsag.co.za/index.php/HSAG/article/view/435/482 Accessed: Dec 15,
2013.
Vorster HH, Oosthuizen W, Jerling JC, Veldman FJ, Burger HM. 1997. ‘The
nutritional status of South Africans: A review of the literature from 1975–1996’, Health
Systems Trust (1), 1-22, (2), 1-122.
Vuori I, Lankenau B, Pratt M. 2004. Physical activity policy and program
development: the experience in Finland. Public Health Reports, 119(3): 331-345.
Walitzer KS, Derman KH, Connors GJ. 1999. Strategies for preparing clients for
treatment. A review. Behavior Modification, 23 (1): 129-151.
Walker ARP, Walker BF, Sookaria FI, Canan RJ. 1997. Pica. Journal of Royal
Social Health, 1147(5): 280-284.
Walker ARP, Walker BF, Jones J, Vervardi M, Walker C. 1985. Nausea and
vomiting and dietary cravings and aversions during pregnancy in South African
Women. British Journal of Obstetrics and Gynaecology, 92(5): 484-489.

157
Walker DD, Neighbors C, Rodriguez LM, Stephens RS, Roffman RA. 2011. Social
norms and self-efficacy among heavy using marijuana adolescent marijuana
smokers. Psychology of Addictive Behaviors, 25(4): 727-732.
Weiss BD. 2009. Health Literacy. In Health literacy and patient safety: Help
patients understand. Manual for clinicians. 2nd Ed. Chicago: American Medical
Association Foundation.
Weston AT, Pestosa R, Pate RR. 1997. Validation of instrument for measurement of
physical activity in youth. Journal of the American College of Sports Medicine,
29(1):138-143.
Wiley AS and Katz SH. 1998. Geophagy in pregnancy: A test of a hypothesis.
Current Anthropology, 39(4):532-545.
Wilkinson SA and Miller YD. 2007. Improving health behaviours during pregnancy:
a new direction for the regnancy handheld record. Aust N Z J Obstet Gynaecol,
47(6): 464-467.
Wilson K and Wauson J. 2010. The AMA Handbook of Business Writing: The
Ultimate Guide to Style, Grammar, Punctuation, Usage, Construction, and
Formatting. AMACOM.USA.
Wilson M. 2003. Clay mineralogical and related characteristics of geophagic
materials. Journal of Chemical Ecology, 29:1524-1547.
World Health Organization. 2003. Diet, nutrition and the prevention of chronic
diseases. Report of a Joint WHO/FAO Expert Consultation. Switzerland, Geneva.
World Health Organization. 2004. Assessing the iron status of population. Report of
the joint WHO/CDC Technical consultation on the assessment of iron status at the
population level. WHO, Geneva.

158
World Health Organization. 2006. Working together for health. World health report
2006. WHO, Geneva.
World Health Organization. 2007. Commission on the Social Determinants of
Health. Geneva, Switzerland.
World Health Organization. 2008. World prevalence of anaemia 1993 – 2005. WHO
Global Database on Anaemia. Geneva. Available from
http://www.who.int/vmnis/publications/en/ Accessed 22 Nov, 2013.
World Health Organization. 1996. Trace Elements in Human Nutrition and Health.
World Health Organization, Geneva.
World Health Organization. 2012. Eliminating soil-tranmitted helminthiases as a
public health problem in children. Progress report 2001 – 2010 and strategic plan
2011–2020. Geneva. Available from
http://whqlibdoc.who.int/publications/2012/9789241503129_eng.pdf?ua=1
Woywodt A and Kiss A. 1999. Perforation of the sigmoid colon due to geophagia.
Archives of Surg, 134: 88-89.
Woywodt A and Kiss A. 2002. Geophagia: the history of earth-eating. Journal of
the Royal Society of Medicine, 95:143-146.
Wuzowski L, Harper T, Hutchings T. 2008. An overview of the process of
developing patient education materials. In Writing health information for patients and
families. 3rd Ed. Hamilton Health Sciences, Otario, Canada.
Xiong X, Beukens P, Fraser WD, Guo Z. 2003. Anemia during pregnancy in a
Chinese population. International Journal of Gynaecology & Obstetrics, 83(2):159-
164.

159
Yadav D and Chandra, J. 2011. Iron Defeciency: Beyond Anemia. Indian J Pediatr,
78:65-72.
Yanai J, Noguchi J, Yamada H, Sugihara S, Kilasara M, Kosaki T. 2009. “Function
of geophagy as supplementation of micronutrients in Tanzania”. Soil Science and
Plant Nutrition, 55:215-223.
Ye D, Kam K, Sanou F, Traoré SS, Kambou, S, Yonaba C, Dao F, Sawadogo A.
2004. Intestinal obstruction and geophagia in a 14-year-old child. Archives de
Pédiatre, 11: 461 – 462.
Young SL, Goodman D, Farag TH, Ali SM, Khatib MR, Khalfan SS, Tielsch JM,
Stolzfus RJ. 2007. Geophagia is not associated with Trichuris or hookworm
transmission in Zanzibar, Tanzania. Transactions of the Royal Society of Tropical
Medicine and Hygiene, 101(8):766-772.
Young SL, Khalfan S, Farag,T, Kavle J, Rasmussen K, Pelto G, Ali SM, Hamadi B,
Tielsch J, Stolzfus R. 2010c. Pica is associated with anemia and gastrointestinal
distress among pregnant Zanzibar woman. American Journal of Tropical Medicine &
Hygiene, 83(1):144-151.
Young SL, Khalfan SS, Farag TH, Kavle JA, Ali SM, Hajji H, Rasmussen KM, Pelto
GH, Tielsch JM, Stolzfus RJ. 2010a. Association of Pica with Anemia and
Gastrointestinal Distress among Pregnant Women in Zanzibar, Tanzania. American
Journal of Tropical Medicine and Hygiene, 83(1):144-151.
Young SL, Wilson MJ, Hillier S, Delbos E, Ali SM, Stolzfus RJ. 2010b. Differences
and Commonalities in Physical, Chemical and Mineralogical Properties of Zanzibar
Geophagic Soils. Journal of Chemical Ecology, 36:129-140.
Young SL, Wilson MJ, Miller D, Hillier S. 2008. Toward a Comprehensive Approach
to the Collection and Analysis of Pica Substances, with Emphasis on Geophagic
Materials. PLoS One, www.plosone.org., vol. 3, no. 9, e3147.

160
Young SL. 2009. Evidence for the consumption of the inedible. In Consuming the
inedible. Neglected dimensions of food choice. Edited by J MacClancy, J Henry
and H Macbeth. USA: Berghahn Books:17-30.
Young SL. 2010. Pica in pregnancy: new ideas about an old condition. Annu Rev
Nutr, 30:403-422.
Young SL. 2011. Pica in Response to Food Storage. In Craving Earth,
Understanding Pica, the Urge to Eat, Clay, Starch, Ice & Chalk. New York: Columbia
University Press.
Zedlitz K. 2010. Pica – a historical “eating disorder” Wurzbg Medizinhist Mitt, 29:
402-433.
Ziegler J. 1997. Geophagia: a vestige of paleonutrition. Tropical Medicine and
International Health, 2(7): 609 – 611.
Zimmerman MB, Zeder C, Muthayya S, Winichagoon P, Chaouki N, Aeberli I, Hurrell
RF. 2008. Adiposity in women and children from transition countries predicts
decreased iron absorption, iron deficiency and a reduced response to iron
fortification. International Journal of Obesity, 32: 1098-1104.

161
ANNEXURE A
Information and Consent Document
Study Title: NUTRITIONAL STATUS AND RISK FACTORS ASSOCIATED WITH
WOMEN PRACTICING GEOPHAGIA IN QWAQWA, SOUTH AFRICA
Human ad Enzootic Geophagia in South Africa, Botswana and Swaziland
Dear Participant
We, the geophagia team (researchers from the university of Limpopo and Central University of
technology, Free State, University of Swaziland and Botswana) are doing research on geophagia (the
purposeful ingestion of soils and clays by humans and animals) in Southern Africa. We are asking you
to participate in this research project.
The study aims to identify and characterize selected soils and clays in Botswana, South Africa and
Swaziland that are being ingested by local commu7nities as well as calves, lambs and kids. The study
will be directed at identifying soils and clays in target areas, carry out appropriate mineralogical,
chemical, microbiological, ecological and environmental health analyses geared towards the
documentation of geophagic practices that have been going on for several centuries in these
countries. We want to conduct structured questionnaires- response studies which will address
aspects related to the environmental health and indigenous knowledge (IK) associated with
geophagia in these countries. I South Africa the team will conduct structured interviews with 330
adults, 132 children, 110 students, and 66 farmers to determine the attitudes and beliefs, standard
practice of geophagia as well as general health status of the respondents. The study will also be
conducted in Swaziland and Botswana. In each of Botswana and Swaziland 110 adults, 66 children,
44 students and twenty farmers will be interviewed.
There is no risk being involved in the study. However, the study ultimately aims to advance more
suitable harvesting techniques of the geophagic soils and clays which will aid in reducing down side
effects.
You, as participant in the study will be given information on the results of the study once it is
completed.
Please note that participation to the study is voluntary and that refusal to participate will involve no
penalty. You may discontinue your participation at any time during the study without any penalty.
Efforts will be made to keep personal information confidential. Personal information may be
disclosed if required by law. If results are published, this may lead to cohort identification.

162
Contact details of researchers (South Africa):
Dr George Ekosse (International project leader)
University of Limpopo
Geology, Mining and minerals
Faculty of Sciences, Health and Agriculture
Private bag x1106
Sovenga
0727
Tel: 015 268 2451
Prof Linda de Jager (South African coordinator)
Director: School of Health Technology
Faculty of health and Environmental Sciences
Central University of Technology, Free State
Bloemfontein
South Africa
1 Park Road, Bloemfontein, 9301, South Africa.
Private Bag x20539 Bloemfontein 9300 South Africa
T: +27 51 507 3123
F: +27 51 507 3354
Nutrition
Mrs A. van Onselen
Dietetics and Human Nutrition
University of KwaZulu-Natal
T: 033 260 6154

163
Contact details of researchers: Botswana
Dr Marks Ditlhogo
University of Botswana
Faculty of science
Botswana
T: +267 355 0000
Contact details of researchers: Swaziland
Dr N. O. Simelane
Dept. of Geography, Environmental Science and Planning
University of Swaziland
T: 268 5784511 (ext 2536/2222)

164
CONSENT TO PARTICIPATE IN RESEARCH
You have been asked to participate in a research study.
You have been informed about the study
by _______________________________
You may contact Prof L de Jager at Central University of Technology, Dr G Ekosse at the
University of Limpopo, DR M Dittlhogo, University of Limpopo or Dr NO Simelane, University
of Swaziland any time if you have questions about the research or if you are injured as a
result of the research.
You may contact the Secretariat of the Ethics Committee of the Faculty of Health Science,
UFS, Bloemfontein, South Africa at telephone number (051) 405 2812 if you have questions
about your right as a research subject.
Your participation in this research is voluntary, and you will not be penalized or lose benefits
if you refuse to participate or decide to terminate participation.
If you agree to participate, you will be given a signed copy of this document as well as the
participant information sheet, which is a written summary of the research.
The research study, including the above information has been verbally described to me.
I understand what my involvement in the study means and I voluntary agree to participate.
_________________________ _______________________
Signature Participant Date
_________________________ _______________________
Signature Witness Date
_________________________ _______________________
Signature Interviewer Date

165
Pampitshana ya Molaetsa
Sehloho sa Thuto:
Batho le Enzootic Geophagia Afrika Borwa, Botswana le Swaziland
Dumela Monka-karolo
Re le sehlopha sa diphuputso (Baphupotsi hotswa Yuniveshithi ya Limpopo,
Yniveshithi e bohareng yea thekenolohi, Foreistata, Yuniveshithi ya Swaziland le
Botswana) re etsa dipatlisiso kaho JA mobu letsopa ke batho le diphoofolo ho la
Afrika e Borwa le di naha tse mabapi. Re kopehore o nke karolo
phupotsong/patlisisong ena.
Thuto e ikemiseditse ho temoho le hlopolla mefute ya mebu le letsopa hola
Botswana, Afrika Borwa le Swaziland e Jewang ke Batho metseng le diphoofolo
mmoho le bana. Thuto e tla lebiswa ho temoho ya mobu le letsopa di bakeng tse
kgethilweng ho mtsetsa hanyle mineralogical, dikhemikale, microbiology, ecological
le patlisisa ka tsa bophelo ho I setsa ho ngolweng ha ntle ha tlhaello ena yah o ja
mobu e e sa le e etswa ka dilemo lemo naheng tsena. Re rata ho ntshetsa pele
dipotso ka tsela ya thuto e tla buwa ka mabaka a amanang le tsa bophelo di bakeng
tsatsa rona le tshebo ya lehae e amanang le ho ja moba dinaheng tsena. Afrika
borwa sehlopha se tlo etsa dipotso le Batho ba abholo ba kabang 330, Bana ba 132,
Bithuti ba 110 le bo ramapolasi ba 66 ho fumana hatle thlaello le mokgwa, le tumelo
mnoho le bophello ka kakaretso ho ba nkakarolo. Thuto ene e boetse e tla etsa
dipotso tsena Swaziland le Botswana. Ho se seng le se seng sa sebaka 110 Batho
be baholo, 110 Bana, baithuti 44bo rapolasi ba 22.

166
O kupuwe ho nka karolothutiong ea ya patlisiso
O se o fumane lesedi ka thuto ena?
by _____________________________________
Oka ikopanya le Moporofesa L de Jager Yunivesithing e bohareng ya Foreistata,
Ngaka G Ekosse Yunivesithing ya Limpopo, Ngaka M Ditlogo Yunivesithing ya
Limpopo, Ngaka Simelane Ynivesithing ya Swaziland ka nako tsohle ha ona le
dipotso ka thuto kappa tse fumangeng patlisisong ena.
Oka Boela wa ikopanya le Mokgodi wa komiti ya mekgwa ya bophelo bo bottle le
science, UFS, Bloemfontein Afrika Borwa ka mohala nomorong ena (051) 405 2821
ha ona le dipotso ka ditokelo tsa hae the ka monka-karolo.
Ho nka-karolo ha hao ke boithaopo, hape ha ona fumantshwa kotlo kappa wa
latlehelwa ke omonyetla oitseng ka ho hana ho mka-karolo kappa ha oka nka qeto ya
ditaba mabaqi le thuto, e ngotswe ditabana tsa patlisisong ena.
Patlisiso, ho kenyeletswa le ditaba tse ngotsweng ka dibuilwe ho nna. Ke othisisa ho
makakarolo ha ka thutong ho bolellang hape e thaopile ho nkakarolo.
_________________________ _______________________
Saena ya Monka-karolo Letsatsi
_________________________ _______________________
Saene ya Paki (ha ho tlokahala) Letsatsi
_________________________ _______________________
Saena ya Motsamaisi/mobutsi Letsatsi

167
QUESTIONNAIRE RELATED TO HUMAN GEOPHAGIA: ADULT
INTRODUCTION
For office use only
Number 1-7
Date of interview: ___________________________(dd/mm/yy) 8-13
Name of interviewee (optional): _______________________________ 14-16
Country: 17
Region: 18
District: _______________________________ 19-20
A. DEMOGRAPHIC INFORMATION
1. Geographic Information
1. Location: Rural Urban 21
2. Specify town or area: _______________________________ 22-23
2. Personal and Demographic Information
3. Gender Male Female 24
4. Age: ______________________(years) 25-26
5. Ethnic Group: Afrikaans 27
English
Sesotho
Setswana
siSwati
isiXhosa
isiZulu
Other, please specify:___________________ 28-29
6. Number of children: ________________________ 30-31
1 32-33 34
2 35-36 37
3 38-39 40
4 41-42 43
5 44-45 46
6 47-48 49
7 50-51 52
8 53-54 55
PHASE 1
The University of Limpopo in the Limpopo Province and the Central University of Technology, Free State in Bloemfontein, South
Africa - in collaboration with the Universities of Swaziland and Botswana - are conducting a study to characterise habits related to
human and enzootic geophagia in South Africa, Botswana and Swaziland. It is also designed to characterise, in physico-
chemical, microbiological, mineralogical and ecological terms, the soils that are preferred by geophagic individuals and animals
in these three countries. This exercise is mainly for academic purposes; however, the information gathered may be used
generally to improve methods of harvesting geophagic soils that will guarantee the health of geophagic individuals. Strict
confidentiality of the information provided is guaranteed at all times, and respondents are therefore urged to cooperate fully with
the interviewers in order to facilitate this study.
Free State
Limpopo
Swaziland
COPYRIGHT@2007 BY G. EKOSSE et al. All rights reserved. No part of this document may be reproduced, stored in a retrieval system or
transmitted in any form or by any means, electronic, mechanical, photocopying, recording, or otherw ise, w ithout the w ritten permission of the
copyright ow ner.
RSA
ANNEXURE B
Botswana
6.1 Age of Child 6.2 Gender of child
North West
Gauteng
Suburban

168
7. Marital status: Single 56
8. Income source: Wage employment 57
Non-wage employment
Other, please specify:___________________ 58-59
9. Occupation: ____________________________________ 60-61
10. Monthly income: R/Pula__________________ 62-67
11. Highest educational level attained: No schooling
Primary 68
Secondary
Tertiary
12. Highest grade/standard completed successfully:
(if GRADE is applicable) 69-70
(if STANDARD is applicable) 71-72
13. Number of years in formal education: years 73-74
B. SOCIO-ECONOMIC AND CULTURAL ASPECTS
1. Geophagic Habits
14. Are you presently in the habit of eating soil? Yes No 75
14.1 If YES, how often do you eat soil? Once a month 76
Once a week
Once a day
More than once a day
14.2 If YES, for how long have you been eating soil? _________________(years) 77-78
15. What is/are your reason(s) for eating soil?
Standard practice (cultural, traditional, spiritual) 1
Craving 2
Medicinal value 3
Supplement diet 4
Ritualistic 5
When hungry 6
When pregnant 7
Don’t know 8
Other, please specify: _____________________ 9 10-11
16. Do you ever crave soil? Yes No 12
16.1 If YES, how often? Regularly - Monthly 13
Regularly - Weekly
Regularly - Daily
Only when pregnant
CohabitingEngagedMarried Divorced Widowed

169
17. When do you crave soil?
Pregnant Nauseous, but not pregnant 14 15
Lactating Constipated 16 17
Both pregnant and lactating Feeling weak 18 19
Having trouble sleeping Other, please specify: _______________ 20 21 22-23
18. When pregnant, how often do you eat soil?
Once a month 24
Once a week
Once a day
Other, please specify: __________________________ 25-26
19. Do you eat any other non-food substance? Yes No 27
19.1 If YES, name the substance: ___________________________________________ 28-29
20. How often do you eat this substance? Daily 30
More than once a day
Weekly
Monthly
21. How much of the soil do you eat?
Daily 1 2 3 4 5 31
More than once a day 1 2 3 4 5 32
Weekly 1 2 3 4 5 33
Monthly 1 2 3 4 5 34
22. Do other people know that you eat clay? Yes No Don’t know 35
22.1 If YES, who knows about it? Family members 36
Extended family members 37
Friends 38
Other, please specify: _______________________ 39 40-41
23. How do people perceive this habit of eating non-food substances?
Positive 42
Negative 43
Indifferent 44
Don’t know 45
24. Is this practice of eating soil more common among certain members of the community?
Yes No 46
24.1 If YES, specify: _______________________________________________ 47-48
C. INDIGENOUS KNOWLEDGE
25. Which substances are eaten? Soil 49
Clay 50
Soil from termite mounds 51
Other, please specify: _________________ 52 53-54
26. How are the substances eaten? Wet 55
Dry 56
With other food 57
Other, please specify: _________________ 58 59-60
Don’t know

170
27. What are the traditional names of the substances consumed?
61-62
63-64
28. Where do you obtain your preferred substance? 65
From nature 66
Buy it 67
Am given it 68 69-70
Other, please specify: _________________
28.1 If you BUY it, give the brand name: _______________________________ 71-72
28.2 If you BUY it, indicate the price per handful: R/Pula __________________ 73-76
29. What is the colour of your preferred substance?
Reddish Yellowish 1 2
Whitish Khaki 3 4
Blackish Other, please specify: _______________5 6 7-8
30. Why do you prefer to eat a substance of that specific colour?
Taste 9
Tradition / belief 10
Easily accessible 11
Other, please specify: _________________ 12 13-14
31. Where do you store the substance?
15-16
32. For how long do you usually store the substance?_____________(days) 17-19
33. Where can your preferred substance be found?
Hill / mountain 20
Riverbed 21
Termitaria / termite mound 22
Valley 23
Pit / excavation 24
Other, please specify: _________________ 25 26-27
33.1 If a termitaria/ termite mound, from where specifically is the substance collected?
From the outer surface of the mound 28
Inside the mound above the surface of the soil 29
Inside the mound below the surface of the soil 30
Does not matter 31
Not sure 32
34. Is your preferred substance found close to rocks? Yes No Not sure 33
34.1 If YES, what type of rock? Very hard 34
Hard 35
Soft 36
Very soft 37
D. PHYSICO-CHEMICAL, MINERALOGICAL, GEOLOGICAL AND CHEMICAL
ASPECTS

171
35. Substance-collection method Digging 38
Scooping handfuls 39
Scraping 40
Selective hand-picking 41
Other, please specify: ___________________ 42 43-44
35.1 If digging, how deep?_______________cm 45-47
36. How does the substance feel? Gritty 48
Silky
Powdery
Does not matter
Don’t know
37. In what condition is the substance collected? Wet Dry Both 49
37.1 If collected wet, how does the substance feel? Very sticky 50
Sticky
Very soapy
Soapy
None of the above
38. Is the substance processed before being eaten? Yes No 51
38.1 If YES, how is it processed? Grinding 52
Pounding 53
Sieving 54
Slurrying 55
Other, please specify: ___________________ 56 57-58
39. Is there any heat treatment of the substance before it is eaten? Yes No 59
39.1 If YES, specify the type of heat treatment:
Baking 60
Boiling 61
Burning 62
Combination, please specify: ___________________________ 63 64-65
Other, please specify: ____________________________ 66 67-68
E. ECOLOGICAL ASPECTS
40. If applicable, please specify the type of termitaria Mound 69
from which you prefer to collect substances? Tree 70
40.1
< 0.5 m 71
0.5 – 1 m
1 – 2 m
> 2 m
40.2 What is the preferred shape of the mound? Conical 72
Flat topped 73
Dome shaped 74
Other, please specify 75
If the substance is collected from a termite mound (Section C), describe the preferred
height of the mound.
Sometimes
Sometimes

172
40.3 Do you prefer to eat the substance when Newly formed 76
Old
Does not matter
Not sure
40.4 In what type of terrain do you normally find these mounds?
Flat 1
Hilly 2
Undulating 3
Valley 4
Other, please specify: _________________ 5 6-7
40.5 Do you collect the substance from Mound 8
Base of the mound
Some distance from the mound
Other, please specify: _________________
41. If substance is collected from a tree, do you prefer it to be a particular type of tree? 9
Yes No
41.1 If YES, name the preferred type of tree: _____________________________ 10-11
F. HUMAN HEALTH ASSOCIATED WITH GEOPHAGIA
42. What is your height?__________(cm) 12-14
43. What is your weight?__________(kg) 15-17
44. Do you think that the substance could be harmful? Yes No 18
44.1 If YES, in what way? Constipation 19
Abdominal pains 20
Poisoning the body 21
Causing tooth decay 22
Other, please specify: _________________ 23 24-25
45. Have you ever undergone surgery for a stomach ailment? Yes No 26
45.1 If YES,
How many times? _______________ 27-28
For what reason? 29-30
46.
Yes No 31
47. Do you know the components of the substance? Yes No 32
47.1 If YES, name these components: Vitamins 33
Calcium 34
Iron 35
Salt 36
Other, please specify: _________________ 37 38-39
Not sure
Do you think there are harmful elements / parasites present in the
substance?
Does not matter

173
48. Why do you eat the substance(s) you do?
To clean your body 40
For additional nutritional value 41
To protect against infections 42
Don't know 43
Other, please specify: _________________ 44 45-46
49. Are you often ill (infections like colds, flu, etc.)? Yes No 47
49.1 If YES, how often? More than once a month 48
Once a month
Once every three months
Twice a year
Once a year
50. Do you eat these substances when ill? Yes No 49
51. Any medical condition diagnosed/experienced Yes No 50
51.1 If YES, which of these? Constant headaches 51
Dizziness 52
Blood in stool 53
Fatigue 54
Chest pains 55
Coughs 56
Muscle pains 57
Tremors 58
Blood in urine 59
Nosebleeds 60
Iron deficiency 61
High Blood pressure 62
Constipation 63
Other, please specify 64
52. Number of stillborn children (full time)? 65
53. Number of miscarriages? 66
54. Number of children born with abnormalities? 67
55. Name the abnormalities. 68-69
70-71
72-73
Sometimes
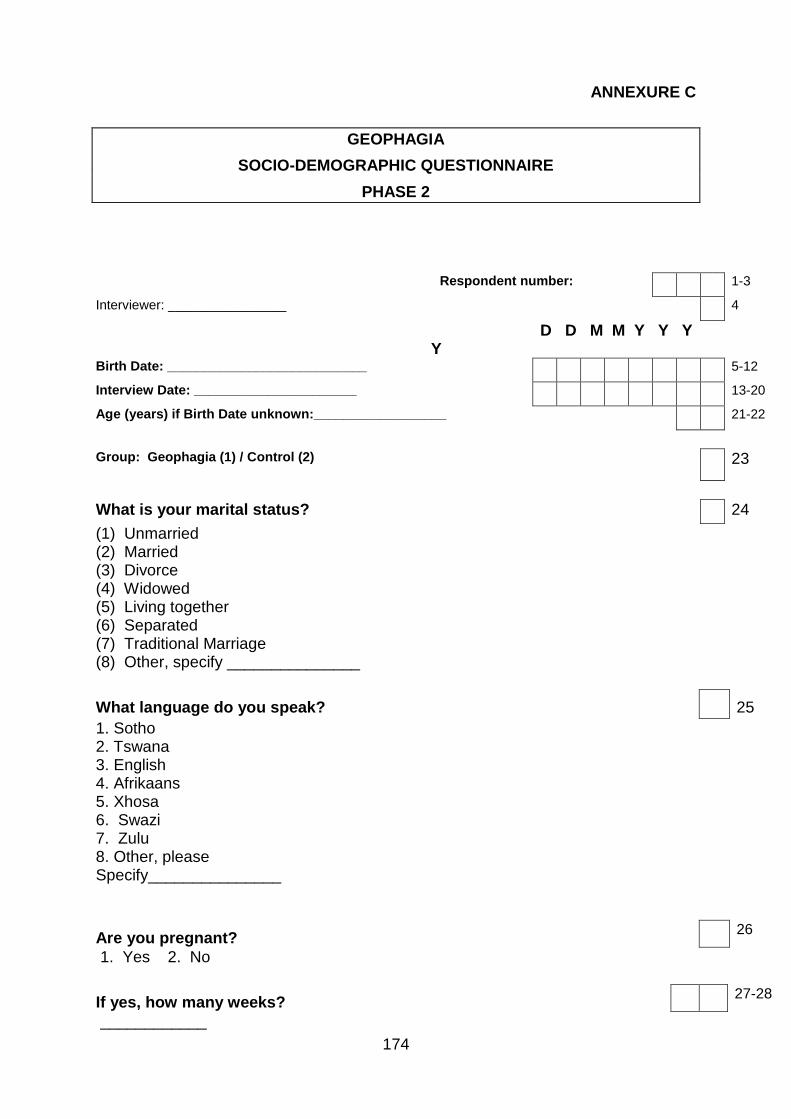
174
ANNEXURE C
GEOPHAGIA
SOCIO-DEMOGRAPHIC QUESTIONNAIRE
PHASE 2
Respondent number: 1-3
Interviewer: ________________ 4
D D M M Y Y Y Y
Birth Date: ___________________________ 5-12
Interview Date: ______________________ 13-20
Age (years) if Birth Date unknown:__________________ 21-22
Group: Geophagia (1) / Control (2) 23
What is your marital status? 24
(1) Unmarried (2) Married (3) Divorce (4) Widowed (5) Living together (6) Separated (7) Traditional Marriage (8) Other, specify _______________
What language do you speak? 25
1. Sotho 2. Tswana 3. English 4. Afrikaans 5. Xhosa 6. Swazi 7. Zulu 8. Other, please Specify_______________
Are you pregnant? 26
1. Yes 2. No
If yes, how many weeks? 27-28
____________
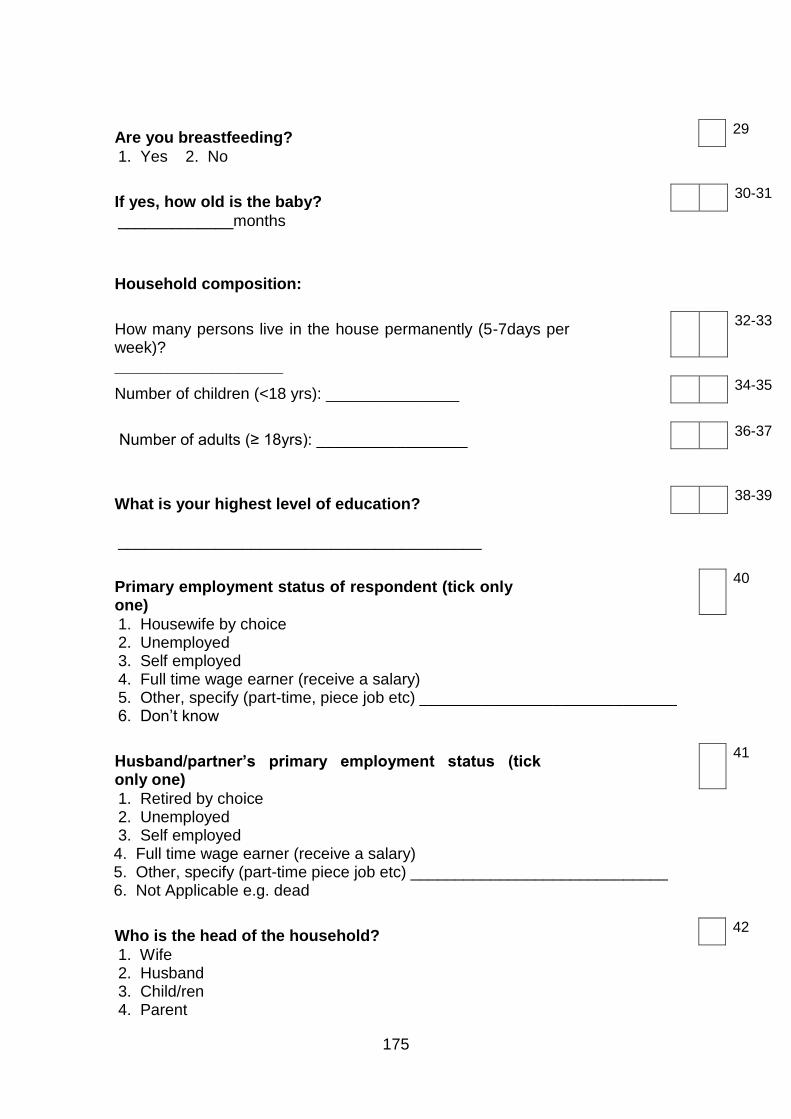
175
Are you breastfeeding? 29
1. Yes 2. No
If yes, how old is the baby? 30-31
_____________months
Household composition:
How many persons live in the house permanently (5-7days per week)?
32-33
___________________
Number of children (<18 yrs): _______________ 34-35
Number of adults (≥ 18yrs): _________________ 36-37
What is your highest level of education? 38-39
_________________________________________
Primary employment status of respondent (tick only one)
40
1. Housewife by choice 2. Unemployed 3. Self employed 4. Full time wage earner (receive a salary) 5. Other, specify (part-time, piece job etc) _____________________________ 6. Don’t know
Husband/partner’s primary employment status (tick only one)
41
1. Retired by choice 2. Unemployed 3. Self employed 4. Full time wage earner (receive a salary) 5. Other, specify (part-time piece job etc) _____________________________ 6. Not Applicable e.g. dead
Who is the head of the household? 42
1. Wife 2. Husband 3. Child/ren 4. Parent

176
5. Grandparent 6. Friend 7. Other, specify __________________________ Type of dwelling?
1. Brick, concrete: (1) Yes (2) No 43
2. Traditional mud: (1) Yes (2) No 44
3. Tin: (1) Yes (2) No 45
4. Plank, wood: (1) Yes (2) No 46
5. Other: specify ______________ 47
What fuel is used for cooking?
1. Electric: (1) Yes (2) No 48
2. Gas: (1) Yes (2) No 49
3. Paraffin: (1) Yes (2) No 50
4. Wood, coal: (1) Yes (2) No 51
5. Sun: (1) Yes (2) No 52
6. Open fire: (1) Yes (2) No 53
Do you use cast iron pot for cooking? (1)Yes or (2) No. If yes how often? 54
1. ≤ Once a week 2. > Once a 3. Every day 55
Does your home have a working:
Refrigerator and/or freezer: 56
1. Yes 2. No
Stove (Gas, Coal or electric or Hot plate): 57
1. Yes 2. No
Primus or Paraffin Stove: 58
1. Yes 2. No
Microwave oven: 59
1. Yes 2. No

177
ANNEXURE D
GEOPHAGIA
ANTHROPOMETRIC QUESTIONAIRRE
PHASE 2
Respondent number: 1-3
Interviewer:__________________________ 4
Weight (kg):__________________________ 5-9
Height (cm):__________________________ 10-14
Circumference(cm)
Waist (cm):__________________________ 15-19
Hip (cm):__________________________ 20-24

178
ANNEXURE E
GEOPHAGIA
PHASE 2
Respondent number: 1-3
Interviewer:__________________________ 4
(1) Baseline / (2) After Intervention 5
QUANTITATIVE FOOD FREQUENCY QUESTIONNAIRE
Greeting
Thank you for giving up your time to participate in this survey. We would like to find out what
people usually eat and drink. This information is important to know as it will tell us whether you
eat the right foods, and if you are healthy.
Please think carefully about the food and drinks you have consumed during the past 6 months. I will
now go through a list of foods and drinks with you and I would like you to tell me:
if you eat these particular foods,
how the food is prepared,
how much of the food you eat at a time, and
how many times a day you eat it and if you do not eat it every day, how many times a week or a
month it is eaten?
To help you to describe the amount of a food, I will show you models and examples of different
amounts of the food. Please say which model is the closest to the amount eaten, or if it is smaller,
between sizes or bigger than the models. Amounts can also be reported as cups (c), tablespoons
(T) or teaspoons (t).
THERE IS NO RIGHT OR WRONG ANSWERS.
EVERYTHING YOU TELL ME IS CONFIDENTIAL.
IS THERE ANYTHING YOU WANT TO ASK NOW?
ARE YOU WILLING TO GO ON WITH THE QUESTIONS?
ENCIRCLE APPROPRIATE ANSWER
Do you use salt in your food during food preperation? 6
(1) Yes (2) No (3) Don’t know
Are other flavoured salt e.g. Aromat used in food? 7
(1) Yes (2) No (3) Don’t know
If yes, specify _____________________ 8-9

179
Do you use beef/chicken stock in your food? 10
(1) Yes (2) No (3) Don’t know
Do you use laxatives on a regular basis (weekly)? 11
(1) Yes (2) No (3) Don’t know
If yes, how often? 12
(1) Everyday
(2) ≥ 3 times per week
(3) Less then 3 times per week
Do you use any nutrient supplements regularly? 13
( 1) Yes (2) No (3) Don’t know
If yes, what kind of nutrient supplement?
(1)Vitamins : (1) Yes (2) No 14
If yes: Specify ____________________________ 15-16
How often? 17
(1) Everyday
(2) ≥ 3 times per week
(3) Less than 3 times per week
If yes, what kind of nutrient supplement?
(2) Minerals: (1) Yes (2) No 18
If yes: Specify ____________________________ 19-20

180
How often? 21
(1) Everyday
(2) ≥ 3 times per week
(3) Less than 3 times per week
If yes, what kind of nutrient supplement?
(3) Proteins: (1) Yes (2) No 22
If yes: Specify ____________________________ 23-24
How often? 25
(1) Everyday
(2) ≥ 3 times per week
(3) Less than 3 times per week
If yes, what kind of nutrient supplement?
(4) Energy: (1) Yes (2) No 26
If yes: Specify ____________________________ 27-28
How often? 29
(1) Everyday
(2) ≥ 3 times per week
(3) Less than 3 times per week
If yes, what kind of nutrient supplement?
(5) Other: (1) Yes (2) No 30
If yes: Specify ____________________________ 31-32
How often? 33
(1) Everyday
(2) ≥ 3 times per week
(3) Less than 3 times per week
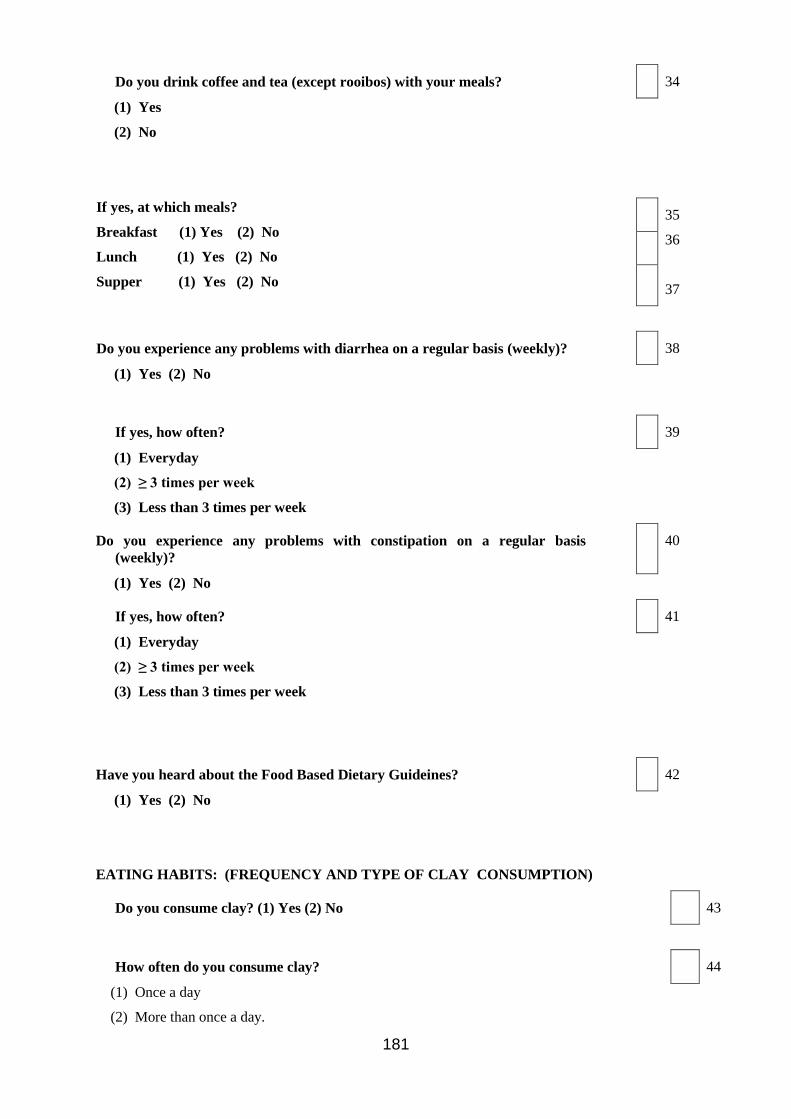
181
Do you drink coffee and tea (except rooibos) with your meals? 34
(1) Yes
(2) No
If yes, at which meals?
Breakfast (1) Yes (2) No
Lunch (1) Yes (2) No
Supper (1) Yes (2) No
35
36
37
Do you experience any problems with diarrhea on a regular basis (weekly)? 38
(1) Yes (2) No
If yes, how often? 39
(1) Everyday
(2) ≥ 3 times per week
(3) Less than 3 times per week
Do you experience any problems with constipation on a regular basis
(weekly)?
40
(1) Yes (2) No
If yes, how often? 41
(1) Everyday
(2) ≥ 3 times per week
(3) Less than 3 times per week
Have you heard about the Food Based Dietary Guideines? 42
(1) Yes (2) No
EATING HABITS: (FREQUENCY AND TYPE OF CLAY CONSUMPTION)
Do you consume clay? (1) Yes (2) No 43
How often do you consume clay? 44
(1) Once a day
(2) More than once a day.

182
How much clay do you consume at a time (see samples)? 45-46
____________________________________g
What kind of clay do you consume most often?
(1) Red 47
(2) White 48
(3) Gray 49
(4) Other, specify __________________________ 50
Do you ever consume any other non-food items on a regular basis e.g. chalk, 51
washing powder etc.
(1) Yes
(2) No
If yes, specify:
Non-food items Grams How often consumed?
(1) Everyday
(2) ≥ 3 times per week
(3) Less than 3 times per week
52-57
_______________ ________ _______________
_________________ __________ _________________ 58-63
_________________ __________ _________________ 64-69
_________________ __________ _________________ 70-75

183
SUMMARY OF FOOD FREQUENCY QUESTIONNAIRE
Respondent number: 1-3
FOOD CALCULATIONS CODE AMOUNT PER DAY (g) (1-8)
(9-16)
(17-24)
(25-32)
(33-40)
(41-48)
(49-56)
(57-64)
(65-72)
(73-80)
(1-8)
(9-16)
(17-24)
(25-32)
(33-40)
(41-48)
(49-56)
(57-64)
(65-72)
(73-80)
(1-8)
(9-16)
(17-24)
(25-32)
(33-40)
(41-48)
(49-56)
(57-64)
(65-72)
(73-80)
(1-8)
(9-16)
(17-24)
(25-32)
(33-40)
(41-48)
(49-56)
(57-64)
(65-72)
(73-80)
(1-8)
(9-16)
(17-24)
(25-32)
(33-40)
(41-48)
(49-56)
(57-64)
(65-72)
(73-80)

184
FOOD DESCRIPTION AMOUNT USUALLY
EATEN
TIMES EATEN CODE AMOUNT/DAY
Per day
Per week
Per month
Seldom/ Never
Maize-meal porridge
Stiff (pap) 3400
Maize-meal porridge
Soft (slappap) 3399
Maize-meal porridge
Crumbly (phutu) 3401
Sour porridge Specify ratio Mabella/Maize
3399
Mabella porridge Stiff, coarse, fine 3437
Mabella porridge Soft, coarse, fine 3437
Oats porridge Brand name: 3239
Breakfast cereals Puffed Wheat, plain 3325
Corn Flakes, plain 3243
Weet Bix 3244
Puffed Rice, sweet 3372
Specify types usually eaten _____________________ _____________________ Brand names of cereals available at home now:_________________
Milk on porridge or cereal: Circle type usually used
None
Whole/fresh 2718
Sour 2787
2% fat 2772
Fat free/skimmed 2775
Milk blend 2771
Soy milk 2737
Condensed (whole,sweet) 2714
Condensed (skim, sweet) 2744
Evaporated whole 2715
Evaporated low fat 2827
Non-dairy creamer 2751
Is sugar added to porridge or cereal? (Tick box)
None White
Brown Syrup Honey Sweetener: type_______
3989 4005 3988 3984
Is fat added to porridge or cereal? (Tick box)
None Animal fat (butter) Hard margarine Soft margarine Oil Peanut Butter
3479 3484 3496 3507 3485
Samp/Maize rice Bought Self ground
3250 3725
Samp and beans Specify ratio (1:1) 3402 Samp and peanuts
Specify ratio
Rice: specify brands names:
White Brown Sorghum rice
3247 3315 3437
Stamped wheat 3249
Pastas Macaroni Spaghetti Spaghetti in tomato sauce Other:
3262 3262 3258

185
HOW MANY TIMES A WEEK DO YOU EAT PORRIDGE OR BREAKFAST CEREAL AT ANY TIME OF THE DAY (NOT ONLY BREAKFAST)?____________
FOOD DESCRIPTION AMOUNT USUALLY
EATEN
TIMES EATEN CODE AMOUNT/DAY
Per day
Per week
Per month
Seldom/ Never
Bread/Bread rolls White 3210
Bread slices: thin Brown 3211
Medium, thick Whole wheat 3212
Other breads Specify types e.g. Raisin Maize meal Sweetcorn Rye Other
3214 3278 3379 3213
Pizza (specify toppings) Hot Dogs( specify sausage) Hamburgers (specify meat)
Cheese, tomato & onion ____________________ ________________________________________________________________________________
3353
Are any the following spreads used on bread? Fat spreads (Tick box)
Butter Butro Animal fat (beef tallow) Lard Hard margarine (brick) Soft margarine (light) Cooking Fat
3479 3523 3494 3495 3484 3496 3516
Peanut butter 3485
Sweet spreads Jam Syrup Honey
3985 3988 3984
Marmite/ OXO/ Bovril
4030 4029 4029
Fish paste Meat paste
3109 2917
Cheese Specify types: Cottage low-fat cheese Cream cheese Gouda Cheddar Other:_______________
2760 2725 2723 2722
Cheese spreads Low fat Full fat Specify types
4310 2730
Atchar 3117
Other spreads: (Specify tipes)
________________________________________
Dumpling 3210
Vetkoek 3257
Provita Crackers (refined) Crackers (whole wheat)
3235 3331 3391

186
Rusks Home-made:
Bran Buttermilk White Boerebeskuit, white All-bran Raisins Buttermilk, white Buttermilk, whole wheat Other
3330 3329 3364 3364 3380 3380 3215 3255
Scones 3237
Muffins Plain Bran
3408 3407
HOW MANY TIMES A DAY DO YOU EAT BREAD? ________
FOOD DESCRIPTION AMOUNT USUALLY
EATEN
TIMES EATEN CODE AMOUNT/DAY
Per day
Per week
Per month
Seldom/ Never
Chicken Boiled: with skin without skin
2926 2963
Do you eat the chicken with the skin?
Fried: in batter/crumbs Fried, but not coated
3018 2925
Yes No Roasted/grilled with skin without skin
2925
2950
Chicken bones stew A003
Chicken heads, raw 2999
Chicken stew, with veg. & skin
3005
Chicken feet, raw 2997
Chicken offal Giblets 2998
Chicken pie Commercial Home-made
2954 2954
Red meat: Beef Fried/grilled: with fat without fat
2908 2959
Stewed/boiled: with fat without fat
3006 2909
Mince with tomato and onion
2987
Red meat: Mutton Fried/grilled: with fat without fat
2927 2934
Stewed/boiled: with fat without fat
3040 2916
Red meat: Pork Fried/grilled: with fat without fat
2930 2977
Stewed/boiled: with fat without fat
3046 3045
Red meat: Goat Fried/grilled: with fat without fat
4281
Stewed/boiled: plain with veg
4281 4282
Offal: Specify type: Intestines: boiled, nothing added
3003
"Vetderm" fried 3003
Stewed with vegetables
Liver 2955
Kidney 2956

187
Tripe "pens" trotters, head
3003
Pluck (lungs, heart, gullet)
3019
Specify vegetables used in meat stews (only if not mentioned elsewhere)
Wors / sausage Fried 2931
Bacon 2906
Cold meats Polony 2919
Ham 2967
Vienna's canned 2936
Russian 2948
Frankfutter 2937
Other (specify)
Canned meat Bully beef 2940
Other (specify)
Meat pie Bought 2939
FOOD DESCRIPTION AMOUNT USUALLY
EATEN
TIMES EATEN CODE AMOUNT/DAY
Per day
Per week
Per month
Seldom/ Never
Legumes: specify dried beans/peas/ Lentils
Stews & curries (specify) Soups Salad
3157 3174
Baked beans 3176
Soya products e.g. Toppers/ Imana
Brands at home now Don’t know______________ Show examples
3196
Fried fish (fresh or frozen fried in sun oil)
With batter/crumbs
Without batter/crumbs
3072
3060
Fresh water fish
Specify type
Specify cooking method
Medium fat, batter, fried
3094
Canned fish:
Pilchards In brine 3055
In tomato sauce 3102
Mashed with fried onion A005
Sardines In oil In tomato sauce
3087 3087
Tuna
In oil In brine
3093 3054
Mackerel 3113
Salmon 3101
Pickled fish/curried 3076
Do you remove fish bones before eating canned fish
YES NO
Fish cakes Specify canned or other
Fried: oil/butter/margarine, commercial
3080
Salted dried fish 3077

188
Eggs Boiled/poached Scrambled in: oil butter margarine Fried in: oil butter margarine bacon fat Curried
2876 2889 2886 2887 2869 2868 2877 2870 2902
HOW MANY TIMES A WEEK DO YOU EAT MEAT ________,
BEANS ________, CHICKEN ________, FISH ________ AND
EGGS ________?
FOOD DESCRIPTION AMOUNT USUALLY
EATEN
TIMES EATEN CODE AMOUNT/DAY
Per day
Per week
Per month
Seldom/ Never
Cabbage Boiled, nothing added 3756
Boiled with potato and onion and fat
3813
Fried, in margarine (nothing added)
3810
Fried, in oil (nothing added)
3912
Boiled, then fried with potato, onion
A006
Other:
Spinach/morogo/imfino/other green leafy vegetables: List names
Boiled, nothing added 3913
Boiled fat added (margarine)
3898
Boiled with onion/tomato and fat
A011
-onion &potato (margarine)
3901
- onion, tomato & potato
- with peanuts
Other:
Tomato and onion ‘gravy’/relish/chow
Home made -with fat without fat
3910 3925
Canned 4129
Pumpkin Cooked in fat & sugar A010
Specify type: Boiled, little sugar and fat A010
Boiled 4164
______________ Other:
Carrots Boiled, sugar & fat 3819
Boiled, nothing added 3757
Boiled, potato, onion, no fat
3934
Boiled, potato, onion, margarine
3822
Boiled, with sugar 3818
With potato/onion 3934
Raw, salad (orange juice) 3711
Chakalaka
Other:

189
Mealies/Sweet corn On cob 3725
Off cob -creamed sweet corn Off cob whole kernel
3726 3942
Beetroot Cooked Salad (bought or home-made)
3698 3699
Potatoes Boiled with skin 4155
- without skin
3737
Baked in skin(flesh and skin) - in skin (flesh only)
3736 3970
Mashed - skim milk, margarine
3875
Mashed - whole milk, margarine
3876
Roasted in beef fat 3878
French fries/potato chips (oil)
3740
Salad (mayonnaise and egg)
3928
Other:
Sweet potatoes Boiled with skin 3748
without skin 3903
Baked with skin 3748
- without skin 3903
Mashed 3903
Other:
Peas Green, frozen Green, frozen with sugar With sugar and butter Tinned peas
4146 3720 3859 4149
Green peppers Raw Cooked (stew with oil)
3733 3865
Brinjal/egg plant Cooked Fried in oil Stew (oil, onions, tomato)
3700 3802 3798
Mushrooms Raw Sautéed in brick margarine Sautéed in oil
3842 3839 3841
Onions Sauteed in sun oil Sauteed in margarine
3730 3844
Salad vegetables Raw tomato 3750
Lettuce 3723
Cucumber 3718
Avocado's 3656
Green Beans Boiled, nothing added 3696
Cooked, potato, onion, margarine
3792
Cooked, potato, onion, no fat
3933
Cauliflower Boiled
Other vegetables; specify
__________________ __________________

190
If you fry veg or add fat specify type of fat usually used
Butter Butro Animal fat (beef tallow) Lard Hard margarine (brick) Soft margarine (tub) Soft margarine (light) Sunflower oil
3479 3523 3494 3495 3484 3496 3524 3507
HOW MANY TIMES A WEEK DO YOU EAT VEGETABLES? _____________
FOOD DESCRIPTION AMOUNT USUALLY
EATEN
TIMES EATEN CODE AMOUNT/DAY
Per day
Per week
Per month
Seldom/ Never
Mayonnaise/salad dressing
Mayonnaise: bought home-made Cooked salad dressing Salad dressing low-oil Salad dressing French Oil: Olive Sunflower Canola
3488 3506 3503 3505 3487 3509 3507 4280
Apples Fresh Canned, unsweetened
3532 4216
Pears Fresh Canned, in syrup
3582 3583
Bananas 3540
Oranges Naartjie
3560 3558
Grapes 3550
Peaches Fresh Canned, in syrup
3565 3567
Apricots Fresh Canned, in syrup
3534 3535
Mangoes Fresh 3556
Pawpaw Raw 3563
Pineapple Raw Canned (syrup)
3581 3648
Guavas Fresh Canned (syrup)
3551 3553
Watermelon 3576
Spanspek Orange flesh Green flesh
3541 3575
Wild fruit/berries (Specify types)
____________________ ____________________ ____________________ ____________________ ____________________
Dried fruit (also as snacks)
Raisins Prunes (raw) Prunes (cooked with sugar) Peaches (raw) Peach (cooked with sugar) Apples (raw) Dried fruit sweets Other ________________________________________ ____________________
3552 3596 3564 3568 3569 3600 3995

191
Other fruit ________________________________________________________________________________
____________________________
________________
________________
________________________
____________________________
____________________________
HOW MANY TIMES A WEEK DO YOU EAT FRUITS? _____________
WE NOW WILL ASK YOU QUESTIONS ABOUT WHAT YOU USUALLY DRINK
BEVERAGES DESCRIPTION AMOUNT USUALLY
TAKEN
TIMES TAKEN CODE AMOUNT/DAY
Per day
Per week
Per month
Seldom/ Never
Water 4042
Tea Ceylon Rooibos
4038 4054
Coffee 4037
Sugar per cup of tea or coffee
White Brown
3989 4005
Milk per cup of tea or coffee
Fresh/long life whole 2718
What type of milk do you put in tea and/or coffee?
Fresh/long life 2% Goat
2772 2738
Fresh/long life/fat free (skimmed)
2775
Whole milk powder, reconstituted Specify brand: ____________________
2831
Skimmed milk powder, reconstituted Specify brand: ____________________
2719
Milk blend, reconstituted Specify brand: ____________________
2771
Whitener/non-dairy creamer Specify brand: ____________________
2751
Condensed milk (whole) 2714
Condensed milk (skim) 2744
Evaporated milk (whole) 2715
Evaporated milk (low-fat) 2827
None
Milk as such: What type of milk do you drink as such?
Fresh/long life/whole Fresh/long life/2% Fresh/longlife/fat free (skimmed) Goat
2718 2772 2775
2738
Sour / Maas 2787
Buttermilk 2713

192
BEVERAGES DESCRIPTION AMOUNT USUALLY
TAKEN
TIMES TAKEN CODE AMOUNT/ DAY
Per day
Per week
Per month
Seldom/ Never
Milk drinks Specify brands, Including milk supplements and type of milk used
Nestle Nesquik Milo Flavoured milk Other
4287 2735 2774
Yoghurt Drinking yoghurt Thick yoghurt, plain, fruit
2756 2732
Squash SixO Oros Lecol with sugar -artificial sweetener Kool Aid Other___________________________________
3990 3982 3982 3990 3982
Fruit juice Fresh/Liquifruit/Ceres/ 2866
"Tropica"/ mixtures with milk
2791
Fruit syrups Average Guava syrup
2865 2864
Fizzy drinks Coke, Fanta
Sweetened Diet
3981 3990
Mageu/Motogo 4056
Alcoholic beverages such as Sorghum beer
Sorghum beer Specify:
4039
Other , specify:
Beer average Wine Cider ____________________ ____________________ ____________________ ____________________ ____________________
4031 4033 4057
PLEASE INDICATE WHAT TYPES AND AMOUNTS OF SNACKS, PUDDINGS AND SWEETS YOU EAT:
FOODS DESCRIPTION AMOUNT USUALLY
EATEN
TIMES EATEN CODE AMOUNT/DAY
Per day
Per week
Per month
Seldom/ Never
Potato crisps/chips 3417
Peanuts Roasted, unsalted Roasted, salted
3452 3458
Cheese curls: Niknaks etc.
Average Savoury
3267 3418
Popcorn Plain (no salt and butter) Plain (salt and butter added) Sugar coated
3332
3359
Raisins (seeds) 4231
Chocolates Milk Kit Kat Peppermint crisp Specify types and names ____________________
3987 4024 3997
Candies Sugus, gums, hard sweets (specify) Peppermint
3986 4004
Sweets Toffees 3991

193
Hard boiled Fudge, caramels (specify)
3986 3991
Biscuits/cookies Specify type Home made plain Shortbread, butter Commercial, plain Commercial with filling
3233 3296 3216 3217
Cakes & tarts Chocolate, plain
3419
Pancakes/ crumpets
3344
Koeksisters 3231
Savouries Sausage rolls Samoosas - vegetable Samoosa - mutton Biscuits e.g. bacon kips Other: ___________________
2939 3414 3355 3331
Pudding: jelly 3983
Baked pudding Plain batter 3429
Instant pudding Skim milk Whole milk
3314 3266
Ice cream Commercial regular Commercial rich Soft serve Sorbet Ice lollies Chocolate coated individual ice creams (e.g. Magnum)
3483 3519 3518 3491 3982
Custard Home made, whole milk Ultramel
2716 2716
Cream Fresh 3520/ 3480
Other puddings (Specify):
HOW MANY TIMES A WEEK DO YOU EAT SNACK FOODS? _____________
SAUCES / GRAVIES / CONDIMENTS
FOODS DESCRIPTION AMOUNT USUALLY
EATEN
TIMES EATEN CODE AMOUNT/DAY
Per day
Per week
Per month
Seldom/ Never
Tomato Sauce Worcester sauce
3139 4309
Chutney Fruit 3168
Tomato 3114
Pickles 3866
Packet soups 3158
Beef/chicken stock 4029
Others:
WILD BIRDS, ANIMALS, INSECTS OR FRUITS AND BERRIES (hunted or collected in rural areas or on farms: (specify)

194
PLEASE MENTION ANY OTHER FOODS YOU EAT MORE THAN ONCE EVERY TWO WEEKS WHICH WE HAVE NOT TALKED ABOUT AND OR FOODS EATEN IN OTHER HOMES OR PLACES DURING THE PAST WEEK
FOOD DESCRIPTION AMOUNT USUALLY
EATEN
TIMES EATEN CODE AMOUNT/DAY
Per day
Per week
Per month
Seldom/ Never
ARE THERE ANY FOODS THAT YOU EAT WHICH WE HAVEN'T TALKED ABOUT? PLEASE LIST THEM.
FOODS DESCRIPTION AMOUNT USUALLY
EATEN
TIMES EATEN CODE AMOUNT/
DAY
Per day
Per week
Per month
Seldom/ Never
THANK YOU FOR YOUR CO-OPERATION AND PATIENCE.
GOOD BYE! ADAPTED FROM THE QUESTIONNAIRES OF THE THUSA STUDY (WITH ACKNOWLEDGEMENT TO THE RESEARCH GROUP OF PUCHO AND THE NATIONAL FOOD CONSUMPTION SURVEY

195
ANNEXURE F
Respondent number: 1-2
Interviewer: ________________ 3
24 Hour Physical Activity Recall for week day
Time of day Activity (Number): use attached coding list
12:00-12:30AM .
12:30-1:00 .
1:00-1:30 .
1:30-2:00 .
2:00-2:30 .
2:30-3:00 .
3:00-3:30 .
3:30-4:00 .
4:00-4:30 .
4:30-5:00 .
5:00-5:30 .
5:30-6:00 .
6:00-6:30 .
6:30-7:00 .
7:00-7:30 .
7:30-8:00 .
8:00-8:30 .
8:30-9:00 .
9:00-9:30 .
9:30-10:00 .
10:00-10:30 .
10:30-11:00 .
11:30-12:00PM .
12:30-1:00 .
1:00-1:30 .
1:30-2:00 .
2:00-2:30 .
2:30-3:00 .
3:00-3:30 .
3:30-4:00 .
4:00-4:30 .
4:30-5:00 .
5:00-5:30 .
5:30-6:00 .
6:00-6:30 .
6:30-7:00 .
7:00-7:30 .
7:30-8:00 .
8:00-8:30 .
8:30-9:00 .
9:00-9:30 .
9:30-10:00 .
10:00-10:30 .
10:30-11:00 .
11:00-11:30 .
11:30-12:00AM .
TOTAL PAL VALUE (A) .
For activities not reported in the recall, complete the frequency of the following:

196
Activity Duration Times/day Times/week Average/day PAL/hr
Carrying heavy items
.
Chopping wood .
Driving a car .
Food preparation .
Gardening (watering)
.
Gardening (mowing)
.
Housework .
Playing soccer .
Riding a bicycle .
Riding a car/taxi/bus
.
Running .
Shopping .
Skipping rope .
TOTAL PAL VALUE (B)
.
Final PAL Value (A+B) +1.1
.
Intensity and Impact of Various Activities on Physical Activity Levels in Adults (derived from Carrol & Johnson, 2004, Table 2-4, p.33)
PAL/10min PAL/30min
Bath/shower/washing yourself 0.005 0.015
Chopping wood 0.037 0.111
Driving a car 0.005 0.015
Eating 0.005 0.015
Food preparation 0.014 0.042
Gardening – watering plants 0.014 0.042
Gardening-mowing lawn 0.033 0.099
House work (moderate effort) 0.024 0.072
Playing soccer 0.088 0.264
Riding a bicycle 0.024 0.072
Riding a car/taxi/bus 0 0
Running 0.088 0.264
Sitting with light activity 0.005 0.015
Sitting without activity (TV) 0 0
Sleeping 0 0
Walking (3.2km/hr) 0.014 0.042
Walking (4.8km/hr) 0.022 0.066
Weight lifting 0.061 0.183

197
ANNEXURE G
ANNEXURE G

198

199
ANNEXURE H

200
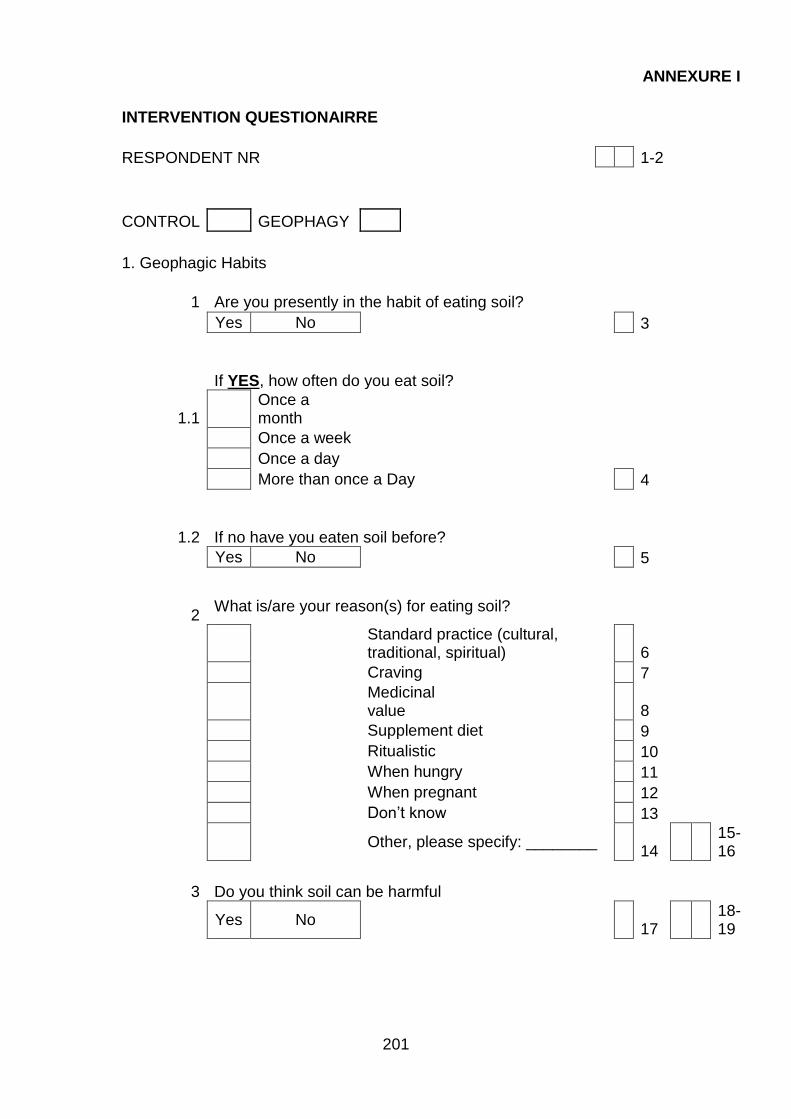
201
ANNEXURE I
INTERVENTION QUESTIONAIRRE
RESPONDENT NR
1-2
CONTROL GEOPHAGY
1. Geophagic Habits
1 Are you presently in the habit of eating soil?
Yes No
3
If YES, how often do you eat soil?
1.1
Once a month
Once a week
Once a day
More than once a Day
4
1.2 If no have you eaten soil before?
Yes No
5
2
What is/are your reason(s) for eating soil?
Standard practice (cultural, traditional, spiritual) 6
Craving
7
Medicinal value 8
Supplement diet
9
Ritualistic
10
When hungry
11
When pregnant
12
Don’t know
13
Other, please specify: ________ 14
15-16
3 Do you think soil can be harmful
Yes No
17
18-19

202
3.1 If yes specify
____________________________________
3.2 Which groups of people should not eat soil?
20-21
4
If a person does eat soil what can he or she do to improve their health?
22-27

203
FOOD BASED DIETARY GUIDELINES EVALUATION
I aI am going to ask you some questions. Please tell me if you agree or not agree.
5 Eat a variety of foods
Agree
28
Disagree
6 Starchy food should be the basis of most meals Agree
29
Disagree
7 Chicken fish, milk or eggs cannot be eaten daily Agree
30
Disagree
8 Eat plenty of vegetables and fruit everyday
Agree
31
Disagree
9 Dry beans, peas, lentils and soya should not be eaten regularly Agree
32
Disagree
10 Salt should be eaten sparingly
Agree
33
Disagree
11 Fats should be used sparingly
Agree
34
Disagree
12 Use food and drinks containing sugar as often as you like Agree
35
Disagree
13 Did you have access to the geophagy brochure that was Yes
36
distributed to you and the community.
No
14 Did you change anything after reading the brochure? Yes
37
If yes what did you change?
No
THANK YOU FOR YOUR COOPERATION

204
ANNEXURE J
GEOPHAGIA
PHASE 2
REFERRAL LETTER
Ms/Mr/Mrs/Dr/Prof ___________________________________
The following patient ___________________________________has participated in
a clinical study and the following have been observed and concluded.
___________________________________________________________________
___________________________________________________________________
___________________________________________________________________
___________________________________________________________________
___________________________________________________________________
___________________________________________________________________
___________________________________________________________________
___________________________________________________________________
___________________________________________________________________
___________________________________________________________________
___________________________________________________________________
___________________________________________________________________
___________________________________________________________________
___________________________________________________________________
For your further assistance and recommendations
Kind regards.
______________________________
Contact details: ___________________________

205
ANNEXURE K
INSTRUCTION MANUAL FOR FIELDWORKER
1. OBJECTIVES OF BROCHURE
The three objectives of the nutrition intervention brochure are the following:
Informing participants about the risk factors;
Describing the impact of geophagia or consumption of soil on their health and
Educating the participants about healthy eating habits.
Each objective will be discussed and explained in section 2.2.
2. NUTRITION INTERVENTION BROCHURE
2.1 Procedure
The following steps will be followed with each participant:
Greet the person and ask which language she prefers we talk to her in
English or Sotho?
Introduce yourself and other person(s)
Explain briefly that you have information to share regarding geophagia
or the consuming of soil
Ask her if you can continue
Start explaining the brochure: if the participant does not understand
English you will need to translate.
Inform the participant that she must please ask questions if she doesn’t
understand or if something needs to be repeated
2.2 Explaining the brochure
The brochure is developed in order to meet the objectives. Each objective must be
explained to each participant.
Objective 1: Informing participants regarding risk factors (danger) of eating soil
Information in brochure: “Soil binds important minerals such as iron, calcium and
zinc which are important for the body. Pregnant women and children should not eat
soil.”

206
Explanation: Minerals are inside food and your body needs the mineral like iron to
keep you blood healthy, calcium to keep your teeth strong and zinc to help you fight
sickness.
Women who are expecting a baby and children should not eat soil or ‘moby’ because
can make them sick.
Start with objective 2.
Objective 2: Explain danger of eating soil
Information in brochure: “The soil may contain dangerous items such as bacteria,
worms and heavy metals such as lead.”
Explanation: Show and explain the following pictures:
Bacteria: Can be found in soil and make you sick for example cramps and diarrhoea (running stomach)
Parasites/Worms Can also be found in soil and make you sick. Can grow inside you make you sick
Lead Toxic – make you very sick and can die of too much lead
Objective 3: Educate participants on healthy eating habits.
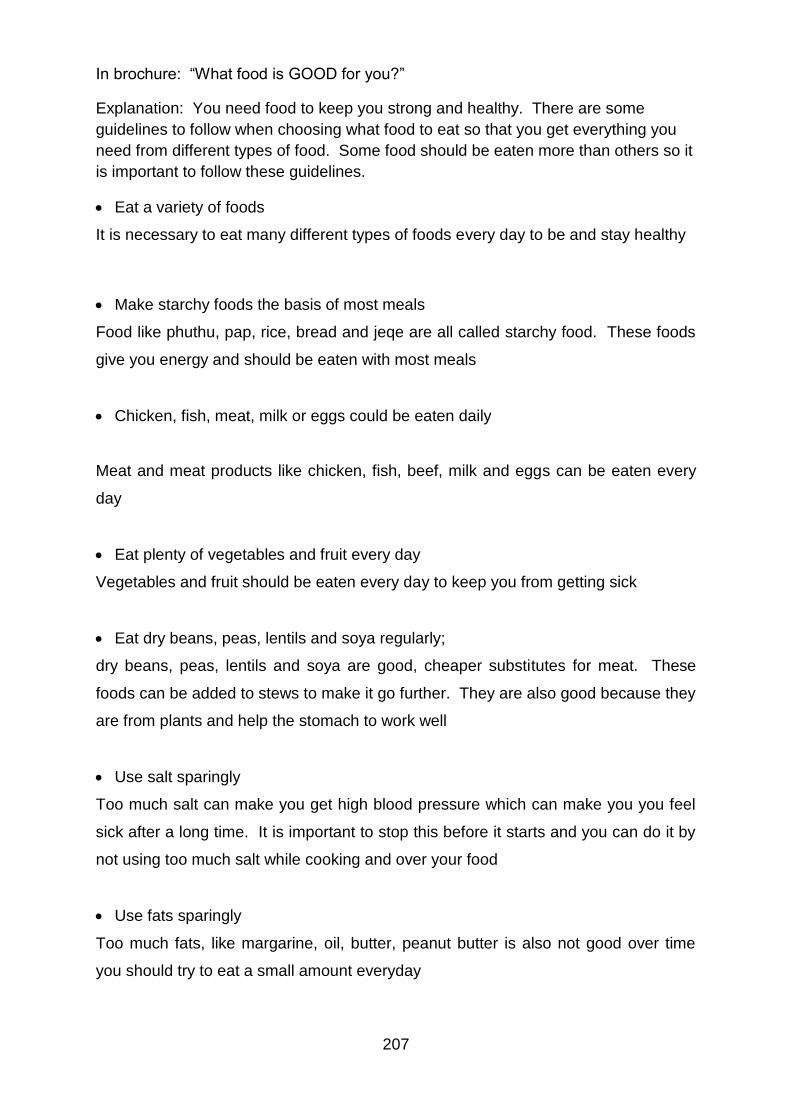
207
In brochure: “What food is GOOD for you?”
Explanation: You need food to keep you strong and healthy. There are some
guidelines to follow when choosing what food to eat so that you get everything you
need from different types of food. Some food should be eaten more than others so it
is important to follow these guidelines.
Eat a variety of foods
It is necessary to eat many different types of foods every day to be and stay healthy
Make starchy foods the basis of most meals
Food like phuthu, pap, rice, bread and jeqe are all called starchy food. These foods
give you energy and should be eaten with most meals
Chicken, fish, meat, milk or eggs could be eaten daily
Meat and meat products like chicken, fish, beef, milk and eggs can be eaten every
day
Eat plenty of vegetables and fruit every day
Vegetables and fruit should be eaten every day to keep you from getting sick
Eat dry beans, peas, lentils and soya regularly;
dry beans, peas, lentils and soya are good, cheaper substitutes for meat. These
foods can be added to stews to make it go further. They are also good because they
are from plants and help the stomach to work well
Use salt sparingly
Too much salt can make you get high blood pressure which can make you you feel
sick after a long time. It is important to stop this before it starts and you can do it by
not using too much salt while cooking and over your food
Use fats sparingly
Too much fats, like margarine, oil, butter, peanut butter is also not good over time
you should try to eat a small amount everyday

208
Drink lots of clean, safe water
Clean, water is important to drink because it is the main part of your body. Every
day, you must drink lots of clean, safe water
If you drink alcohol, drink it sensibly
Alcohol can hurt your body and make you very sick. If you do drink traditional beer,
do not drink every day and make sure you do not overdrink
Use food and drinks containing sugar sparingly and not between meals
Sweet tasting food is not good in big amounts. Try to eat a little bit of sweet things
but not every day
Be active
Do exercises example, walking, running, washing clothes etc. every day
These guidelines were used to educate the participants on healthy eating practices
and to be active (Annexures G, H).

209
SUMMARY
Geophagia is the most common type of pica, characterized by the urge to consume
clay or soil.
QwaQwa houses a very dense black African population and covers 254.2 km2. This
rural area with the largest concentration of Basotho's in South Africa is characterized
by a strong focus on traditional beliefs and practices, making it a favourable area to
investigate the phenomenon of geophagia. The main aim of this study was to
determine the nutritional status and risk factors associated with women practicing
geophagia in QwaQwa, South Africa. Socio-demographic factors, dietary intake,
anthropometry, physical activity and blood measures were investigated at baseline.
After the intervention, the impact of the nutrition education on knowledge and habits
related to geophagia were determined.
The study design comprised of an observational epidemiological study which
included an exposed (geophagia) and non-exposed (control) group followed by an
intervention phase. An assessment of the impact of the intervention was also
conducted. A logistical regression analysis was performed in order to identify factors
that were likely to be associated with the practice of geophagia. At baseline, the
sample consisted of 69 participants, of whom 42 were in the geophagic group (G)
and 27 in the control group (C).
The majority of participants in both groups (G=77.5%; C=70.4%)were unmarried.
Sotho was spoken by more than 90% of participants. A large percentage of
participants in both groups had an education level of grade 11 - 12 (G = 42.9% and
C = 51.9%) and were unemployed (G = 90.48% and C = 74.1%). Electricity was
used by both groups as the main source of energy for cooking (G = 83.3% and C =
85.2%), followed by paraffin (G = 11.9% and C = 7.4%). The primary employment
status of the group with geophagia was part-time or piece jobs (54.8%), while in the
control group a full-time wage earner was present in 48.15% of households. The
logistic regression showed that women who were wage earners and those that
owned a refrigerator (and thus had a higher socio-economic status), were less likely
to practice geophagia.

210
A food frequency questionnaire was implemented to determine dietary intakes of
participants. The mean total energy intake for the group with geophagia and the
control group were similar at 10324.31 ± 2755.00 kJ and 10763.94 ± 2556.30 kJ
respectively, which was considered high. The macronutrient distribution was within
the recommended levels. Mean total protein intake was also similar in both groups (G
= 75.59 ± 20.12 g; C = 85.55 ± 29.07 g) at 12.5% (G group) and 13.6% (C group) of
total energy intake. The percentage total energy intake from fat was 33.1% for the
geophagia group and 31.5% for the control group. Both groups had intakes that
were higher than the estimated average requirement (EAR) for dietary iron (G =
11.60 mg; C = 13.49 mg). The intake of nutrients that may be related to iron
metabolism, are vitamin A, vitamin C and folate.
Standardized techniques were used to determine anthropometric measurements
namely body mass index (BMI), waist circumference, and hip circumference. The
mean BMI of both groups of participants fell within the overweight category (G =
25.59 kg/m2; C = 25.14 kg/m2).
The physical activity levels of participants were determined by recalling the physical
activity of the previous day. Mean levels of physical activity fell in the low active
category for both groups. Logistic regression indicated that women with a waist:hip
ratio above 0.8 (android category) were less likely to practice geophagia.
The mean serum iron levels of the geophagia group were significantly lower (p =
0.000) than that of the control group (G = 6.92 µmol/L; C = 13.75 µmol/L). There
was also a significant difference in the serum haemoglobin (G = 11.23 g/L; C = 13.26
g/L; p = 0.00) and serum ferritin levels (G = 11.98 µg/L; C = 42.31 µg/L; p = 0.00)
between the geophagia and control groups. Serum transferrin and serum transferrin
saturation levels also differed significantly between groups (G = 3.21; 7.97 and C =
2.68; 7.78; p = 0.00). The logistic regression also established which of the measured
blood variables were significantly affected by the practice of geophagia. A highly
significant association between the practice of geophagia and the cluster of
metabolic indicators of iron status, including serum iron, haem-iron, non-haem iron,
haemoglobin, ferritin, transferrin, and transferrin saturation was identified.

211
The majority (57.1%) of participants consumed soil once a day and 42.9% more than
once a day. The craving for soil was reported by most of the participants as the
reason that they practiced geophagia (97.6%) and a preference for whitish clay was
also found.
A number of habits related to geophagia changed after the intervention. In this study
the nutrition education programme was effective in improving some aspects of a
participant's knowledge and practices related to geophagia, while others remained
unchanged.
The intervention was successful in reducing the consumption of soil per day and
almost forty per cent of participants in the group with geophagia stopped consuming
soil after the intervention. Before the intervention, more than fifty per cent of
participants did not know that pregnant women and children should not consume
soil, while more than sixty per cent knew in the control group and all the partiipants
in the geophagia group after the intervention.
Geophagia was confirmed to be a risk factor for iron deficiency in black women
between 18 and 45 years of age. Factors that were identified as decreasing the
likelihood of having geophagia included being a wage earner, owning a refrigerator,
having a greater WHR (waist-to-hip ratio) and not having iron deficiency.
The significantly strong association between geophagia and iron deficiency
emphasizes the importance of identifying the practice of geophagia in women,
especially during their child bearing years. The intervention that was developed for
this study could be applied in a wider setting to address the problem of geophagia
and its harmful effects on health.
Key words: geophagia, iron deficiency anaemia, dietary intake, anthropometry

212
OPSOMMING
Geofagie is die algemeenste vorm van pika wat gekenmerk word deur 'n sterk drang
om grond te eet.
QwaQwa huisves 'n dig bevolkte swart Afrika bevolking en beslaan 'n area van 254.2
km2. Hierdie Suid-Afrikaanse plattelandse gebied bestaan hoofsaaklik uit Basotho's
wat gekenmerk word deur 'n sterk fokus op tradisionele oortuigings en gewoontes,
en dus dit 'n gunstige area is om die verskynsel van geofagie te ondersoek. Die
hoofdoel van die studie was om die voedingstatus en risikofaktore te bepaal wat
geassosieer word met vroue wat geofagie in QwaQwa, Suid-Afrika beoefen. Sosio-
demografiese faktore, voedselinname, antropometrie, fisiese aktiwiteit en bloed-
waardes was tydens basislynopname ondersoek. Na 'n intervensie is die impak
daarvan op die kennis en gewoontes wat met geofagie geassoseer word, bepaal.
Die studie-ontwerp het bestaan uit 'n observerende epidemiologiese studie wat uit 'n
eksperimentele (met geofagie) en kontrole (sonder geofagie) groep bestaan het,
gevolg deur 'n intervensiefase. 'n Bepaling van die impak van die intervensie was
ook uitgevoer. 'n Logistieke regressiewe analise is uitgevoer om faktore te
identifiseer wat waarskynlik met die praktyk van geofagie geassosieer word. Met die
basislynopname was daar 'n totaal van 69 vrouens, waarvan 42 in die groep met
geofagie (G) geval het en 27 in die kontrole groep (K).
Die meerderheid vroue, in beide groepe (G=77.5%; C= 70.4%) was ongetroud.
Sotho was die spreektaal in 90% en meer van die deelnemers. 'n Groot persentasie
deelnemers in beide groepe het 'n onderwysvlak van graad 11 - 12 voltooi (G =
42.9% en K = 51.9%) en was werkloos (G = 90.48% en K = 74.1%). Elektrisiteit was
deur beide groepe as hoofbron van energie vir kookdoeleindes gebruik (G = 83.3%
and K = 85.2%), gevolg deur paraffien (G = 11.9% en C = 7.4%). Die primêre bron
van werk in die groep met geofagie (54.8%) was deeltydse en stukwerk, terwyl in die
kontrole groep 'n voltydse loonwerker in 48.15% van huishoudings voorgekom het.
'n Logistieke regressie het aangedui dat vrouens wat loonwerkers was en 'n yskas
besit (en dus 'n hoër sosio-ekonomiese status gehad het), waarskynlik minder
geneig sal wees om geofagie te beoefen.

213
'n Voedselfrekensie-vraelys is gebruik om die voedselinname van deelnemers te
bepaal. Die gemiddelde energie-inname in die groep met geofagie en die kontrole
groep was dieselfde (10324.3 ± 2755.0 kJ en 10763.9 ± 2556.3 kJ onderskeidelik),
wat as hoog beskou word. Die makro voedingstof verspreiding was binne die
aanbevole vlakke. Die gemiddelde totale proteïeninname was ook soortgelyk tussen
albei groepe (G = 75.6 ± 20.1 g; K = 85.6 ± 29.1 g) met 12.5% (G-groep) en 13.6%
(K-groep) van die totale energie-inname. Die totale persentasie energie afkomstig
vanaf vetinname was 33.1% vir die groep met geofagie en 31.5% vir die kontrole
groep. Beide groepe het hoër innames as die geskatte gemiddelde aanbevelings vir
yster (G = 11.6 mg; C = 13.5 mg) gehad. Die inname van nutriënt wat heel moontlik
met ystermetabolisme geassosieer word, is vitamien A, vitamien C en folaat.
Standaardtegnieke is gebruik om antropometriese metings, naamlik ligaamsmassa
indeks (LMI), middelomtrek en heupwydte te bepaal. Die gemiddelde LMI in beide
groepe het in die oormassa kategorie geval (G = 25.6 kg/m2; K = 25.1 kg/m2).
Die fisiek aktiwiteitsvlak van deelnemers is bepaal deur die vorige dag se fisiek
aktiwiteite te herroep. Die gemiddelde fisiek aktiwiteitsvlak van albei groepe het in
die lae aktiewe kategorie geval en was nie betekenisvol verskillend nie (p = 0.45). 'n
Logistieke regressie het aangedui dat vrouens met 'n middel:heup-verhouding van
bo 0.8 (androïede kategorie), minder geneig was om geofagie te beoefen.
Die gemiddelde serumysterwaardes in die groep met geofagie was betekenisvol laer
(p = 0.000) teenoor die kontrole groep (G = 6.92 µmol/L; K = 13.75 µmol/L). Daar
was ook 'n betekenisvolle verskil in die serumhemoglobien (G = 11.23 g/L; K = 13.26
g/L; p = 0.00) en serumferritienvlakke (G = 11.98 µg/L; K = 42.31 µg/L; p = 0.00)
tussen die groep met geofagie en die kontrole groep. Serumtransferrien en serum-
transferrin-versadigingsvlakke het ook betekenisvol verskil tussen die twee groepe
(G = 3.21; 7.97 en K = 2.68; 7.78; p = 0.00). Die logistieke regressie het bepaal
watter bloedwaardes betekenisvol deur geofagie geaffekteer word. 'n Hoogs
betekenisvolle assosiasie is gevind tussen die gewoonte van geofagie en die cluster
van metaboliese indikatore van ysterstatus, wat serumyster, heem-yster, nie-
heemyster, hemoglobien, ferritien, transferrien en transferrien-versadigingsvlakke
insluit.

214
Die meerderheid deelnemers (57.1%) het grond een keer per dag geëet en 42.9%
meer as een keer per dag. Die sterk drang na grond is deur die meeste deelnemers
(97.6%) as rede vir die beoefening van geofagie gegee en ook verkieslik wit klei. 'n
Aantal gewoontes wat met geofagie geassosieer word, het wel na die intervensie
verander. In hierdie studie was die voedingsonderrigprogram suksesvol in sekere
aspekte deurdat die deelnemers se kennis en praktyke wat met geofagie
geassosieer word, verbeter het, terwyl ander aspekte onveranderd gebly het.
Die intervensie was suksesvol deurdat ongeveer veertig persent van deelnemers die
praktyk van geofagie laat vaar het. Meer as vyftig persent van deelnemers het voor
die intervensie aangedui dat hulle nie kennis dra dat vrouens en kinders nie geofagie
moet beoefen nie. Daarenteen was meer as sestig present in die kontrole groep en
al die vrouens in die geofagie groep na die intervensie daarvan bewus.
Geofagie is bevestig as 'n risikofaktor vir ystergebrek in swart vroue tussen die
ouderdom van 18 en 45 jaar. Faktore wat geïdentifiseer is om nie geofagie te
beoefen nie, was deur 'n loonwerker te wees, 'n yskas te besit, om 'n verhoogde
(>0.8) middel-tot-heup verhouding te hê (androide vet verspreiding) en nie aan
ystergebrek te lei nie.
Die betekenisvolle verband tussen geofagie en ystergebrek beklemtoon die
belangrikheid om die praktyk van geofagie in vrouens te identifiseer, veral
gedurende hul fertiliteitsjare. Die intervensie wat vir hierdie studie ontwikkel is, kan
in 'n groter mate toegepas word om die probleem en uitwerking van geofagie op
gesondheid aan te spreek.
Sleutelwoorde: geofagie, ystergebrekanemie, dieetinname, antropometrie