nutrition & oral health - semmelweis...
TRANSCRIPT

Nutrition & Oral Health
Dr. Gábor Varga
Department of Oral Biology
2016


What did we learn last fall?
• GERD and GU lead to oral symptoms
such as: bad breath, enamel erosion,
discolored teeth, altered taste, heart burn,
bloating
• As long as the underlying conditions are
controlled and understood the prognosis
of oral treatment is good. Any dental
treatment is preceeded by treatment of
GU and GERD


Components of the diet
(draft of the lecture)
Macronutrients
• Proteins and amino acids
• Carbohydrates
• Fats and oils
• Water
Micronutrients
• Vitamins
• Minerals
• Non-nutrients
• Insoluble and soluble fibers
Smoking and alcohol consumption

Energy requirements
• The energy of consumed food that is
necessary for long term balance of body
weight and body composition, and also
covering all acivities.
• Constituents:
basic metabolic rate
+ energy to cover all activities

Flow-chart for energy metabolism
A Energy
uptake
Energy store
(adipose tissue)
Organism (biological and
psychological regulation)
Energy
utilization

Causes of obesity

Intermedier metabolism of nutrients
and mobile energy stores

Characteristics of macronutrients
RQ ENERGY
kJ/g ENERGY
kcal/g
PROTEIN 0,8 16,8 4,0
CARBO- HYDRATE 1,0 16,8 4,0
FAT 0,7 37,8 9,0
ENERGY-
EQUIVALENT kJ/l O2
18,8
21,1
19,6
ENERGY-
EQUIVALENT kcal/l O2
4,5
5,0
4,7

Proteins
11-13% of total energy necessity

Protein necessities
• The minimal necessary quantity of
proteins that keeps nitrogen balance
steady (1,0 g/kg b.w.).
• Under balanced conditions, the uptake
and loss of nitrogen is equal.

Reasons for protein deficiency
• quantitative deficiency
• qualitative deficiency
(shortage of essential aminoacids)
• shortage in energy uptake
Usually a combination: qualitative and quantitative
deficiency, and also vitamin and mineral deficiency
together:
Protein-energy undernutrition - PEU

Patients with marasmus
have balanced starvation
Kwashiorkor patients, also known
as sugar babies

Carbohydrates
50-60% of energy necessity

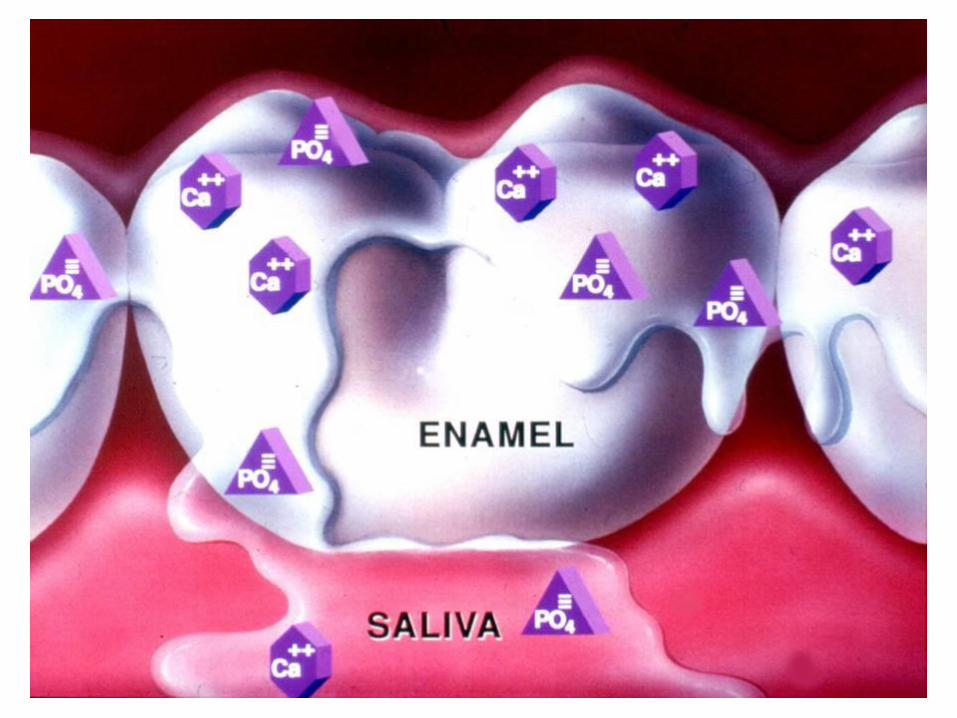


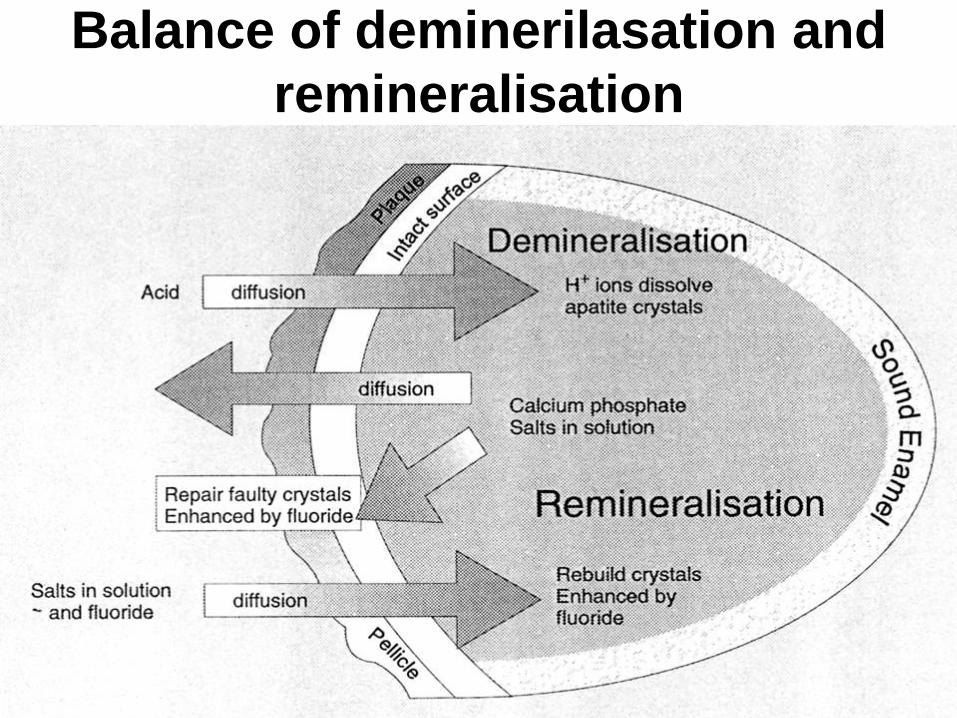
Balance of deminerilasation and
remineralisation

Harmful effects of high
carbohydrate diet in the oral cavity
• Dental caries
mainly sucrose, but other sugars and even
starch can feed bacteria
• Dental malocclusion
reduction of mandibular in size, and
functional inactivity of masticatory muscles

Fat
20-40% of total energy necessity

Function of fats
• Energy supply
• Nutrient store
• Carrier of vitamins (vit. A and D)
• Saturated vs unsaturated: Unsaturated fats are favourable Omega-3 fatty acids – from fish – are healthy
(fats are – from a viewpoint of cariology – cariostatic)

VITAMINS
Vitamin A
A1 – retinol
A2 - 3-dehidroretinol
carotinoids (A provitamins, e.g. β-carotin)

Vitamin A deficiency
• Epithel cell hyperplasia
• Keratinization of epithelium, mucosa, gingiva, salivary gland ducts
• Inactivation of osteoclasts –
thickening of bones
• Degeneration of ameloblasts
enamel hypoplasia
• Experimental withdrawal in rodents: dentin development disturbance calcification of parodontal ligaments

Effect of vitamin A deficiency in rats:
asymmetric and abnormal dentin formation
in the incisors

B vitamins metabolic intermediers, cofactors
B2, B3, B6, B12, folic acid, etc
Deficiency leads to deformation of the lip and oral mucosa
Crack of lip commisure – Cheilosis angularis
Atrophy of tongue papillas
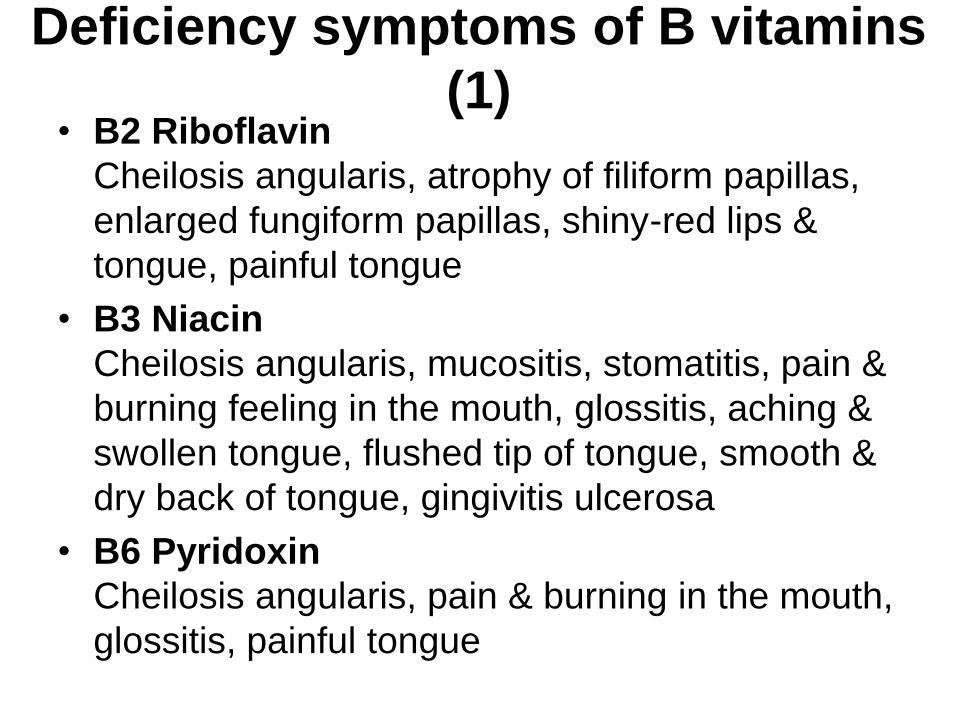
Deficiency symptoms of B vitamins
(1)
• B2 Riboflavin
Cheilosis angularis, atrophy of filiform papillas,
enlarged fungiform papillas, shiny-red lips &
tongue, painful tongue
• B3 Niacin
Cheilosis angularis, mucositis, stomatitis, pain &
burning feeling in the mouth, glossitis, aching &
swollen tongue, flushed tip of tongue, smooth &
dry back of tongue, gingivitis ulcerosa
• B6 Pyridoxin
Cheilosis angularis, pain & burning in the mouth,
glossitis, painful tongue

Deficiency symptoms of B vitamins
(2)
• B12 Cyanocobalamin Cheilosis angularis, pain & burning in the mouth, mucositis, stomatitis, glossitis, gingiva bleeding, oral paresthesia (numbnedd & itching in the mouth), slower recovery of wounds, aphta-like ulcers
• Folic acid Cheilosis angularis, mucositis, stomatitis, pain & burning in the mouth, glossitis, increasing disposition for oral candidiasis, swollen tip and back of tongue, bare & pale back of tongue
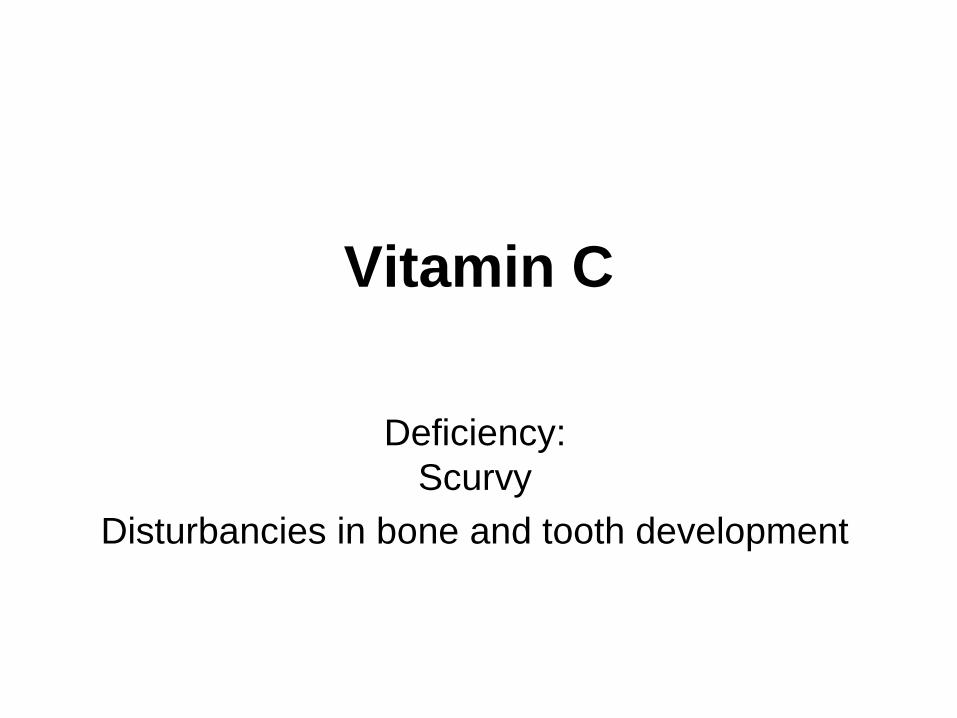
Vitamin C
Deficiency:
Scurvy
Disturbancies in bone and tooth development

Collagen – three polypeptide chains forming a rope

Overview of collagen biosynthesis

Hydroxylation during collagen
biosynthesis

Stages in collagen synthesis - rope formation

Effects of
vitamin C
deficiency on
tooth and
bone
development
in guinea
pigs

Vitamin D

Regulation of bone metabolism
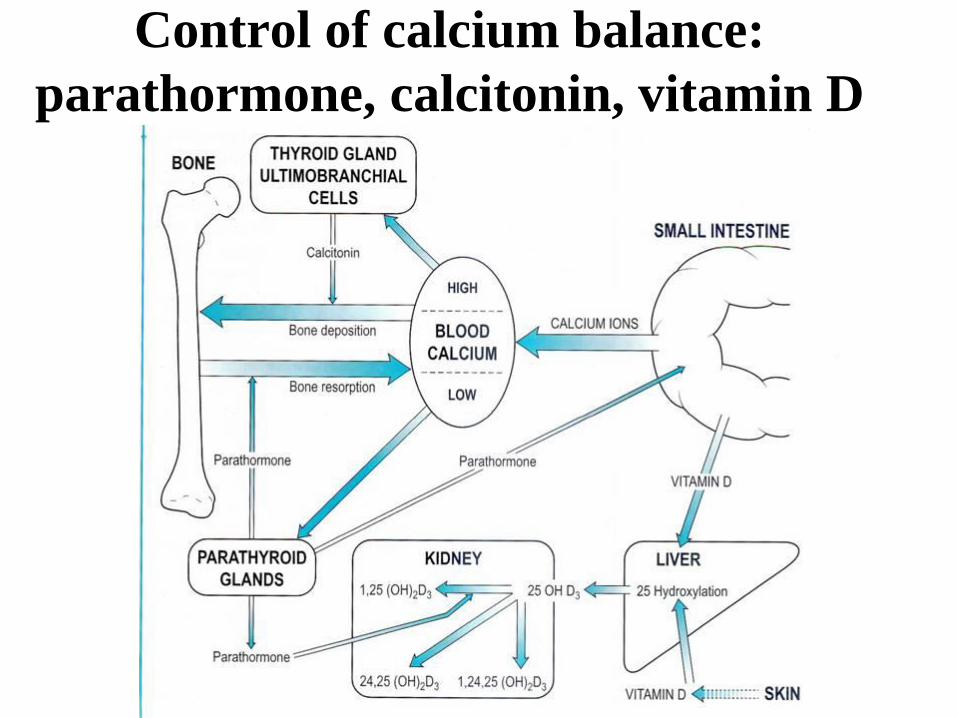
Control of calcium balance:
parathormone, calcitonin, vitamin D

Effect of active vitamin D on epithelial
cells enhanced calcium absorption

+

Osteomalacia - Osteoporosis
Normal bone Osteomalacia Osteoporosis
Ca Ca
matrix matrix matrix
Ca
Changes in proportion of mineral (Ca)
matrix and water/air phases

Vitamin D deficiency in the oral
cavity • Predentin widens, calcification time is elongated
• Dentin-predentin outline becomes irregular
• Enamel hipoplasia after long-term D vitamin
deficiency (debatable, further proofs needed)
- No significant change in tooth calcification,
because their calcification activity is stronger
than that of bones; and because there is no
remodeling in the dental minerals (vs. bone).

Vitamin K
Cofactor of thrombosis factor- and
Gla protein synthesis
Deficiency effects on bones &
teeth not known

Formation of γ-carboxyglutamyl residue

Structural basis interactions between mineral
phase and Gla protein osteocalcin (BGP)
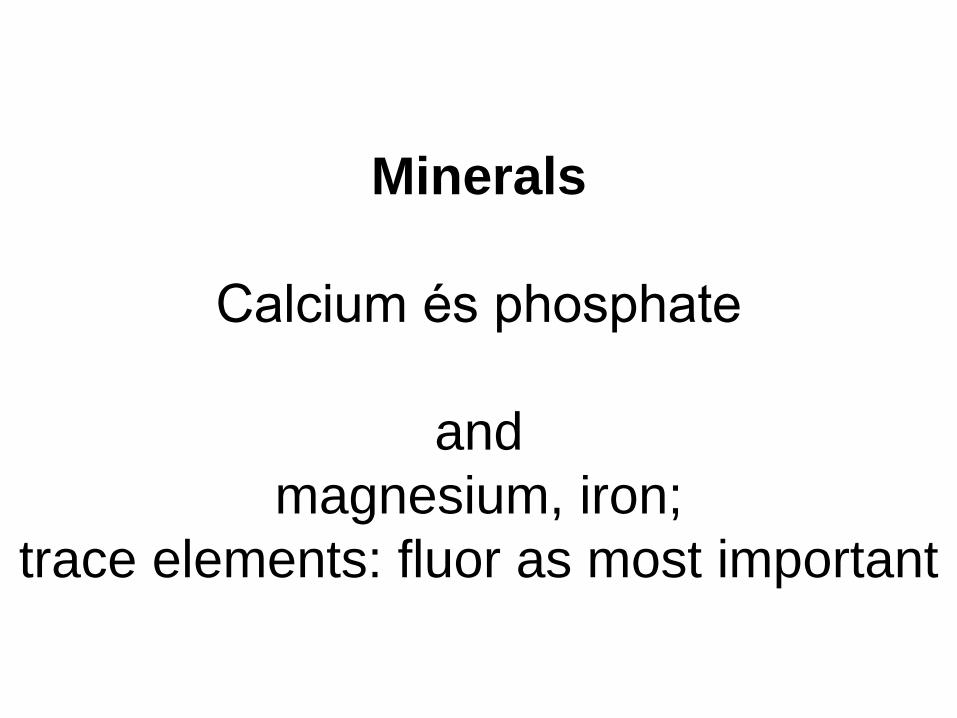
Minerals
Calcium és phosphate
and
magnesium, iron;
trace elements: fluor as most important

Phosphate metabolism in a young adult

Calcium homeostasis
Intake
1000 mg
Intestine
Faeces
850mg
300 mg
125 mg 175 mg
900 mg
ECF calcium
10000 mg 9825 mg
175 mg Kidney
500 mg
Bone
meta-
bolism
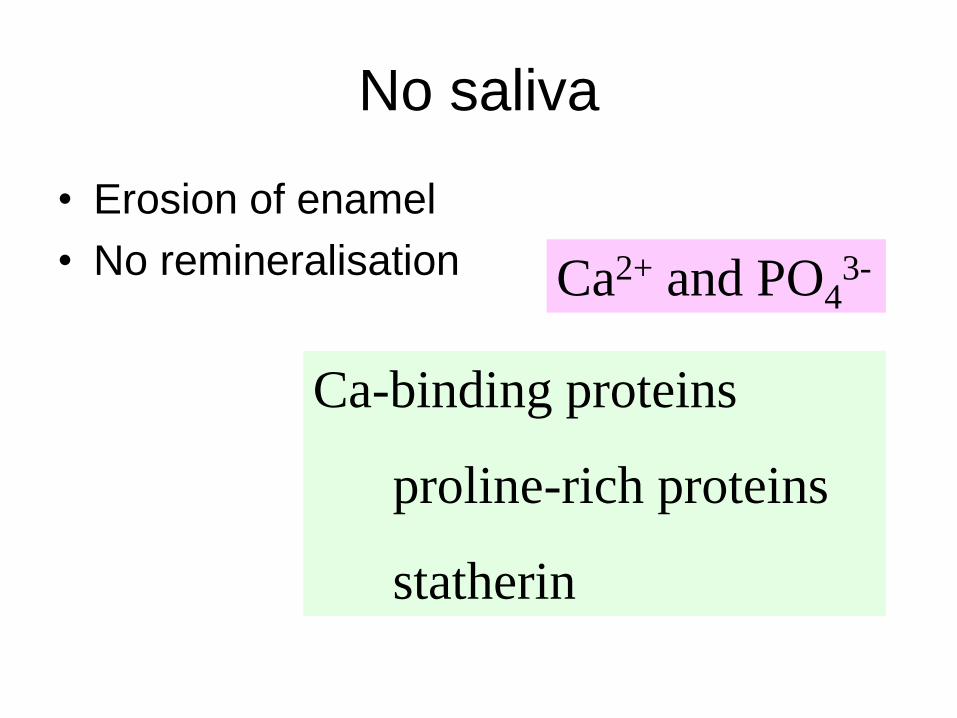
No saliva
• Erosion of enamel
• No remineralisation Ca2+ and PO43-
Ca-binding proteins
proline-rich proteins
statherin

Composition - inorganic
Na +
6 - 80 mmol/L
Cl -
17 - 30 mmol/L
K +
20 - 30 mmol/L
Ca 1 - 2 mmol/L
P 2 - 23 mmol/L
HCO3+
2 - 80 mmol/L

Smoking and alcohol
consumption
Effects on the oral precancerous
and tumor formation

Oral
leukoplakia

Oral
carcinoma

Bánóczy 1977

Annual new cancer cases for both gender, Hung. National Cancer Register in 2001 (58
772 tumor, 51 136 beteg)
Lung 8827
Colorectal (colon & rectum) 7600
Skin 6379
Breast 5730
Lymphatic- and haemopoietic system 3034
Oral cancer 2993
Prostate 2304
Stomach 2175
Urinary bladder 2091
Kidney 1535
Pancreas 1466
Melanoma 1286
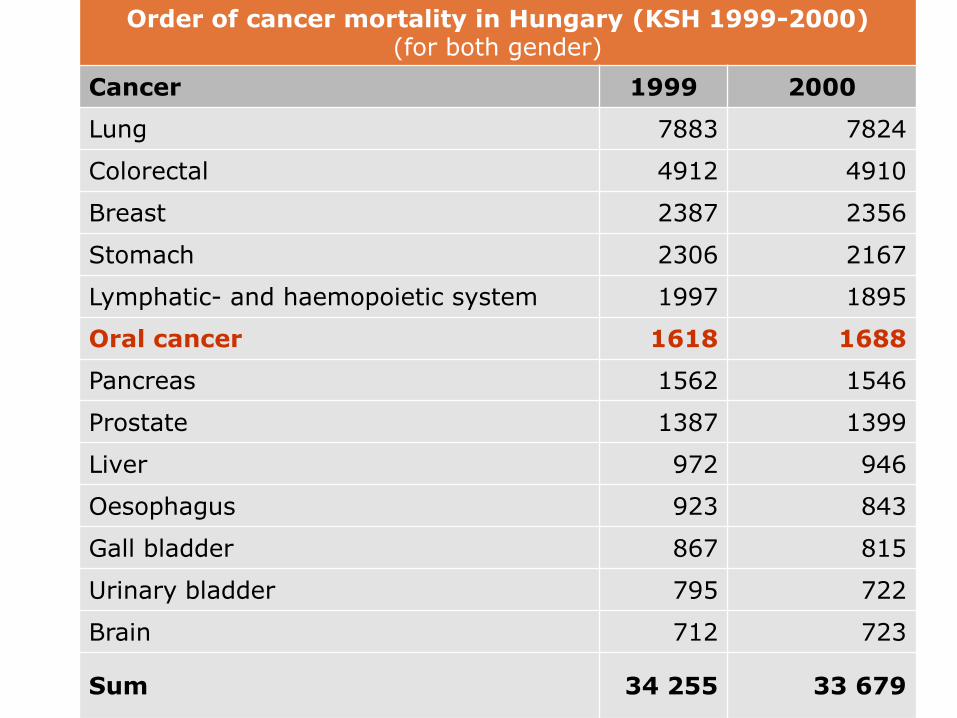
Order of cancer mortality in Hungary (KSH 1999-2000) (for both gender)
Cancer 1999 2000
Lung 7883 7824
Colorectal 4912 4910
Breast 2387 2356
Stomach 2306 2167
Lymphatic- and haemopoietic system 1997 1895
Oral cancer 1618 1688
Pancreas 1562 1546
Prostate 1387 1399
Liver 972 946
Oesophagus 923 843
Gall bladder 867 815
Urinary bladder 795 722
Brain 712 723
Sum 34 255 33 679

Growth dynamics of six malignant tumours with great mortality rate in 25 years (1975-1999)
Cancer
No. of cases
Incre- ment
% 1975 1999
Oral cancer 462 1618 250
Trachea-, bronchus-, lungcancer 4169 7883 89
Colon- and rectumcancer 3025 4912 62
Pancreas 1076 1562 45
Breast cancer 1650 2381 44
Prostate cancer 1196 1387 16

Mortality rate in Hungary from 1960
0
100
200
300
400
500
600
1960
1964
1968
1972
1976
1980
1984
1988
1992
1996
%
száj-garat
daganatok
összes daganat
összhalálozás
year
Oral- and
pharynx cancers
All cancers
Total mortality

The ratio of smokers in
leukoplakia patients
Author Year n Leukoplakia
%
Renstrup 1958 90 25.5
Bruszt 1962 130 Nearly100
Pindborg 1971 365 32.3 (cheroots)
Roed-Petersen 1973 450 7.1 (snuff)
Sonkodi 1974 51 82.3
Bánóczy 1991 104 86.5
Dombi 1996 167 97

The prevalence rate of oral
leukoplakia among smokers and
non-smokers Authors Year Non-
smokers
Smokers All examined
persons
n Lpl.
%
n Lpl.
%
n Lpl.
%
Pindborg 1967 6669 0.03 3301 9.9 10000 3.2
Mehta 1969 674 - 2851 7.3 3785 5.5
Roed-Petersen 1972 5530 0.2 4452 6.3 9982 2.9
Baric 1982 443 3.8 482 22.8 925 13.7
Rosabal-Lopez 1985 110 - 199 19.1 309 12.2
Bánóczy 1991 5410 0.26 2410 3.73 7820 1.3
Dombi 1996 2350 0.22 2684 6.03 5034 3.3

Blot et al. 1988

Summary
Macronutrients
• Proteins and amino acids
• Carbohydrates
• Fats and oils
• Water
Micronutrients
• Vitamins
• Minerals
• Non-nutrients
• Insoluble and soluble fibers
Smoking and alcohol consumption


