nutrition management in renal filure -...
TRANSCRIPT

Nutrition Management in Renal Disease
Dr. Inge Permadhi MS., SpGK

Kidney functions• Excretory of waste products (urea) and drugs • Regulation to maintain homeostatic balance
from fluids, electrolytes, and organic solutes– 1600 L/d blood filtering 180 L ultrafiltrate 1.5 L/d
urine excreted• Endocrine with diverse metabolic effects :
– 1,25 (OH)2D3 (25 (OH)D2 1,25 (OH)2D3)– Erythropoietin– Renin synthesis (angiotensinogen angiotensin I)
• Metabolism

AA and protein metabolism in the human kidney
The role of kidney in the homeostasis of protein :• Synthesis of NEAA : serine, tyrosine, arginine,
threonine, lysine, taurine, and tryptophane• Degradation :catabolism of low-molecular weight
protein (< 50.000 Dalton) as insulin, C-peptide, GH, leptin etc)
• Filtration and reabsorption : 50 – 70g/d AA filtered 97-98% reabsorbed by the proximal tubules.
• Urinary excretion of AA : urea
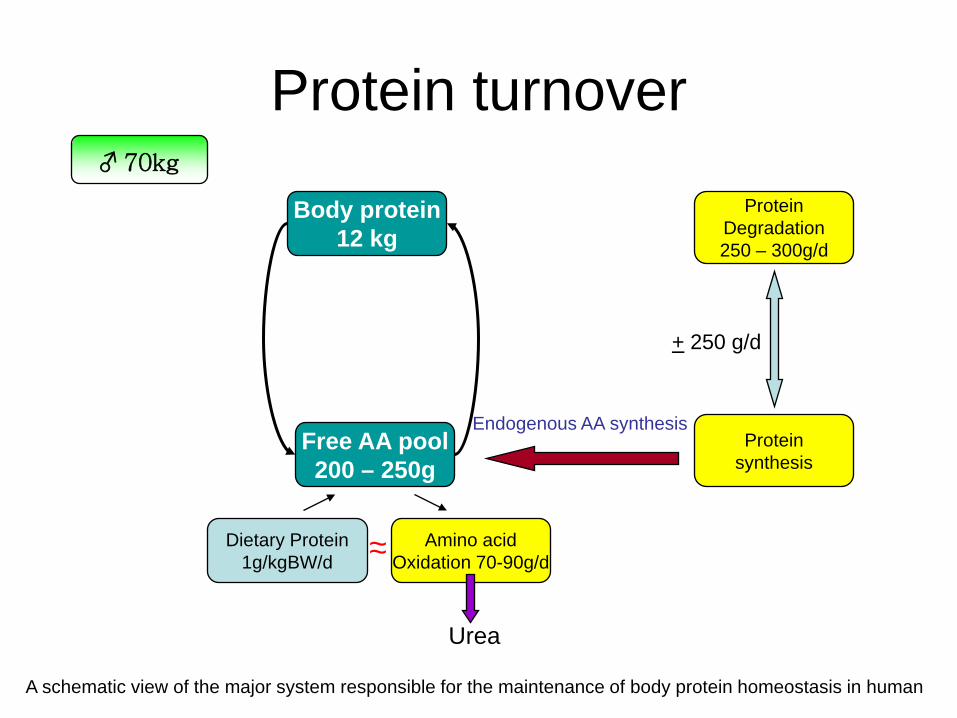
Protein turnover
Body protein12 kg
Free AA pool200 – 250g
ProteinDegradation250 – 300g/d
Proteinsynthesis
Dietary Protein1g/kgBW/d
Amino acidOxidation 70-90g/d
Urea
Endogenous AA synthesis
+ 250 g/d
A schematic view of the major system responsible for the maintenance of body protein homeostasis in human
♂ 70kg
~~
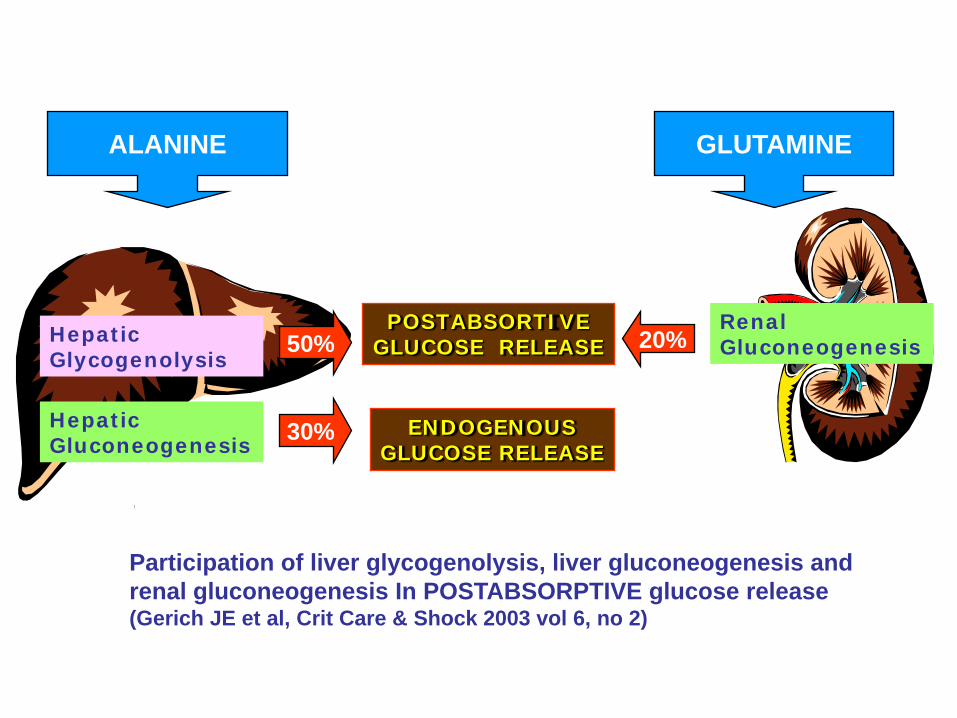
HepaticGlycogenolysis
HepaticGluconeogenesis
POSTABSORTIVEGLUCOSE RELEASE
RenalGluconeogenesis
Participation of liver glycogenolysis, liver gluconeogenesis and renal gluconeogenesis In POSTABSORPTIVE glucose release(Gerich JE et al, Crit Care & Shock 2003 vol 6, no 2)
50%
30%
20%
ALANINE GLUTAMINE
ENDOGENOUSGLUCOSE RELEASE


AA and Protein metabolism in renal failureProtein
degradationProtein
synthesis
Endogenous AA synthesisby the kidney
Increased by:
-acidosis/cortisol
-Insulin resistance (?)
-Micro inflammation (?)
Decreased by:
-Resistance tp GH/IGF-1
-Low nutrient intake
-Hemodialysis
-Peritoneal dialysis
-Altered AA metabolism
-Micro inflammation ? = cytokine
Body protein
Free AA pool
Dietaryprotein
Amino acidoxidation
Reduced by:
-anorexiaIncreased by:
-acidosis

KIDNEYFAILURE
metabolicacidosis
oxidation inmuscles
BCAA↓Valine ↓ ↓Leucine ↓Isoleucine ↓
defectivephenylalaninehydroxylation
Tyrosine ↓
Threonine ↓Lysine ↓Serine ↓
decreaseproduction
Tryptophan ↓reduceprotein bindingarginine ↓
Glycine ↑Citruline ↑Cystine ↑Aspartate ↑Methionine ↑Methyl-histidine ↑
Essential AANon-essential AASpecial AA
Mitch WE. Handbook of Nutrition and the Kidney, 2003
**
**
**
**synthesis by renal >>
***
*synthesis by renal <

SKELETAL MUSCLEprotein breakdown(relative) protein synthesisBCAA oxidation (excess AA)Intracellular glutamine levels
Glutamine effluxGlutamine synthesis
Alanine synthesis
LIVERAcute phase protein synthesisAlbumin synthesisAA oxidation (excess AA) Gluconeogenesis from AAsGlutamine reqGlutamine utilizationUrea synthesis
KIDNEYGlutamine reqGlutamine utilizationGluconeogenesis
ALANINE, GLUTAMINE
Urea Ammonium excretion
AA and PROTEIN Metabolism during Renal FailureCatabolic hormones:•Cortisol•Glucagon•Cathecolamines

Changes in Protein and Amino Acid Metabolism
• Protein catabolism especially from skeletal muscle.
• Protein synthesis• Redistribution amino acids from muscle to the
liver.– Hepatic gluconeogenesis and ureagenesis – Hepatic protein synthesis and secretion of acute
phase protein is stimulated.
•Metabolic acidosis : Acidosis causes the elimination of H+ is diminished increase in net protein breakdown increased production of H+


Potential factors in Uremic Insulin Resistance:Accumulation of uremic toxins HyperparathyroidismMetabolic acidosisRelative vitamin D deficiencyAnemia
Carbohydrate intolerance
•Insulin resistance•Insulin secretion•Insulin clearance•Plasma insulin•Insulin sensitivity

LiverGluconeogenesis Glycogenolysis
KidneyGluconeogenesis
Insulinresistance Insulin Dependent Tissue
GlucoseUptake
SkeletalMuscle
GlucoseUptake
GlucoseUptake
Glicolysis
AdiposeTissue Kidney
Insulinresistance
Glucose uptake
Glycolysis
Non Insulin Dependent Tissue
Lactate Alanine
All other tissue such as: brain, kidney, immune tissue, wound tissue, lung
Gluconeogenesis
FutileCycle
Glucose Plasma
Carbohydrate Metabolism during Insulin Resistance
LACTATE
ALANINE,
GLYCEROL
Renal insufficiency may affect the body’s ability to maintain adequate blood sugar levels

Uremic Hypoglycemia
• Renal insufficiency may affect the body’s ability to maintain adequate blood sugar levels
• Uremic carbohydrate intolerance• Poor caloric intake• Impaired hepatic glycogenolysis• Certain medication use• Prolonged insulin action• Impaired conterregulatory response
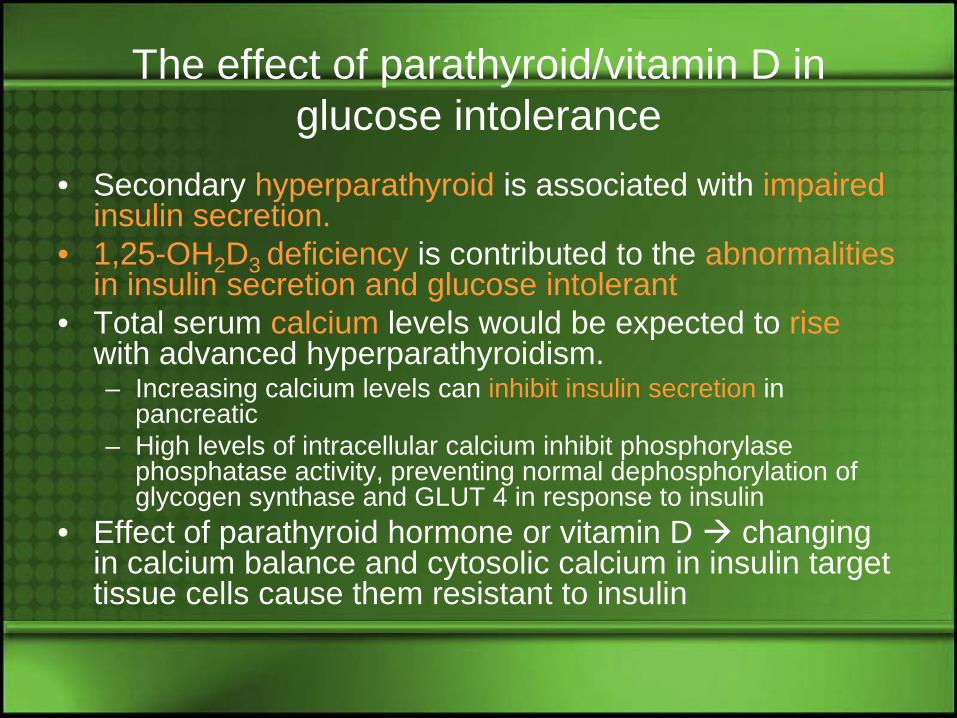
The effect of parathyroid/vitamin D in glucose intolerance
• Secondary hyperparathyroid is associated with impaired insulin secretion.
• 1,25-OH2D3 deficiency is contributed to the abnormalities in insulin secretion and glucose intolerant
• Total serum calcium levels would be expected to rise with advanced hyperparathyroidism. – Increasing calcium levels can inhibit insulin secretion in
pancreatic – High levels of intracellular calcium inhibit phosphorylase
phosphatase activity, preventing normal dephosphorylation of glycogen synthase and GLUT 4 in response to insulin
• Effect of parathyroid hormone or vitamin D changing in calcium balance and cytosolic calcium in insulin target tissue cells cause them resistant to insulin

Altered carbohydrate metabolism
PERIPHERAL INSULIN RESISTANCE Defects in glucose uptake by dependent
insulin tissue
HYPOGLYCEMIA

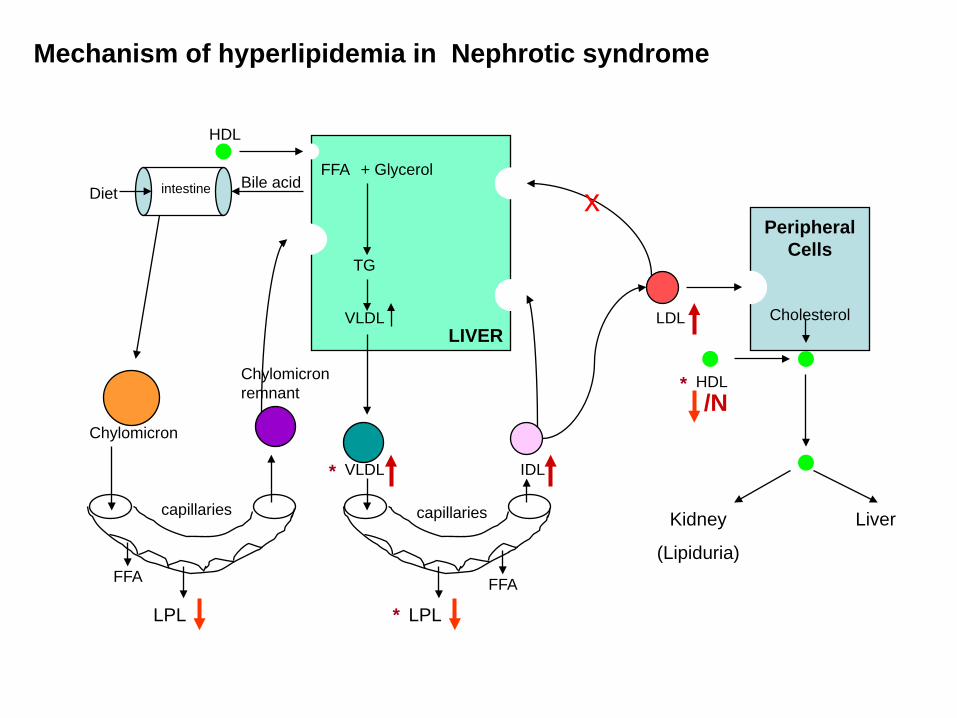
Mechanism of hyperlipidemia in Nephrotic syndrome
FFA + Glycerol
TG
VLDLLIVER
capillaries
LPL
VLDL IDL
LDL
intestine
capillaries
Chylomicron
HDL
LPL
Chylomicron remnant
PeripheralCells
Cholesterol
x
HDL
Kidney
(Lipiduria)
Liver
DietBile acid
FFA FFA
/N
*
*
*

FFA + Glycerol
TG
VLDL
LIVER
capillaries
LPL
VLDL IDL LDL
Delayed catabolism of TG rich lipoprotein resulting in increased concentrations of apoB containing triglyceride-rich lipoproteins in VLDL and IDL and reduced levels of HDL
Mechanism of hyperlipidemia in CRF
PeripheralCells
Cholesterol
HDLHDL
Liver
FFA*

Renalabnormality
Chylomicron remnants
VLDL IDL LDL HDL Lp(a)
Nephrotic syndrome -- ↑ ↑↑ ↑↑↑ N -- ↓ ↑↑↑
CRF -- ↑ ↑ ↑ ↓ ↑
Hemodialysis ↑↑ ↑↑ ↑↑ ↓ ↓ ↑↑
CAPD ? ↑ ↑↑ ↑ ↔ ↑↑↑
Transplantation -- ↑ -- ↑ ↔ ↔
Atherogenicity + + +++ +++ Protective ++
CAPD : continuous ambulatory peritoneal dialysis Nutritional Management of Renal Disease, 1997
COMMON LIPOPROTEIN ABNORMALITIES IN RENAL DISEASE

ESPEN GUIDELINES ON ENTERAL NUTRITION:
ADULT RENAL FAILURE (www.espen,org)

Nutritional problems
• Poor appetite (anorexia) due to renal failure and concurrent illness
• Hypercatabolism due to underlying illness such as severe infection/sepsis, burns, or postoperative healing
• Malnutrition, wasting, cachexia.

InflammationNutrient losses during dialysisMetabolic acidemiaComorbidityLow nutrient intake
Anorexia induced byInadequate clearance of anorexigensImpaired gastric emptyingIncreased leptin levelsComorbid illnesses
Superimposed illness leading toAltered gastrointestinal motilityAltered digestive or absorptive processes
Endocrine disorders of uremiaResistance to insulinResistance to IGF-1 and GHHyperparathyroidHyperglucagonemiaHypotestosteronemia
Blood lossOccult GIT bleedingVenipunctureSequestrian in hemodialyzer

Goal of nutrition therapy– To prevent malnutrition at an early stage of
renal disease and/or to maintain an optimal nutritional status
– To manage the metabolic disorders– To control the accumulation of waste products– To prevent cardio-vascular disease by
treating hyperlipidemia– To prevent bone disease by treating vitamin D
deficiencies and hyperparathyroidism– To retard progression of renal dysfunction


Acute renal failureEspen Guidelines, Clinical Nutrition, 2006
Macronutrients Requirements are not so much determined by:– Severity of underlying disease– The type and intensity of extracorporeal renal replacement therapy– Nutritional status – Associated complications (the extent of catabolism)
• Energy : 20 – 30 kcal/kg IBW/d• Carbohydrate : 3-5 (max 7) g/kgBW/d• Fat : 0.8 – 1.2 (max 1.5) g/kgBW/d• Protein (EAA + NEAA) :
– Conservative therapy : 0.6 – 0.8 (max 1.0) g/kgBW/d– Extracorporeal therapy : 1.0 – 1.5 g/kgBW/d– CCRT, in hypercatabolism: up to maximum 1.7g/kgBW/d
CRRT (continuous renal replacement therapies)

Micronutrients and Vitamins Recommendation in ARFEspen Guidelines, Clinical Nutrition 2000
Vitamins• Water soluble vitamins
– Riboflavin, thiamine, pyridoxine (5mg/d predialysis or 10 mg dialysis), B12
– vitamin C < 50 mg• Fat soluble vitamins
– Vitamin A, E, K are not recommended– Low doses of 1,25(OH)2D3 0.25 µg/d or every second day
Minerals• Phosphorus : 5 – 10 mg/kg/d (limiting phosphorus food : dairy
products, egg yolks, meat)• Calcium : <2 – 2.5 g/d including binder load• Iron : supplementation might be necessary in patients on VLPD or
patients with long term vegetarian dietsTrace elements• Routine supplementation with trace elements is not recommended :
zinc, selenium, copper, aluminum.


Chronic renal failureEspen Guidelines, Clinical Nutrition, 2006
• Energy : 35 kcal/kgIBW/d• Fat : < 30% total calories (saturated fat <10%
total cal, cholesterol < 300 mg/d)• Carbohydrate : simple sugars < 10%• Protein:
GFR (ml/min) ESPEN (g/kgBW/d) NKF(g/kgBW/d)25 – 70 0.55 – 0.6* (2/3 HBV) -
<25 0.55 – 0.6 (2/3 HBV) or 0.60 or o.75 (intolerance energy intake)
0.28 + EAA + KA
CONSERVATIVE THERAPY
* Depending of physical activity, lean body mass, age, gender, degree of malnutrition etc

Chronic renal failureEspen Guidelines, Clinical Nutrition, 2006
Phosphate 600-1000 mg/d
Potassium 1500-2000 mg/d
Sodium 1.8-2.5 g/d
Fluid Not limited
MINERAL REQUIREMENT
* Depending of physical activity, lean body mass, age, gender, degree of malnutrition etc


Haemodialysis and CAPD
ESPEN NKF
Protein (g/kgBW/d)
Haemodialysis 1.2 – 1.4 (>50%HBV) 1.2 (>50%HBV)
CAPD 1.2 – 1.5 (>50%HBV) 1.2 – 1.3 (>50%HBV)
Energy (kcal/kgBW/d)
Haemodialysis 35 < 60 yr 35
CAPD < 60 yr 30

Haemodialysis and CAPD
Phosphate (mg/d) 800 – 1000*
Potassium (mg/d) 2000 – 2500*
Sodium (g/d) 1.8 – 2.5*
Fluid (mL) 1000 + urine volume
* Individual requirements may differ in acute condition

Haemodialysis and CAPDFolic acid 1 mg/d
Pyridoxin 10 – 20 mg/d
Vitamin C 3 – 60 mg/d
Vitamin D Should be given according to serum calcium, phosphorus and PTH levels
Zn* 15 m/d
Se* 50 – 70 μg/d
* In depleted patient


Nutritional Recommendation for Nephrotic SyndromeEspen Guidelines, Clinical Nutrition 2000
Nutrition therapy and pathophysiology 2007
• Energy : 35 kcal/kg/day• Protein: 0.8 mg/kgBW/day
– >1.5 mg/kgBW/d ↑ proteinuria(soy and flaxseed based proteins may be beneficial in reducing proteinuria)
– 50 – 60% HBV • Lipid: cholesterol lowering diets
– 25 – 30% of total calories• Saturated diet : < 7%• PUFA : > 10%• MUFA : > 20%• Cholesterol : 200 mg/day• Fiber : 25 – 30g/day
• Sodium : 3 g/d• Fluids : generally not restricted• Vitamin: vitamin D if vitamin D• Minerals : Zn and Fe if proven deficient, Calcium (<2 – 2.5g/d)
